

Change in Alcohol Use during the Prolonged COVID-19 Pandemic and Its Psychosocial Factors: A One-Year Longitudinal Study in Japan

Abstract
1. Introduction
2. Materials and Methods
2.1. Participants and Data Collection
2.2. Measurements
2.2.1. Sociodemographic Characteristics
2.2.2. Alcohol Use
2.2.3. Psychological Distress
2.2.4. Depression Symptoms
2.2.5. Anxiety
2.2.6. Loneliness
2.2.7. Social Isolation
2.2.8. COVID-19-Related Lifestyle Changes, Coping Behavior, and Stressors
2.3. Statistical Analysis
3. Results
3.1. Descriptive Statistics
3.2. Differences in the AUDIT Scores, Psychological Indexes, and COVID-19 Pandemic-Related Variables between Each Phase
3.3. Differences in the Sociodemographic Characteristics between the Three AUDIT Groups in Each Phase
3.4. Differences and Interactions between the Phases and AUDIT Groups for the Psychological Indexes and COVID-19 Pandemic-Related Variables
3.5. Psychosocial Factors Relating to Hazardous Alcohol Use and Potential Alcoholism a Year Later
4. Discussion
4.1. Comparisons by Sociodemographic Characteristics
4.2. Comparisons of the COVID-19 Pandemic-Related Variables and Psychological Indexes between the Phases
4.3. Interactions between the AUDIT Groups and Phases
4.4. Predictors of Alcohol-Related Problems One Year Later
4.5. Limitations of the Study
5. Conclusions
Author Contributions
Funding
Institutional Review Board Statement
Informed Consent Statement
Data Availability Statement
Conflicts of Interest
References
- World Health Organization (WHO). Coronavirus Disease (COVID-19) Situation [Report]. Available online: https://apps.who.int/iris/handle/10665/333573 (accessed on 10 February 2023).
- Liu, X.; Zhu, M.; Zhang, R.; Zhang, J.; Zhang, C.; Liu, P.; Feng, Z.; Chen, Z. Public mental health problems during COVID-19 pandemic: A large-scale meta-analysis of the evidence. Transl. Psychiatry 2021, 11, 384. [Google Scholar] [CrossRef] [PubMed]
- Prati, G.; Mancini, A.D. The psychological impact of COVID-19 pandemic lockdowns: A review and meta-analysis of longitudinal studies and natural experiments. Psychol. Med. 2021, 51, 201–211. [Google Scholar] [CrossRef] [PubMed]
- Avena, N.M.; Simkus, J.; Lewandowski, A.; Gold, M.S.; Potenza, M.N. Substance use disorders and behavioral addictions during the COVID-19 pandemic and COVID-19-related restrictions. Front. Psychiatry 2021, 12, 653674. [Google Scholar] [CrossRef] [PubMed]
- Bakaloudi, D.R.; Jeyakumar, D.T.; Jayawardena, R.; Chourdakis, M. The impact of COVID-19 lockdown on snacking habits, fast-food and alcohol consumption: A systematic review of the evidence. Clin. Nutr. 2021, 41, 3038–3045. [Google Scholar] [CrossRef]
- Hermosillo-de-la-Torre, A.E.; Arteaga-de-Luna, S.M.; Acevedo-Rojas, D.L.; Juárez-Loya, A.; Jiménez-Tapia, J.A.; Pedroza-Cabrera, F.J.; González-Forteza, C.; Cano, M.; Wagner, F.A. Psychosocial correlates of suicidal behavior among adolescents under confinement due to the COVID-19 pandemic in Aguascalientes, Mexico: A cross-sectional population survey. Int. J. Environ. Res. Public Health 2021, 18, 4977. [Google Scholar] [CrossRef]
- Singh, B.; Jain, S.; Rastogi, A. Effects of nationwide COVID-19 lockdown on lifestyle and diet: An Indian survey. J. Fam. Med. Prim. Care 2021, 10, 1246–1250. [Google Scholar] [CrossRef]
- Schimmel, J.; Vargas-Torres, C.; Genes, N.; Probst, M.A.; Manini, A.F. Changes in alcohol-related hospital visits during COVID-19 in New York City. Addiction 2021, 116, 3525–3530. [Google Scholar] [CrossRef]
- Winkler, P.; Mohrova, Z.; Mlada, K.; Kuklova, M.; Kagstrom, A.; Mohr, P.; Formanek, T. Prevalence of current mental disorders before and during the second wave of COVID-19 pandemic: An analysis of repeated nationwide cross-sectional surveys. J. Psychiatr. Res. 2021, 139, 167–171. [Google Scholar] [CrossRef]
- Eastman, M.R.; Finlay, J.M.; Kobayashi, L.C. Alcohol use and mental health among older American adults during the early months of the COVID-19 pandemic. Int. J. Environ. Res. Public Health 2021, 18, 4222. [Google Scholar] [CrossRef]
- Zhang, X.; Oluyomi, A.; Woodard, L.; Raza, S.A.; Adel Fahmideh, M.; El-Mubasher, O.; Byun, J.; Han, Y.; Amos, C.I.; Badr, H. Individual-level determinants of lifestyle behavioral changes during COVID-19 lockdown in the United States: Results of an online survey. Int. J. Environ. Res. Public Health 2021, 18, 4364. [Google Scholar] [CrossRef]
- Rossow, I.; Bye, E.K.; Moan, I.S.; Kilian, C.; Bramness, J.G. Changes in alcohol consumption during the COVID-19 Pandemic-Small change in total consumption, but increase in proportion of heavy drinkers. Int. J. Environ. Res. Public Health 2021, 18, 4231. [Google Scholar] [CrossRef] [PubMed]
- Rossow, I.; Bartak, M.; Bloomfield, K.; Braddick, F.; Bye, E.K.; Kilian, C.; López-Pelayo, H.; Mäkelä, P.; Moan, I.S.; Moskalewicz, J.; et al. Changes in alcohol consumption during the COVID-19 pandemic are dependent on initial consumption level: Findings from eight European countries. Int. J. Environ. Res. Public Health 2021, 18, 10547. [Google Scholar] [CrossRef] [PubMed]
- Shield, K.; Manthey, J.; Rylett, M.; Probst, C.; Wettlaufer, A.; Parry, C.D.H.; Rehm, J. National, regional, and global burdens of disease from 2000 to 2016 attributable to alcohol use: A comparative risk assessment study. Lancet Public Health 2020, 5, e51–e61. [Google Scholar] [CrossRef]
- Yamamoto, T.; Uchiumi, C.; Suzuki, N.; Yoshimoto, J.; Murillo-Rodriguez, E. The psychological impact of “mild lockdown” in Japan during the COVID-19 pandemic: A nationwide survey under a declared state of emergency. Int. J. Environ. Res. Public Health 2020, 17, 9382. [Google Scholar] [CrossRef]
- Huo, Y.; Lim, C.; Chiu, V.; Tachimori, H.; Leung, J. Psychological Distress and the Experience of Self-Restrained Lifestyle through COVID-19 in Japan—Public Insights from #Coronavirus-Depression on Twitter. In Proceedings of the 3rd International Electron Conference on Environmental Research and Public Health—Public Health Issues in the Context of the COVID-19 Pandemic, Online, 11–25 January 2021. [Google Scholar]
- Sugaya, N.; Yamamoto, T.; Suzuki, N.; Uchiumi, C. The transition of social isolation and related psychological factors in 2 mild lockdown periods during the COVID-19 pandemic in Japan: Longitudinal survey study. JMIR Public Health Surveill. 2022, 8, e32694. [Google Scholar] [CrossRef]
- Yamamoto, T.; Uchiumi, C.; Suzuki, N.; Sugaya, N.; Murillo-Rodriguez, E.; Machado, S.; Imperatori, C.; Budde, H. Mental health and social isolation under repeated mild lockdowns in Japan. Sci. Rep. 2022, 12, 8452. [Google Scholar] [CrossRef] [PubMed]
- Kinjo, A.; Osaki, Y.; Kuwabara, Y. Josei no Arukoru Shiyo to Koshueiseishisaku no Genjo. J. Jpn. Soc. Alcohol Relat. Probl. 2019, 21, 13318. [Google Scholar]
- Sugaya, N.; Yamamoto, T.; Suzuki, N.; Uchiumi, C. Alcohol use and its related psychosocial effects during the prolonged COVID-19 pandemic in Japan: A cross-sectional survey. Int. J. Environ. Res. Public Health 2021, 18, 13318. [Google Scholar] [CrossRef]
- Sato, K.; Kobayashi, S.; Yamaguchi, M.; Sakata, R.; Sasaki, Y.; Murayama, C.; Kondo, N. Working from home and dietary changes during the COVID-19 pandemic: A longitudinal study of health app (calo mama) users. Appetite 2021, 165, 105323. [Google Scholar] [CrossRef]
- Hiro, H.; Shima, S. Availability of the Alcohol Use Disorders Identification Test (AUDIT) for a complete health examination in Japan. Nihon Arukoru Yakubutsu Igakkai Zasshi 1996, 31, 437–450. [Google Scholar]
- World Health Organization. AUDIT: The Alcohol Use Disorders Identification Test: Guidelines for Use in Primary Healthcare; World Health Organization: Geneva, Switzerland, 2001. [Google Scholar]
- Japanese Ministry of Health, Labour and Welfare. Standard Health Checkups and Health Guidance Program. 2018. Available online: https://www.mhlw.go.jp/file/06-Seisakujouhou-10900000-Kenkoukyoku/00_3.pdf (accessed on 17 November 2022).
- Osaki, Y.; Kinjo, A.; Higuchi, S.; Matsumoto, H.; Yuzuriha, T.; Horie, Y.; Kimura, M.; Kanda, H.; Yoshimoto, H. Prevalence and trends in alcohol dependence and alcohol use disorders in Japanese adults; results from periodical nationwide surveys. Alcohol 2016, 51, 465–473. [Google Scholar] [CrossRef] [PubMed]
- Furukawa, T.A.; Kessler, R.C.; Slade, T.; Andrews, G. The performance of the K6 and K10 screening scales for psychological distress in the Australian national survey of mental health and well-being. Psychol. Med. 2003, 33, 357–362. [Google Scholar] [CrossRef] [PubMed]
- Kessler, R.C.; Barker, P.R.; Colpe, L.J.; Epstein, J.F.; Gfroerer, J.C.; Hiripi, E.; Howes, M.J.; Normand, S.L.; Manderscheid, R.W.; Walters, E.E.; et al. Screening for serious mental illness in the general population. Arch. Gen. Psychiatry 2003, 60, 184–189. [Google Scholar] [CrossRef] [PubMed]
- Veldhuizen, S.; Cairney, J.; Kurdyak, P.; Streiner, D.L. The sensitivity of the K6 as a screen for any disorder in community mental health surveys: A cautionary note. Can. J. Psychiatry 2007, 52, 256–259. [Google Scholar] [CrossRef] [PubMed]
- Prochaska, J.J.; Sung, H.Y.; Max, W.; Shi, Y.; Ong, M. Validity study of the K6 scale as a measure of moderate mental distress based on mental health treatment need and utilization. Int. J. Methods Psychiatr. Res. 2012, 21, 88–97. [Google Scholar] [CrossRef]
- Kessler, R.C.; Galea, S.; Gruber, M.J.; Sampson, N.A.; Ursano, R.J.; Wessely, S. Trends in mental illness and suicidality after Hurricane Katrina. Mol. Psychiatry 2008, 13, 374–384. [Google Scholar] [CrossRef]
- Muramatsu, K.; Miyaoka, H.; Kamijima, K.; Muramatsu, Y.; Tanaka, Y.; Hosaka, M.; Miwa, Y.; Fuse, K.; Yoshimine, F.; Mashima, I.; et al. Performance of the Japanese version of the patient health Questionnaire-9 (J-PHQ-9) for depression in primary care. Gen. Hosp. Psychiatry 2018, 52, 64–69. [Google Scholar] [CrossRef]
- Kroenke, K.; Spitzer, R.L.; Williams, J.B. The PHQ-9: Validity of a brief depression severity measure. J. Gen. Intern. Med. 2001, 16, 606–613. [Google Scholar] [CrossRef]
- Muramatsu, K.; Miyaoka, H.; Ueshima, K.; Muramatsu, Y.; Fuse, K.; Yoshimine, F.; Hosaka, M.; Kutsumi, R.; Majima, I.; Katagiri, A.; et al. Validation and utility of a Japanese version of the GAD-7. Jpn. J. Psychosom. Med. 2010, 50, 166. [Google Scholar]
- Spitzer, R.L.; Kroenke, K.; Williams, J.B.; Löwe, B. A brief measure for assessing generalized anxiety disorder: The GAD-7. Arch. Intern. Med. 2006, 166, 1092–1097. [Google Scholar] [CrossRef]
- Arimoto, A.; Tadaka, E. Reliability and validity of Japanese versions of the UCLA loneliness scale version 3 for use among mothers with infants and toddlers: A cross-sectional study. BMC Women’s Health 2019, 19, 105. [Google Scholar] [CrossRef]
- Russell, D.W. UCLA Loneliness Scale (Version 3): Reliability, validity, and factor structure. J. Pers. Assess. 1996, 66, 20–40. [Google Scholar] [CrossRef] [PubMed]
- Kurimoto, A.; Awata, S.; Ohkubo, T.; Tsubota-Utsugi, M.; Asayama, K.; Takahashi, K.; Suenaga, K.; Satoh, H.; Imai, Y. Reliability and validity of the Japanese version of the abbreviated Lubben social network scale. Nihon Ronen Igakkai Zasshi 2011, 48, 149–157. [Google Scholar] [CrossRef] [PubMed]
- Lubben, J.E.; Blozik, E.; Gillmann, G.; Iliffe, S.; von Renteln Kruse, W.R.; Beck, J.C.; Stuck, A.E. Performance of an abbreviated version of the Lubben social network scale among three European Community-dwelling older adult populations. Gerontologist 2006, 46, 503–513. [Google Scholar] [CrossRef] [PubMed]
- Ahorsu, D.K.; Lin, C.Y.; Imani, V.; Saffari, M.; Griffiths, M.D.; Pakpour, A.H. The fear of COVID-19 scale: Development and initial validation. Int. J. Ment. Health Addict. 2020, 27, 1537–1545. [Google Scholar] [CrossRef] [PubMed]
- Brooks, S.K.; Webster, R.K.; Smith, L.E.; Woodland, L.; Wessely, S.; Greenberg, N.; Rubin, G.J. The psychological impact of quarantine and how to reduce it: Rapid review of the evidence. Lancet 2020, 395, 912–920. [Google Scholar] [CrossRef]
- Kisely, S.; Warren, N.; McMahon, L.; Dalais, C.; Henry, I.; Siskind, D. Occurrence, prevention, and management of the psychological effects of emerging virus outbreaks on healthcare workers: A rapid review and meta-analysis. BMJ 2020, 369, m1642. [Google Scholar] [CrossRef]
- Mazza, C.; Ricci, E.; Biondi, S.; Colasanti, M.; Ferracuti, S.; Napoli, C.; Roma, P. A nationwide survey of psychological distress among Italian people during the Covid-19 pandemic: Immediate psychological responses and associated factors. Int. J. Environ. Res. Public Health 2020, 17, 3165. [Google Scholar] [CrossRef]
- Tang, W.; Hu, T.; Hu, B.; Jin, C.; Wang, G.; Xie, C.; Chen, S.; Xu, J. Prevalence and correlates of PTSD and depressive symptoms one month after the outbreak of the COVID-19 epidemic in a sample of home-quarantined Chinese university students. J. Affect. Disord. 2020, 274, 1–7. [Google Scholar] [CrossRef]
- Kinjo, A.; Kuwabara, Y.; Minobe, R.; Maezato, H.; Kimura, M.; Higuchi, S.; Matsumoto, H.; Yuzuriha, T.; Horie, Y.; Kanda, H.; et al. Different socioeconomic backgrounds between hazardous drinking and heavy episodic drinking: Prevalence by sociodemographic factors in a Japanese general sample. Drug Alcohol Depend. 2018, 193, 55–62. [Google Scholar] [CrossRef]
- Tanaka, H. Changes in drinking habits of workers from home under COVID-19 pandemic and self-quarantine. Front. Alcohol. 2021, 9, 25–29. (In Japanese) [Google Scholar]
- Watanabe, C.; Konno, Y.; Hino, A.; Nagata, M.; Muramatsu, K.; Tateishi, S.; Tsuji, M.; Ogami, A.; Yoshimura, R.; Fujino, Y.; et al. Relationship between alcohol consumption and telecommuting preference-practice mismatch during the COVID-19 pandemic. J. Occup. Health 2022, 64, e12331. [Google Scholar] [CrossRef] [PubMed]
- Mowbray, O.; Quinn, A.; Cranford, J.A. Social networks and alcohol use disorders: Findings from a nationally representative sample. Am. J. Drug Alcohol Abus. 2014, 40, 181–186. [Google Scholar] [CrossRef] [PubMed]


| Sociodemographic Indexes at Phase 1 | N (%) in Each AUDIT Group at Phase 1 | Group Difference | N (%) in Each AUDIT Group at Phase 2 | Group Difference | ||||||||||||||
|---|---|---|---|---|---|---|---|---|---|---|---|---|---|---|---|---|---|---|
| No Problem | Hazardous Use | Potential Alcoholism | χ2 | p | Cramer’s V | No Problem | Hazardous Use | Potential Alcoholism | χ2 | p | Cramer’s V | |||||||
| Overall | 7878 | 1049 | 687 | 7785 | 1131 | 698 | ||||||||||||
| Sex | 327.29 | <0.001 | 0.185 | 383.99 | <0.001 | 0.200 | ||||||||||||
| Male | 3912 | (75.4) − | 768 | (14.8) + | 509 | (9.8) + | 3826 | (73.7) − | 846 | (16.3) + | 517 | (10.0) + | ||||||
| Female | 3966 | (89.6) + | 281 | (6.4) − | 178 | (4.0) − | 3959 | (89.5) + | 285 | (6.4) − | 181 | (4.1) − | ||||||
| Age (years) | 87.43 | <0.001 | 0.067 | 90.35 | <0.001 | 0.069 | ||||||||||||
| 20–29 | 511 | (88.0) + | 38 | (6.5) − | 32 | (5.5) | 511 | (88.0) + | 41 | (7.1) − | 29 | (5.0) − | ||||||
| 30–49 | 3437 | (84.0) + | 383 | (9.4) − | 270 | (6.6) | 3404 | (83.2) + | 391 | (9.6) − | 295 | (7.2) | ||||||
| 50–64 | 2780 | (77.9) − | 462 | (12.9) + | 327 | (9.2) + | 2736 | (76.7) − | 533 | (14.9) + | 300 | (8.4) + | ||||||
| ≥65 | 1150 | (83.7) | 166 | (12.1) | 58 | (4.2) − | 1134 | (82.5) | 166 | (12.1) | 74 | (5.4) − | ||||||
| Occupation | 128.17 | <0.001 | 0.082 | 152.42 | <0.001 | 0.089 | ||||||||||||
| Employed | 5348 | (79.4) − | 816 | (12.1) + | 570 | (8.5) + | 5258 | (78.1) − | 905 | (13.4) + | 571 | (8.5) + | ||||||
| Homemaker | 1307 | (91.5) + | 82 | (5.7) − | 40 | (2.8) − | 1309 | (91.6) + | 73 | (5.1) − | 47 | (3.3) − | ||||||
| Student | 63 | (84.0) | 7 | (9.3) | 5 | (6.7) | 63 | (84.0) | 9 | (12.0) | 3 | (4.0) | ||||||
| Unemployed | 915 | (84.6) + | 113 | (10.4) | 54 | (5.0) − | 913 | (84.4) + | 112 | (10.4) | 57 | (5.3) − | ||||||
| Other | 245 | (83.3) | 31 | (10.5) | 18 | (6.1) | 242 | (82.3) | 32 | (10.9) | 20 | (6.8) | ||||||
| Marital status | 15.61 | <0.001 | 0.040 | 9.30 | 0.010 | 0.031 | ||||||||||||
| Married | 4956 | (80.9) − | 725 | (11.8) + | 443 | (7.2) | 4903 | (80.1) − | 759 | (12.4) + | 462 | (7.5) | ||||||
| Unmarried | 2922 | (83.7) + | 324 | (9.3) − | 244 | (7.0) | 2882 | (82.6) + | 372 | (10.7) − | 236 | (6.8) | ||||||
| Presence of children | 17.18 | <0.001 | 0.042 | 13.24 | 0.001 | 0.037 | ||||||||||||
| Yes | 4384 | (80.7) − | 654 | (12.0) + | 395 | (7.3) | 4330 | (79.7) − | 683 | (12.6) + | 420 | (7.7) + | ||||||
| No | 3494 | (83.6) + | 395 | (9.4) − | 292 | (7.0) | 3455 | (82.6) + | 448 | (10.7) − | 278 | (6.6) − | ||||||
| Annual household income (JPY) | 58.64 | <0.001 | 0.062 | 66.02 | <0.001 | 0.066 | ||||||||||||
| <2.0 million | 511 | (84.5) + | 46 | (7.6) − | 48 | (7.9) | 511 | (84.5) + | 52 | (8.6) − | 42 | (6.9) | ||||||
| 2.0–3.9 million | 1483 | (84.3) + | 175 | (9.9) − | 102 | (5.8) − | 1475 | (83.8) + | 171 | (9.7) − | 114 | (6.5) − | ||||||
| 4.0–5.9 million | 1541 | (80.6) | 241 | (12.6) | 130 | (6.8) | 1526 | (79.8) | 246 | (12.9) | 140 | (7.3) | ||||||
| 6.0–7.9 million | 1119 | (80.4) | 150 | (10.8) | 122 | (8.8) | 1095 | (78.7) | 176 | (12.6) | 120 | (8.6) | ||||||
| ≥8.0 million | 1522 | (76.1) − | 296 | (14.8) + | 183 | (9.1) + | 1489 | (74.4) − | 329 | (16.4) + | 183 | (9.1) + | ||||||
| Phase 2 | |||||||
|---|---|---|---|---|---|---|---|
| Phase 1 | No Problem | Hazardous Use | Potential Alcoholism | Total | |||
| No problem | 7283 | (75.8) | 449 | (4.7) | 146 | (1.5) | 7878 (81.9) |
| Hazardous use | 383 | (4.0) | 484 | (5.0) | 182 | (1.9) | 1049 (10.9) |
| Potential alcoholism | 119 | (1.2) | 198 | (2.1) | 370 | (3.8) | 687 (7.1) |
| Total | 7785 (81.0) | 1131 (11.8) | 698 (7.3) | 9614 (100.0) | |||
| Mean (SD) | Difference between the Phases | |||||||
|---|---|---|---|---|---|---|---|---|
| Phase 1 | Phase 2 | Difference (95% CI) | p | Cohen’s d | ||||
| AUDIT | 4.20 | (5.89) | 4.26 | (5.88) | −0.06 | (−0.14, 0.03) | 0.216 | 0.009 |
| K6 | 4.11 | (5.35) | 4.09 | (5.44) | 0.02 | (−0.07, 0.12) | 0.604 | 0.005 |
| PHQ-9 | 4.10 | (5.61) | 4.00 | (5.58) | 0.10 | (0.01, 0.19) | 0.030 | 0.018 |
| GAD-7 | 3.03 | (4.52) | 2.92 | (4.41) | 0.11 | (0.04, 0.18) | 0.002 | 0.024 |
| LSNS-6 | 9.45 | (6.13) | 9.36 | (6.05) | 0.09 | (0.00, 0.18) | 0.055 | 0.015 |
| UCLA-LS3 | 24.03 | (5.85) | 24.09 | (5.87) | −0.06 | (−0.14, 0.02) | 0.123 | 0.011 |
| COVID-19 pandemic-related variables | ||||||||
| Exercise | 3.70 | (1.90) | 3.80 | (1.88) | −0.10 | (−0.14, −0.07) | <0.001 | 0.054 |
| Healthy eating habits | 4.15 | (1.61) | 4.18 | (1.61) | −0.03 | (−0.06, 0.00) | 0.025 | 0.021 |
| Healthy sleep habits | 4.66 | (1.73) | 4.67 | (1.68) | −0.02 | (−0.05, 0.02) | 0.347 | 0.010 |
| Favorite activity | 3.66 | (1.68) | 3.81 | (1.69) | −0.15 | (−0.19, −0.12) | <0.001 | 0.090 |
| Offline interaction with familiar people | 3.35 | (1.78) | 3.94 | (1.77) | −0.59 | (−0.63, −0.55) | <0.001 | 0.334 |
| Online interaction with familiar people | 2.65 | (1.74) | 2.78 | (1.78) | −0.13 | (−0.17, −0.10) | <0.001 | 0.076 |
| Continuous prevention behaviors of COVID-19 | 5.49 | (1.72) | 5.48 | (1.68) | 0.00 | (−0.03, 0.04) | 0.853 | 0.002 |
| Optimism | 4.15 | (1.55) | 4.22 | (1.54) | −0.07 | (−0.10, −0.04) | <0.001 | 0.046 |
| Deterioration of the household economy | 3.47 | (1.71) | 3.57 | (1.68) | −0.10 | (−0.14, −0.07) | <0.001 | 0.061 |
| Deterioration of the relationship with familiar people | 2.63 | (1.57) | 2.69 | (1.54) | −0.05 | (−0.09, −0.02) | 0.003 | 0.034 |
| Frustration | 3.18 | (1.72) | 3.15 | (1.66) | 0.03 | (0.00, 0.07) | 0.0497 | 0.020 |
| COVID-19-related anxiety | 3.45 | (1.67) | 3.25 | (1.61) | 0.20 | (0.17, 0.24) | <0.001 | 0.123 |
| COVID-19-related sleeplessness | 2.46 | (1.51) | 2.41 | (1.46) | 0.06 | (0.03, 0.09) | <0.001 | 0.038 |
| Difficulties owing to the lack of daily necessities | 2.55 | (1.56) | 2.49 | (1.53) | 0.06 | (0.02, 0.09) | <0.001 | 0.037 |
| Difficulties inwork or schoolwork | 2.81 | (1.70) | 2.71 | (1.65) | 0.10 | (0.06, 0.14) | <0.001 | 0.060 |
| No Problem at Phase 1 | Hazardous Use at Phase 1 | Potential Alcoholism at Phase 1 | |||||||||||||||||
|---|---|---|---|---|---|---|---|---|---|---|---|---|---|---|---|---|---|---|---|
| Phase | No Problem at Phase 2 | Hazardous Use at Phase 2 | Potential Alcoholism at Phase 2 | No Problem at Phase 2 | Hazardous Use at Phase 2 | Potential Alcoholism at Phase 2 | No Problem at Phase 2 | Hazardous Use at Phase 2 | Potential Alcoholism at Phase 2 | ||||||||||
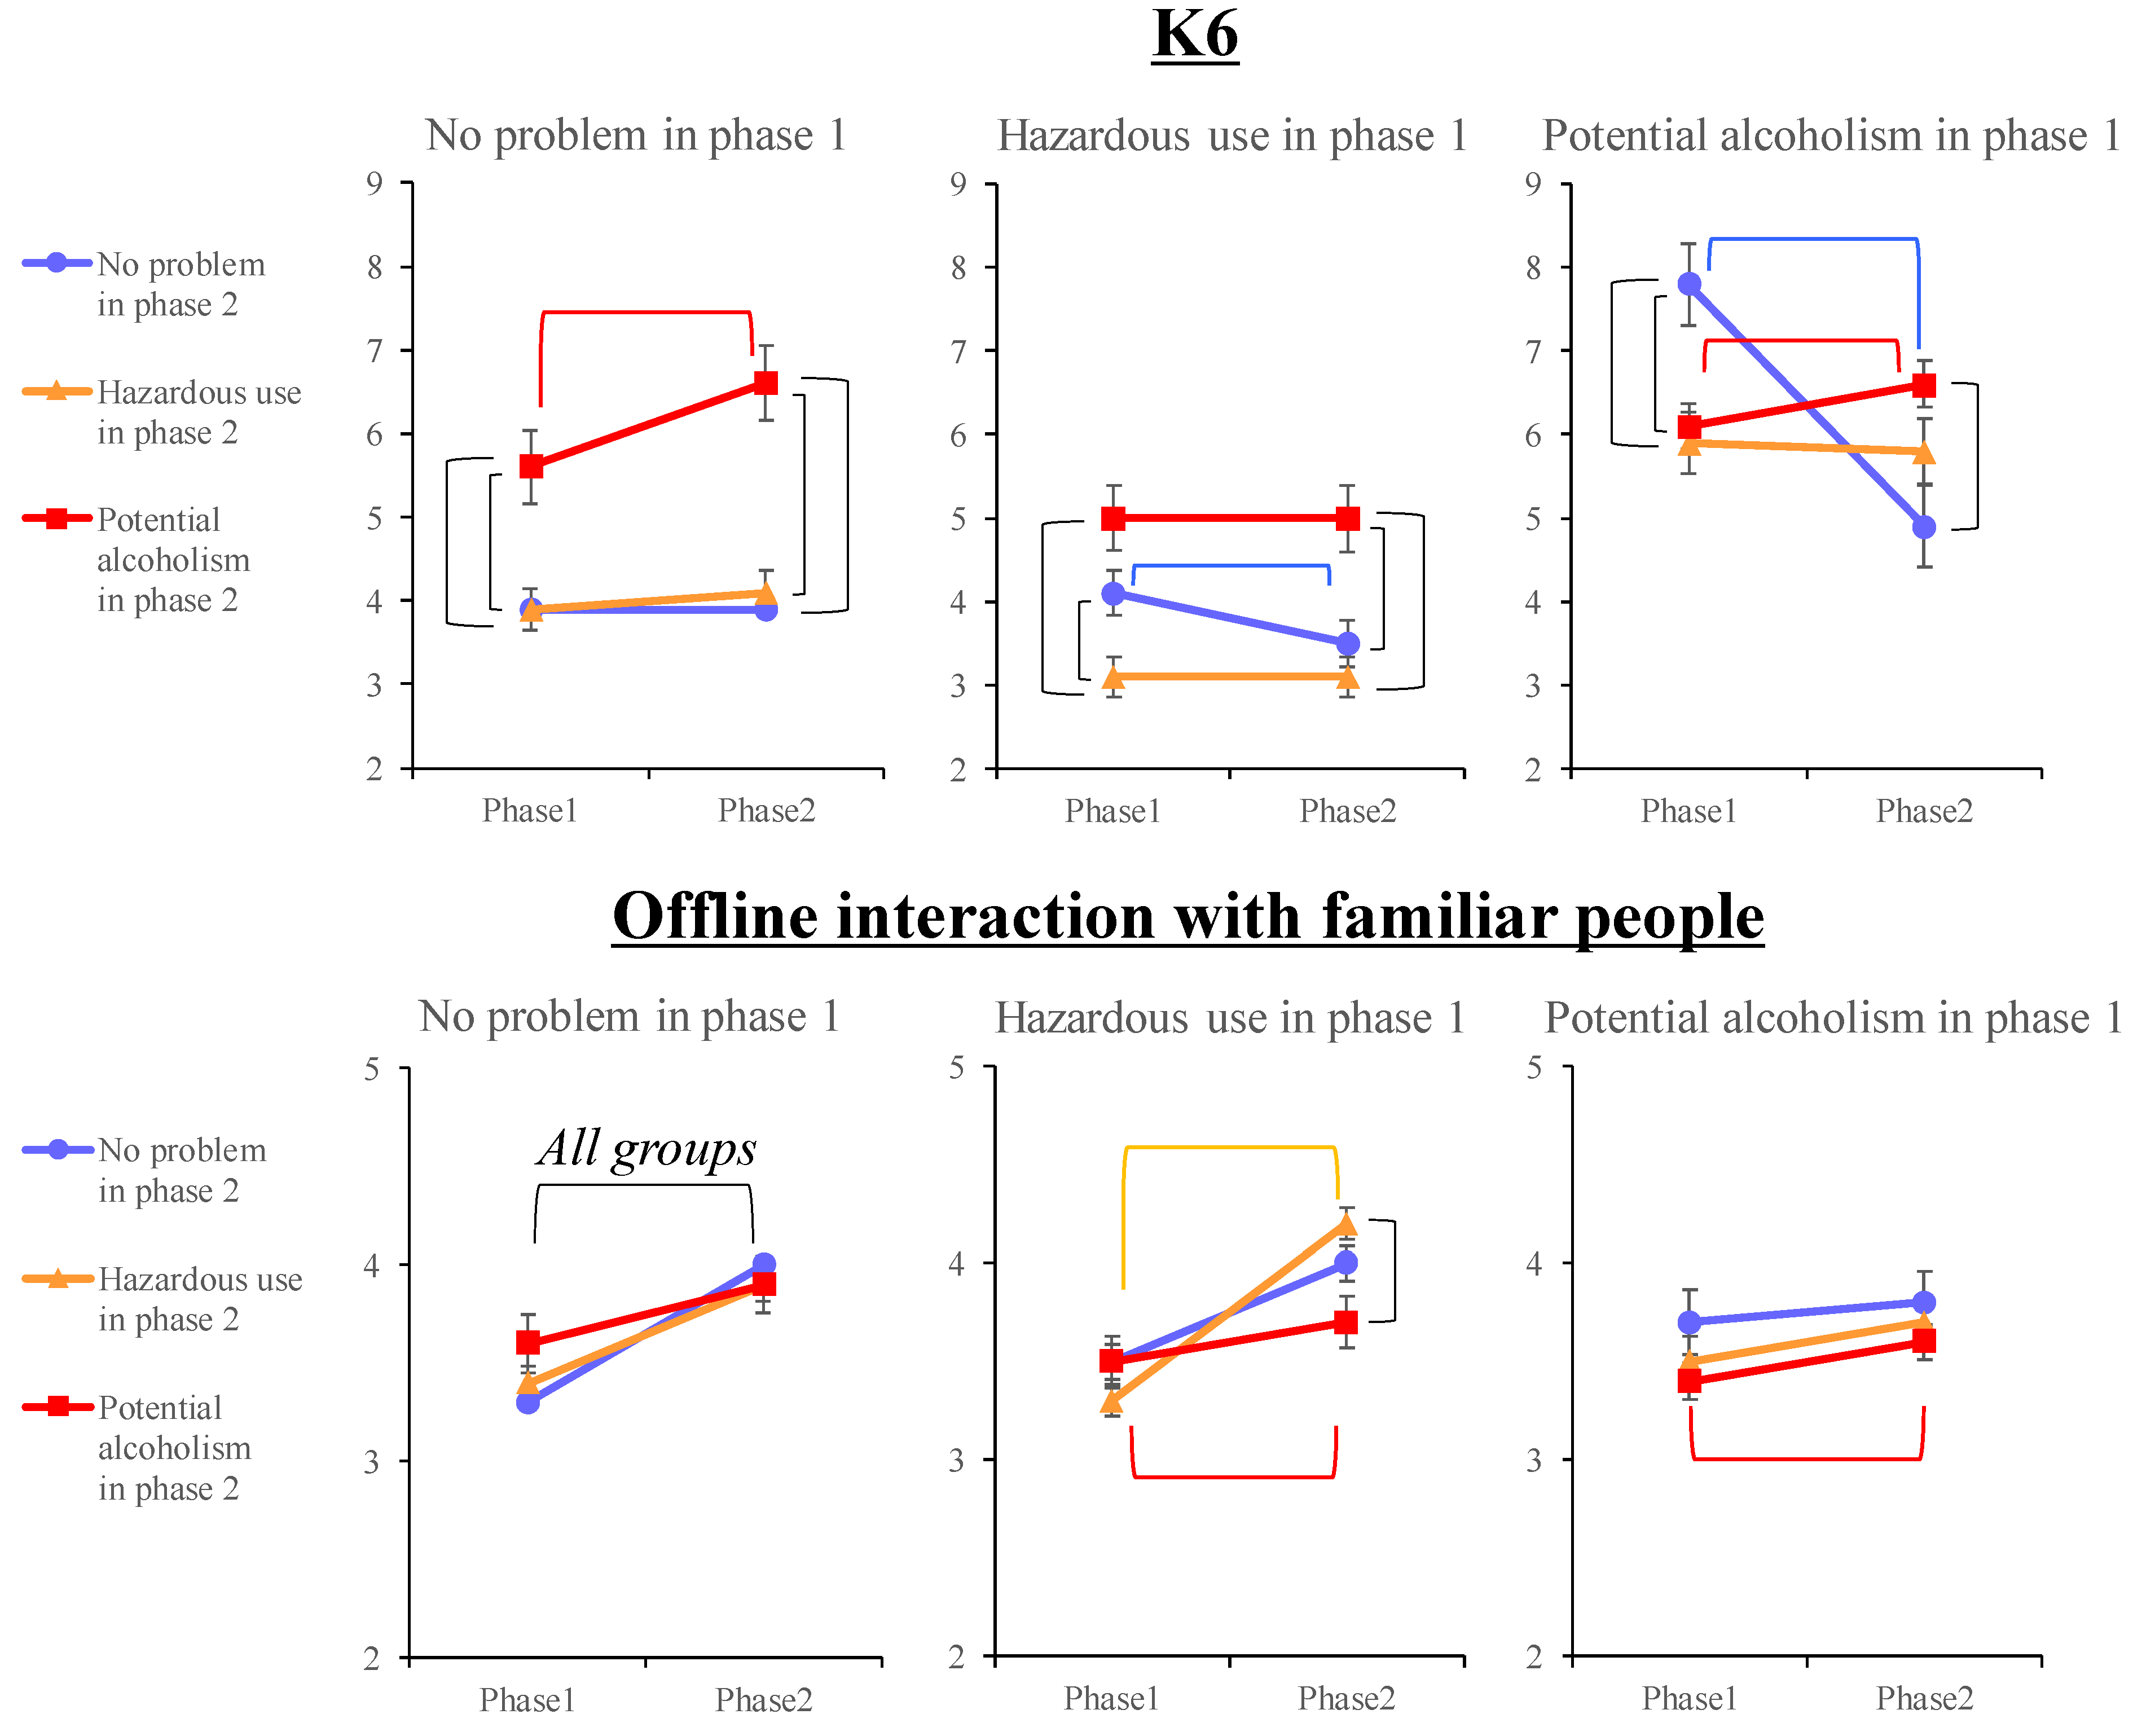
| K6 | 1 | 3.9 | (5.3) | 3.9 | (5.1) | 5.6 | (6.0) | 4.1 | (4.9) | 3.1 | (4.4) | 5.0 | (5.9) | 7.8 | (6.9) | 5.9 | (6.2) | 6.1 | (6.0) |
| 2 | 3.9 | (5.4) | 4.1 | (5.3) | 6.6 | (6.6) | 3.5 | (4.8) | 3.1 | (4.5) | 5.0 | (5.9) | 4.9 | (5.6) | 5.8 | (6.0) | 6.6 | (6.2) | |
| PHQ-9 | 1 | 3.9 | (5.5) | 3.4 | (4.8) | 5.2 | (6.3) | 4.1 | (5.5) | 3.1 | (4.6) | 5.2 | (6.2) | 8.1 | (8.1) | 6.2 | (6.8) | 6.8 | (7.0) |
| 2 | 3.7 | (5.4) | 4.2 | (5.7) | 7.1 | (7.6) | 3.4 | (4.4) | 3.1 | (4.6) | 5.4 | (6.6) | 5.8 | (6.6) | 6.1 | (7.1) | 7.0 | (7.1) | |
| GAD-7 | 1 | 2.9 | (4.4) | 2.5 | (3.9) | 4.3 | (5.3) | 2.9 | (4.1) | 2.4 | (3.8) | 3.7 | (4.8) | 6.1 | (6.6) | 4.6 | (5.3) | 5.2 | (5.8) |
| 2 | 2.7 | (4.3) | 2.7 | (4.1) | 5.4 | (5.7) | 2.5 | (3.6) | 2.3 | (3.9) | 4.0 | (5.3) | 4.4 | (5.5) | 4.3 | (5.0) | 5.3 | (5.6) | |
| UCLA-LS3 | 1 | 24.0 | (6.0) | 23.5 | (5.2) | 25.0 | (4.6) | 23.8 | (5.4) | 22.6 | (5.4) | 24.4 | (5.4) | 25.4 | (4.0) | 25.0 | (4.9) | 25.5 | (5.6) |
| 2 | 24.1 | (6.0) | 23.6 | (5.4) | 24.9 | (3.8) | 23.6 | (5.4) | 22.7 | (5.4) | 24.8 | (5.0) | 25.2 | (4.6) | 25.4 | (5.3) | 25.6 | (5.5) | |
| LSNS-6 | 1 | 9.3 | (6.1) | 10.0 | (6.2) | 9.4 | (6.3) | 10.1 | (5.8) | 10.8 | (6.5) | 10.3 | (6.6) | 8.9 | (6.7) | 9.4 | (6.2) | 9.6 | (6.4) |
| 2 | 9.2 | (6.0) | 10.1 | (6.1) | 10.1 | (6.4) | 9.8 | (5.7) | 10.6 | (6.1) | 9.5 | (6.6) | 9.2 | (6.0) | 9.3 | (6.4) | 9.1 | (6.5) | |
| COVID-19 pandemic-related variables | |||||||||||||||||||
| Exercise | 1 | 3.6 | (1.9) | 3.8 | (1.9) | 3.7 | (1.9) | 3.9 | (1.9) | 4.0 | (1.9) | 3.9 | (1.9) | 3.9 | (1.8) | 3.7 | (1.8) | 3.8 | (1.9) |
| 2 | 3.8 | (1.9) | 3.8 | (1.8) | 4.1 | (1.6) | 3.9 | (1.9) | 4.1 | (1.8) | 3.9 | (1.9) | 3.9 | (1.8) | 3.7 | (1.9) | 3.7 | (1.9) | |
| Healthy eating habits | 1 | 4.2 | (1.6) | 4.1 | (1.6) | 3.9 | (1.7) | 4.2 | (1.5) | 4.3 | (1.6) | 4.0 | (1.6) | 4.1 | (1.6) | 4.0 | (1.6) | 3.9 | (1.5) |
| 2 | 4.2 | (1.6) | 4.0 | (1.6) | 4.0 | (1.5) | 4.2 | (1.6) | 4.3 | (1.6) | 3.9 | (1.7) | 4.0 | (1.5) | 3.8 | (1.6) | 3.8 | (1.7) | |
| Healthy sleep habits | 1 | 4.7 | (1.7) | 4.6 | (1.7) | 4.1 | (1.7) | 4.7 | (1.6) | 4.7 | (1.7) | 4.6 | (1.7) | 4.2 | (1.6) | 4.2 | (1.7) | 4.1 | (1.7) |
| 2 | 4.7 | (1.7) | 4.5 | (1.7) | 4.3 | (1.6) | 4.7 | (1.6) | 4.8 | (1.7) | 4.4 | (1.7) | 4.0 | (1.6) | 4.4 | (1.6) | 4.1 | (1.8) | |
| Favorite activity | 1 | 3.7 | (1.7) | 3.6 | (1.7) | 3.6 | (1.7) | 3.8 | (1.6) | 3.9 | (1.7) | 3.7 | (1.7) | 3.8 | (1.6) | 3.6 | (1.6) | 3.6 | (1.6) |
| 2 | 3.8 | (1.7) | 3.8 | (1.6) | 4.0 | (1.5) | 3.8 | (1.6) | 4.1 | (1.6) | 3.8 | (1.7) | 3.7 | (1.6) | 3.5 | (1.6) | 3.6 | (1.7) | |
| Offline interaction with familiar people | 1 | 3.3 | (1.8) | 3.4 | (1.7) | 3.6 | (1.7) | 3.5 | (1.7) | 3.3 | (1.8) | 3.5 | (1.7) | 3.7 | (1.6) | 3.5 | (1.7) | 3.4 | (1.7) |
| 2 | 4.0 | (1.8) | 3.9 | (1.7) | 3.9 | (1.5) | 4.0 | (1.7) | 4.2 | (1.7) | 3.7 | (1.8) | 3.8 | (1.6) | 3.7 | (1.7) | 3.6 | (1.8) | |
| Online interaction with familiar people | 1 | 2.6 | (1.7) | 2.7 | (1.7) | 3.1 | (1.6) | 2.6 | (1.6) | 2.7 | (1.8) | 2.8 | (1.8) | 3.3 | (1.7) | 2.9 | (1.7) | 3.0 | (1.8) |
| 2 | 2.7 | (1.8) | 2.9 | (1.8) | 3.5 | (1.6) | 2.8 | (1.7) | 2.8 | (1.8) | 2.8 | (1.8) | 3.4 | (1.8) | 2.9 | (1.7) | 3.0 | (1.8) | |
| Continuous prevention behaviors of COVID-19 | 1 | 5.6 | (1.7) | 5.3 | (1.8) | 4.5 | (1.9) | 5.4 | (1.7) | 5.4 | (1.7) | 5.2 | (1.7) | 4.8 | (1.7) | 4.8 | (1.8) | 5.0 | (1.8) |
| 2 | 5.6 | (1.6) | 5.3 | (1.7) | 4.6 | (1.7) | 5.4 | (1.7) | 5.6 | (1.6) | 4.9 | (1.8) | 4.6 | (1.8) | 4.8 | (1.8) | 4.9 | (1.8) | |
| Optimism | 1 | 4.2 | (1.6) | 4.2 | (1.5) | 3.9 | (1.6) | 4.3 | (1.4) | 4.3 | (1.5) | 4.2 | (1.5) | 4.0 | (1.6) | 3.8 | (1.6) | 3.8 | (1.5) |
| 2 | 4.2 | (1.5) | 4.3 | (1.5) | 4.3 | (1.5) | 4.2 | (1.5) | 4.4 | (1.4) | 4.1 | (1.5) | 4.0 | (1.6) | 4.0 | (1.6) | 3.9 | (1.6) | |
| Deterioration of the household economy | 1 | 3.4 | (1.7) | 3.4 | (1.6) | 3.6 | (1.5) | 3.5 | (1.6) | 3.4 | (1.7) | 3.6 | (1.6) | 3.8 | (1.6) | 3.6 | (1.7) | 4.0 | (1.7) |
| 2 | 3.5 | (1.7) | 3.4 | (1.7) | 4.0 | (1.5) | 3.6 | (1.6) | 3.5 | (1.6) | 3.6 | (1.6) | 3.6 | (1.5) | 3.7 | (1.8) | 4.0 | (1.7) | |
| Deterioration of the relationship with familiar people | 1 | 2.6 | (1.5) | 2.7 | (1.6) | 3.2 | (1.6) | 2.8 | (1.5) | 2.5 | (1.6) | 3.0 | (1.7) | 3.6 | (1.5) | 3.1 | (1.7) | 3.2 | (1.7) |
| 2 | 2.6 | (1.5) | 2.7 | (1.5) | 3.7 | (1.5) | 2.8 | (1.5) | 2.6 | (1.5) | 2.9 | (1.6) | 3.2 | (1.4) | 3.1 | (1.6) | 3.1 | (1.6) | |
| Frustration | 1 | 3.1 | (1.7) | 3.1 | (1.7) | 3.6 | (1.6) | 3.3 | (1.6) | 3.0 | (1.7) | 3.4 | (1.7) | 4.0 | (1.6) | 3.5 | (1.7) | 3.6 | (1.7) |
| 2 | 3.1 | (1.7) | 3.1 | (1.6) | 3.8 | (1.5) | 3.2 | (1.5) | 3.0 | (1.6) | 3.3 | (1.7) | 3.7 | (1.6) | 3.4 | (1.6) | 3.6 | (1.7) | |
| COVID-19-related anxiety | 1 | 3.4 | (1.7) | 3.4 | (1.6) | 3.6 | (1.7) | 3.5 | (1.6) | 3.3 | (1.7) | 3.4 | (1.6) | 4.0 | (1.6) | 3.6 | (1.7) | 3.6 | (1.7) |
| 2 | 3.2 | (1.6) | 3.1 | (1.5) | 3.8 | (1.4) | 3.3 | (1.5) | 3.1 | (1.6) | 3.3 | (1.6) | 3.5 | (1.4) | 3.4 | (1.5) | 3.4 | (1.7) | |
| COVID-19-related sleeplessness | 1 | 2.4 | (1.5) | 2.6 | (1.5) | 3.3 | (1.5) | 2.6 | (1.5) | 2.3 | (1.4) | 2.7 | (1.6) | 3.7 | (1.7) | 3.0 | (1.6) | 2.9 | (1.6) |
| 2 | 2.3 | (1.4) | 2.6 | (1.5) | 3.6 | (1.5) | 2.5 | (1.4) | 2.2 | (1.4) | 2.7 | (1.5) | 3.1 | (1.5) | 2.9 | (1.5) | 2.8 | (1.7) | |
| Difficulties owing to the lack of daily necessities | 1 | 2.5 | (1.5) | 2.7 | (1.6) | 3.3 | (1.5) | 2.8 | (1.5) | 2.4 | (1.5) | 2.8 | (1.5) | 3.7 | (1.7) | 3.0 | (1.6) | 3.1 | (1.7) |
| 2 | 2.4 | (1.5) | 2.7 | (1.5) | 3.6 | (1.6) | 2.5 | (1.5) | 2.3 | (1.4) | 2.9 | (1.6) | 3.1 | (1.5) | 2.8 | (1.5) | 2.9 | (1.7) | |
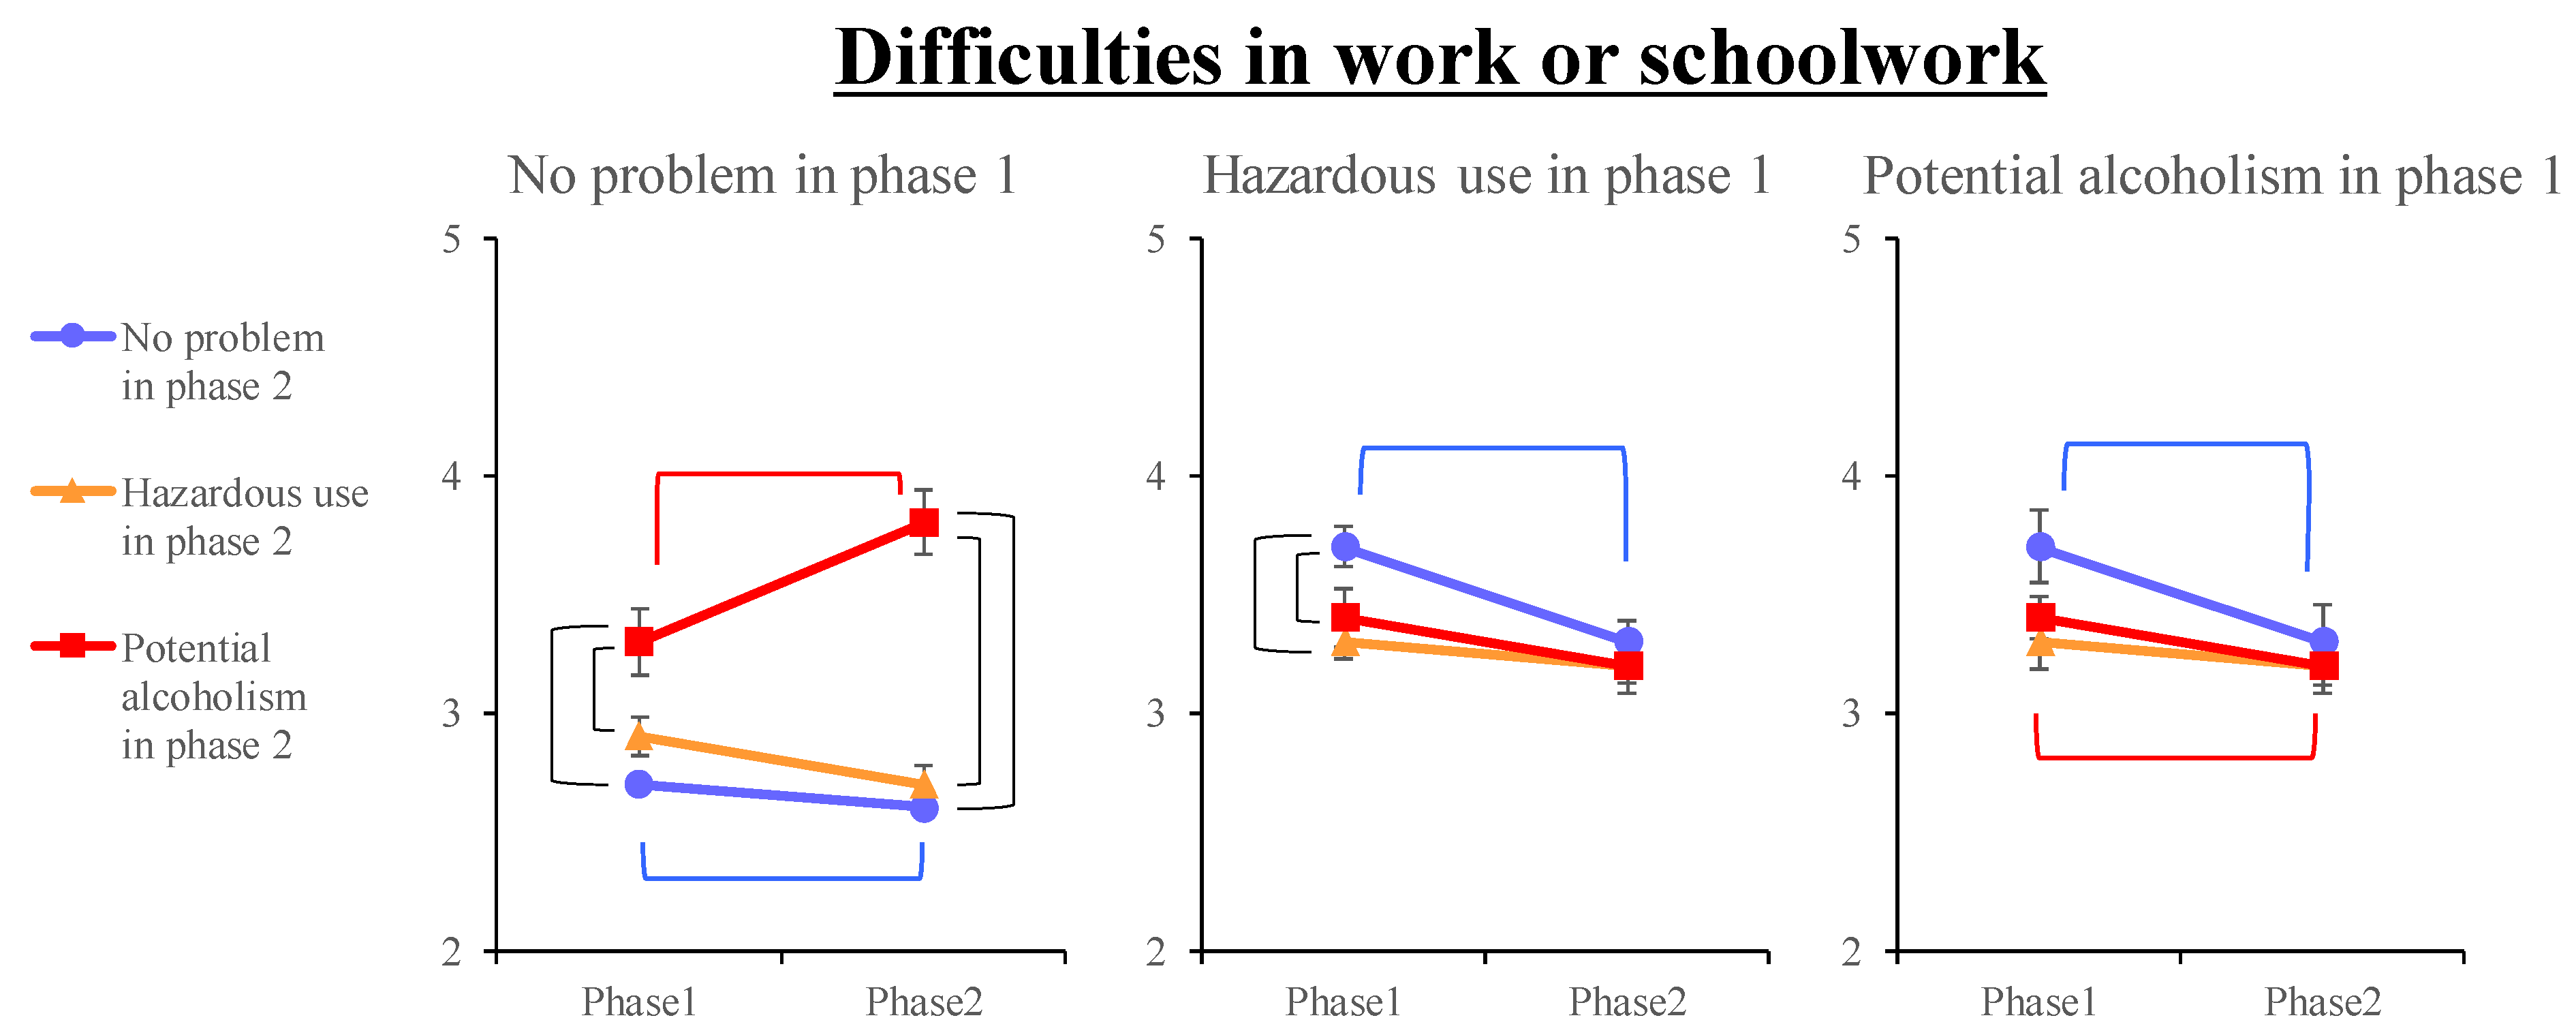
| Difficulties in work or schoolwork | 1 | 2.7 | (1.7) | 2.9 | (1.7) | 3.3 | (1.6) | 3.0 | (1.7) | 2.7 | (1.7) | 3.1 | (1.7) | 3.7 | (1.6) | 3.3 | (1.8) | 3.4 | (1.8) |
| 2 | 2.6 | (1.6) | 2.7 | (1.6) | 3.8 | (1.5) | 2.8 | (1.6) | 2.6 | (1.6) | 3.0 | (1.7) | 3.3 | (1.6) | 3.2 | (1.7) | 3.2 | (1.8) | |
| Interaction | Effect of Time | Effect of Group (Phase 1) | Effect of Group (Phase 2) | |||||||||
|---|---|---|---|---|---|---|---|---|---|---|---|---|
| F | p | ηp2 | F | p | ηp2 | F | p | ηp2 | F | p | ηp2 | |
| K6 | 6.56 | <0.001 | 0.003 | 4.79 | 0.029 | 0.000 | 36.70 | <0.001 | 0.008 | 18.51 | <0.001 | 0.004 |
| PHQ-9 | 2.31 | 0.055 | 0.001 | 0.04 | 0.842 | 0.000 | 50.04 | <0.001 | 0.010 | 23.10 | <0.001 | 0.005 |
| GAD-7 | 1.92 | 0.105 | 0.001 | 3.01 | 0.083 | 0.000 | 44.32 | <0.001 | 0.009 | 25.69 | <0.001 | 0.005 |
| UCLA-LS3 | 1.24 | 0.290 | 0.001 | 0.77 | 0.379 | 0.000 | 16.41 | <0.001 | 0.003 | 9.20 | <0.001 | 0.002 |
| LSNS-6 | 1.99 | 0.093 | 0.001 | 0.93 | 0.335 | 0.000 | 4.87 | 0.008 | 0.001 | 2.80 | 0.061 | 0.001 |
| COVID-19 pandemic-related variables | ||||||||||||
| Exercise | 1.75 | 0.137 | 0.001 | 0.93 | 0.334 | 0.000 | 2.33 | 0.099 | 0.000 | 0.03 | 0.970 | 0.000 |
| Healthy eating habits | 1.99 | 0.092 | 0.001 | 1.93 | 0.165 | 0.000 | 3.75 | 0.023 | 0.001 | 4.59 | 0.01 | 0.001 |
| Healthy sleep habits | 1.53 | 0.190 | 0.001 | 0.02 | 0.901 | 0.000 | 17.82 | <0.001 | 0.004 | 6.03 | 0.002 | 0.001 |
| Favorite activity | 0.74 | 0.566 | 0.000 | 9.28 | 0.002 | 0.001 | 4.24 | 0.014 | 0.001 | 0.49 | 0.613 | 0.000 |
| Offline interaction with familiar people | 4.25 | 0.002 | 0.002 | 84.75 | <0.001 | 0.009 | 0.59 | 0.555 | 0.000 | 0.62 | 0.538 | 0.000 |
| Online interaction with familiar people | 0.92 | 0.452 | 0.000 | 10.06 | 0.002 | 0.001 | 8.05 | <0.001 | 0.002 | 3.40 | 0.034 | 0.001 |
| Continuous prevention behaviors of COVID-19 | 1.89 | 0.108 | 0.001 | 1.85 | 0.173 | 0.000 | 21.57 | <0.001 | 0.004 | 14.08 | <0.001 | 0.003 |
| Optimism | 2.32 | 0.055 | 0.001 | 5.35 | 0.02 | 0.001 | 11.55 | <0.001 | 0.002 | 1.68 | 0.187 | 0.000 |
| Deterioration of the household economy | 2.33 | 0.054 | 0.001 | 3.65 | 0.056 | 0.000 | 3.97 | 0.019 | 0.001 | 7.99 | <0.001 | 0.002 |
| Deterioration of the relationship with familiar people | 2.17 | 0.070 | 0.001 | 0.21 | 0.650 | 0.000 | 20.85 | <0.001 | 0.004 | 16.47 | <0.001 | 0.003 |
| Frustration | 0.95 | 0.435 | 0.000 | 3.41 | 0.065 | 0.000 | 16.32 | <0.001 | 0.003 | 12.46 | <0.001 | 0.003 |
| COVID-19-related anxiety | 2.24 | 0.062 | 0.001 | 28.18 | <0.001 | 0.003 | 7.01 | <0.001 | 0.001 | 5.31 | 0.005 | 0.001 |
| COVID-19-related sleeplessness | 1.42 | 0.224 | 0.001 | 6.86 | 0.009 | 0.001 | 33.83 | <0.001 | 0.007 | 21.55 | <0.001 | 0.004 |
| Difficulties owing to the lack of daily necessities | 0.64 | 0.634 | 0.000 | 7.96 | 0.005 | 0.001 | 27.42 | <0.001 | 0.006 | 23.17 | <0.001 | 0.005 |
| Difficulties in work or schoolwork | 2.91 | 0.020 | 0.001 | 8.98 | 0.003 | 0.001 | 19.14 | <0.001 | 0.004 | 16.25 | <0.001 | 0.003 |
| Hazardous Use (Phase 2) | Potential Alcoholism (Phase 2) | |||||||||
|---|---|---|---|---|---|---|---|---|---|---|
| Predictor (Phase 1) | β (SE) | OR [95% CI] | p | β (SE) | OR [95% CI] | p | ||||
| Sex (ref: female) | ||||||||||
| Male | 0.65 | (0.10) | 1.92 | [1.59–2.32] | <0.001 | 0.66 | (0.13) | 1.93 | [1.49–2.50] | <0.001 |
| Marital status (ref: married) | ||||||||||
| Unmarried | 0.23 | (0.10) | 1.26 | [1.04–1.53] | 0.018 | 0.07 | (0.13) | 1.08 | [0.83–1.39] | 0.578 |
| Annual household income (JPY) (ref: ≥8.0 million) | ||||||||||
| 6.0–7.9 million | −0.19 | (0.12) | 0.82 | [0.65–1.04] | 0.107 | −0.08 | (0.16) | 0.93 | [0.68–1.27] | 0.636 |
| 4.0–5.9 million | −0.22 | (0.11) | 0.80 | [0.64–0.99] | 0.043 | −0.18 | (0.15) | 0.83 | [0.62–1.12] | 0.224 |
| 2.0–3.9 million | −0.48 | (0.13) | 0.62 | [0.48–0.79] | <0.001 | −0.25 | (0.17) | 0.78 | [0.56–1.08] | 0.134 |
| <2.0 million | −0.66 | (0.19) | 0.52 | [0.36–0.76] | <0.001 | −0.48 | (0.24) | 0.62 | [0.38–1.00] | 0.052 |
| AUDIT group at phase 1 (ref: no alcohol problem) | ||||||||||
| Hazardous use | 2.82 | (0.93) | 16.69 | [13.92–20.02] | <0.001 | 2.98 | (0.14) | 19.72 | [15.14–25.68] | <0.001 |
| Potential alcoholism | 4.70 | (0.14) | 23.98 | [18.17–31.64] | <0.001 | 4.70 | (0.15) | 110.24 | [82.04–148.14] | <0.001 |
| Age | 0.01 | (0.00) | 1.01 | [1.00–1.02] | 0.016 | 0.00 | (0.01) | 1.00 | [0.99–1.01] | 0.520 |
| GAD-7 | 0.00 | (0.01) | 1.00 | [0.98–1.02] | 0.904 | 0.03 | (0.01) | 1.03 | [1.00–1.05] | 0.034 |
| UCLA | −0.02 | (0.01) | 0.98 | [0.97–1.00] | 0.103 | 0.02 | (0.01) | 1.02 | [0.99–1.04] | 0.170 |
| LSNS-6 | 0.02 | (0.01) | 1.02 | [1.01–1.04] | 0.005 | 0.03 | (0.01) | 1.03 | [1.01–1.05] | 0.009 |
| Exercise | 0.00 | (0.03) | 1.00 | [0.95–1.05] | 0.954 | 0.09 | (0.04) | 1.09 | [1.01–1.17] | 0.021 |
| Healthy eating habits | −0.01 | (0.03) | 0.99 | [0.93–1.06] | 0.860 | −0.15 | (0.05) | 0.86 | [0.79–0.94] | <0.001 |
| Continuous prevention | −0.09 | (0.03) | 0.91 | [0.87–0.96] | <0.001 | −0.11 | (0.03) | 0.90 | [0.84–0.96] | 0.001 |
| Deterioration of economic status | 0.01 | (0.03) | 1.01 | [0.96–1.07] | 0.709 | 0.08 | (0.04) | 1.09 | [1.01–1.17] | 0.029 |
| COVID-19-related anxiety | 0.04 | (0.03) | 1.04 | [0.98–1.11] | 0.236 | −0.08 | (0.04) | 0.92 | [0.85–1.01] | 0.069 |
| Difficulties owing to the lack of daily necessities | 0.00 | (0.03) | 1.00 | [0.94–1.07] | 0.883 | 0.13 | (0.04) | 1.13 | [1.04–1.23] | 0.004 |
Disclaimer/Publisher’s Note: The statements, opinions and data contained in all publications are solely those of the individual author(s) and contributor(s) and not of MDPI and/or the editor(s). MDPI and/or the editor(s) disclaim responsibility for any injury to people or property resulting from any ideas, methods, instructions or products referred to in the content. |
© 2023 by the authors. Licensee MDPI, Basel, Switzerland. This article is an open access article distributed under the terms and conditions of the Creative Commons Attribution (CC BY) license (https://creativecommons.org/licenses/by/4.0/).
Share and Cite
Sugaya, N.; Yamamoto, T.; Suzuki, N.; Uchiumi, C. Change in Alcohol Use during the Prolonged COVID-19 Pandemic and Its Psychosocial Factors: A One-Year Longitudinal Study in Japan. Int. J. Environ. Res. Public Health 2023, 20, 3871. https://doi.org/10.3390/ijerph20053871
Sugaya N, Yamamoto T, Suzuki N, Uchiumi C. Change in Alcohol Use during the Prolonged COVID-19 Pandemic and Its Psychosocial Factors: A One-Year Longitudinal Study in Japan. International Journal of Environmental Research and Public Health. 2023; 20(5):3871. https://doi.org/10.3390/ijerph20053871
Chicago/Turabian StyleSugaya, Nagisa, Tetsuya Yamamoto, Naho Suzuki, and Chigusa Uchiumi. 2023. "Change in Alcohol Use during the Prolonged COVID-19 Pandemic and Its Psychosocial Factors: A One-Year Longitudinal Study in Japan" International Journal of Environmental Research and Public Health 20, no. 5: 3871. https://doi.org/10.3390/ijerph20053871
APA StyleSugaya, N., Yamamoto, T., Suzuki, N., & Uchiumi, C. (2023). Change in Alcohol Use during the Prolonged COVID-19 Pandemic and Its Psychosocial Factors: A One-Year Longitudinal Study in Japan. International Journal of Environmental Research and Public Health, 20(5), 3871. https://doi.org/10.3390/ijerph20053871