
Physical Inactivity Levels of European Adolescents in 2002, 2005, 2013, and 2017
 , , , , and
Abstract
1. Introduction
2. Materials and Methods
2.1. Design
2.2. Data Source
2.3. Measures
2.4. Statistical Analysis
3. Results
4. Discussion
5. Conclusions
Supplementary Materials
Author Contributions
Funding
Institutional Review Board Statement
Informed Consent Statement
Data Availability Statement
Conflicts of Interest
References
- World Health Organization. WHO Guidelines on Physical Activity and Sedentary Behaviour; World Health Organization: Geneva, Switzerland, 2020. [Google Scholar]
- Poitras, V.J.; Gray, C.E.; Borghese, M.M.; Carson, V.; Chaput, J.P.; Janssen, I.; Katzmarzyk, P.T.; Pate, R.R.; Girber, S.C.; Kho, M.E.; et al. Systematic review of the relationships between objectively measured physical activity and health indicators in school-aged children and youth. Appl. Physiol. Nutr. Metab. 2016, 41 (Suppl. 3), S197–S239. [Google Scholar] [CrossRef] [PubMed]
- World Health Organization. Global Action Plan on Physical Activity 2018–2030: More Active People for a Healthier World; World Health Organization: Geneva, Switzerland, 2018. [Google Scholar]
- European Commission. Report from the Commission to the European Parliament, the Council, the European Economic and Social Committee, and the Committee of the Regions on the Implementation of the Council Recommendation on Promoting Health-Enhancing Physical Activity across Sectors; European Commission: Brussels, Belgium, 2016. [Google Scholar]
- Hayes, G.; Dowd, K.P.; MacDonncha, C.; Donnelly, A.E. Tracking of physical activity and sedentary behavior from adolescence to young adulthood: A systematic literature review. J. Adolesc. Health 2019, 65, 446–454. [Google Scholar] [CrossRef] [PubMed]
- Kallio, P.; Pahkala, K.; Heinonen, O.J.; Tammelin, T.H.; Pälve, K.; Hirvensalo, M.; Juonala, M.; Loo, B.M.; Magnussen, C.G.; Rovio, S.; et al. Physical inactivity from youth to adulthood and adult cardiometabolic risk profile. Prev. Med. 2021, 145, 106433. [Google Scholar] [CrossRef] [PubMed]
- Faigenbaum, A.D.; Rebullido, T.R.; Peña, J.; Chulvi-Medrano, I. Resistance exercise for the prevention and treatment of pediatric dynapenia. J. Sci. Sport. Exerc. 2019, 1, 208–216. [Google Scholar] [CrossRef]
- Gomes, T.N.; Dos Santos, F.K.; Katzmarzyk, P.T.; Maia, J. Active and strong: Physical activity, muscular strength, and metabolic risk in children. Am. J. Hum. Biol. 2017, 29, e22904. [Google Scholar] [CrossRef]
- Walker, G.; Stracciolini, A.; Faigenbaum, A.D.; Myer, G.D. Physical inactivity in youth: Can exercise deficit disorder alter the way we view preventative care? ACSMs Health Fit. J. 2018, 22, 42–46. [Google Scholar] [CrossRef]
- Guthold, R.; Stevens, G.A.; Riley, L.M.; Bull, F.C. Global trends in insufficient physical activity among adolescents: A pooled analysis of 298 population-based surveys with 1 · 6 million participants. Lancet Child Adolesc. Health 2020, 4, 23–35. [Google Scholar] [CrossRef]
- Coppinger, T.; Milton, K.; Murtagh, E.; Harrington, D.; Johansen, D.; Seghers, J.; Skovgaard, T.; HEPA Europe Children & Youth Working Group; Chalkleyg, A. Global matrix 3.0 physical activity report card for children and youth: A comparison across europe. Public Health 2020, 187, 150–156. [Google Scholar] [CrossRef]
- Aubert, S.; Barnes, J.D.; Demchenko, I.; Hawthorne, M.; Abdeta, C.; Abi Nader, P.; Adsuar-Sala, J.C.; Aguilar-Farias, N.; Aznar, S.; Bakalar, P.; et al. Global Matrix 4.0 Physical Activity Report Card grades for children and adolescents: Results and analyses from 57 countries. J. Phys. Act. Health 2022, 19, 700–728. [Google Scholar] [CrossRef]
- World Health Organization. Regional Office for Europe. Spotlight on Adolescent Health and Well-Being. Findings from the 2017/2018 Health Behaviour in School-Aged Children (HBSC) Survey in Europe and Canada; International Report; World Health Organization, Regional Office for Europe: Copenhagen, Denmark, 2020; Volume 1, Key Findings. [Google Scholar]
- Marconcin, P.; Matos, M.G.; Ihle, A.; Ferrari, G.; Gouveia, É.R.; López-Flores, M.; Peralta, M.; Marques, A. Trends of healthy lifestyles among adolescents: An analysis of more than half a million participants from 32 countries between 2006 and 2014. Front. Pediatr. 2021, 9, 645074. [Google Scholar] [CrossRef]
- Steene-Johannessen, J.; Hansen, B.H.; Dalene, K.E.; Kolle, E.; Northstone, K.; Møller, N.C.; Grøntved, A.; Wedderkopp, N.; Kriemler, S.; Page, A.S.; et al. Variations in accelerometry measured physical activity and sedentary time across Europe–harmonized analyses of 47,497 children and adolescents. Int. J. Behav. Nutr. Phys. Act. 2020, 17, 38. [Google Scholar] [CrossRef] [PubMed]
- Santos-Silva, D.A.; Aubert, S.; Ng, K.; Morrison, S.A.; Cagas, J.Y.; Tesler, R.; Tladi, D.; Manyanga, T.; González, S.A.; Lee, E.Y.; et al. Association between physical activity indicators and Human Development Index at a national level: Information from Global Matrix 4.0 physical activity report cards for children and adolescents. J. Phys. Act. Health 2022, 19, 737–744. [Google Scholar] [CrossRef] [PubMed]
- Reilly, J.J.; Barnes, J.; Gonzalez, S.; Huang, W.Y.; Manyanga, T.; Tanaka, C.; Tremblay, M.S. Recent secular trends in child and adolescent physical activity and sedentary behavior internationally: Analyses of active healthy kids global alliance global matrices 1.0 to 4.0. Phys. Act. Health 2022, 19, 729–736. [Google Scholar] [CrossRef] [PubMed]
- Mayo, X.; Liguori, G.; Iglesias-Soler, E.; Copeland, R.J.; San Emeterio, I.C.; Lowe, A.; del Villar, F.; Jiménez, A. The active living gender’s gap challenge: 2013–2017 eurobarometers physical inactivity data show constant higher prevalence in women with no progress towards global reduction goals. BMC Public Health 2019, 19, 1677. [Google Scholar] [CrossRef] [PubMed]
- World Health Organization. Regional Office for Europe. Physical Activity Strategy for the Who European Region 2016–2025; World Health Organization, Regional Office for Europe: Copenhagen, Denmark, 2016. [Google Scholar]
- Craig, C.L.; Marshall, A.L.; Sjöström, M.; Bauman, A.E.; Booth, M.L.; Ainsworth, B.E.; Pratt, M.; Ekelund, U.; Yngve, A.; Sallis, J.; et al. International physical activity questionnaire: 12-country reliability and validity. Med. Sci. Sport. Exerc. 2003, 35, 1381–1395. [Google Scholar] [CrossRef] [PubMed]
- International Physical Activity Questionnaire. Guidelines for Data Processing and Analysis of the International Physical Activity Questionnaire (ipaq)—Short and Long Forms. IPAQ Group. 2005. Available online: https://www.researchgate.net/file.PostFileLoader.html?id=5641f4c36143250eac8b45b7&assetKey=AS%3A294237418606593%401447163075131 (accessed on 13 April 2022).
- Kim, Y.; Park, I.; Kang, M. Convergent validity of the international physical activity questionnaire (IPAQ): Meta-analysis. Public Health Nutr. 2013, 16, 440–452. [Google Scholar] [CrossRef]
- Aparicio-Ugarriza, R.; Mielgo-Ayuso, J.; Ruiz, E.; Ávila, J.M.; Aranceta-Bartrina, J.; Gil, Á.; Ortega, R.M.; Serra-Majem, L.; Varela-Moreiras, G.; González-Gross, M. Active commuting, physical activity, and sedentary behaviors in children and adolescents from Spain: Findings from the ANIBES study. Int. J. Behav. Nutr. Phys. Act. 2020, 17, 668. [Google Scholar] [CrossRef]
- Cheng, H.L. A simple, easy-to-use spreadsheet for automatic scoring of the international physical activity questionnaire (IPAQ) short form. ResearchGate 2016. [Google Scholar] [CrossRef]
- Ferrari, G.L.d.M.; Kovalskys, I.; Fisberg, M.; Gomez, G.; Rigotti, A.; Sanabria, L.Y.C.; García, M.C.Y.; Torres, R.G.P.; Herrera-Cuenca, M.; Zimberg, I.Z.; et al. Anthropometry, dietary intake, physical activity and sitting time patterns in adolescents aged 15–17 years: An international comparison in eight Latin American countries. BMC Pediatr. 2020, 20, 24. [Google Scholar] [CrossRef]
- Holstein, B.E.; Henriksen, P.E.; Krølner, R.; Rasmussen, M.; Due, P. Trends in vigorous physical activity versus physical inactivity among 11–15 year olds from 1988 to 2002. Ugeskr. Laeger 2007, 169, 37–42. [Google Scholar]
- World Health Organization. Physical Activity Factsheets for the 28 European Union Member States of the Who European Region; WHO Regional Office for Europe: Copenhagen, Denmark, 2018. [Google Scholar]
- Ruiz, J.R.; Ortega, F.B.; Martínez-Gómez, D.; Labayen, I.; Moreno, L.A.; De Bourdeaudhuij, I.; Manios, Y.; Gonzalez-Gross, M.; Mauro, B.; Molnar, D.; et al. Objectively measured physical activity and sedentary time in European adolescents: The helena study. Am. J. Epidemiol. 2011, 174, 173–184. [Google Scholar] [CrossRef] [PubMed]
- Arundell, L.; Fletcher, E.; Salmon, J.; Veitch, J.; Hinkley, T. A systematic review of the prevalence of sedentary behavior during the after-school period among children aged 5-18 years. Int. J. Behav. Nutr. Phys. Act. 2016, 13, 93. [Google Scholar] [CrossRef] [PubMed]
- López-Fernández, J.; López-Valenciano, A.; Mayo, X.; Liguori, G.; Lamb, M.A.; Copeland, R.J.; Jiménez, A. No changes in adolescent’s sedentary behaviour across Europe between 2002 and 2017. BMC Public Health 2021, 21, 784. [Google Scholar] [CrossRef] [PubMed]
- World Health Organization. Regional Office for Europe. Promoting Physical Activity in the Education Sector; World Health Organization, Regional Office for Europe: Copenhagen, Denmark, 2018. [Google Scholar]
- European Commission. Gender Equality in Sport. Proposal for Strategic Actions 2014–2020; European Commission: Brussels, Belgium, 2014. [Google Scholar]
- Pearce, G.; Bailey, R.P. Football pitches and barbie dolls: Young children’s perceptions of their school playground. Early Child Dev. Care 2011, 181, 1361–1379. [Google Scholar] [CrossRef]
- Whiting, S.; Mendes, R.; Morais, S.T.; Gelius, P.; Abu-Omar, K.; Nash, L.; Rakovac, I.; Breda, J. Promoting health-enhancing physical activity in europe: Surveillance, policy development and implementation 2015–2018. Health Policy 2021, 125, 1023–1030. [Google Scholar] [CrossRef]
- Breda, J.; Jakovljevic, J.; Rathmes, G.; Mendes, R.; Fontaine, O.; Hollmann, S.; Rütten, A.; Gelius, P.; Kahlmeier, S.; Galea, G. Promoting health-enhancing physical activity in Europe: Current state of surveillance, policy development and implementation. Health Policy 2018, 122, 519–527. [Google Scholar] [CrossRef]
- Aubert, S.; Brazo-Sayavera, J.; González, S.A.; Janssen, I.; Manyanga, T.; Oyeyemi, A.L.; Picard, P.; Sherar, L.B.; Turner, E.; Tremblay, M.S. Global prevalence of physical activity for children and adolescents; inconsistencies, research gaps, and recommendations: A narrative review. Int. J. Behav. Nutr. Phys. Act. 2021, 18, 81. [Google Scholar] [CrossRef]


| 2002 | 2005 | 2013 | 2017 | 2002–2017 | |||||||||||
|---|---|---|---|---|---|---|---|---|---|---|---|---|---|---|---|
| Sample | PIA (%) | 95% CI | Sample | PIA (%) | 95% CI | Sample | PIA (%) | 95% CI | Sample | PIA (%) | 95% CI | χ2 | p-Value | ||
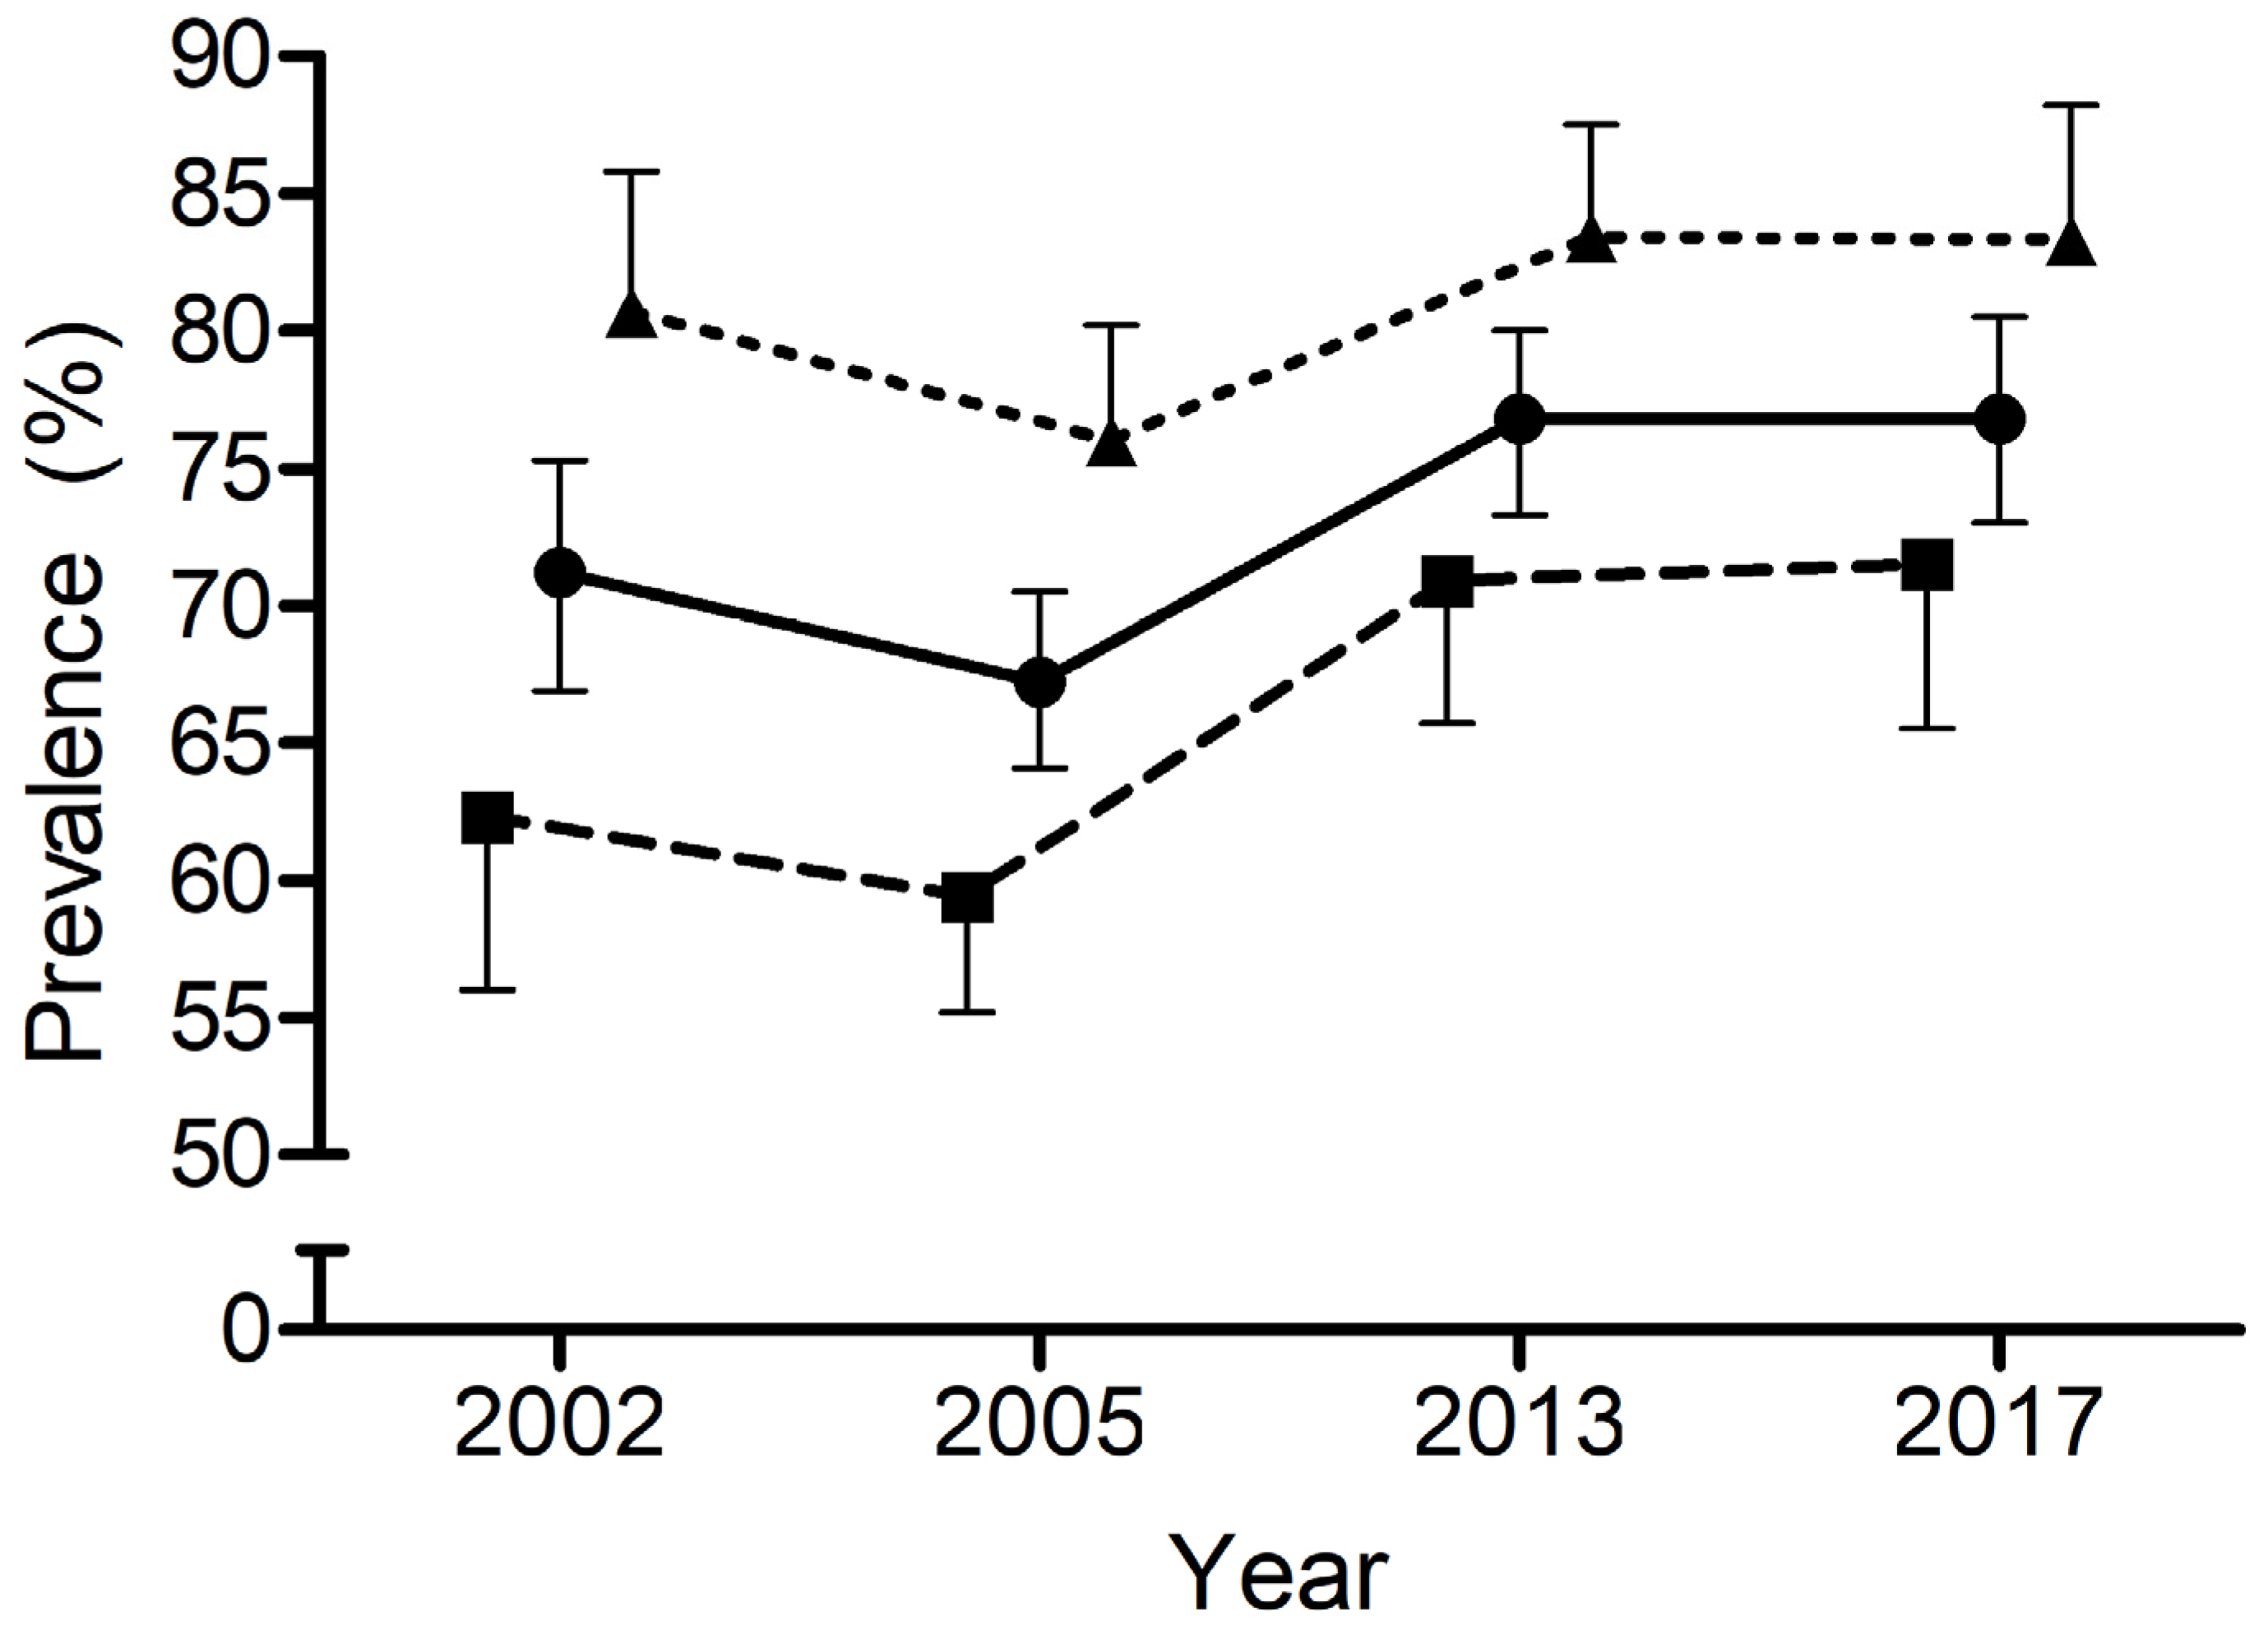
| EU total | 462 | 71.2 | 66.9–75.3 | 939 | 67.2 | 64.1–70.5 | 561 | 76.8 | 73.3–80.0 | 452 | 76.8 | 73.0–80.5 | 22,461 | <0.001 | |
| EU boys | 239 | 62.3 | 56.0–68.6 | 498 | 59.4 | 55.2–64.0 | 296 | 70.9 | 65.7–76.3 | 249 | 71.5 | 65.5–77.5 | 16,713 | 0.001 | |
| EU girls | 223 | 80.7 | 75.5–85.8 | 441 | 76.0 | 71.9–80.2 | 265 | 83.4 | 78.5–87.5 | 203 | 83.3 | 78.0–88.2 | 7796 | 0.05 | |
| Boys vs. Girls | χ2 | 18.999 | 28.979 | 12.174 | 8.680 | ||||||||||
| p-value | <0.001 | <0.001 | <0.001 | 0.003 | |||||||||||
| Z-Score | 4.359 | 5.383 | 3.489 | 2.946 | |||||||||||
| PIA levels difference | 18.40% | 16.60% | 12.50% | 11.80% | |||||||||||
Disclaimer/Publisher’s Note: The statements, opinions and data contained in all publications are solely those of the individual author(s) and contributor(s) and not of MDPI and/or the editor(s). MDPI and/or the editor(s) disclaim responsibility for any injury to people or property resulting from any ideas, methods, instructions or products referred to in the content. |
© 2023 by the authors. Licensee MDPI, Basel, Switzerland. This article is an open access article distributed under the terms and conditions of the Creative Commons Attribution (CC BY) license (https://creativecommons.org/licenses/by/4.0/).
Share and Cite
López-Fernández, J.; López-Valenciano, A.; Pearce, G.; Copeland, R.J.; Liguori, G.; Jiménez, A.; Mayo, X. Physical Inactivity Levels of European Adolescents in 2002, 2005, 2013, and 2017. Int. J. Environ. Res. Public Health 2023, 20, 3758. https://doi.org/10.3390/ijerph20043758
López-Fernández J, López-Valenciano A, Pearce G, Copeland RJ, Liguori G, Jiménez A, Mayo X. Physical Inactivity Levels of European Adolescents in 2002, 2005, 2013, and 2017. International Journal of Environmental Research and Public Health. 2023; 20(4):3758. https://doi.org/10.3390/ijerph20043758
Chicago/Turabian StyleLópez-Fernández, Jorge, Alejandro López-Valenciano, Gemma Pearce, Robert J. Copeland, Gary Liguori, Alfonso Jiménez, and Xian Mayo. 2023. "Physical Inactivity Levels of European Adolescents in 2002, 2005, 2013, and 2017" International Journal of Environmental Research and Public Health 20, no. 4: 3758. https://doi.org/10.3390/ijerph20043758
APA StyleLópez-Fernández, J., López-Valenciano, A., Pearce, G., Copeland, R. J., Liguori, G., Jiménez, A., & Mayo, X. (2023). Physical Inactivity Levels of European Adolescents in 2002, 2005, 2013, and 2017. International Journal of Environmental Research and Public Health, 20(4), 3758. https://doi.org/10.3390/ijerph20043758