1. Introduction
In recent years, with the gradual deterioration of the global ecological environment, eco-environmental protection has become a hot topic of general concern all over the world. Affected by this, the improvement of the quality of regional public health has also received general attention from all walks of life. The government plays an important role in regional public health governance [
1].
With the implementation and continuous expansion of China’s basic public health services in 2009, scholars have successively investigated the awareness rate and satisfaction of residents’ public health services around the country. Many research results show that Chinese residents’ satisfaction with public health services shows the characteristics of uneven geographical distribution [
2]. Although many achievements have been made in the construction of Chinese government efficiency, relatively speaking, empirical research on the factors affected by government efficiency is not sufficient, and most of these factors focus on the impact of regional and even national macro policy implementation, including talent gathering, innovation and entrepreneurship, business environment and other fields.
Some scholars have carried out research on the impact and role of administrative efficiency on the willingness of high-level talent agglomeration, and through empirical testing, it is found that administrative efficiency, as one of the dimensions of administrative efficiency, has a significant positive effect on high-level talent agglomeration. Government regulation mainly includes economic regulation and social regulation. Economic regulation is mainly aimed at the problem of information asymmetry in reality, preventing the irrational allocation of resources, which can ensure the fair use of demanders. Social regulation is based on the perspective of national security and public interests to implement mandatory regulation on the social environment, natural resources, security and other aspects. The influence of the government on the demand of urban community health service mainly lies in the integration of market regulation and community management through policy guidance, financial support, strengthening publicity and other strategies and methods; following the basic laws of the medical service market; doing a good job of “distribution according to demand”; and transforming the potential health service demand of urban community residents into the actual distribution demand. This is in order to maximize the utilization of urban community health service resources to better meet the needs of both supply and demand, so as to realize their macro-control role and perform their regulatory functions.
Based on the global data from 1995 to 2022, some scholars found that government efficiency has a significant positive effect on national innovation capacity. In terms of exploring the impact of government effectiveness on the individual level, the relevant empirical research is less. Among them, some scholars have systematically studied the impact and mechanism of government effectiveness on residents’ well-being. Based on the practical needs of the development of the Zhuhai government and the theory of social exchange, they used a structural equation model to discuss in detail the mechanism of a city’s government effectiveness on residents’ well-being. Thus, it reveals the positive impact of government effectiveness on residents’ well-being and further clarifies the regulatory role of urban belonging in the impact of government effectiveness on residents’ well-being, as well as the intermediary role of residents’ living conditions in this impact process [
3]. In order to achieve the fragile ecological environment, it is necessary to accurately identify the key environmental factors affecting the economic development of each province, giving full play to the role of government governance measures, and realize the benign economic development of each province.
2. Empirical Research
The relationship between the main variables in this study is shown in
Figure 1:
2.1. Research Data Sources
The data used in this study are from the 2017 national urban public security survey data in the urban public security database of the China University of Mining and Technology. In terms of the demographic characteristics of the respondents, statistics show that among all the residents who completed the questionnaire (excluding missing values), men accounted for 50.0% and women accounted for 50.0% [
4]. After removing the missing values, the basic information of all residents who filled in the questionnaire in this data survey is shown in
Table 1.
2.2. Variable Measurement
2.2.1. Exploratory Factor Analysis
Before conducting the evaluation of the index, it was necessary to determine whether the index could be used for the analysis of the index itself. This can be checked by two key indicators: the KMO value of sampling quality and the result of Bartlett’s test of sphericity [
5]. In this study, KMO and Bartlett’s tests were performed on different measures of public health satisfaction, and the results of the analysis are shown in
Table 2.
The final result of the factor analysis is shown in
Table 3. The cumulative contribution rate of the two components is 73.558%, that is, the cumulative interpretation of the total variance is 73.558%, which is greater than the 0.6 suggested by hair. The observation variables xn1, xn2, xn3 and xn4 have a high load on factor 1. As these observation variables mainly reflect the subjective perception of the surveyed urban residents on the effectiveness of government public health governance, factor 1 is named as the effectiveness factor of government public health governance [
6].
In addition, the internal quality of each aircraft model can also be checked. The internal quality of the facet can be measured and verified by the reliability and mean difference of the measured values. According to
Table 4, the average difference between the two different abilities is 0.696 and 0.558: both of them are higher than the standard 0.50, and the reliability is 0.901 and 0.790. A value of 0.60 indicates that the quality of the model is reasonable [
7].
2.2.2. Normality Test of Sample Data
In this paper, spss26.0 was used to test the normality of each variable in the data model. The results of the clinical trials are shown in
Table 5.
It can be seen that the skewness coefficients and kurtosis coefficients of all observed variables in the sample data meet the test criteria, indicating that the data conform to the characteristics of normal distribution. Therefore, we can use the structural equation model to further analyze and verify the research hypothesis [
8].
3. Current Situation of Regional Public Health Supply Structure under Government Governance
3.1. Main Structure of Public Health Supply
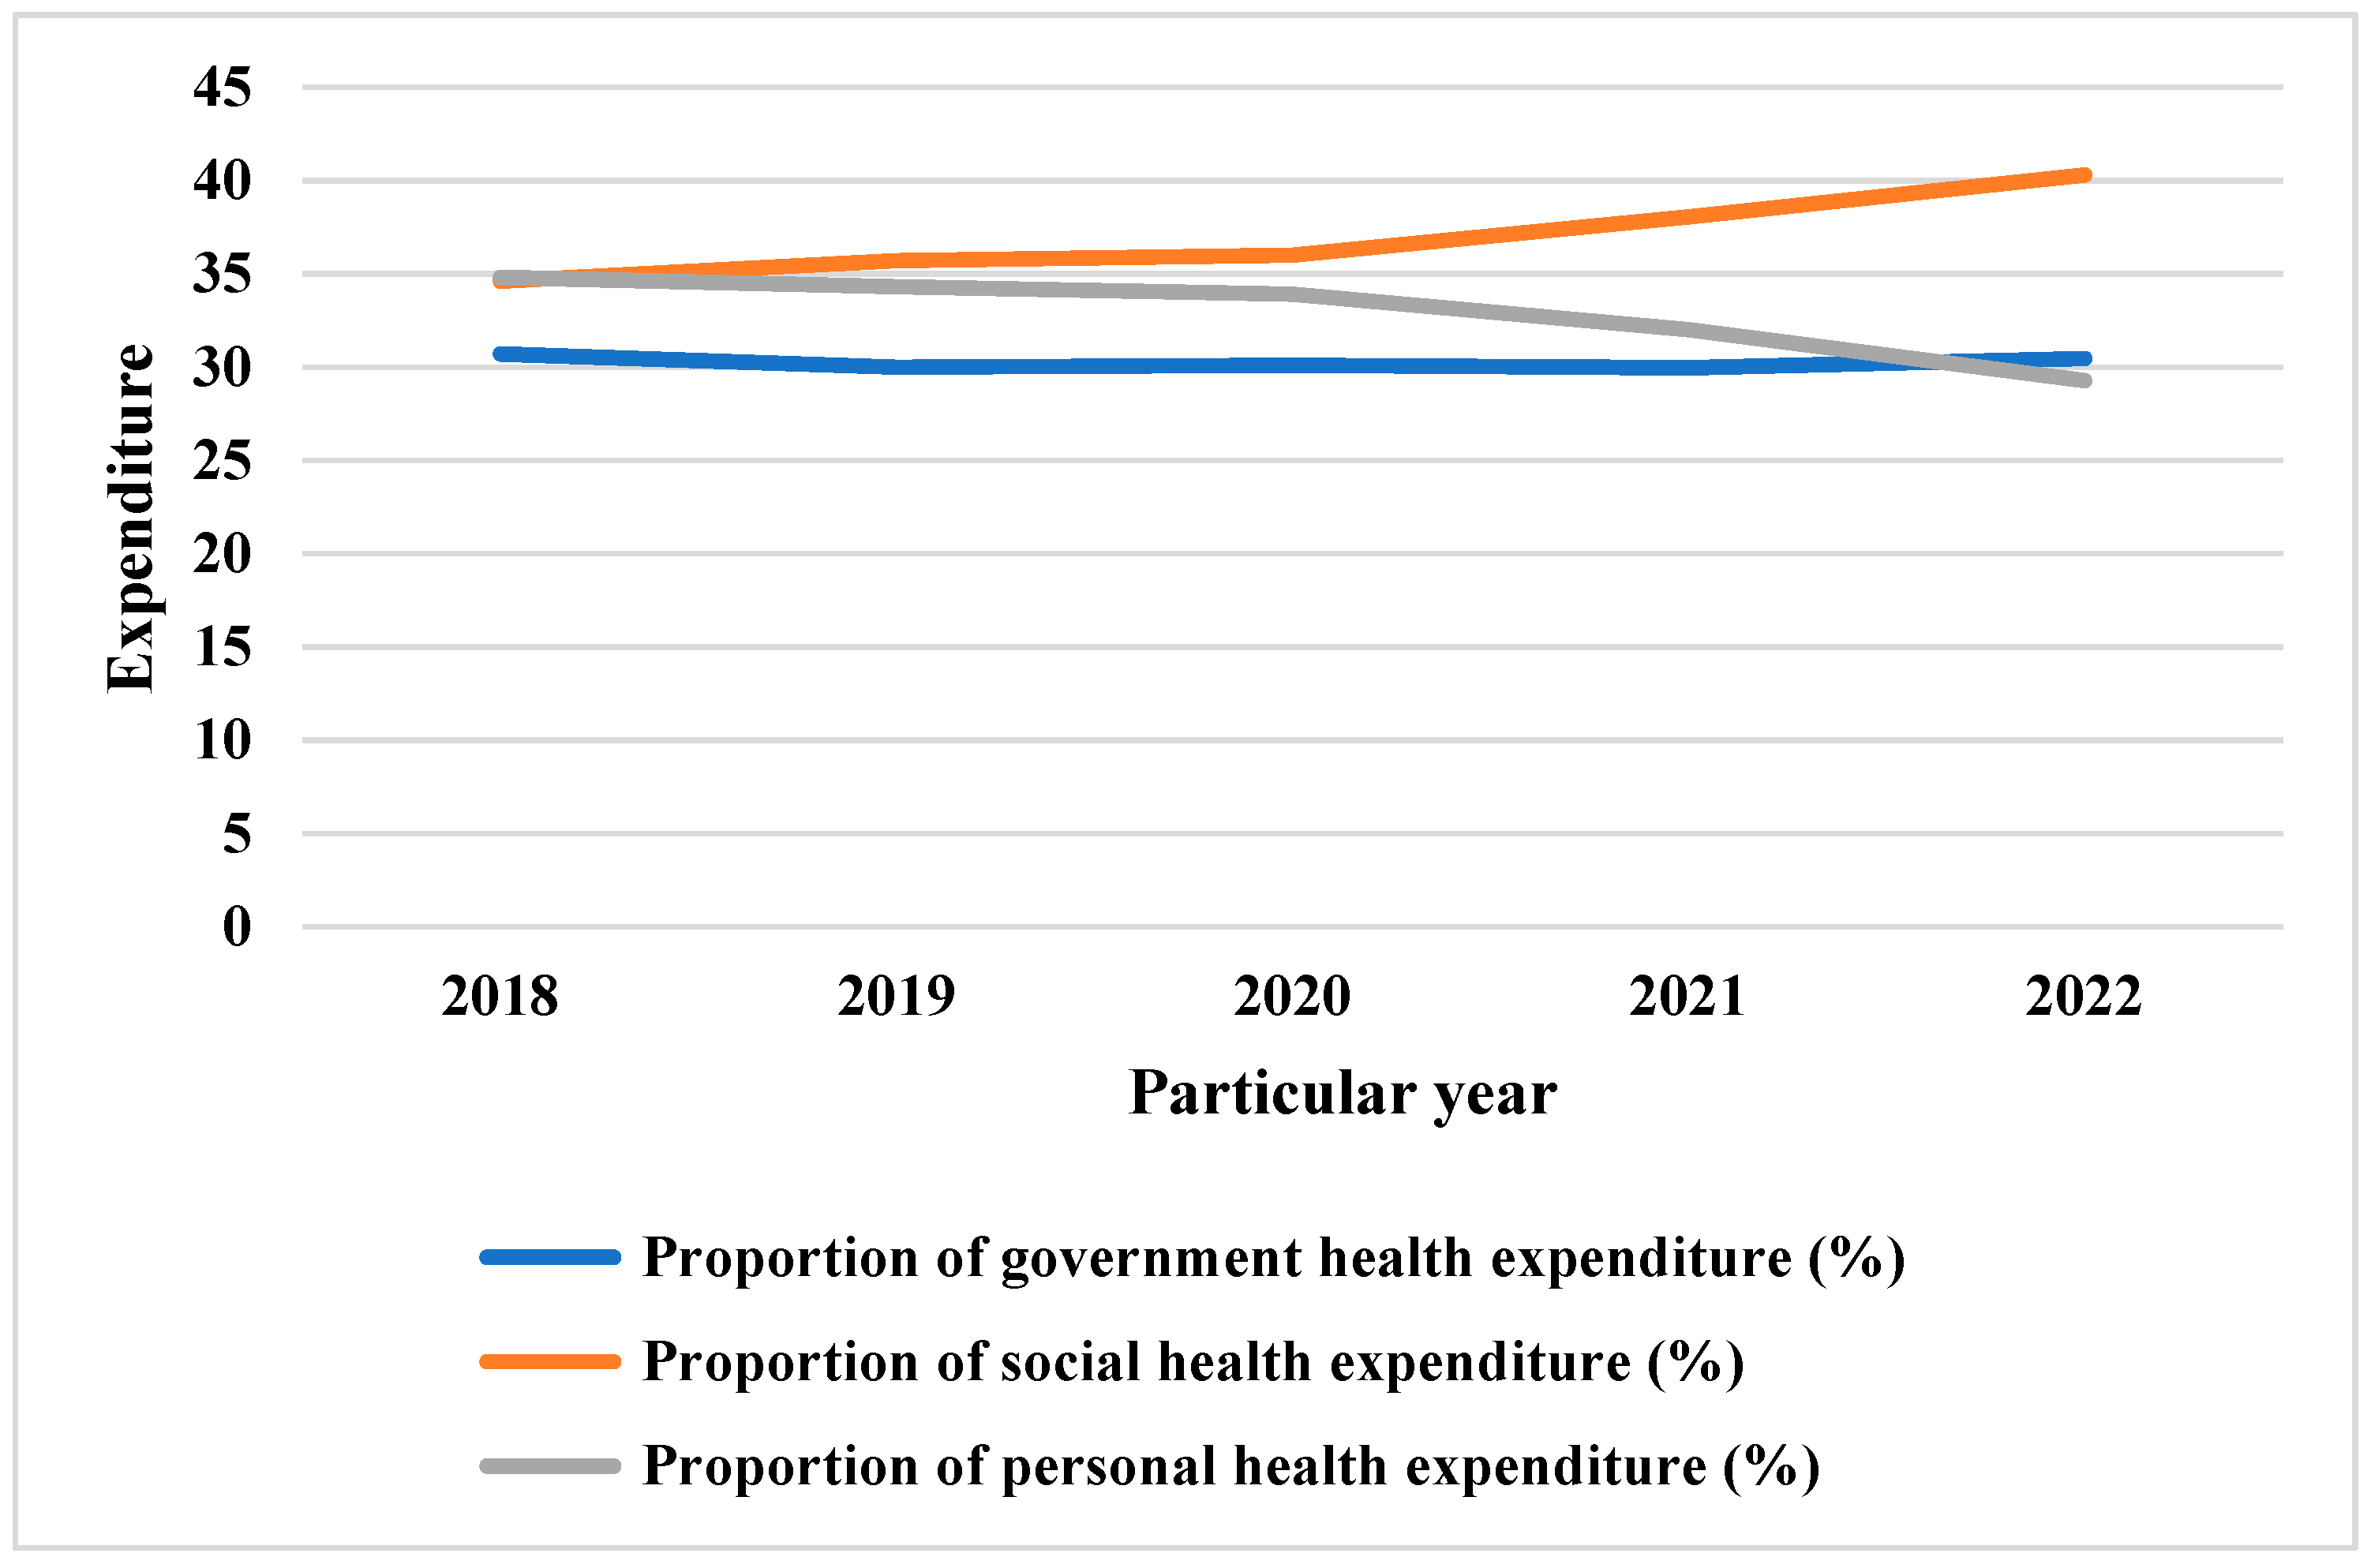
It can be seen from the data in
Figure 2 below that the health spending of the Chinese government has not changed significantly in recent years. The distribution of government health spending has decreased from 2018 to 2021, from 30.7% in 2018; the lowest share of health spending in 2021 was 29.96%, and in 2022 increased to 30.45%, but remained lower than the government’s 2018 medical expenses.
3.2. Public Health Expenditure Structure
From the perspective of China’s public health care,
Table 6 shows that China’s health care spending has increased year by year, from CNY 132.02 billion in 2013 to CNY 119.531 billion in 2018. In 2022, the price pattern also shows the pattern of financing. This shows that the increase in public health spending is mostly influenced by the budget. In 2013, 1.9% of medical and health care costs came from the central government, and 98.1% was public expenditure; meanwhile, in 2022, the central government accounted for only 0.7% of medical and health spending, while public spending accounted for 99.3% [
9].
3.3. Supply Structure of Public Health in the East, Middle and West
From the point of view of the region, the per capita health in the eastern region is higher than other regions, which is the reason for the regional disparity differences in population health in the eastern region. Spending on health per person in the eastern region is lower than other regions, which affects per capita health spending; in other regions in the east, there is little difference in the scale of health spending per capita. The difference in the index of public health expenditure per capita between the regions is small and insignificant; the level of health expenditure per person in the eastern region is higher than that of the middle region, and the level of health of the population in the eastern region is higher than on the middle ground [
10].
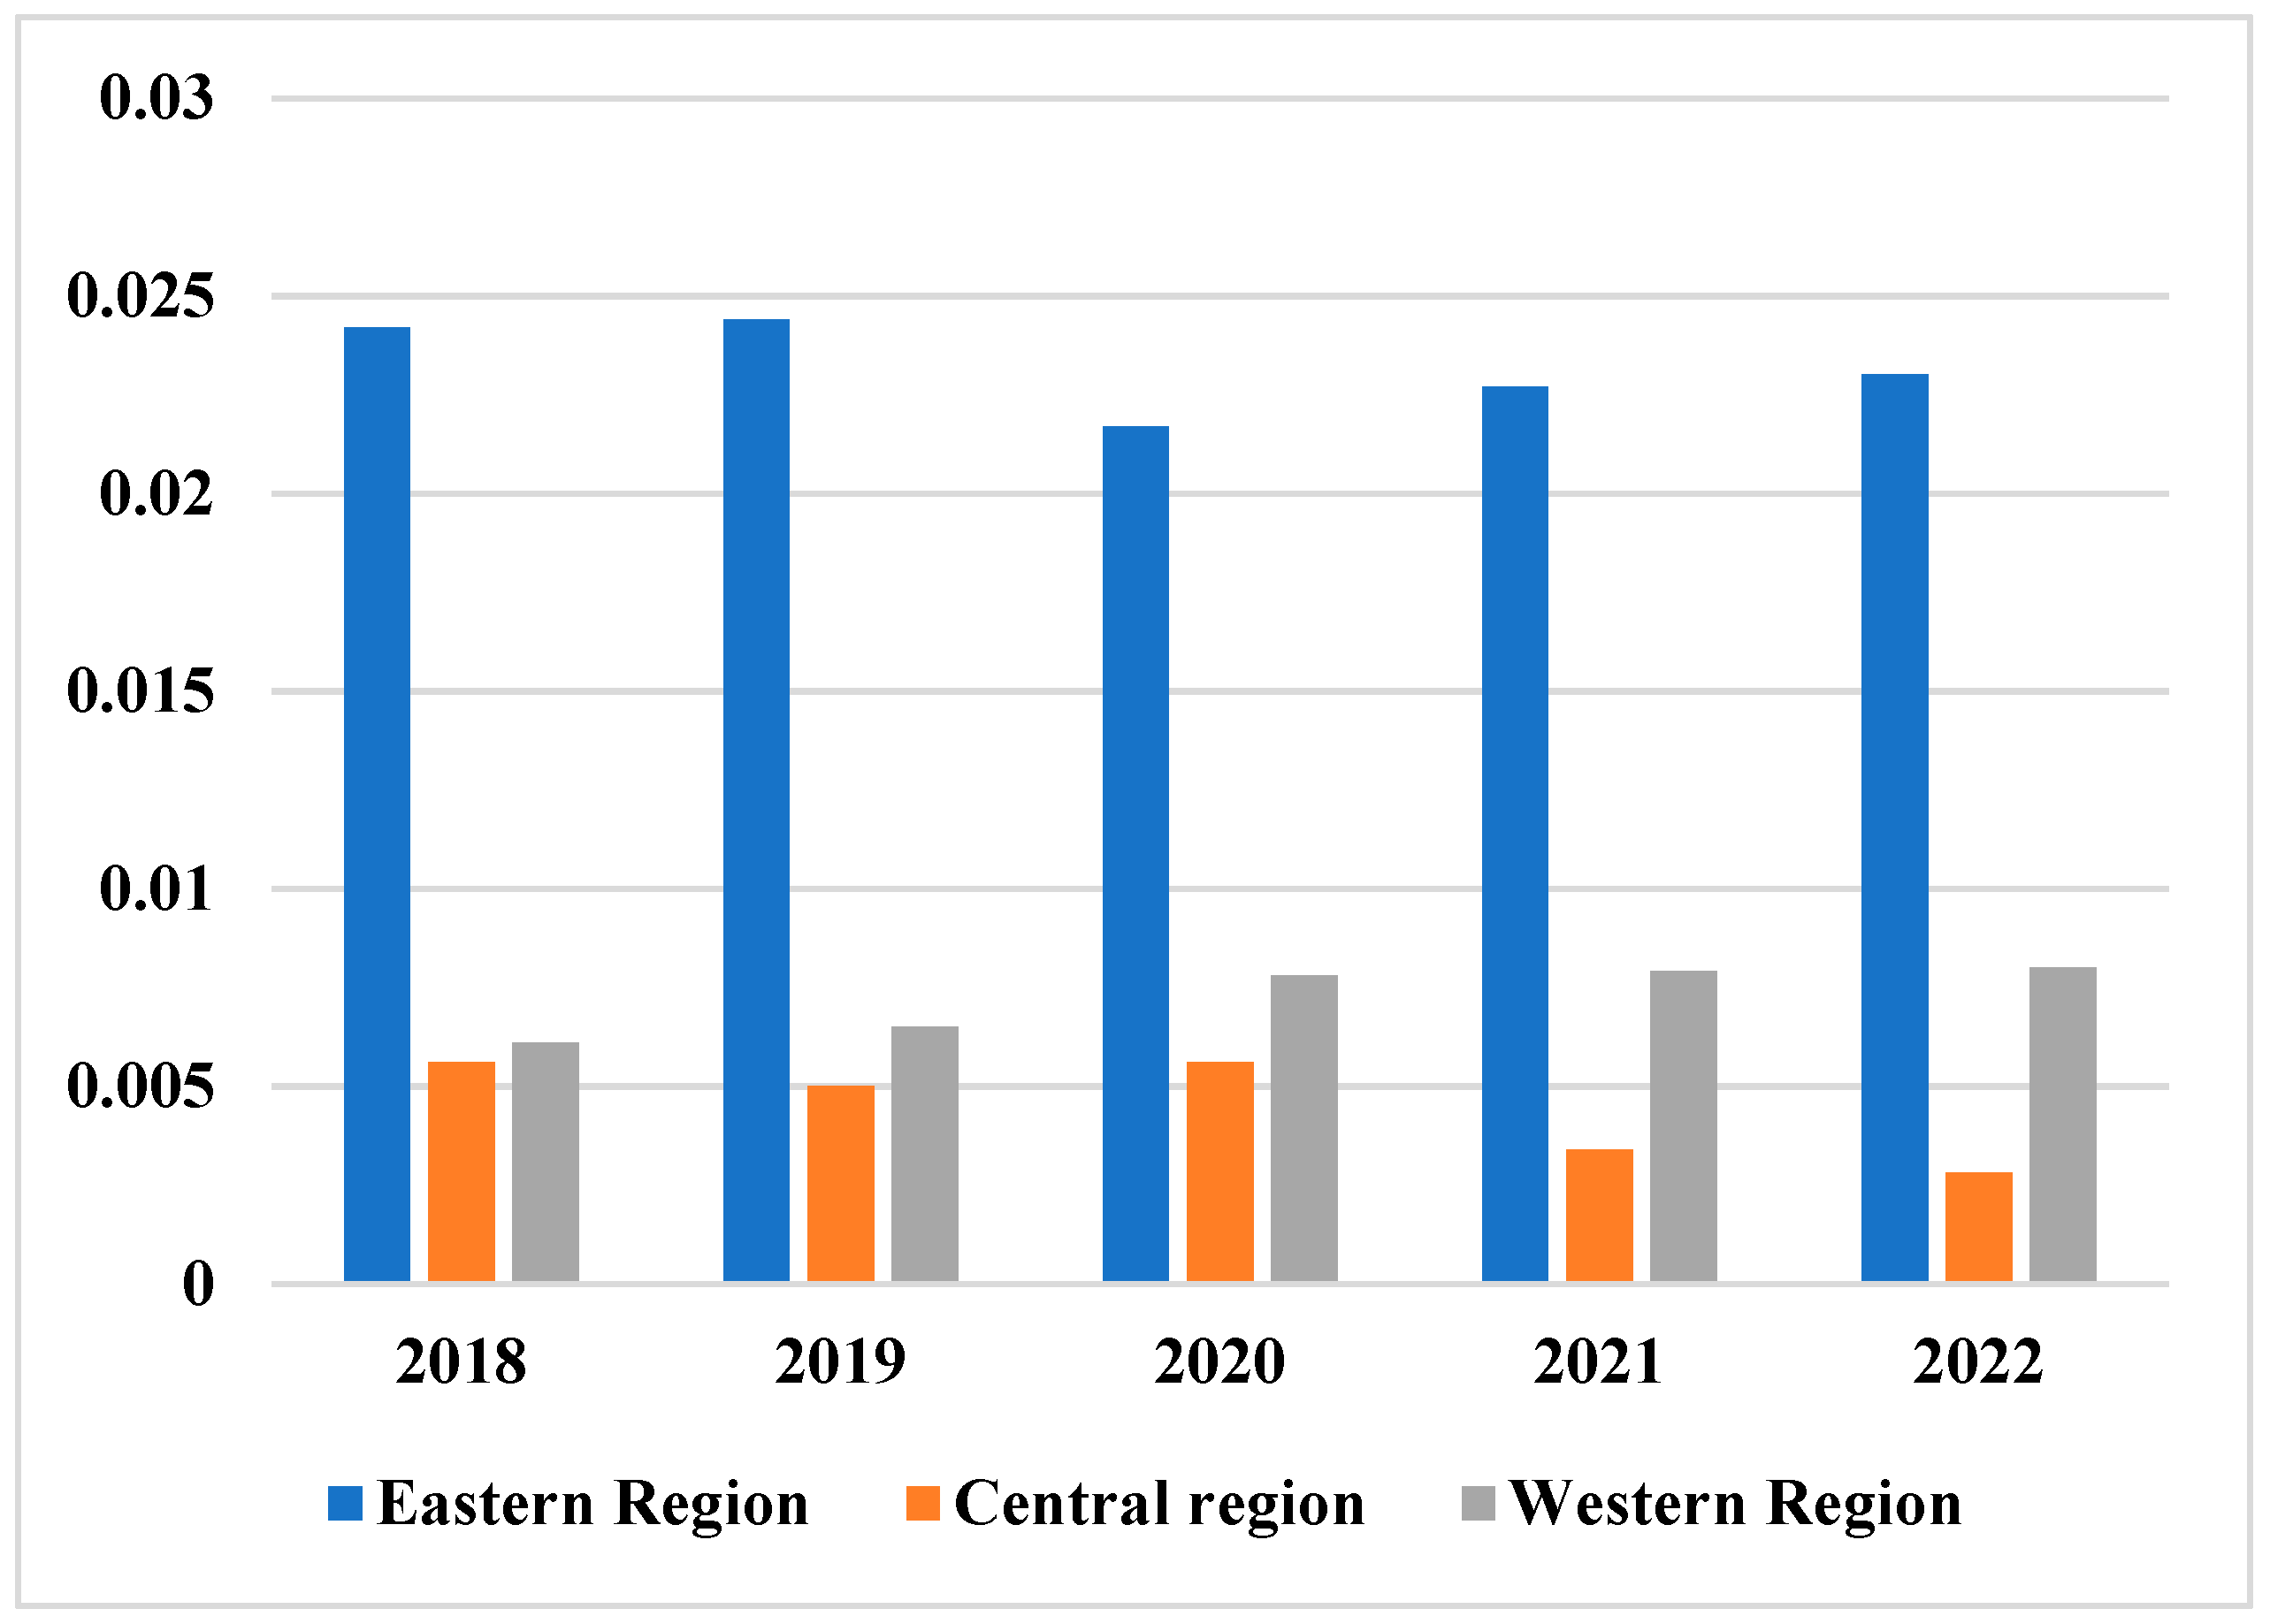
To identify regional differences in China’s health spending, the Theil index in the eastern region gradually decreased from 2018 to 2020, as can be seen from Theil index line in
Figure 3 and the price changes in
Table 7. It shows that the difference in health care costs of the population in the east is gradually decreasing. From 2018 to 2022, the TAIR index of the eastern region is the largest, and the power line of the TAIR index is at the top.
4. Empirical Analysis of the Impact of Government Public Health Governance Efficiency and Government Credibility on Public Health Safety Satisfaction
4.1. Descriptive Statistical Analysis
4.1.1. Public Health Safety Satisfaction Profile
The overall evaluation of urban residents’ satisfaction with public health and safety is shown in
Table 8. In general, the average score of the public health safety evaluation of the interviewed residents is 3.350, which is above the medium level [
11]. However, under the macro social background of the increasing living standards of Chinese residents and the increasing needs and expectations of public safety, it is still questionable whether the above medium public health safety evaluation indicates that the public health safety situation has been widely recognized by urban residents.
4.1.2. Overview of Government Public Health Governance Effectiveness
The overall situation of urban residents’ perception of government public health governance efficiency is shown in
Table 9. Overall, the average score of the overall effectiveness of public health governance is 5.059, which is only at the medium level. The respondents scored the highest on the sub item of emergency management efficiency 5.191; the average score of normative effectiveness was the lowest at 4.919 [
12]. This shows that the effectiveness of government public health governance at the subjective perception level of urban residents has great room for improvement, both on the whole and in specific sub items.
4.1.3. Overview of Government Credibility
The overall perception of urban residents on the evaluation of government credibility is shown in
Table 10. In general, the average government credibility is 3.280, less than 3.5. Although the level of government credibility is above the medium level, it is not blindly optimistic, and there is still a risk of a weak foundation. The average scores of the surveyed residents on the degree of realization of the government’s expectations, confidence and trust were 3.191, 3.297 and 3.351, respectively. The specific sub items of government credibility and the evaluation of public health safety satisfaction show the same distribution characteristics of large in the middle and small at both ends [
13].
4.1.4. Correlation Analysis between Variables
By averaging the measurement items of government public health governance efficiency and government credibility, respectively, the correlation between the three main research variables can be obtained. The results are shown in
Table 11. There is a positive correlation between the effectiveness of government public health governance, government credibility and urban residents’ satisfaction with public health safety at a significance level of 0.01 [
14].
4.2. Main Effect Test
4.2.1. Overview of Structural Equation Models
A structural equation model is composed of a measurement model and structural model. The measurement equation is:
The structural equation is:
Equation (1) is the measurement equation of the external latent variable, and is the external latent variable; Equation (2) is the measurement equation of the internal dependent latent variable, and is the internal dependent latent variable; Equation (3) is a structural equation, which describes the relationship between internal latent variables and each other, and describes the influence of external latent variables on internal latent variables .
4.2.2. Empirical Test and Results
In this study, because public health safety satisfaction is an explicit variable, while the government’s public health governance efficiency and government credibility are regarded as potential variables, and the structural model of path analysis includes both explicit and potential variables, the path analysis of the mixed model is constructed. The overall model fitness test results of the overall relationship model are shown in
Table 12.
It can be seen that, except for the x
2/df value and PGFI value, the other statistical test quantities meet the overall model fitness standard. As mentioned in
Section 3, the problem of too large an x
2/df value caused by too large a sample size is also ignored here. Therefore, the fitness index of the model generally meets the fitness standard, indicating that the model has a good fitness.
Table 13 shows the test results of the overall relationship model [
15].
Table 14 shows the hypothesis test results. It can be seen that the standardized regression coefficients of “government public health governance efficiency” on “government credibility” and “public health safety satisfaction” are 0.232 and 0.251, respectively, and the standardized regression coefficients of “government credibility” on “public health safety satisfaction” are 0.326, both reaching a significant level of 0.001. The value of standardized regression coefficient is positive, indicating that the influence path relationship between the three core variables is positive, which is consistent with the original theoretical hypothesis [
16].
This means that the first three hypotheses of this study have been verified. Specifically:
First, the operation of the government’s public health care has a positive effect on the satisfaction of the public’s health security. The sign of the path coefficient of the influence of public health management on the results of urban residents’ satisfaction with public health safety is positive and reaches a significant level of 0.001, indicating that the effectiveness of public health management has a positive effect on the assessment of health. In terms of the satisfaction of residents in cities with public health safety, hypothesis H1 is confirmed [
17].
Second, the effectiveness of government public health care has a positive effect on trust in government. The sign of the path coefficient of the effect of health management on public trust is positive and reaches a significant level of 0.001, indicating that public health management has a positive effect on public confidence according to citizens, meaning that hypothesis H2 is confirmed.
4.3. Intermediary Effect Test
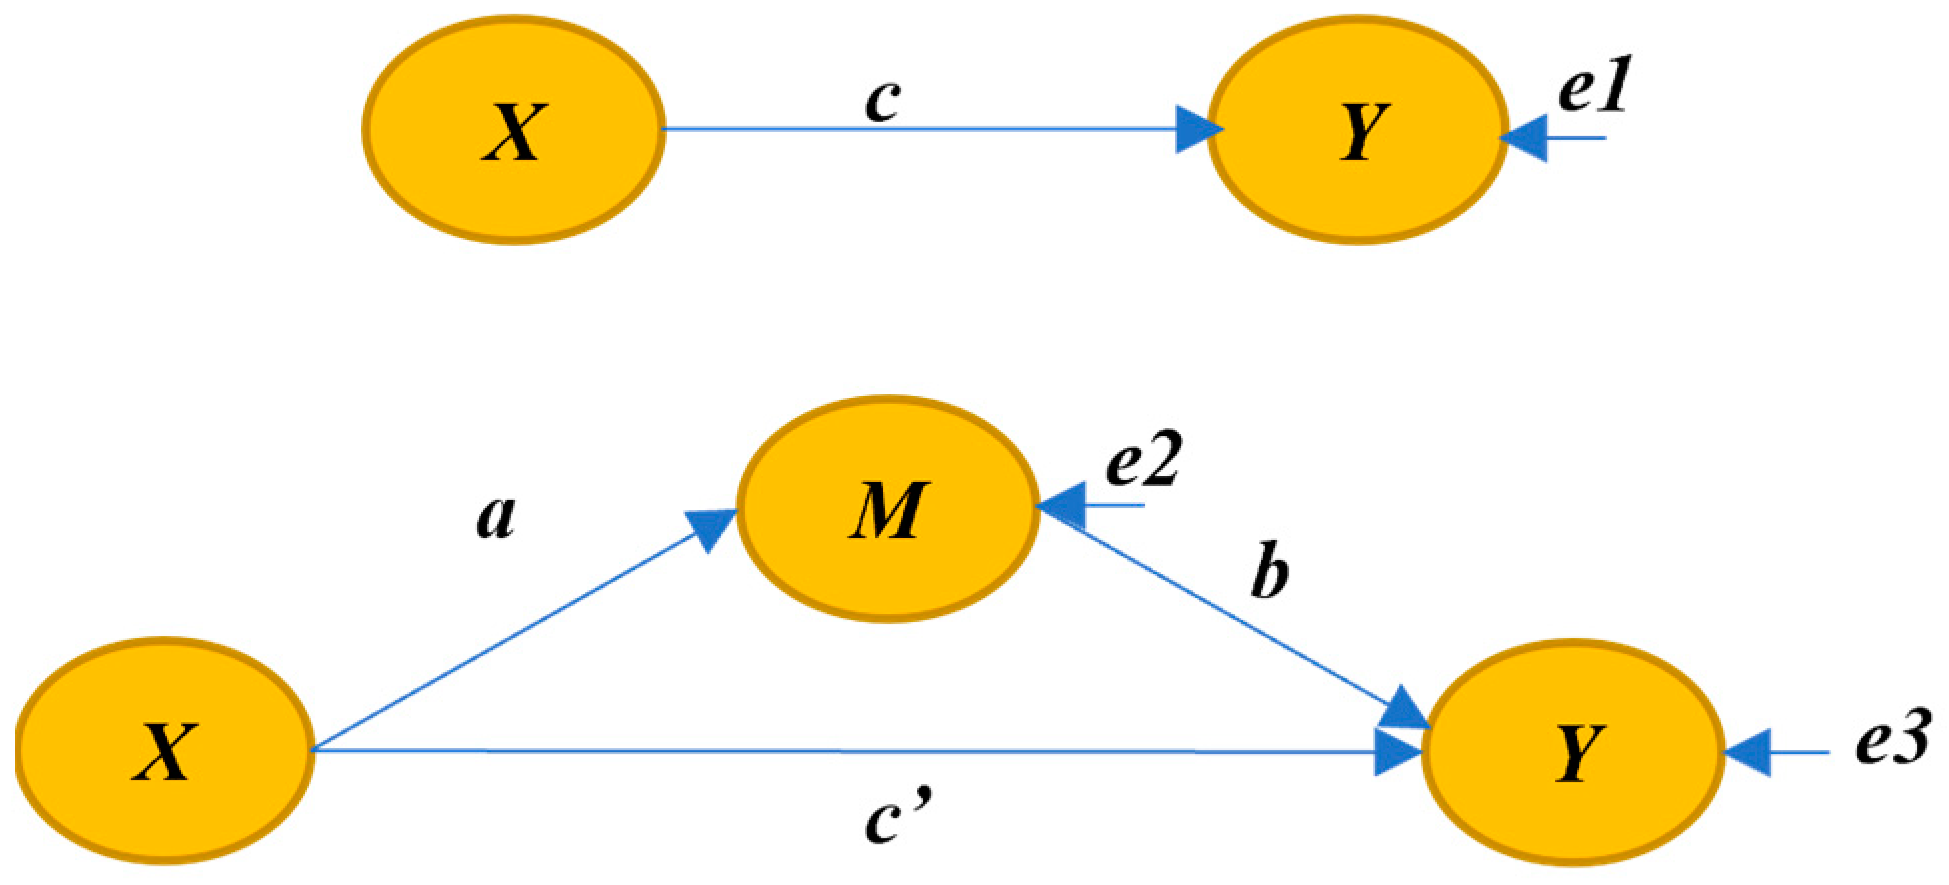
4.3.1. Overview of Mediation Effect
Mediation means that there are m intervening variables in the causal relationship mechanism between the independent variable
X and the dependent variable
Y: that is, the independent variable
X can affect the difference between
Y and M mediating variables [
18]. In this case, m is the average difference between m affecting both the independent variable
X and the variable
Y. A schematic diagram of the mediation process is shown in
Figure 4.
When all variables are centralized or standardized, the specific relationship between the three variables can be described by the following equation:
The intermediary effect is equal to the coefficient product
, that is, the indirect effect. The total effect is the sum of the direct effect and the indirect effect. The specific relationship is as follows:
The mediating effect can be divided into the complete mediating effect and the partial mediating effect. In the complete intermediary effect, X can only affect Y through the intermediary variable m, but it cannot directly affect Y: that is, at this time, the coefficient is 0, c = ab. In some mediating effects, X can not only directly affect Y, but also affect Y through the mediating variable M.
4.3.2. Intermediary Effect Test
The bootstrap method is one of the common methods to test the mediation effect. It does not need samples to obey the hypothesis of positive distribution and does not rely on theoretical standard error. It has high statistical effect, and is also considered the most ideal mediation effect test method at present. Bootstrap is a nonparametric statistical method that estimates the variance of statistics and then estimates the interval. Its basic core idea is to use resampled sample data to calculate statistics and estimate sample distribution [
19]. The test results are shown in
Table 15.
Table 15 shows that government trust plays a mediating role in the effect of government health care on public health on urban residents’ satisfaction with public services. The health Z value of the significance level of the indirect effect is equal to the value of the unstandardized coefficient of the indirect effect/standard error of the indirect effect = 0.034/0.002 > 1.96. In addition, the confidence interval for the direct effect does not include 0, thus confirming the existence of a moderated effect. The planting time for the direct effect does not include 0, so there is still an indirect effect [
20]. Through the analysis, it is found that the efficiency of government governance directly affects the satisfaction of regional residents with public health security. With the help of the mediation effect test, the significant level standard error of the indirect effect is greater than 1.96, and the confidence interval does not include 0, demonstrating the existence of the mediation effect. On this basis, strategies to improve regional public health safety satisfaction were further analyzed.
5. Development Countermeasures of Government Governance to Improve the Satisfaction and Quality of Public Health Security from the Perspective of Ecological Environment
5.1. Improve the Existing Public Health Administrative Norms
First, governance plays an important role in improving the legal system of public health, establishing and forming the legal department of public health, improving the status of public health law in China’s legal system, and making public health law an independent department of the legal system. Second, it solves the basic theoretical problems related to public health law (characteristics, essence, origin, legal basic rights and obligations of health) and determines the basic categories of public health law to adjust various social relations based on the right to life and health [
21]. This is to explore the relationship between public health law and other legal norms, and to study the relationship between public health legal rights and obligations, and the related legal responsibilities, so as to provide a theoretical basis for the establishment of the basic theoretical system of health law. Third, it is of great significance to strengthen the construction of a socialist public health legal system. (1) In terms of public health legislation, through the study of the legal system of public health, we can clearly find the defects and deficiencies of the current legal system of public health, so as to scientifically formulate public health legislation strategies; gradually implement public health legislation planning; realize legislative intent, legislative value and legislative effectiveness; and provide theoretical support for the construction of public health rule of law. (2) It is of great significance to guide public health administrative law enforcement and judicial practice, improve the health level and awareness of the safeguarding rights of the whole population, and protect citizens’ health rights and interests. Only by enhancing the understanding and recognition of the national public health legal system can the public increase their knowledge, understanding of, and ability to abide by the law [
22].
5.2. Formulate the Basic Law of Public Health and Standardize Government Functions
The formal rationality of law can serve as a powerful footnote to the systematization requirements of public health law. The so-called formal rationality of law refers to the systematization and scientization of legal rules controlled by reason and the formalization of the process of law making and application. According to Max Weber, a famous German legal sociologist, formal rationality is the highest level of rationality pursued by law. He believes that theoretically, the last stage of legal development is the systematic development of professional jurists on the basis of literature and formal logic training [
23]. However, due to the lack of command and coordination, separate public health laws and regulations are isolated from each other. This situation is not conducive to the unified regulation and management of the field of public health, nor to the implementation of a single public health law. People involved in legislation at different places often start from the perspective of their own departments and regions, causing the relevant laws and regulations to be one-sided and limited, rather than overall and long term. Therefore, it is necessary to formulate a unified basic law of public health.
5.3. Give Full Play to the Government’s Supervision of Public Health Services
The government’s supervision function in the field of public health is particularly important under the current market economy. Since the reform and opening up, under the conditions of the market economy, due to the profit seeking nature of the market, many bad businesses, in order to pursue interests, have taken advantage of problems such as untimely government supervision and loopholes in supervision, waiting for the opportunity to produce and sell fake and shoddy food and drugs, causing serious social harm, as well as causing public opinion to falter regarding the government’s supervision ability. China has had a market economy for more than 30 years [
24]. With the rapid economic development, weak supervision of market behavior has occurred from time to time, especially in the field of public health. The field of public health is closely related to all aspects of society; whether it is food safety or drug safety, environmental protection or ecological balance, it is related to the lives and safety of the public. It is also the strictest set of regulatory measures that public health functional departments must implement. From production license, production to transportation, sales and other links, professional supervisors must be sent to supervise the whole process, in order to be open and transparent and ensure that businesses can conduct market behavior in accordance with relevant professional standards [
25].
6. Conclusions
In the new era of social transformation, various public health events emerge in an endless stream; this leads to a great threat to public health and causes people to question the government’s governance capacity in the field of public health. In this case, the government should aim at building a service-oriented government, give full play to its initiative in performing public health functions, and strive to reform and improve China’s public health undertakings under the guidance of public health law.
Author Contributions
Software, T.H.; Resources, T.H.; Writing—original draft, M.G.; Writing—review & editing, L.L. All authors have read and agreed to the published version of the manuscript.
Funding
This work is supported by the: 1. Center for American Studies. Project name: Research on the Comparison and Enlightenment of Chinese and American governments in the disposal of COVID-19, Project No.: ARC2021007; 2. Luzhou Federation of Social Sciences–Social Governance Innovation Research Center. Project name: Research on the path to improve the level of grass-roots governance based on the integrated development of urban and rural areas, Project No.: SHZLYB2106.
Institutional Review Board Statement
Not applicable.
Informed Consent Statement
Not applicable.
Data Availability Statement
The labeled data set used to support that findings of this study are available from the corresponding author upon request.
Conflicts of Interest
The authors declare no conflict of interest.
References
- Balisi, S.; Madisa, M. COVID-19 preventative measures: Lessons for public health policy. Open J. Soc. Sci. 2021, 9, 15. [Google Scholar] [CrossRef]
- Sheard, D.J.; Clydesdale, G.; Maclean, G. Governance structure and public health provision. J. Health Organ. Manag. 2019, 33, 426–442. [Google Scholar] [CrossRef]
- Lin, G. Book reviews: Urbanization, regional development and governance in China, by Jianfa Shen. China Rev. Interdiscip. J. Greater China 2019, 19, 169–171. [Google Scholar]
- Mwoka, M.; Ajayi, A.I.; Kibunja, G.; Cheruiyot, C.; Ushie, B.A. Cocreated regional research agenda for evidence-informed policy and advocacy to improve adolescent sexual and reproductive health and rights in Sub-Saharan Africa. Br. Med. J. Glob. Health 2021, 6, e005571. [Google Scholar] [CrossRef] [PubMed]
- Wolman, H. Looking at regional governance institutions in other countries as a possible model for u.s. metropolitan areas: An examination of multipurpose regional service delivery districts in British Columbia. Urban Aff. Rev. 2019, 55, 321–354. [Google Scholar] [CrossRef]
- Pan, X.; Li, M.; Guo, S.; Pu, C. Research on the competitive effect of local government’s environmental expenditure in China. Sci. Total Environ. 2020, 718, 137238. [Google Scholar] [CrossRef]
- Huang, Z. Value analysis of sports industry policy from the perspective of national governance. Mod. Manag. Forum 2021, 5, 189. [Google Scholar] [CrossRef]
- Wang, Y.; Zhao, Y. Is collaborative governance effective for air pollution prevention? A case study on the Yangtze river delta region of China. J. Environ. Manag. 2021, 292, 112709. [Google Scholar] [CrossRef]
- Li, C.; Wu, X.; Sheridan, S.; Lee, J.; Wang, X.; Yin, J.; Han, J. Interaction of climate and socio-ecological environment drives the dengue outbreak in epidemic region of China. PLoS Negl. Trop. Dis. 2021, 15, e0009761. [Google Scholar] [CrossRef]
- Panjaitan, R.B.; Sumartono, S.; Saleh, C. The role of central government and local government and the moderating effect of good governance on forest fire policy in Indonesia. Benchmarking 2019, 26, 147–159. [Google Scholar] [CrossRef]
- Lu, T. Study on Effectiveness of Government Governance in the Cities with Serious Air Pollution: A case study of Zheng-Zhou City. Meteorol. Environ. Res. 2019, 10, 20–23+30. [Google Scholar]
- Titah, R.; Maclean, D. A systematic literature review of empirical research on the impacts of e-government: A public value perspective. Public Adm. Rev. 2022, 82, 23–38. [Google Scholar]
- Yun, N.S.; Lee, S.K. The effect of public office values on government trust: Focusing on the effects of regulating the level of citizenship. Restaur. Bus. 2019, 118, 366–374. [Google Scholar] [CrossRef]
- Cheong, Y.M.; Choi, S.O. The effect of e-government on digital divide. J. Korea Technol. Innov. Soc. 2019, 22, 942–961. [Google Scholar] [CrossRef]
- Liargovas, P.; Apostolopoulos, N. Economic governance of a populist government: From the fear of grexit to continued instability. Southeast. Eur. L’Europe Du Sud-Est 2021, 45, 48–63. [Google Scholar] [CrossRef]
- Zhang, F.; Feng, Y.; Liao, Z.; Xiaogang, W.; Zhang, L. The effect of ecological factors on Fagaceae species richness in Sichuan-Chongqing region, China. Chin. J. Appl. Environ. Biol. 2020, 26, 689–696. [Google Scholar]
- Ryabova, L.N.; Zalygina, I.A. Criterion for the assessment of the ecological condition of bottom sediments (on the example of the Brest region). Proc. Natl. Acad. Sci. Belarus Chem. Ser. 2019, 54, 455–466. [Google Scholar] [CrossRef]
- Zheltukhina, V.I.; Kulikova, M.A.; Kolesnichenko, E.Y.; Manokhina, L.A. Assessment of the ecological state of the Maysky village reservoirs, belgorod region, based on the analysis of morphological features of silver carp Carassius Gibelio. IOP Conf. Ser. Earth Environ. Sci. 2021, 848, 012160. [Google Scholar] [CrossRef]
- Ivanova, D. On the issue of ecological problems of the Baikal region forests: An economic aspect. Bull. Baikal State Univ. 2019, 29, 24–31. [Google Scholar] [CrossRef]
- Ma, L.; Liu, Z.; Huang, X.; Li, T. The impact of local government policy on innovation ecosystem in knowledge resource scarce region: Case study of Changzhou, China. Sci. Technol. Soc. 2019, 24, 29–52. [Google Scholar] [CrossRef]
- Zhang, X.; Rane, K.; Kakaravada, I.; Shabaz, M. Research on vibration monitoring and fault diagnosis of rotating machinery based on internet of things technology. Nonlinear Eng. 2021, 10, 245–254. [Google Scholar] [CrossRef]
- Huang, R.; Zhang, S.; Zhang, W.; Yang, X. Progress of zinc oxide-based nanocomposites in the textile industry. IET Collab. Intell. Manuf. 2021, 3, 281–289. [Google Scholar] [CrossRef]
- Chen, J.; Liu, J.; Liu, X.; Xu, X.; Zhong, F. Decomposition of Toluene with a Combined Plasma Photolysis (CPP) Reactor: Influence of UV Irradiation and Byproduct Analysis. Plasma Chem. Plasma Process. 2021, 41, 409–420. [Google Scholar] [CrossRef]
- Ajay, P.; Jaya, J. Bi-level energy optimization model in smart integrated engineering systems using WSN. Energy Rep. 2022, 8, 2490–2495. [Google Scholar]
- Sharma, K.; Chaurasia, B.K. Trust Based Location Finding Mechanism in VANET Using DST. In Proceedings of the Fifth International Conference on Communication Systems & Network Technologies, Gwalior, India, 4–6 April 2015; pp. 763–766. [Google Scholar]
Figure 1.
Schematic diagram of research model.
Figure 1.
Schematic diagram of research model.
Figure 2.
Main structure of public health expenditure in China.
Figure 2.
Main structure of public health expenditure in China.
Figure 3.
Change value of public health Theil index of fiscal expenditure in eastern, central and western regions.
Figure 3.
Change value of public health Theil index of fiscal expenditure in eastern, central and western regions.
Figure 4.
Schematic diagram of intermediary effect.
Figure 4.
Schematic diagram of intermediary effect.
Table 1.
Statistical table of residents’ basic information filled in the questionnaire.
Table 1.
Statistical table of residents’ basic information filled in the questionnaire.
| Variable | Category | Frequency | Frequency% | Variable | Category | Frequency | Frequency% |
|---|
| Political outlook | Member of the Communist Party of China | 1668 | 18.0 | | 18–29 years old | 4453 | 48.0 |
| Democratic party’s | 228 | 2.5 | Age | 30–44 years old | 2680 | 28.9 |
| Communist Youth League member | 2770 | 29.9 | | 45–59 years old | 1588 | 17.1 |
| Masses | 4580 | 49.4 | | Over 60 years old | 544 | 5.9 |
| Gender | Male | 4632 | 50.0 | | Civil servant | 342 | 3.7 |
| | Female | 4639 | 50.0 | | Personnel of public institutions | 1061 | 11.4 |
| Degree of education | Primary school and below | 342 | 3.7 | | Clerk | 2031 | 21.9 |
| Junior high school | 1139 | 12.3 | Identity | Migrant workers | 485 | 5.2 |
| High school (vocational and technical secondary school) | 2371 | 25.6 | | Student | 2414 | 26.0 |
| University (junior college) | 4868 | 52.5 | | Professional | 1396 | 15.1 |
| Graduate and above | 546 | 5.9 | | Retired personnel | 532 | 5.7 |
| | | | | Other | 996 | 10.7 |
| Nation | Han nationality | 8119 | 87.6 | Religious belief | Nothing | 7781 | 83.9 |
| Zhuang nationality | 166 | 1.8 | Buddhism | 775 | 8.4 |
| Manchu | 184 | 2.0 | Taoism | 95 | 1.0 |
| Hui nationality | 240 | 2.6 | Christianity | 198 | 2.1 |
| Miao nationality | 63 | 0.7 | Islamism | 214 | 2.3 |
| Uygur ethnic group | 56 | 0.6 | Catholicism | 38 | 0.4 |
| Tujia nationality | 37 | 0.4 | Other | 157 | 1.7 |
| Yi nationality | 26 | 0.3 | Household registration type | City of this city | 4816 | 51.9 |
| Mongolian | 60 | 0.6 | Rural areas of the city | 1357 | 14.6 |
| The Zang or Tibetan people | 207 | 2.2 | Foreign cities | 1719 | 18.5 |
| Other | 113 | 1.2 | Rural areas outside the city | 1369 | 14.8 |
| Personal monthly income | Below CNY 2000 | 2734 | 9.5 | Personal monthly income | CNY 5001–8000 | 1325 | 14.3 |
| CNY 2001–3500 | 2109 | 22.7 | CNY 8001–12,500 | 430 | 4.6 |
| CNY 3501–5000 | 2288 | 24.7 | More than CNY 12,500 | 202 | 2.2 |
Table 2.
KMO and Bartlett’s test of the scale.
Table 2.
KMO and Bartlett’s test of the scale.
| KMO Sampling Suitability Quantity | 0.811 |
|---|
| Bartlett’s Sphericity Test | Approximate chi square | 30,531.954 |
| | Freedom | 21 |
| | Significance | 0.000 |
Table 3.
Total variation and rotated component matrix of factor interpretation extracted from the scale.
Table 3.
Total variation and rotated component matrix of factor interpretation extracted from the scale.
| | Question Item | Ingredients |
|---|
| 1 | 2 |
|---|
| Government public health governance effectiveness (GX) | Prevention effectiveness (xn1) | 0.835 | 0.106 |
| Regulatory effectiveness (xn2) | 0.889 | 0.076 |
| Specification efficiency (xn3) | 0.881 | 0.069 |
| Emergency management efficiency (xn4) | 0.861 | 0.128 |
| Government credibility (GX) | Government expectation (gx1) | 0.102 | 0.812 |
| Government confidence (gx2) | 0.090 | 0.859 |
| Government trust (gx3) | 0.080 | 0.828 |
| | Variance explanatory quantity | 43.273% | 30.285% |
| | Cumulative variance interpretation | | 73.558% |
Table 4.
Test results of internal structure suitability of the model by confirmatory factor analysis.
Table 4.
Test results of internal structure suitability of the model by confirmatory factor analysis.
| Potential Variables | Observation Variables | Standardized Load | Index Reliability | Measurement Error | Composite Reliability | Mean Variance Extraction |
|---|
| XG | Preventive effectiveness | 0.757 | 0.573 | 0.427 | 0.901 | 0.696 |
| Regulatory effectiveness | 0.892 | 0.796 | 0.204 |
| Normative efficiency | 0.827 | 0.684 | 0.316 |
| GX | Emergency management efficiency | 0.856 | 0.733 | 0.267 | 0.790 | 0.558 |
| Government expectations | 0.696 | 0.487 | 0.513 |
| Government confidence | 0.814 | 0.663 | 0.337 |
| Government trust | 0.723 | 0.523 | 0.477 |
Table 5.
Normality test results of the scale.
Table 5.
Normality test results of the scale.
| | Number of Cases | Average Value | Standard Deviation | Skewness | Kurtosis |
|---|
| Xn1 | 9273 | 5.10 | 2.674 | 0.147 | −0.948 |
| Xn2 | 9273 | 5.02 | 2.807 | 0.173 | −1.050 |
| Xn3 | 9273 | 4.92 | 2.691 | 0.192 | −0.959 |
| Xn4 | 9273 | 5.19 | 2.652 | 0.067 | −0.959 |
| my | 9273 | 3.35 | 0.888 | −0.223 | −0.009 |
| Gx1 | 9273 | 3.19 | 0.780 | −0.283 | 0.611 |
| Gx2 | 9273 | 3.30 | 0.817 | −0.321 | 0.381 |
| Gx3 | 9273 | 3.35 | 0.815 | −0.366 | 0.364 |
Table 6.
Structure of government expenditure on health care in China from 2013 to 2022 unit: CNY 100 million, percentage%.
Table 6.
Structure of government expenditure on health care in China from 2013 to 2022 unit: CNY 100 million, percentage%.
| Particular Year | Total Medical and Health Expenditure | Central Expenditure | Local Expenditure | Central Proportion | Local Proportion |
|---|
| 2018 | 6459 | 71.3 | 6358.2 | 1.1 | 98.9 |
| 2019 | 7245.1 | 74.3 | 7170.8 | 1 | 99 |
| 2020 | 8279.9 | 76.7 | 8203.2 | 0.9 | 99.1 |
| 2021 | 10,176.8 | 90.1 | 10,086.7 | 0.9 | 99.1 |
| 2022 | 11,953.1 | 84.4 | 11,868.7 | 0.7 | 99.3 |
Table 7.
Changes of Theil index of public health in eastern, central and western regions.
Table 7.
Changes of Theil index of public health in eastern, central and western regions.
| Intra Group Theil Index | 2018 | 2019 | 2020 | 2021 | 2022 |
|---|
| Eastern region | 0.0242 | 0.0244 | 0.0217 | 0.0227 | 0.0230 |
| Central region | 0.0056 | 0.0050 | 0.0056 | 0.0034 | 0.0028 |
| Western region | 0.0061 | 0.0065 | 0.0078 | 0.0079 | 0.0080 |
Table 8.
Overall satisfaction with public health and safety (unit: %).
Table 8.
Overall satisfaction with public health and safety (unit: %).
| Project | Public Health Safety Evaluation Score | Mean Value |
|---|
| Very Poor | Relatively Poor | Commonly | Better | Very Nice | 1–5 |
|---|
| Public health safety satisfaction | 2.5 | 12.1 | 42.1 | 34.8 | 8.5 | 3.350 |
Table 9.
Perceived effectiveness of government public health governance (unit: %).
Table 9.
Perceived effectiveness of government public health governance (unit: %).
| Project | Rating Score of Worry Degree (Extremely Worried–Not Worried at all) | Mean Value |
|---|
| 1 | 2 | 3 | 4 | 5 | 6 | 7 | 9 | 10 | 1–10 | 5.059 |
|---|
| Preventive effectiveness | 12.1 | 7.3 | 11.7 | 11.2 | 15.8 | 10.0 | 9.6 | 9.9 | 5.0 | 7.2 | 5.104 |
| Regulatory effectiveness | 14.9 | 8.1 | 10.6 | 10.8 | 13.8 | 9.6 | 9.2 | 9.2 | 5.3 | 8.2 | 5.024 |
| Normative efficiency | 14.5 | 7.7 | 11.6 | 11.7 | 14.6 | 10.6 | 8.7 | 9.4 | 5.1 | 6.2 | 4.919 |
| Emergency management efficiency | 11.7 | 7.0 | 10.6 | 11.1 | 15.2 | 11.4 | 10.4 | 10.2 | 6.1 | 6.4 | 5.191 |
Table 10.
Perception of government credibility (unit:%).
Table 10.
Perception of government credibility (unit:%).
| Project | Evaluation Score of Government Credibility | Mean Value |
|---|
| 1 | 2 | 3 | 4 | 5 | (1–5) |
|---|
| Government credibility | | | | | | 3.280 |
| Expected degree | 2.7 | 11.2 | 53.6 | 29.2 | 3.3 | 3.191 |
| Confidence level | 2.5 | 10.4 | 47.0 | 35.1 | 5.0 | 3.297 |
| Degree of trust | 2.2 | 9.7 | 44.4 | 38.2 | 5.5 | 3.351 |
Table 11.
Correlation analysis between variables.
Table 11.
Correlation analysis between variables.
| Variable | Relevance | XN | GX | MY |
|---|
| Government public health governance effectiveness (XN) | Pearson correlation | 1 | | |
| Government credibility (GX) | Pearson correlation Sig (double tailed) | 0.215 **
0.000 | 1 | |
| Public health safety satisfaction (MY) | Pearson correlation Sig (double tailed) | 0.318 **
0.000 | 0.345 **
0.000 | 1 |
Table 12.
Overall model fitness test results of overall relationship model.
Table 12.
Overall model fitness test results of overall relationship model.
| Test Statistics | Adaptation Standard | Inspection Result Data | Model Adaptation Judgment |
|---|
| | Absolute fitness index | | |
| GFI value | >0.90 | 0.997 | Yes |
| AGFI value | >0.90 | 0.994 | Yes |
| RMR value | <0.05 | 0.026 | Yes |
| RMSEA value | <0.05 (good) <0.08 (reasonable) | 0.023 | Good |
| | Value added fitness index | | |
| NFI value | >0.90 | 0.997 | Yes |
| RFI value | >0.90 | 0.995 | Yes |
| CFI value | >0.90 | 0.998 | Yes |
| | Simple fitness index | | |
| X2/df value | 1 < x/df value < 3, good; 3 < x2/df value < 5, acceptable; 5 < x2/df value, poor | 5.987 | Poor |
| PNFI value | >0.50 | 0.570 | Yes |
| PGFI value | >0.50 | 0.443 | No |
Table 13.
Test results of the overall relationship model.
Table 13.
Test results of the overall relationship model.
| Relationship between Variables | Non-Standardized Estimation Results | Standardized Regression Coefficient |
|---|
| Non-Standardized Regression Coefficient | Standard Error | Critical Ratio Value | Significance |
|---|
| xn1←XN | 1 | | | | 0.802 |
| xn2←XN | 1.103 | 0.013 | 83.511 | …… | 0.844 |
| xn3←XN | 1.098 | 0.013 | 83.805 | …… | 0.875 |
| xn4←XN | 0.999 | 0.012 | 80.252 | …… | 0.808 |
| gx1←GX | 0.704 | | | …… | 0.704 |
| gx2←GX | 1.2 | 0.021 | 58.317 | …… | 0.807 |
| gx3←GX | 1.075 | 0.019 | 56.995 | …… | 0.724 |
Table 14.
Research assumptions and test results.
Table 14.
Research assumptions and test results.
| Relationship Between Variables | Non-Standardized Path Coefficient | Standardized Path Coefficient | Corresponding Assumption | Hypothesis Test Results |
|---|
| MY←XN | 0.104 | 0.251 *** | H1 | Support |
| GX Y←XN | 0.059 | 0.232 *** | H2 | Support |
| MY Y←GX | 0.527 | 0.326 *** | H3 | Support |
Table 15.
Intermediary effect test results.
Table 15.
Intermediary effect test results.
| Effect Type | Non-Standardized Test Results | Bias-Corrected | Percentile |
|---|
| Coefficient | Standard Error | 95% Confidence Interval | p | 95% Confidence Interval | p |
|---|
| Total effect | 0.143 | 0.005 | 0.133, 0.153 | 0.001 | 0.133, 0.153 | 0.001 |
| Indirect effect | 0.034 | 0.002 | 0.030, 0.039 | 0.001 | 0.030, 0.039 | 0.001 |
| Direct effect | 0.109 | 0.005 | 0100, 0.118 | 0.001 | 0.100, 0.118 | 0.001 |
| Disclaimer/Publisher’s Note: The statements, opinions and data contained in all publications are solely those of the individual author(s) and contributor(s) and not of MDPI and/or the editor(s). MDPI and/or the editor(s) disclaim responsibility for any injury to people or property resulting from any ideas, methods, instructions or products referred to in the content. |
© 2023 by the authors. Licensee MDPI, Basel, Switzerland. This article is an open access article distributed under the terms and conditions of the Creative Commons Attribution (CC BY) license (https://creativecommons.org/licenses/by/4.0/).


