
Active and Happy? Physical Activity and Life Satisfaction among Young Educated Women


Abstract

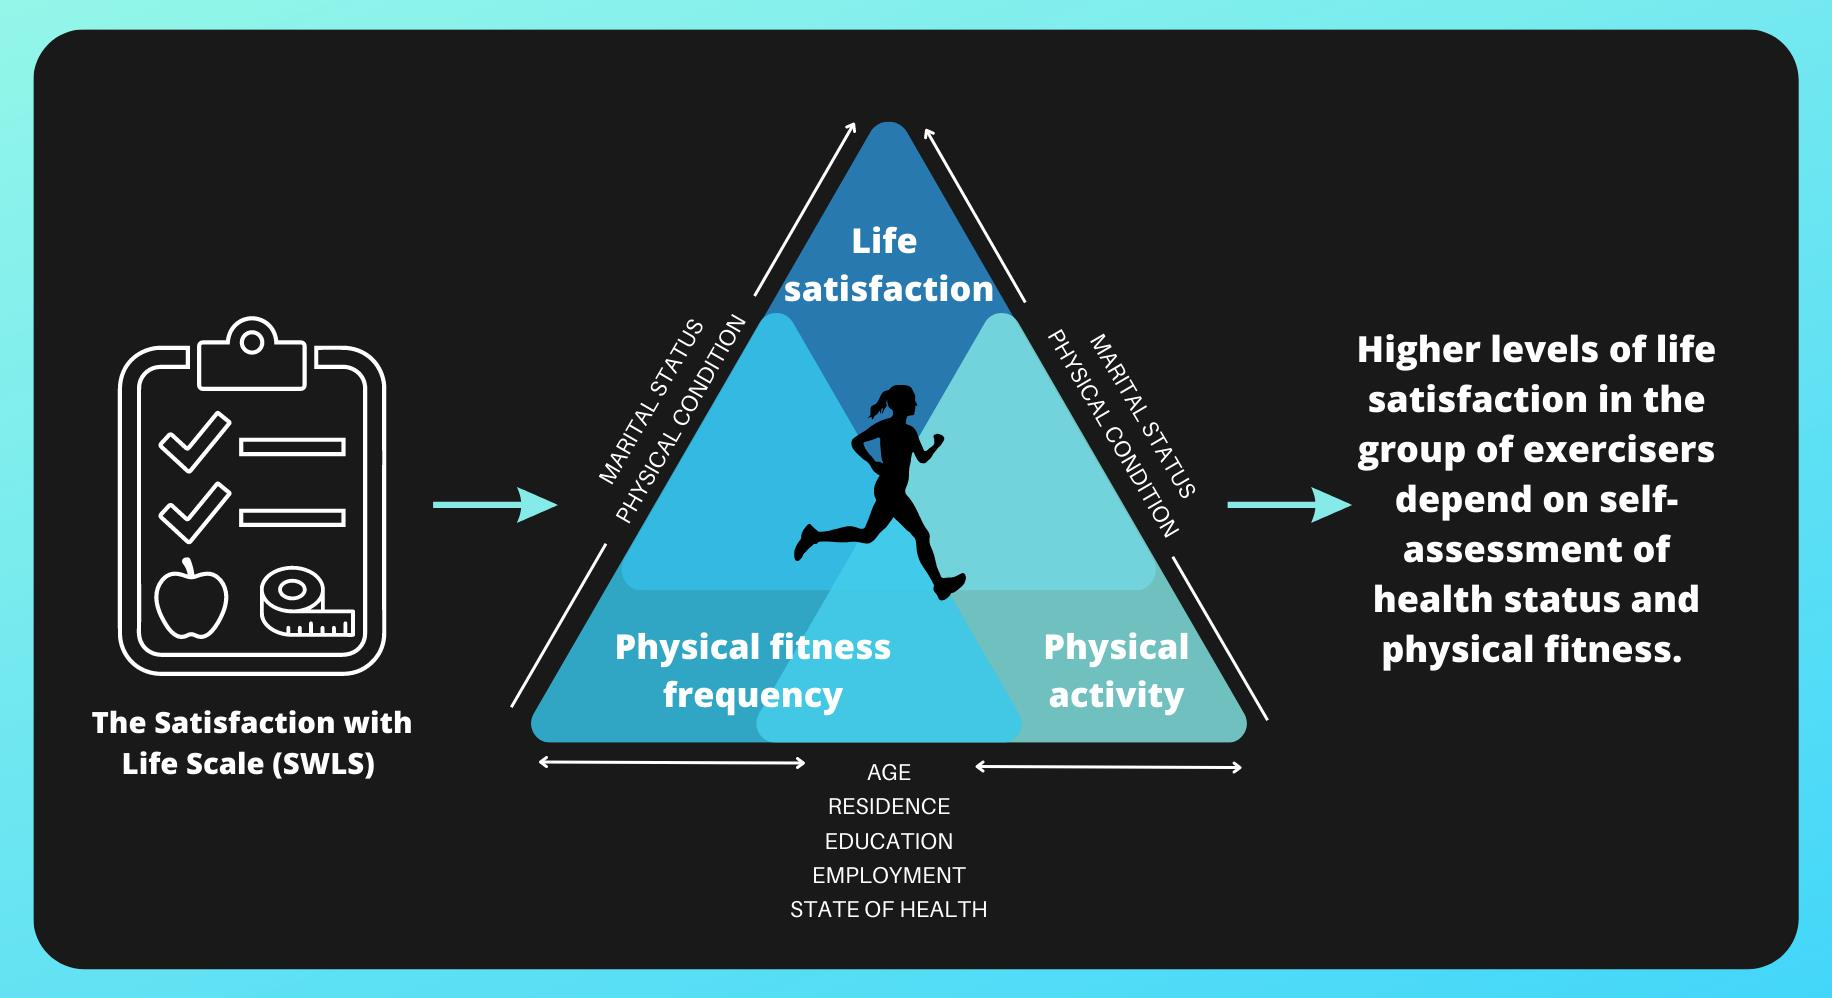
1. Introduction
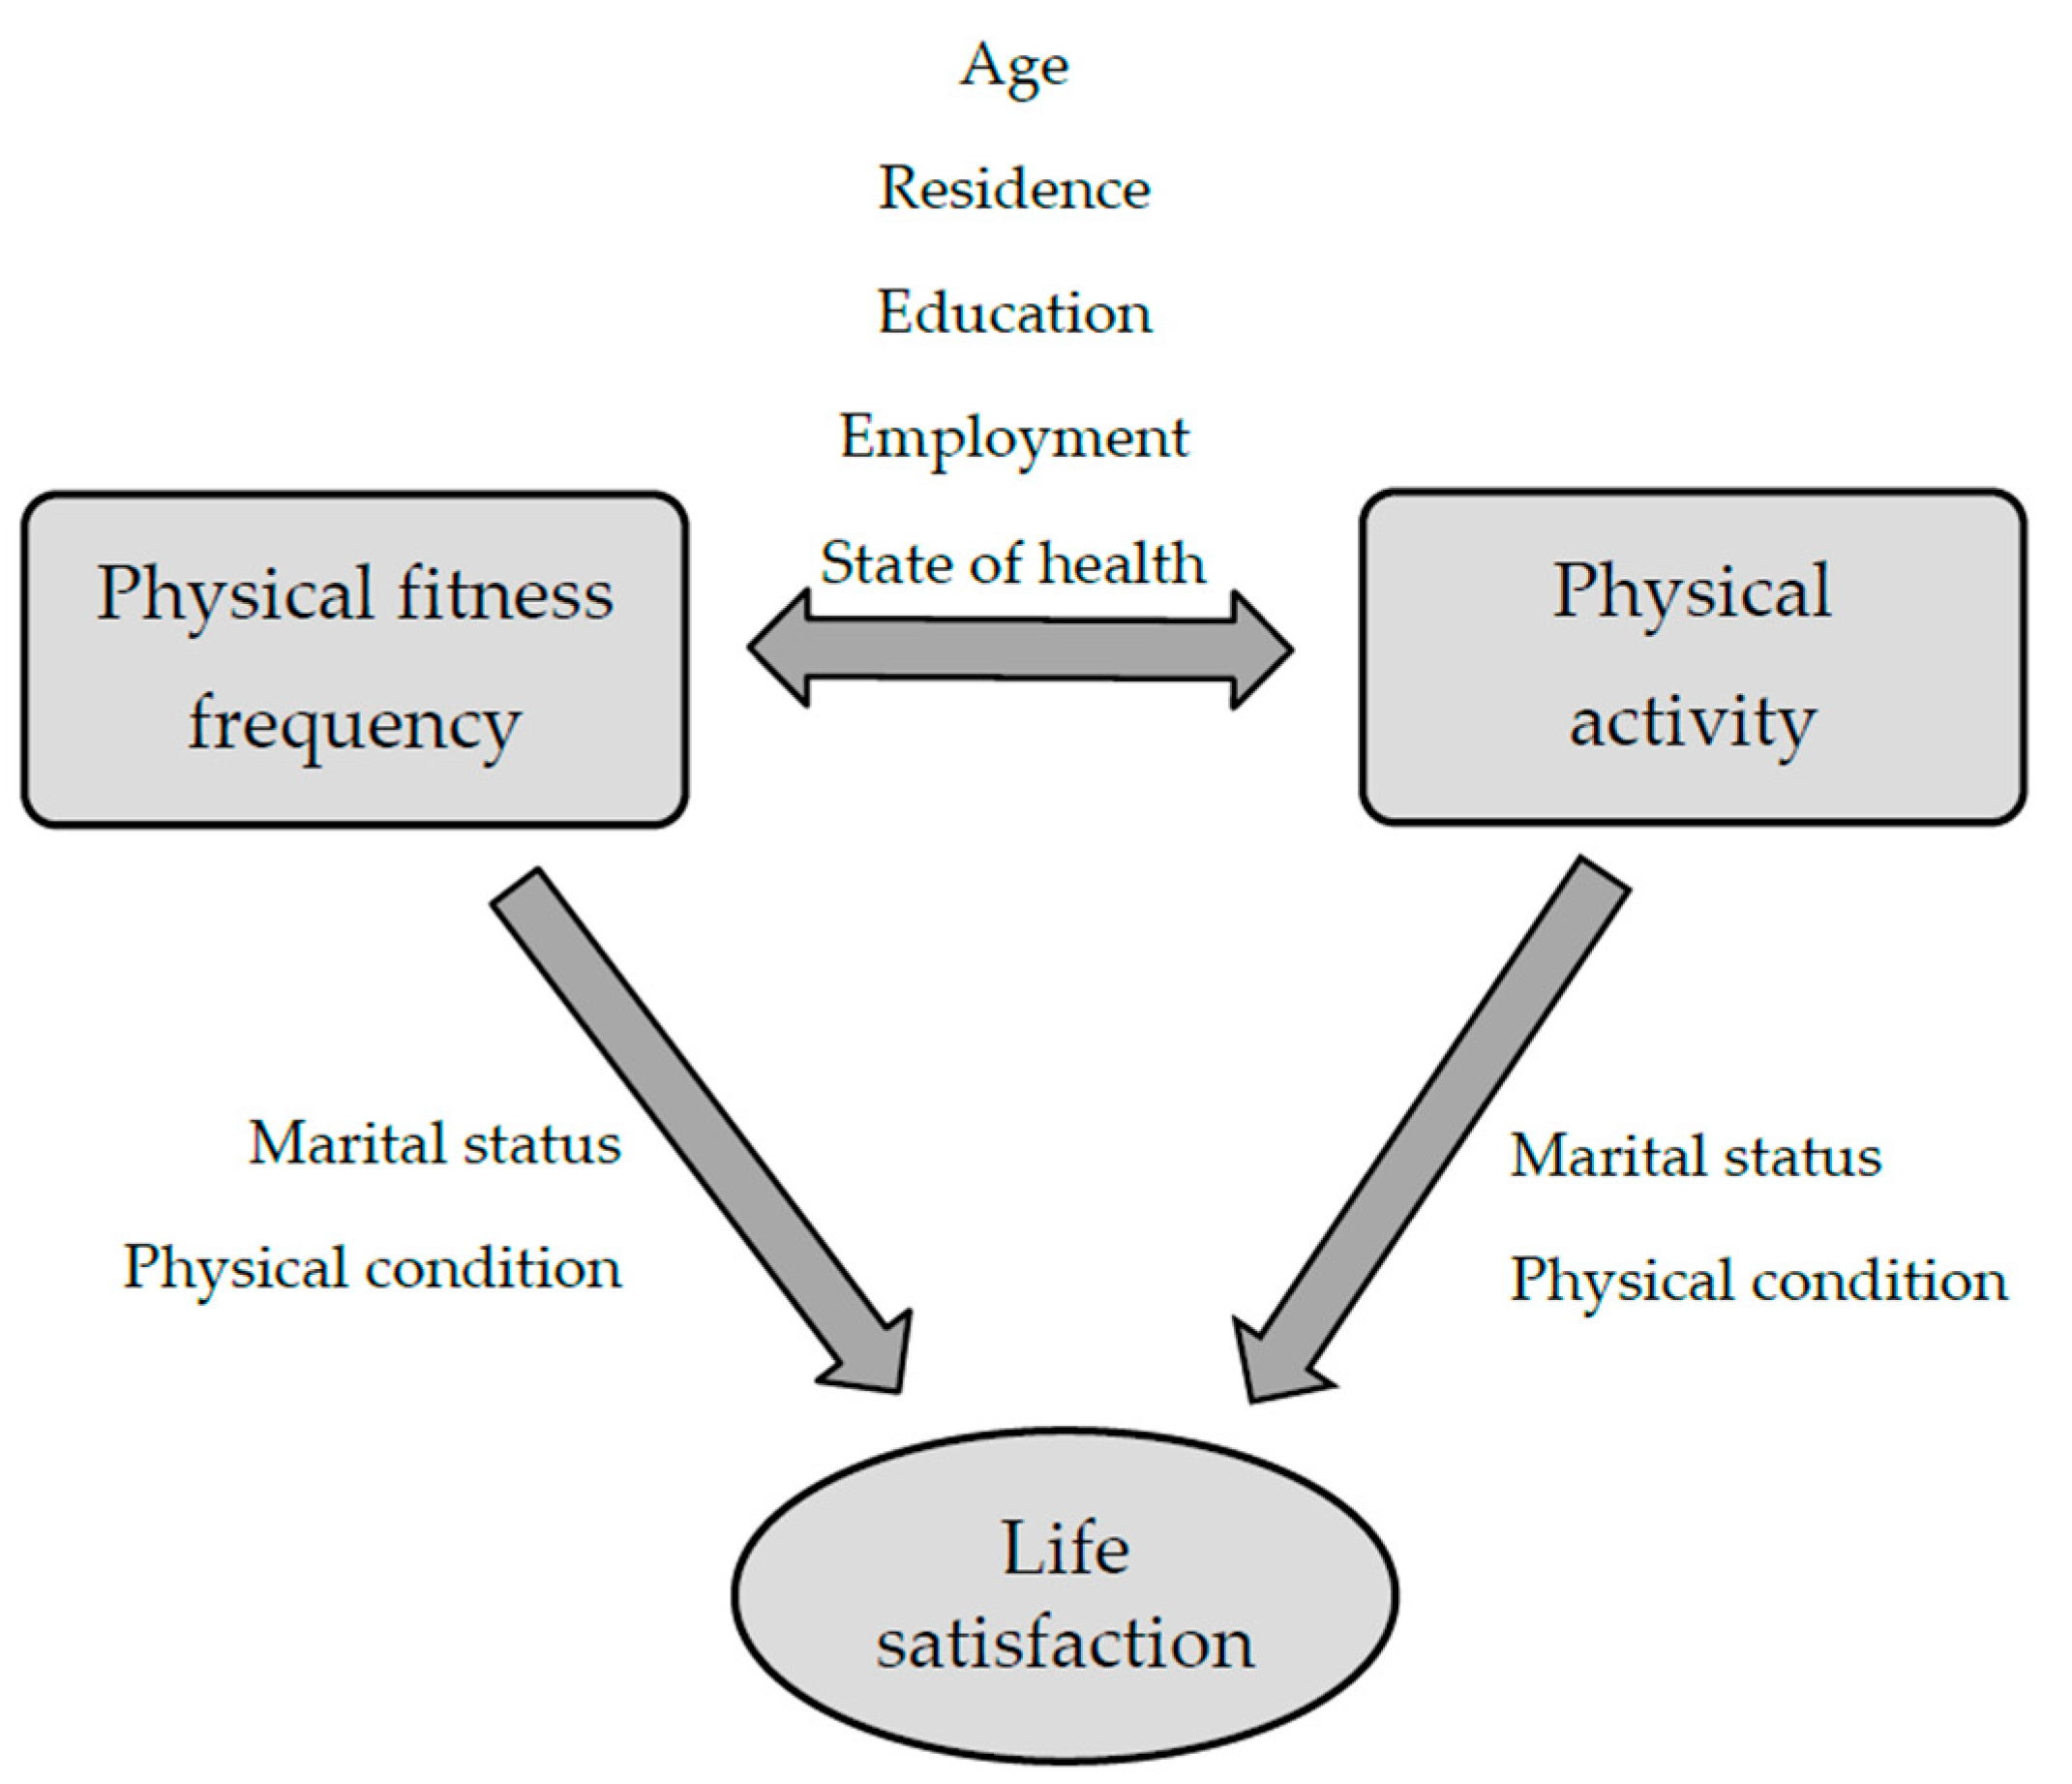
- Does the amount of time spent on physical activity and its frequency affect feelings of satisfaction with life?
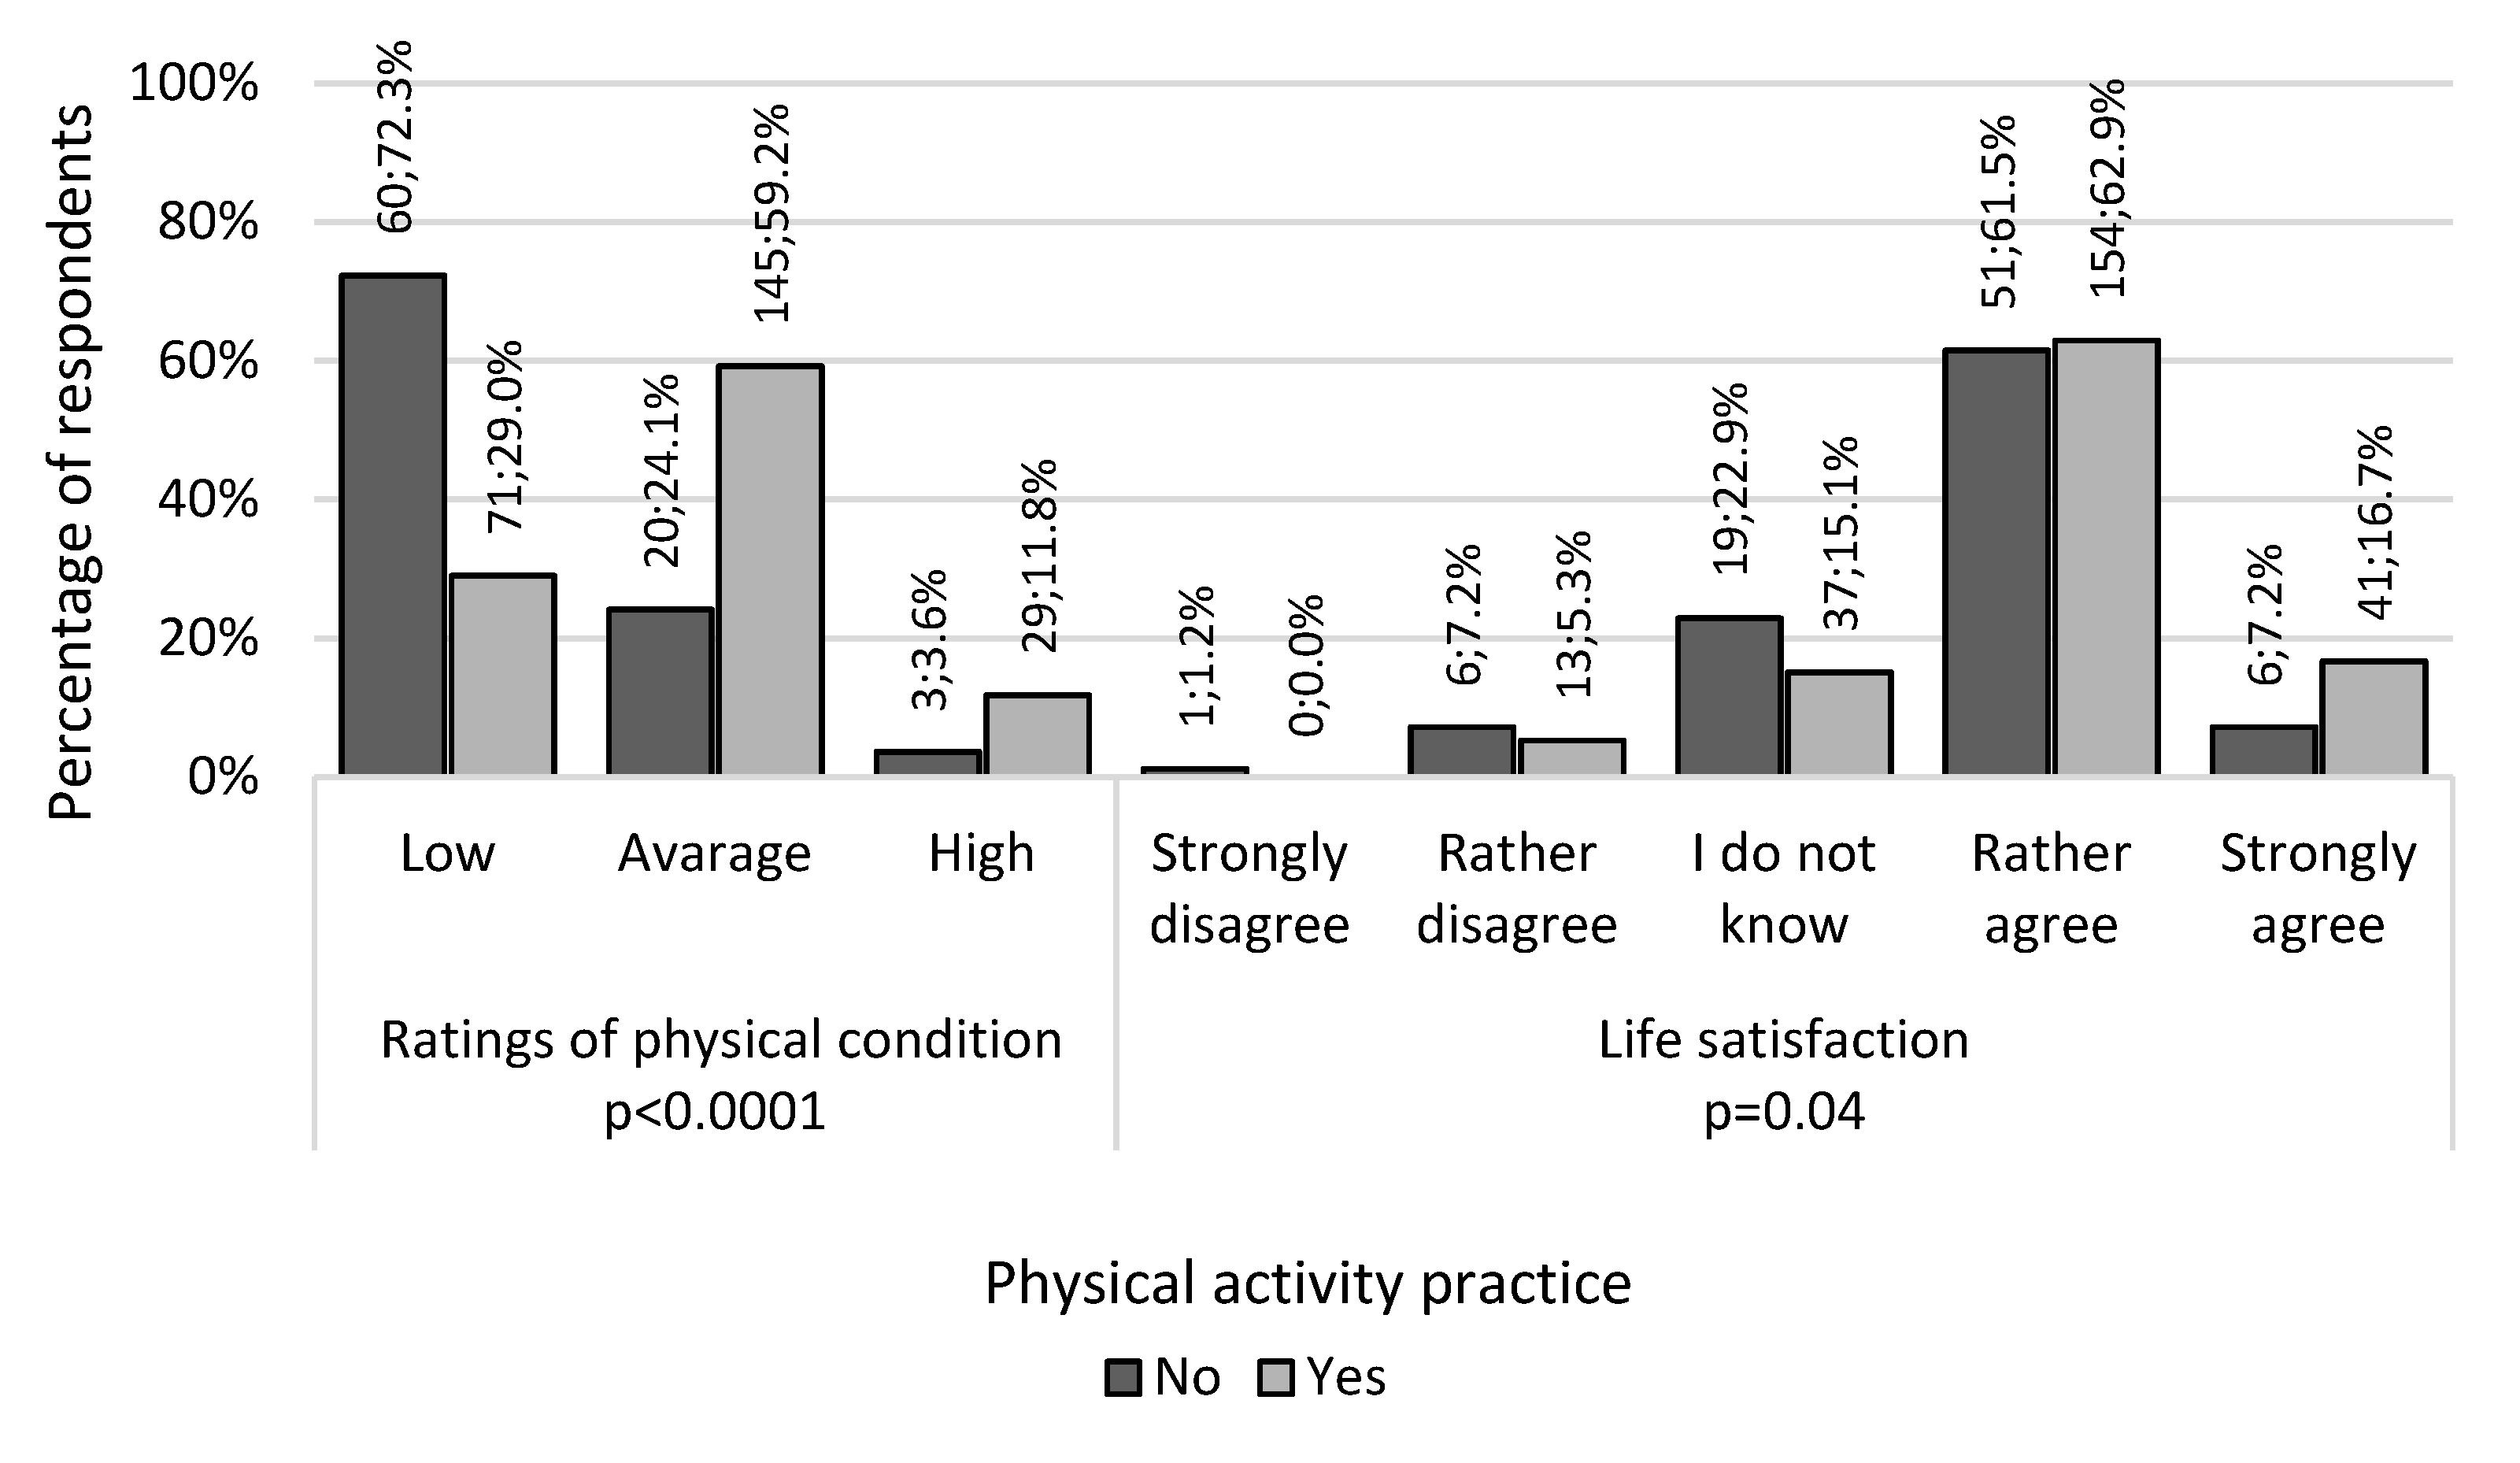
- Is there a difference in perception of one’s fitness among physically active and inactive people?
- Does the declared degree of physical fitness affect the subject’s life satisfaction?
2. Materials and Methods
2.1. Study Area
2.2. Characteristics of the Study Group
2.3. Eligibility Criteria
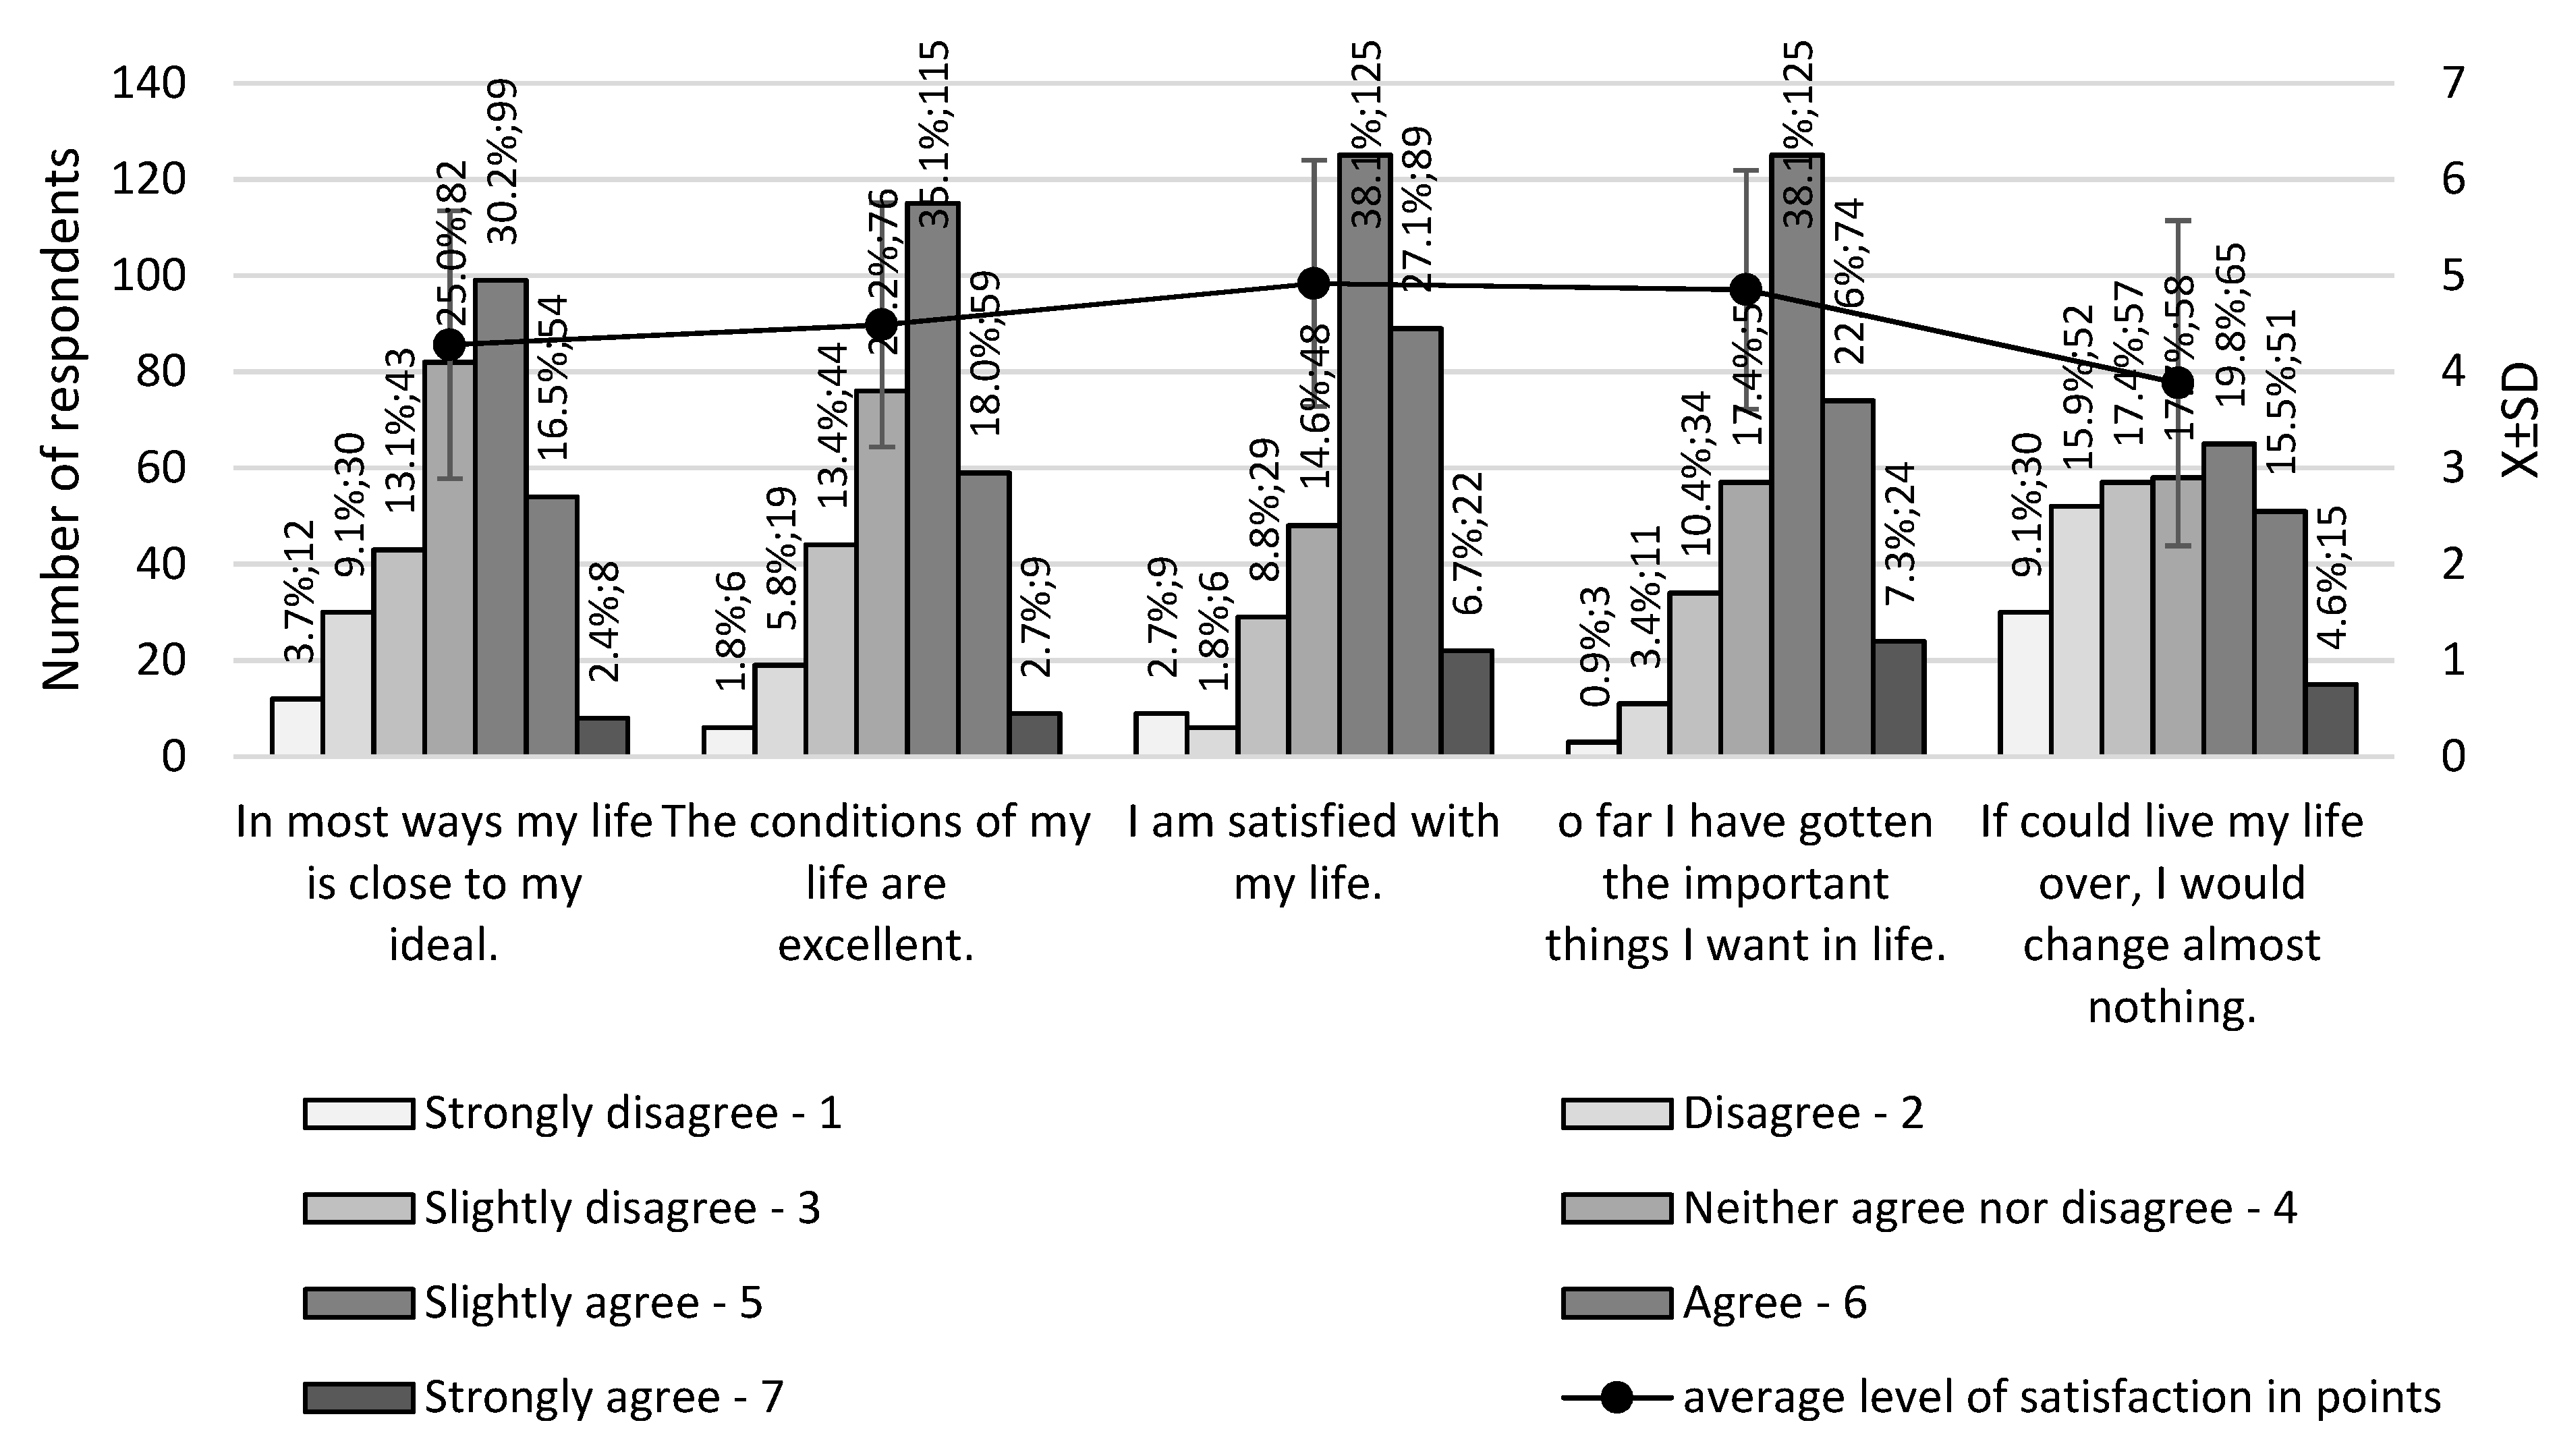
2.4. Research Tool
- In most ways, my life is close to my ideal.
- The conditions of my life are excellent.
- I am satisfied with my life.
- So far, I have gotten the important things I want in life.
- If I could live my life over, I would change almost nothing.
2.5. Statistical Analyses
3. Results
4. Discussion
5. Strengths and Limitations
6. Conclusions
Author Contributions
Funding
Institutional Review Board Statement
Data Availability Statement
Acknowledgments
Conflicts of Interest
References
- Leitzmann, M.F.; Park, Y.; Blair, A.; Ballard-Barbash, R.; Mouw, T.; Hollenbeck, A.R.; Schatzkin, A. Physical Activity Recommendations and Decreased Risk of Mortality. Arch. Intern. Med. 2007, 167, 2453–2460. [Google Scholar] [CrossRef] [PubMed]
- Stamatakis, E.; Gale, J.; Bauman, A.; Ekelund, U.; Hamer, M.; Ding, D. Sitting Time, Physical Activity, and Risk of Mortality in Adults. J. Am. Coll. Cardiol. 2019, 73, 2062–2072. [Google Scholar] [CrossRef] [PubMed]
- Bell, S.L.; Audrey, S.; Gunnell, D.; Cooper, A.; Campbell, R. The relationship between physical activity, mental wellbeing and symptoms of mental health disorder in adolescents: A cohort study. Int. J. Behav. Nutr. Phys. Act. 2019, 16, 1–12. [Google Scholar] [CrossRef]
- Bae, W.; Suh, Y.I.; Ryu, J.; Heo, J. Physical Activity Levels and Well-Being in Older Adults. Psychol. Rep. 2017, 120, 192–205. [Google Scholar] [CrossRef] [PubMed]
- Lee, I.M.; Shiroma, E.J.; Lobelo, F.; Puska, P.; Blair, S.N.; Katzmarzyk, P.T.; Lancet Physical Activity Series Working Group. Effect of physical inactivity on major non-communicable diseases worldwide: An analysis of burden of disease and life expectancy. Lancet 2012, 380, 219–229. [Google Scholar] [CrossRef] [PubMed]
- Moore, S.C.; Lee, I.M.; Weiderpass, E.; Campbell, P.T.; Sampson, J.N.; Kitahara, C.M.; Keadle, S.K.; Arem, H.; de Gonzalez, A.B.; Hartge, P.; et al. Association of Leisure-Time Physical Activity With Risk of 26 Types of Cancer in 1.44 Million Adults. JAMA Intern. Med. 2016, 176, 816–825. [Google Scholar] [CrossRef]
- Poirel, E. Bienfaits psychologiques de l’activité physique pour la santé mentale optimale. St. Ment. Au Québec. 2017, 42, 147–164. [Google Scholar] [CrossRef]
- Hasson, R.E.; Granados, K.E.; Marquez, D.X.; Bennett, G.; Freedson, P.; Braun, B. Psychological Responses to Acute Exercise in Sedentary Black and White Individuals. J. Phys. Act. Health 2011, 8, 978–987. [Google Scholar] [CrossRef]
- Kandola, A.; Vancampfort, D.; Herring, M.; Rebar, A.; Hallgren, M.; Firth, J.; Stubbs, B. Moving to Beat Anxiety: Epidemiology and Therapeutic Issues with Physical Activity for Anxiety. Curr. Psychiatry Rep. 2018, 20, 63. [Google Scholar] [CrossRef]
- Brown, H.E.; Gilson, N.D.; Burton, N.W.; Brown, W.J. Does Physical Activity Impact on Presenteeism and Other Indicators of Workplace Well-Being? Sports Med. 2011, 41, 249–262. [Google Scholar] [CrossRef]
- Kasprzak, E. Satisfaction with life as an emotional and cognitive category. Pol. Psychol Forum. 2012, 1, 187–199. [Google Scholar]
- Vankim, N.A.; Nelson, T.F. Vigorous physical activity, mental health, perceived stress, and socializing among college students. Am J Health Promot. 2013, 1, 7–15. [Google Scholar] [CrossRef] [PubMed]
- Nowak, P.F.; Bożek, A.; Blukacz, M. Physical Activity, Sedentary Behavior, and Quality of Life among University Students. BioMed Res. Int. 2019, 2019, 1–10. [Google Scholar] [CrossRef] [PubMed]
- Saunders, M.; Lewis, P.; Thornhill, A. Research Methods for Business Students, 6th ed.; Pearson Education Limited: Edinburgh, UK, 2016; pp. 226–234. [Google Scholar]
- Statistic Poland. Population. Size and Structure and Vital Statistics in Poland by Territorial Division in 2019. As of 30th June. Warsaw, 2019. Statistics Poland, Demographic Surveys Department. Available online: https://stat.gov.pl/obszary-tematyczne/ludnosc/ludnosc/ludnosc-stan-i-struktura-w-przekroju-terytorialnym-stan-w-dniu-30-06-2019,6,26.html (accessed on 20 November 2022).
- Law of March 14, 2014, Amending the Law on Promotion of Employment and Labor Market Institutions and Some Other Laws. OJ 201; item 598. Available online: https://eli.gov.pl/eli/DU/2014/598/ogl (accessed on 20 November 2022).
- Jankowski, K.S. Czy zmiana chronotypu wiąże się ze zmianą samopoczucia? Bad. Rytmu Biol. 2015, 46, 237–248. [Google Scholar]
- Diener, E.; Emmons, R.A.; Larsen, R.J.; Griffin, S. Skala zadowolenia z życia. J. Personal. Assess. 1985, 49, 71–75. [Google Scholar] [CrossRef]
- Maher, J.P.; Pincus, A.L.; Ram, N.; Conroy, D.E. Daily physical activity and life satisfaction across adulthood. Dev. Psychol. 2015, 51, 1407–1419. [Google Scholar] [CrossRef]
- Hultell, D.; Gustavsson, J.P. A psychometric evaluation of the Satisfaction with Life Scale in a Swedish nationwide sample of university students. Pers. Individ. Differ. 2008, 44, 1070–1079. [Google Scholar] [CrossRef]
- Vázquez, C.; Duque, A.; Hervás, G. Satisfaction with Life Scale in a Representative Sample of Spanish Adults: Validation and Normative Data. Span. J. Psychol. 2013, 16, E82. [Google Scholar] [CrossRef]
- Swami, V.; Chamorro-Premuzic, T. Psychometric Evaluation of the Malay Satisfaction With Life Scale. Soc. Indic. Res. 2008, 92, 25–33. [Google Scholar] [CrossRef]
- Vera-Villarroel, P.; Urzua, A.; Pavez, P.; Celis-Atenas, K.; Silva, J. Evaluation of subjective well-being: Analysis of the Satisfaction with Life Scale in the Chilean population. Univ. Psychol. 2012, 11, 728. [Google Scholar] [CrossRef]
- Maher, J.P.; Conroy, D.E. Daily Life Satisfaction in Older Adults as a Function of (In)Activity. J. Gerontol. B Psychol. Sci. Soc. Sci. 2017, 72, 593–602. [Google Scholar] [CrossRef]
- An, H.Y.; Chen, W.; Wang, C.W.; Yang, H.-F.; Huang, W.T.; Fan, S.Y. The Relationships between Physical Activity and Life Satisfaction and Happiness among Young, Middle-Aged, and Older Adults. Int. J. Environ. Res. Public Health 2020, 17, 4817. [Google Scholar] [CrossRef] [PubMed]
- Czapinski, J.; Panek, T. (Eds.) Social Diagnosis 2000–2015. Available online: http://www.diagnoza.com (accessed on 20 November 2022).
- Sánchez, M.W.; Cabaco, A.S.; Bonete-López, B.; Litago, J.D.U.; Loureiro, M.J.; Mejía, M. Physical Activity and Life Satisfaction: An Empirical Study in a Population of Senior Citizens. Front. Psychol. 2021, 12, 636914. [Google Scholar] [CrossRef] [PubMed]
- Zapata-Lamana, R.; Poblete-Valderrama, F.; Ledezma-Dames, A.; Pavón-León, P.; Leiva, A.M.; Fuentes-Alvarez, M.T.; Cigarroa, I.; Parra-Rizo, M.A. Health, Functional Ability, and Environmental Quality as Predictors of Life Satisfaction in Physically Active Older Adults. Soc. Sci. 2022, 11, 265. [Google Scholar] [CrossRef]
- Borg, C.; Hallberg, I.R.; Blomqvist, K. Life satisfaction among older people (65+) with reduced self-care capacity: The relationship to social, health and financial aspects. J. Clin. Nurs. 2006, 15, 607–618. [Google Scholar] [CrossRef]
- Barki, N.; Choudhry, F.R.; Munawar, K. The satisfaction with life scale: Psychometric properties in Pakistani population. Med. J. Islam. Repub. Iran 2020, 34, 1086–1091. [Google Scholar] [CrossRef]
- Portela, M.; Neira, I.; Salinas-Jiménez, M.D.M. Social Capital and Subjective Wellbeing in Europe: A New Approach on Social Capital. Soc. Indic. Res. 2012, 114, 493–511. [Google Scholar] [CrossRef]
- Rözer, J.; Kraaykamp, G. Income Inequality and Subjective Well-being: A Cross-National Study on the Conditional Effects of Individual and National Characteristics. Soc. Indic. Res. 2012, 113, 1009–1023. [Google Scholar] [CrossRef]
- Swift, H.J.; Vauclair, C.-M.; Abrams, D.; Bratt, C.; Marques, S.; Lima, M.-L.; Abrams, W.D.J. Revisiting the Paradox of Well-being: The Importance of National Context. J. Gerontol. B Psychol. Soc. Sci. 2014, 69, 920–929. [Google Scholar] [CrossRef]
- Helliwell, J.F.; Putnam, R.D. The social context of well–being. Philos. Trans. R. Soc. B Biol. Sci. 2004, 359, 1435–1446. [Google Scholar] [CrossRef]
- Rodríguez-Pose, A.; von Berlepsch, V. Social Capital and Individual Happiness in Europe. J. Happiness Stud. 2013, 15, 357–386. [Google Scholar] [CrossRef]
- Orviska, M.; Caplanova, A.; Hudson, J. The Impact of Democracy on Well-being. Soc. Indic. Res. 2012, 115, 493–508. [Google Scholar] [CrossRef]
- Chen, H.L.; Lee, P.F.; Chang, Y.C.; Hsu, F.S.; Tseng, C.Y.; Hsieh, X.Y.; Ho, C.C. The Association between Physical Fitness Performance and Subjective Happiness among Taiwanese Adults. Int. J. Environ. Res. Public Health 2020, 17, 3774. [Google Scholar] [CrossRef] [PubMed]
- Kotarska, K.; Nowak, M.; Nowak, L.; Król, P.; Sochacki, A.; Sygit, K.; Sygit, M. Physical Activity and Quality of Life of University Students, Their Parents, and Grandparents in Poland—Selected Determinants. Int. J. Environ. Res. Public Health 2021, 18, 3871. [Google Scholar] [CrossRef] [PubMed]
- Białek-Dratwa, A.; Staśkiewicz, W.; Grajek, M.; Filip, A.; Rozmiarek, M.; Krupa-Kotara, K.; Kowalski, O. Body Composition and Its Perception among Professional Female Volleyball Players and Fitness Athletes (Silesia, Poland). Int. J. Environ. Res. Public Health 2022, 19, 11891. [Google Scholar] [CrossRef] [PubMed]
- Iwon, K.; Skibinska, J.; Jasielska, D.; Kalwarczyk, S. Elevating Subjective Well-Being Through Physical Exercises: An Intervention Study. Front. Psychol. 2021, 12, 702678. [Google Scholar] [CrossRef]
- Eek, F.; Larsson, C.; Wisén, A.; Hansson, E.E. Self-Perceived Changes in Physical Activity and the Relation to Life Satisfaction and Rated Physical Capacity in Swedish Adults during the COVID-19 Pandemic—A Cross Sectional Study. Int. J. Environ. Res. Public Health 2021, 18, 671. [Google Scholar] [CrossRef]
- Blom, V.; Lönn, A.; Ekblom, B.; Kallings, L.V.; Väisänen, D.; Hemmingsson, E.; Andersson, G.; Wallin, P.; Stenling, A.; Ekblom, Ö.; et al. Lifestyle Habits and Mental Health in Light of the Two COVID-19 Pandemic Waves in Sweden, 2020. Int. J. Environ. Res. Public Health 2021, 18, 3313. [Google Scholar] [CrossRef]
- Dahlen, M.; Thorbjørnsen, H.; Sjåstad, H.; Wågert, P.V.H.; Hellström, C.; Kerstis, B.; Lindberg, D.; Stier, J.; Elvén, M. Changes in Physical Activity Are Associated with Corresponding Changes in Psychological Well-Being: A Pandemic Case Study. Int. J. Environ. Res. Public Health 2021, 18, 10680. [Google Scholar] [CrossRef]
- Elvén, M.; Kerstis, B.; Stier, J.; Hellström, C.; Wågert, P.V.H.; Dahlen, M.; Lindberg, D. Changes in Physical Activity and Sedentary Behavior before and during the COVID-19 Pandemic: A Swedish Population Study. Int. J. Environ. Res. Public Health 2022, 19, 2558. [Google Scholar] [CrossRef]


| Variables | Total N = 328 | Physical Activity Practice | p-Value | ||
|---|---|---|---|---|---|
| No n (%) | Yes n (%) | ||||
| Age | [years]. | 23 (21–26) | 22 (21–25) | 24 (21–26) | 0.01 |
| Location residence | Village | 66 (20.1) | 27 (40.9) | 39 (59.1) | 0.004 |
| City up to 150,000. | 86 (26.2) | 17 (19.8) | 69 (80.2) | ||
| A city of more than 150,000. | 176 (53.7) | 39 (22.2) | 137 (77.8) | ||
| Education | Medium | 167 (50.9) | 55 (32.9) | 112 (67.1) | 0.001 |
| Higher | 161 (49.1) | 28 (17.4) | 133 (82.6) | ||
| Employment status | Pupil/student | 175 (53.4) | 61 (34.9) | 114 (65.1) | <0.0001 |
| Employed/working | 153 (46.6) | 22 (14.4) | 131 (85.6) | ||
| Marital status | Free | 109 (33.2) | 28 (25.7) | 81 (74.3) | 0.84 |
| In an informal relationship | 199 (60.7) | 51 (25.6) | 148 (74.4) | ||
| In marriage | 20 (6.1) | 4 (20.0) | 16 (80.0) | ||
| Smoking | Not | 234 (71.3) | 54 (23.1) | 180 (76.9) | 0.14 |
| Yes | 94 (28.7) | 29 (30.9) | 65 (69.1) | ||
| Alcohol | Not | 36 (11.0) | 12 (33.3) | 24 (66.7) | 0.24 |
| Yes | 292 (89.0) | 71 (24.3) | 221 (75.7) | ||
| Disease chronic | Not | 265 (80.8) | 64 (24.2) | 201 (75.8) | 0.32 |
| Yes | 63 (19.2) | 19 (30.2) | 44 (69.8) | ||
| Subjective assessment state of health | Rather badly | 8 (2.4) | 4 (50) | 4 (50) | <0.0001 |
| On average | 66 (20.1) | 30 (45.5) | 36 (54.6) | ||
| Rather well | 192 (58.5) | 41 (21.4) | 151 (78.7) | ||
| Very good | 62 (18.9) | 8 (12.9) | 54 (87.1) | ||
| The Average Level of Satisfaction According to SWLS Scale | Model 1 | Model 1′ | Model 2 | Model 2′ | |||||
|---|---|---|---|---|---|---|---|---|---|
| Data | b | p-Value | b | p-Value | b | p-Value | b | p-Value | |
| Physical activity practice | Not | - | - | - | - | - | - | ||
| Yes | 0.01 | 0.87 | 0.03 | 0.67 | |||||
| Age | [years] | 0.04 | 0.19 | - | - | 0.18 | 0.31 | - | - |
| Location residence | Village | - | - | - | - | - | - | - | - |
| City up to 150,000 | 0.08 | 0.37 | 0.15 | 0.78 | |||||
| City of more than 150,000 | −0.05 | 0.52 | −0.04 | 0.94 | |||||
| Education | Medium | - | - | - | - | - | - | - | - |
| Higher | 0.03 | 0.68 | 0.18 | 0.69 | |||||
| Activity professional | Pupil/student | - | - | - | - | - | - | - | - |
| Employed/working | −0.15 | 0.06 | −0.69 | 0.17 | |||||
| Marital status | Free/non | - | - | - | - | - | - | - | - |
| In a relationship Informal | −0.12 | 0.23 | −0.17 | 0.09 | −0.85 | 0.16 | −0.21 | 0.06 | |
| In a relationship Married | 0.35 | 0.04 | 0.41 | 0.01 | 1.91 | 0.06 | 0.44 | 0.01 | |
| Smoking | Not | - | - | - | - | - | - | - | - |
| Yes | −0.03 | 0.60 | −0.04 | 0,50 | −0.10 | 0.78 | −0.04 | 0.62 | |
| Alcohol | Not | - | - | - | - | - | - | - | - |
| Yes | 0.10 | 0.30 | 0.11 | 0.23 | 0.36 | 0.55 | 0.04 | 0.76 | |
| Disease chronic | Not | - | - | - | - | - | - | - | - |
| Yes | 0.04 | 0.62 | 0.02 | 0.77 | 0.31 | 0.50 | 0.03 | 0,76 | |
| A subjective assessment of state of health | Rather bad | - | - | - | - | - | - | - | - |
| Average | −0.01 | 0.91 | −1.28 | 0.21 | |||||
| Rather good | 0.24 | 0.04 | 0.54 | 0.51 | |||||
| Very good | 0.38 | 0.01 | 1.52 | 0.10 | |||||
| Subjective assessment ofphysical condition | Low | - | - | - | - | - | - | - | - |
| Average | 0.03 | 0.71 | 0.04 | 0.62 | 0.33 | 0.51 | 0.07 | 0.48 | |
| High | 0.29 | 0.03 | 0.33 | 0.01 | 1.32 | 0.07 | 0.30 | 0.04 | |
| Frequency of practicing physical activity | Occasionally | - | - | - | - | - | - | - | - |
| Once a week | 0.27 | 0.75 | 0.03 | 0.86 | |||||
| Several or more times a week | 0.46 | 0.53 | 0.16 | 0.25 | |||||
| Unit training | Less than 1 h | - | - | - | - | - | - | - | - |
| 1 h | 0.01 | 0.98 | 0.03 | 0.80 | |||||
| 2 h and more | 0.02 | 0.98 | 0.02 | 0.90 | |||||
Disclaimer/Publisher’s Note: The statements, opinions and data contained in all publications are solely those of the individual author(s) and contributor(s) and not of MDPI and/or the editor(s). MDPI and/or the editor(s) disclaim responsibility for any injury to people or property resulting from any ideas, methods, instructions or products referred to in the content. |
© 2023 by the authors. Licensee MDPI, Basel, Switzerland. This article is an open access article distributed under the terms and conditions of the Creative Commons Attribution (CC BY) license (https://creativecommons.org/licenses/by/4.0/).
Share and Cite
Wypych-Ślusarska, A.; Majer, N.; Krupa-Kotara, K.; Niewiadomska, E. Active and Happy? Physical Activity and Life Satisfaction among Young Educated Women. Int. J. Environ. Res. Public Health 2023, 20, 3145. https://doi.org/10.3390/ijerph20043145
Wypych-Ślusarska A, Majer N, Krupa-Kotara K, Niewiadomska E. Active and Happy? Physical Activity and Life Satisfaction among Young Educated Women. International Journal of Environmental Research and Public Health. 2023; 20(4):3145. https://doi.org/10.3390/ijerph20043145
Chicago/Turabian StyleWypych-Ślusarska, Agata, Natalia Majer, Karolina Krupa-Kotara, and Ewa Niewiadomska. 2023. "Active and Happy? Physical Activity and Life Satisfaction among Young Educated Women" International Journal of Environmental Research and Public Health 20, no. 4: 3145. https://doi.org/10.3390/ijerph20043145
APA StyleWypych-Ślusarska, A., Majer, N., Krupa-Kotara, K., & Niewiadomska, E. (2023). Active and Happy? Physical Activity and Life Satisfaction among Young Educated Women. International Journal of Environmental Research and Public Health, 20(4), 3145. https://doi.org/10.3390/ijerph20043145