Abstract
Child marriage, which the UN’s Sustainable Development Goal seeks to eliminate by 2030, represents a violation of the human rights of children. These concerns are driven by the negative impact of child marriage on the health of children married in childhood and their children. Little is known about the association between child marriage and disability. We sought to estimate the strength of association between disability and child marriage among women and men in middle- and low-income countries (LMICs). Secondary analysis was undertaken of nationally representative samples involving 423,164 women in 37 LMICs and 95,411 men in 28 LMICs. Results were aggregated by random effects meta-analysis and mixed effects multilevel multivariate modelling. The prevalence of disability was significantly greater among women and men who were married in childhood, especially among those married under the age of 16. The strength of these associations varied by age group and age at first marriage. Further research is required to understand the causal pathways responsible for the increased likelihood of disability among women and men married in childhood. National initiatives to eliminate child marriage may need to consider making reasonable accommodations to policies to ensure these are equally effective for women and men with disabilities.
1. Introduction
Child marriage (defined by the UN as marriage under the age of 18) is considered by the UN as both a violation of the human rights of children and as a hindrance to national development [1]. Sustainable Development Goal target 5.3 seeks to eliminate the practice of child marriage by 2030. These concerns are driven by the documented impact of child marriage on the health of children married in childhood and their children [2,3,4,5,6,7,8,9,10,11,12], increased exposure to intimate partner violence [2,3], reduced literacy, lower access to education, reduced earning and wealth [2,3,13] and the significant economic costs associated with these consequences [2,3]. However, as recently as 2013 child marriage under 18 was legally permitted in 52% (for girls) and 33% (for boys) of the World’s countries [14].
Between 2010 and 2016, 21% of women aged 20–24 were married (or began a de facto marital relationship) in childhood [15]. Although less attention has been paid to child marriage among boys, it has recently been estimated that 5.4% of men aged 20–24 were married or began a de facto marital relationship when they were still children [16]. While child marriage occurs in high-income countries [17], it is particularly prevalent in LMICs in South Asia and Sub-Saharan Africa [1,15,18,19,20,21], in rural areas [21] and among poorer children and children with lower levels of education [4,18,21,22].
Very little attention has been paid to the relationship between child marriage and disability. UNICEF’s report on progress towards ending child marriage made no mention of disability [1]. UNICEF’s report on the situation of children with disabilities made no mention of child marriage [23]. This is surprising as: (1) child marriage is associated with poorer health and increased risk of exposure to well-established determinants of poorer health and disability [2,3,4,5,6,7,8,9,10,11,12,24]; and (2) the marginalised status of children with disabilities may place them at greater risk of enforced and/or early marriage [25].
To date, we are aware of only one population-based study that has investigated the association between disability and child marriage, which reported that among 20–29 year old women in Ghana child marriage was associated with an increased prevalence of limitations in activities of daily living [24]. Our aim was to estimate the strength of association between disability and child marriage among women and men in a range of middle- and low-income countries.
2. Materials and Methods
We undertook secondary analysis of data collected in Round 6 (2017-) of UNICEF’s Multiple Indicator Cluster Surveys (MICS) [26,27]. As an UN programme, all UN member States have the option of participating in MICS. However, the content of MICS is primarily focused on the situation of women and children living in LMICs. Following approval, MICS data were downloaded from http://mics.unicef.org/ (accessed on 8 November 2022). All countries used cluster sampling methods to derive samples representative of the national population of children, women and, in most countries, men. Details of these procedures and arrangements for ethical review used in each country are available at http://mics.unicef.org/ (accessed on 8 November 2022). At the end of the download period (February 2022), nationally representative survey data containing data on adult disability status and age of marriage were available for 37 LMICs (Table 1), representing 27% of all LMICs.

Table 1.
Country-level survey data for 37 middle- and low-income countries.
2.1. Disabilities
The Washington Group Short Set of Questions on Disability (WGSS) was used to identify disability among participants aged 18–49. The measure is based on self-report of difficulties in six different functional domains (seeing, hearing, walking, remembering/concentrating, self-care, communicating), each with four response options (‘no difficulty’, ‘yes—some difficulty’, ‘yes—a lot of difficulty’, ‘cannot do at all’). WGSS defines disability if the person reports ‘a lot of difficulty’ or ‘cannot do at all’ in one or more domain. Given concern has been expressed about the under identification of people with less severe disability by the WGSS [28,29,30], we also used Bourke’s method to identify respondents with ‘less severe’ disability if they were not identified as having WGSS defined disability but reported ‘some difficulty’ in two or more functional domains. Disability data were missing for 0.01% of respondents.
2.2. Child Marriage Status
Informants were asked whether they had ‘ever been married or lived together with someone as if married’ and their age ‘when you started living with your husband/partner’ or ‘first (husband/partner)’. We coded child marriage as yes if they had entered a marital (or de facto marital) relationship under the age of 18 and as no if they had not entered such a relationship. Given several authors have stressed the importance of investigating age at which child marriage occurred [5,31,32], we created two specific groups of child marriage: (1) those married at 16 or 17; (2) those married under the age of 16. Data were missing on marital status for 0.06% of participants. Age at first union information was missing for <0.01% of respondents who had entered such a relationship.
2.3. Country Characteristics
Given the association between wellbeing and national wealth in LMICs [33], we used the World Bank 2018 country classification as upper middle income, lower middle income and low income [34]. These classifications are based on per capita Gross National Income adjusted for purchasing power parity (pcGNI; expressed as current USD rates) using the World Bank’s Atlas Method. We downloaded 2018 pcGNI from the World Bank website in May 2020 [35,36].
2.4. Household Wealth
MICS data include a within-country wealth index for each household (recoded into within-country quintiles) based on ownership of consumer goods, dwelling characteristics, water and sanitation, and other characteristics that are related to the household’s wealth. The wealth index is assumed to capture underlying long-term wealth through information on the household assets [37,38]. No data were missing for respondents with valid disability data.
2.5. Highest Level of Education
The highest level of education received by each participant was recorded using country-specific categories. We recoded these data into a three-category measure: (1) no education; (2) primary education; (3) receipt of secondary or higher-level education. Data were missing for 0.02% of respondents with valid disability data.
2.6. Approach to Analysis
First, we estimated the prevalence and predictors of disability and of child marriage. For both we used bivariate descriptive statistics to estimate prevalence (with 95% confidence intervals) in each participating country using the survey data analysis routines in Stata 16 [39] to address the clustered sampling techniques used in MICS and UNICEF’s country-specific person-level inverse probability weights to take account of biases in sampling frames and non-response. We also used mixed effects multilevel multivariate modelling (xtmepoisson in Stata (version 16, StataCorp LLC, College Station, TX, USA) to generate prevalence rate ratios (unbiased estimates of risk) to estimate the association of both disability and child marriage with participant age, highest level of education and within-country household wealth (measured in quintiles) [40].
Second, we estimated the strength of association between disability and child marriage. As above, we report country level data using bivariate descriptive statistics. Given the association between age and the prevalence of disability and the prevalence of child marriage, we used Poisson regression to estimate age-adjusted prevalence rate ratios for the likelihood of child marriage among participants with disability (participants without disability being the reference group). We then provide aggregated results by meta-analysis (using the restricted maximum likelihood (REML) method in Stata 16). Given the high heterogeneity of some of the meta-analyses, as a sensitivity analysis, we aggregated results across countries by mixed effects multilevel multivariate modelling.
Third, to gain a better understanding of the nature of the relationship between disability and child marital status, we stratified the above analyses by participant age group.
All analyses using mixed effects multilevel multivariate modelling specified random effects to allow both the slope and intercept of the relationship between disability and child marriage to vary across countries Given the small amount of missing data, complete case analyses were undertaken. The main analytic sample comprised 423,164 women across 37 LMICs and 95,411 men across 28 LMICs for who valid information on disability and marital/de facto marital status was available.
3. Results
3.1. Prevalence and Predictors of Disability
Country level estimates of the prevalence of disability are presented in Table 2.
Table 2.
Country-level estimates of the prevalence of disability and of child marriage in 37 middle- and low-income countries.
Overall, 14.7% (95%CI 14.4–14.9; inter-country range 4.9–30.2%) of women and 10.5% (95%CI 9.5–11.6; inter-country range 2.6–18.9%) of men were identified as having a disability. Of the respondents with disability, 35.1% (95%CI 34.1–36.2) of women and 37.3% (95%CI 34.8–39.9) of men were identified as having a more severe disability. The risk of disability was significantly greater among participants who were older, poorer and with lower levels of education (Supplementary Table S1). Spearman’s non-parametric correlation between country pcGNI and country-level prevalence estimates of disability indicated no significant association between country wealth and the prevalence of disability (women r = −0.10, men r = +0.01).
3.2. Prevalence and Predictors of Child Marriage
Information on the prevalence of child marriage for each country is presented in Table 2. Overall, 30.8% (95%CI 29.3–33.2) of women and 7.8% (95%CI 7.2–8.3) of men were identified as being married in childhood, with 15.4% (95%CI 14.8–16.1) of women and 3.3% (95%CI 2.8–3.9) of men being under the age of 16 when married. Likelihood of child marriage was significantly greater among participants who were older, poorer and with lower levels of education (Supplementary Table S2). Spearman’s non-parametric correlation between country pcGNI and country-level prevalence estimates of child marriage indicated moderate and statistically significant association between higher country wealth and reduced rates of child marriage (for women r = −0.56, p < 0.001 for marriage under 18, r = −0.59, p < 0.001 for marriage under 16; for men r = −0.48, p < 0.05 for marriage under 18, r = −0.52, p < 0.01 for marriage under 16).
3.3. Disability and Marriage
Women with disability were 2.5% less likely to have ever entered a marital or de facto marital relationship than women without disability (adjusted prevalence rate ratio (APRR) = 0.975 (95%CI 0.966–0.985), p < 0.001). Men with disability were 2.3% less likely to have ever entered a marital or de facto marital relationship than men without disability (APRR = 0.977 (95%CI 0.952–1.00), n.s.).
3.4. Disability and Child Marriage
Prevalence of child marriage for women and men with and without disability is presented for each country in Table 3, along with age-adjusted APRRs of the likelihood of participants with disabilities being married in childhood. Marriage under the age of 18 was greater for women with disabilities in 30 of the 37 countries, the difference being statistically significant in 19. Marriage under the age of 16 was greater for women with disabilities in 29 of the 37 countries, the difference being statistically significant in 18. Marriage under the age of 18 was greater for men with disabilities in 16 of the 28 countries, the difference being statistically significant in 7. Marriage under the age of 16 was greater for men with disabilities in 18 of the 28 countries, the difference being statistically significant in 5. In none of the countries with decreased likelihood of child marriage for either women or men was the difference statistically significant.
Table 3.
Prevalence and Risk of Child Marriage by Disability Status.
Aggregation by meta-analysis indicated a significant increased likelihood of marriage under 18 among women with disabilities (APRR = 1.16 [1.10–1.21], p < 0.001, I2 = 90.4%). Meta-analysis of the association between disability and marriage under 16 was complicated by the failure of within-country likelihood of child marriage estimates for one country (Tuvalu) to resolve due to zero counts in the disability by child marriage 2 × 2 classification. Excluding this country resulted in an estimated APRR of 1.21 (1.14–1.29), p < 0.001, I2 = 84.2%). As a sensitivity analysis, aggregation by mixed effects multilevel modelling indicated a significantly increased likelihood of marriage under 18 (APRR = 1.22 [1.13–1.31], p < 0.001) and under 16 (APRR = 1.26 [1.6–1.37], p < 0.001) among women with disabilities. Mixed effects multilevel analysis excluding Tuvalu generated an APRR of 1.26 (1.16–1.37), p < 0.001. Additionally controlling for between-group differences in within-country relative household wealth and level of education marginally reduced but did not eliminate the likelihood of child marriage among women with disabilities under 18 (APRR = 1.17 [1.10–1.25], p < 0.001), but not under 16 (APRR = 1.20 [1.11–1.30], p < 0.001).
Meta-analysis was complicated by the failure of within-country likelihood of child marriage estimates to resolve for marriage under 18 in three countries and marriage under 16 in six countries. Meta-analysis on the subgroups of countries for which estimates were available indicated a significantly increased likelihood of child marriage among men with disabilities (under 18 APRR = 1.31 [1.20–1.42], p < 0.001, I2 = 2.7%; under 16 APRR = 1.36 [1.21–1.55], p < 0.001, I2 = 0.0%). Aggregation by mixed effects multilevel modelling, as a sensitivity analysis, generated equivalent APRRs of 1.33 (1.22–1.46), p < 0.001 for marriage under 18 and 1.48 (1.31–1.66), p < 0.001 for marriage under 16. Additionally controlling for between-group differences in within-country relative household wealth and level of education marginally reduced but did not eliminate the likelihood of child marriage among men with disabilities under 18 (APRR = 1.25 [1.16–1.36], p < 0.001), and under 16 (APRR = 1.38 [1.23–1.54], p < 0.001).
3.5. Analyses Stratified by Age Group
Adjusted prevalence rates estimated by mixed effects multilevel modelling are presented in Figure 1 for women (Figure 2 for men) with disabilities being married under 18 and under 16 by women’s age group.
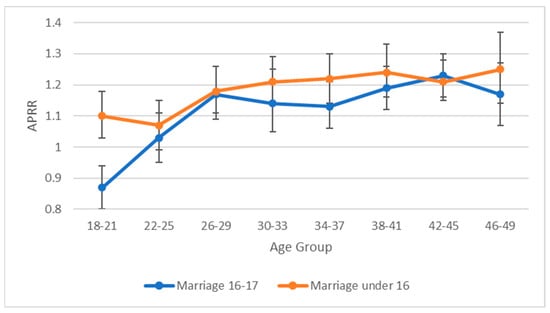
Figure 1.
Prevalence rate ratios with 95% CIs (adjusted for within age group variation in age) for women with disabilities having been exposed to child marriage at age 16–17 and under 16 by age group.
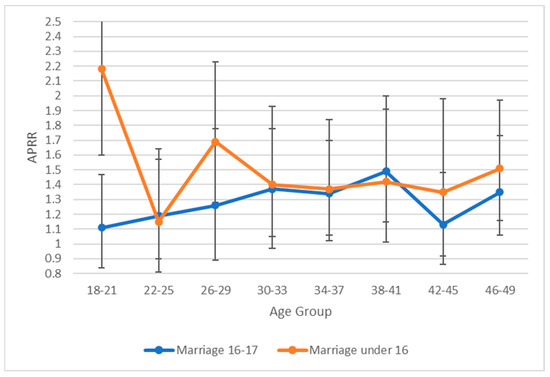
Figure 2.
Prevalence rate ratios with 95% CIs (adjusted for within age group variation in age) for men with disabilities having been exposed to child marriage at age 16–17 and under 16 by age group.
For both women and men, the relationship between disability and child marriage across age groups varied between those married at age 16–17 and those married below 16. At all eight age groupings, of the women married below age 16, women with disabilities were significantly more likely to be married than their non-disabled peers. Of the women married at age 16 or 17, at all ages except for the youngest age group (18–21) women with disabilities were more likely to be married than their non-disabled peers. These differential patterns were evident for women with more and less severe disability (Supplementary Figures S1 and S2) and for women in upper-middle, lower-middle and low-income countries (Supplementary Figures S3–S5).
For men married at age 16 or 17, there was no significant relationship between disability status and likelihood of child marriage in the youngest age group (18–21). At older ages (34–41, 46–49), men with disabilities were significantly more likely to be married. Again, in contrast, men with disabilities who married below age 16 were significantly more likely to have been married in the youngest age group (18–21). Additional stratification of these relationships was not undertaken for men due to the markedly smaller sample sizes.
4. Discussion
Our analyses of nationally representative samples involving 423,145 women across 37 LMICs and 94,889 men across 28 LMICs indicated that: (1) the prevalence of disability was significantly greater among women and men who were married in childhood, especially among those married under the age of 16; (2) these associations were only marginally attenuated when analyses controlled for the potentially confounding effects of relative household wealth and highest level of education; and (3) among the youngest participants (age 18–21) significantly increased rates of exposure to child marriage among those with a disability was only evident among those married below the age of 16. To our knowledge, this is the first study to examine the association between disability and child marriage among women and men in nationally representative samples.
Given that all data were cross-sectional and age of onset of disability was not recorded, it is impossible to determine causal pathways that underlie this association. As noted, child marriage has been associated with poorer health and increased likelihood of exposure to well-established determinants of poorer health and disability [2,3,4,5,6,7,8,9,10,11,12,24]. Consequently, this association would be expected to lead to an increasing likelihood of disability over time which, discounting any cohort effects, would result in an increasing likelihood of disability with age. Such patterns are evident in Figure 1 and Figure 2, although the increasing likelihood of disability appears to flatten out at older ages. This could reflect the impact of differential mortality given the low life-expectancy for people in LMICs (life expectancy at birth in 1980 for the nine low-income countries participating in the study ranged from 40 years in Sierra Leone to 52 years in Togo).
Limited anecdotal information suggests that children with disabilities may be at increased likelihood of being exposed to child marriage [25]. If true, and again discounting any possible cohort effects, this should be reflected in an increased likelihood of disability among the youngest respondents. This is consistent with the data presented in Figure 1 and Figure 2, but not for girls married at the age of 16 or 17. The differences in likelihood of disability associated with age of marriage may reflect differences in the dynamics of child marriage at different ages with early child marriage possibly being more likely to be an arranged relationship, and later child marriage possibly being more likely to be a consensual relationship among adolescents. In addition to the above processes, unobserved confounders may have independently contributed to increased likelihood of child marriage and increased likelihood of disability. It is worth noting, however, that controlling for two prominent potential confounders (poverty and level of education) had a minimal impact on the strength of association between child marriage and disability.
The primary strengths of the present study lie in the use of well-constructed nationally representative samples from multiple countries with high response rates. The primary limitations are (1) the cross-sectional nature of the data; (2) the failure of MICS to record age of onset of disability; (3) the use of non-random sample of LMICs; (4) the limited number of potential confounders that it was possible to control for in the analyses; and (5) the lack of information on the nature of child marriage (e.g., whether arranged or forced) [41]. In addition, the use of the Washington Group Short Set of Questions on Disability underestimates the prevalence of disability through its failure to identify people whose disability may be associated with mental health related functional limitations [28,30].
5. Conclusions
Our analyses indicate that in middle- and low-income countries women and men who were married in childhood were more likely to have a disability than women and men who did not marry in childhood. Further research is required to understand the causal pathways responsible for the increased likelihood of disability among female and male children married in childhood and among their children. However, initiatives to eliminate child marriage should consider making reasonable accommodations to policies to ensure that they are equally effective for girls and boys with disabilities, especially in relation to early arranged, forced or consensual child marriage. In addition, UN monitoring of progress in eliminating child marriage needs to disaggregate data by disability status to help ensure that ‘no one is left behind’ [1] and UN monitoring of the wellbeing of children with disability needs to report on the prevalence of child marriage [23].
Supplementary Materials
The following supporting information can be downloaded at: https://www.mdpi.com/article/10.3390/ijerph20010088/s1, Figure S1: Prevalence rate ratios with 95% CIs (adjusted for within age group variation in age) for women with less severe disabilities having been exposed to child marriage at age 16–17 and under 16 by age group; Figure S2: Prevalence rate ratios with 95% CIs (adjusted for within age group variation in age) for women with more severe disabilities having been exposed to child marriage at age 16–17 and under 16 by age group; Figure S3: Prevalence rate ratios with 95% CIs (adjusted for within age group variation in age) for women with disabilities in Upper-Middle Income countries having been exposed to child marriage at age 16–17 and under 16 by age group; Figure S4: Prevalence rate ratios with 95% CIs (adjusted for within age group variation in age) for women with disabilities in Lower-Middle Income countries having been exposed to child marriage at age 16–17 and under 16 by age group; Figure S5: Prevalence rate ratios with 95% CIs (adjusted for within age group variation in age) for women with disabilities in Low Income countries having been exposed to child marriage at age 16–17 and under 16 by age group; Table S1: Prevalence of Disability Stratified by Participant Age, Household Wealth, Highest Level of Education and Country Economic Classification Group; Table S2: Prevalence of Child Marriage Stratified by Participant Age, Household Wealth, Highest Level of Education and Country Economic Classification Group.
Author Contributions
E.E. and G.L. jointly conceptualised the aims and methods of the study. Data analysis and creating the first draft if the MS was undertaken by E.E.; E.E. and G.L. jointly revised the drafts and agreed the content of the final submission. All authors have read and agreed to the published version of the manuscript.
Funding
This research received no external funding.
Institutional Review Board Statement
The study was conducted in accordance with the Declaration of Helsinki, and approved by the relevant Institutional Review Boards (or Ethics Committees) in each participating country. Details of these procedures and arrangements for ethical review used in each country are available at http://mics.unicef.org/ (accessed on 8 November 2022).
Informed Consent Statement
Informed consent was obtained from all subjects involved in the study.
Data Availability Statement
All data used in this study are potentially available on request to UNICEF.
Acknowledgments
We would like to thank the UNICEF’s global Multiple Indicator Cluster Surveys (MICS) program for allowing us to use the datasets.
Conflicts of Interest
The authors have no conflict of interest to report.
References
- UNICEF. Towards Ending Child Marriage: Global Trends and Profiles of Progress; UNICEF: New York, NY, USA, 2021. [Google Scholar]
- Parsons, J.; Edmeades, J.; Kes, A.; Petroni, S.; Sexton, M.; Wodon, Q. Economic Impacts of Child Marriage: A Review of the Literature. Rev. Faith Int. Aff. 2015, 13, 12–22. [Google Scholar] [CrossRef]
- Wodon, Q.C.; Male, A.; Nayihouba, A.; Onagoruwa, A.; Savadogo, A.; Yedan, J.; Edmeades, A.; Kes, N.; John, L.; Murithi, J.L.; et al. Economic Impacts of Child Marriage: Global Synthesis Report; The World Bank and International Center for Research on Women: Washington, DC, USA, 2017. [Google Scholar]
- Nour, N.M. Health Consequences of Child Marriage in Africa. Emerg. Infect. Dis. 2006, 12, 1644–1649. [Google Scholar] [CrossRef]
- Raj, A. When the mother is a child: The impact of child marriage on the health and human rights of girls. Arch. Dis. Child. 2010, 95, 931–935. [Google Scholar] [CrossRef]
- Raj, A.; Saggurti, N.; Winter, M.; Labonte, A.; Decker, M.R.; Balaiah, D.; Silverman, J.G. The effect of maternal child marriage on morbidity and mortality of children under 5 in India: Cross sectional study of a nationally representative sample. BMJ 2010, 340, b4258. [Google Scholar] [CrossRef]
- Efevbera, Y.; Bhabha, J.; Farmer, P.E.; Fink, G. Girl child marriage as a risk factor for early childhood development and stunting. Soc. Sci. Med. 2017, 185, 91–101. [Google Scholar] [CrossRef]
- Fall, C.H.D.; Sachdev, H.S.; Osmond, C.; Restrepo-Mendez, M.C.; Victora, C.; Martorell, R.; Stein, A.D.; Sinha, S.; Tandon, N.; Adair, L.; et al. COHORTS investigators, Association between maternal age at childbirth and child and adult outcomes in the off spring: A prospective study in five low-income and middle-income countries (COHORTS collaboration). Lancet Glob. Health 2015, 3, E366–E377. [Google Scholar] [CrossRef]
- Paul, P.; Chouhan, P.; Zaveri, A. Impact of child marriage on nutritional status and anaemia of children under 5 years of age: Empirical evidence from India. Public Health 2019, 177, 95–101. [Google Scholar] [CrossRef] [PubMed]
- Wodon, Q.C. Early Childhood Development in the Context of the Family: The Case of Child Marriage. J. Hum. Dev. Capab. 2016, 17, 590–598. [Google Scholar] [CrossRef]
- Raj, A.; Boehmer, U. Girl Child Marriage and its Association with National Rates of HIV, Maternal Health, and Infant Mortality across 97 Countries. Violence Against Women 2013, 19, 536–551. [Google Scholar] [CrossRef]
- Olamijuwon, E.O.; Chisumpa, V.H.; Akinyemi, J.O. Unveiling the Realities of Marrying Too Young: Implications of child marriage on sexual and reproductive health of girls and infant survival in sub-Sahara Africa. Afr. Popul. Stud. 2017, 31, 3594–36410. [Google Scholar] [CrossRef][Green Version]
- Nguyen, M.C.; Wodon, Q. Impact of Child Marriage on Literacy and Education Attainment in Africa; UNICEF: New York, NY, USA, 2014. [Google Scholar]
- Arthura, M.; Earle, A.; Raub, A.; Vincent, I.; Atabay, E.; Latz, I.; Kranz, G.; Nandi, A.; Heymann, J. Child Marriage Laws around the World: Minimum Marriage Age, Legal Exceptions, and Gender Disparities. J. Women Politics Policy 2018, 39, 51–74. [Google Scholar] [CrossRef] [PubMed]
- UNICEF. Child Marriage: Latest Trends and Future Prospects; UNICEF: New York, NY, USA, 2018. [Google Scholar]
- Gastón, C.M.; Misunas, C.; Cappa, C. Child marriage among boys: A global overview of available data. Vulnerable Child. Youth Stud. 2019, 14, 219–228. [Google Scholar] [CrossRef]
- Koski, A.; Heymann, J. Child Marriage in the United States: How Common Is the Practice, And Which Children Are at Greatest Risk? Perspect. Sex. Reprod. Health 2018, 50, 59–65. [Google Scholar] [CrossRef]
- UNICEF. Child Marriage in the Sahel; UNICEF: New York, NY, USA, 2020. [Google Scholar]
- UNICEF. Acheiving a Future Without Child Marriage: Focus on West and Central Africa; UNICEF: New York, NY, USA, 2017. [Google Scholar]
- Nguyen, M.C.; Wodon, Q. Global and Regional Trends in Child Marriage. Rev. Faith Int. Aff. 2015, 13, 6–11. [Google Scholar] [CrossRef]
- United Nations Population Fund. Marrying Too Young: End Child Marriage; UNFPA: New York, NY, USA, 2012. [Google Scholar]
- Paul, P. Effects of education and poverty on the prevalence of girl child marriage in India: A district–level analysis. Child. Youth Serv. Rev. 2019, 100, 16–31. [Google Scholar] [CrossRef]
- UNICEF. Seen, Counted, Included: Using Data to Shed Light on the Well-Being of Children with Disabilities; UNICEF: New York, NY, USA, 2021. [Google Scholar]
- De Groot, R.; Kuunyem, M.Y.; Palermo, T.; on behalf of the Ghana LEAP 1000 evaluation team. Child marriage and associated outcomes in northern Ghana: A cross-sectional study. BMC Public Health 2018, 18, 285. [Google Scholar] [CrossRef]
- Meaney-Davis, J.; Lee, H.; Andrae, K. Disability and Child Marriage. Disability Inclusion Helpdesk Report No: 38; Disability Inclusion Helpdesk: London, UK, 2020. [Google Scholar]
- UNICEF. Monitoring the Situation of Children and Women for 20 Years: The Multiple Indicator Cluster Surveys (MICS) 1995–2015; UNICEF: New York, NY, USA, 2015. [Google Scholar]
- Khan, S.; Hancioglu, A. Multiple Indicator Cluster Surveys: Delivering Robust Data on Children and Women across the Globe. Stud. Fam. Plan. 2019, 50, 279–286. [Google Scholar] [CrossRef]
- Bourke, J.A.; Nichols-Dunsmuir, A.; Begg, A.; Dong, H.; Schluter, P.J. Measuring disability: An agreement study between two disability measures. Disabil. Health J. 2021, 14, 100995. [Google Scholar] [CrossRef]
- Sabariego, C.; Oberhauser, C.; Posarac, A.; Bickenbach, J.; Kostanjsek, N.; Chatterji, S.; Officer, A.; Coenen, M.; Chhan, L.; Cieza, A. Measuring disability: Comparing the impact of two data collection approaches on disability rates. Int. J. Environ. Res. Public Health 2015, 12, 10329–10351. [Google Scholar] [CrossRef]
- Office for National Statistics. Measuring Disability: Comparing Approaches; Office for National Statistics: London, UK, 2019.
- Nguyen, M.C.; Wodon, Q. Measuring child marriage. Econ. Bull. 2012, 32, 398–411. [Google Scholar]
- Svanemyr, J.; Chandra-Mouli, V.; Raj, A.; Travers, E.; Sundaram, L. Research priorities on ending child marriage and supporting married girls. Reprod. Health 2015, 12, 80. [Google Scholar] [CrossRef] [PubMed]
- World Health Organization. Closing the Gap in a Generation: Health Equity through Action on the Social Determinants of Health. Final Report of the Commission on the Social Determinants of Health; World Health Organization: Geneva, Switzerland, 2008. [Google Scholar]
- World Bank. World Bank Country and Lending Groups. Available online: https://datahelpdesk.worldbank.org/knowledgebase/articles/906519-world-bank-country-and-lending-groups (accessed on 8 November 2022).
- World Bank. The World Bank Atlas Method—Detailed Methodology. Available online: https://datahelpdesk.worldbank.org/knowledgebase/articles/378832-what-is-the-world-bank-atlas-method (accessed on 8 November 2022).
- World Bank. GNI per Capita, Atlas Method (Current US $). Available online: http://data.worldbank.org/indicator/NY.GNP.PCAP.CD?view=chart (accessed on 8 November 2022).
- Rutstein, S.O. The DHS Wealth Index: Approaches for Rural and Urban Areas. DHS Working Papers No. 60; Macro International Inc.: Calverton, MD, USA, 2008. [Google Scholar]
- Rutstein, S.O.; Johnson, K. The DHS Wealth Index: DHS Comparative Reports No. 6; ORC Macro: Calverton, MD, USA, 2004. [Google Scholar]
- StataCorp. Stata Statistical Software: Release 16; StataCorp LLC: College Station, TX, USA, 2019. [Google Scholar]
- Knol, M.J.; Le Cessie, S.; Algra, A.; Vandenbroucke, J.P.; Groenwold, R.H.H. Overestimation of risk ratios by odds ratios in trials and cohort studies: Alternatives for logistic regression. Can. Med. Assoc. J. 2012, 184, 895–899. [Google Scholar] [CrossRef] [PubMed]
- Das, M.; Guedes, A.; Moletsane, R.; Svanemyr, J. Singularity and Diversity in child, early, and forced marriage and unions. J. Adolesc. Health 2022, 70, S1–S4. [Google Scholar] [CrossRef] [PubMed]
Disclaimer/Publisher’s Note: The statements, opinions and data contained in all publications are solely those of the individual author(s) and contributor(s) and not of MDPI and/or the editor(s). MDPI and/or the editor(s) disclaim responsibility for any injury to people or property resulting from any ideas, methods, instructions or products referred to in the content. |
© 2022 by the authors. Licensee MDPI, Basel, Switzerland. This article is an open access article distributed under the terms and conditions of the Creative Commons Attribution (CC BY) license (https://creativecommons.org/licenses/by/4.0/).