


Red Cell Distribution Width as a Predictive Factor of Celiac Disease in Middle and Late Adulthood and Its Potential Utility as Celiac Disease Screening Criterion

 ,
,  ,
,
Abstract
1. Introduction
2. Materials and Methods
2.1. Study Design and Subjects
2.2. Clinical Evaluation
2.3. Celiac Disease Antibody Tests: Serology and Human Leucocyte Antigen Genotype (HLA)
2.4. Biochemical and Hematological Laboratory Parameters
2.5. Small-Bowel Biopsy
2.6. Diagnostic Criteria
2.7. Statistical Analysis
2.8. Ethical Considerations
3. Results
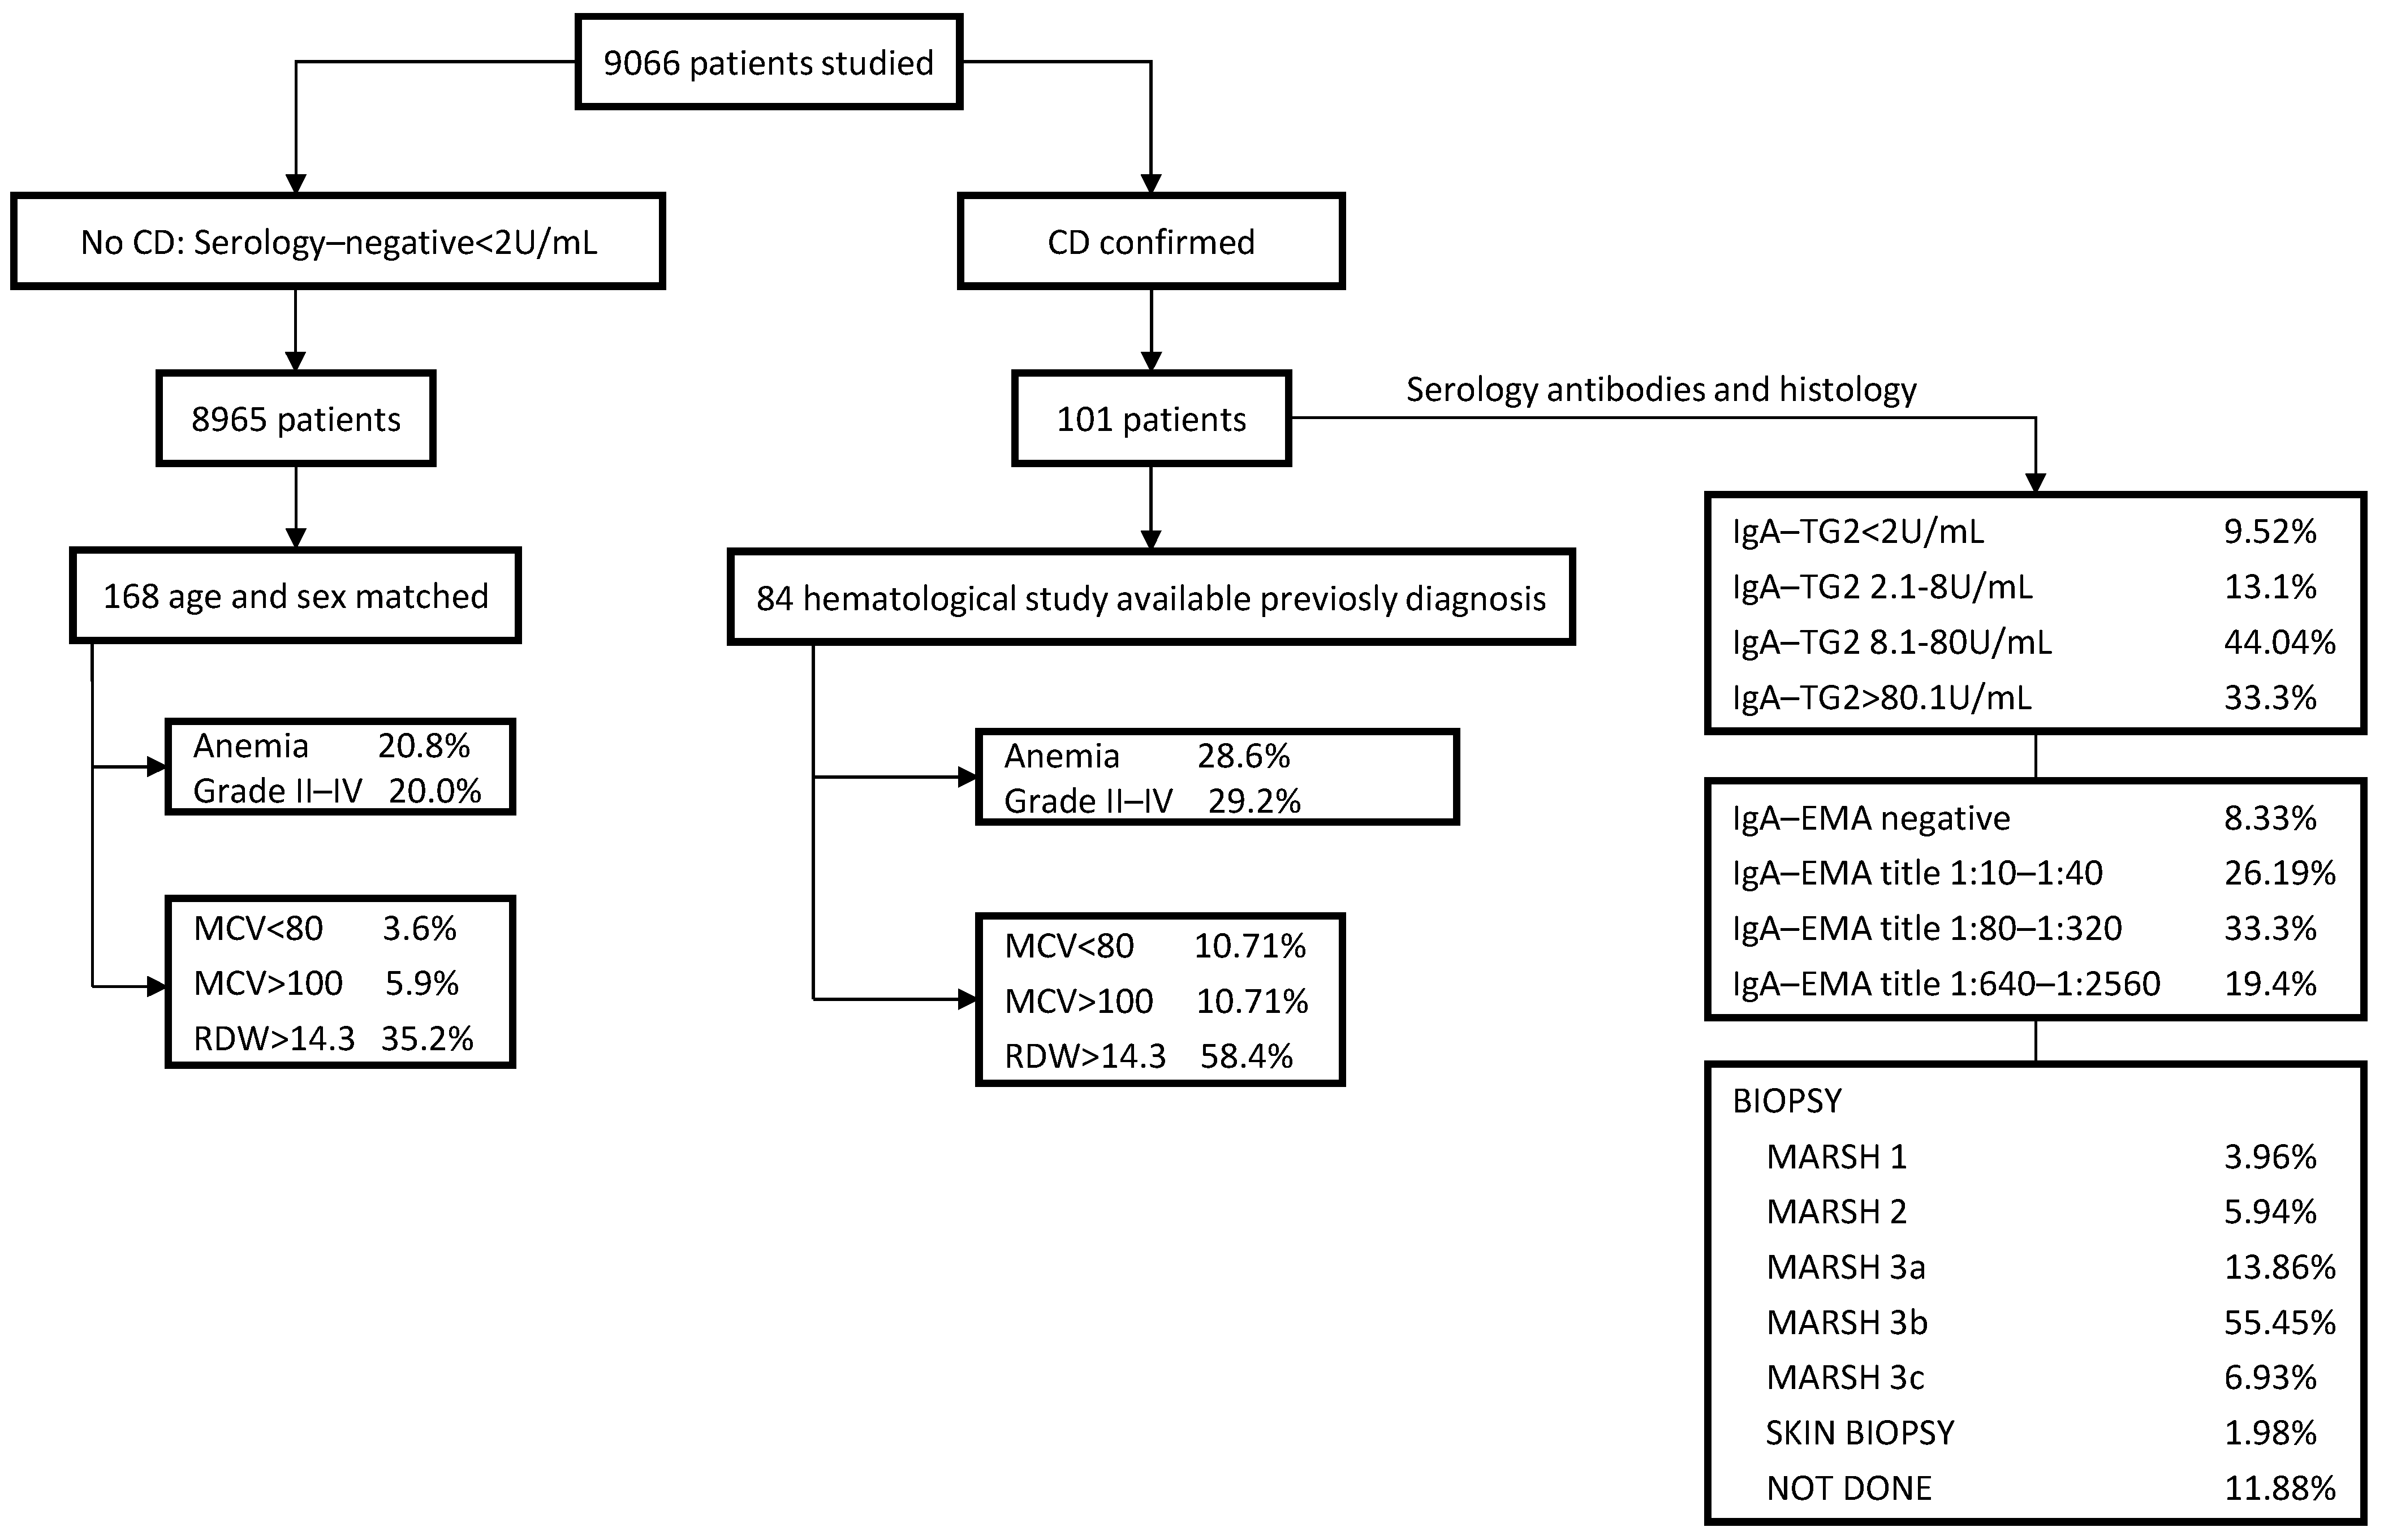
3.1. CD Case Positive Rate in the Whole Study Sample
3.2. Serology and HLA Genotype
3.3. Intraepithelial Lymphocytosis and/or Villous Atrophy and Crypt Hyperplasia of Small-Bowel Mucosa
3.4. Clinical Findings at CD Diagnosis
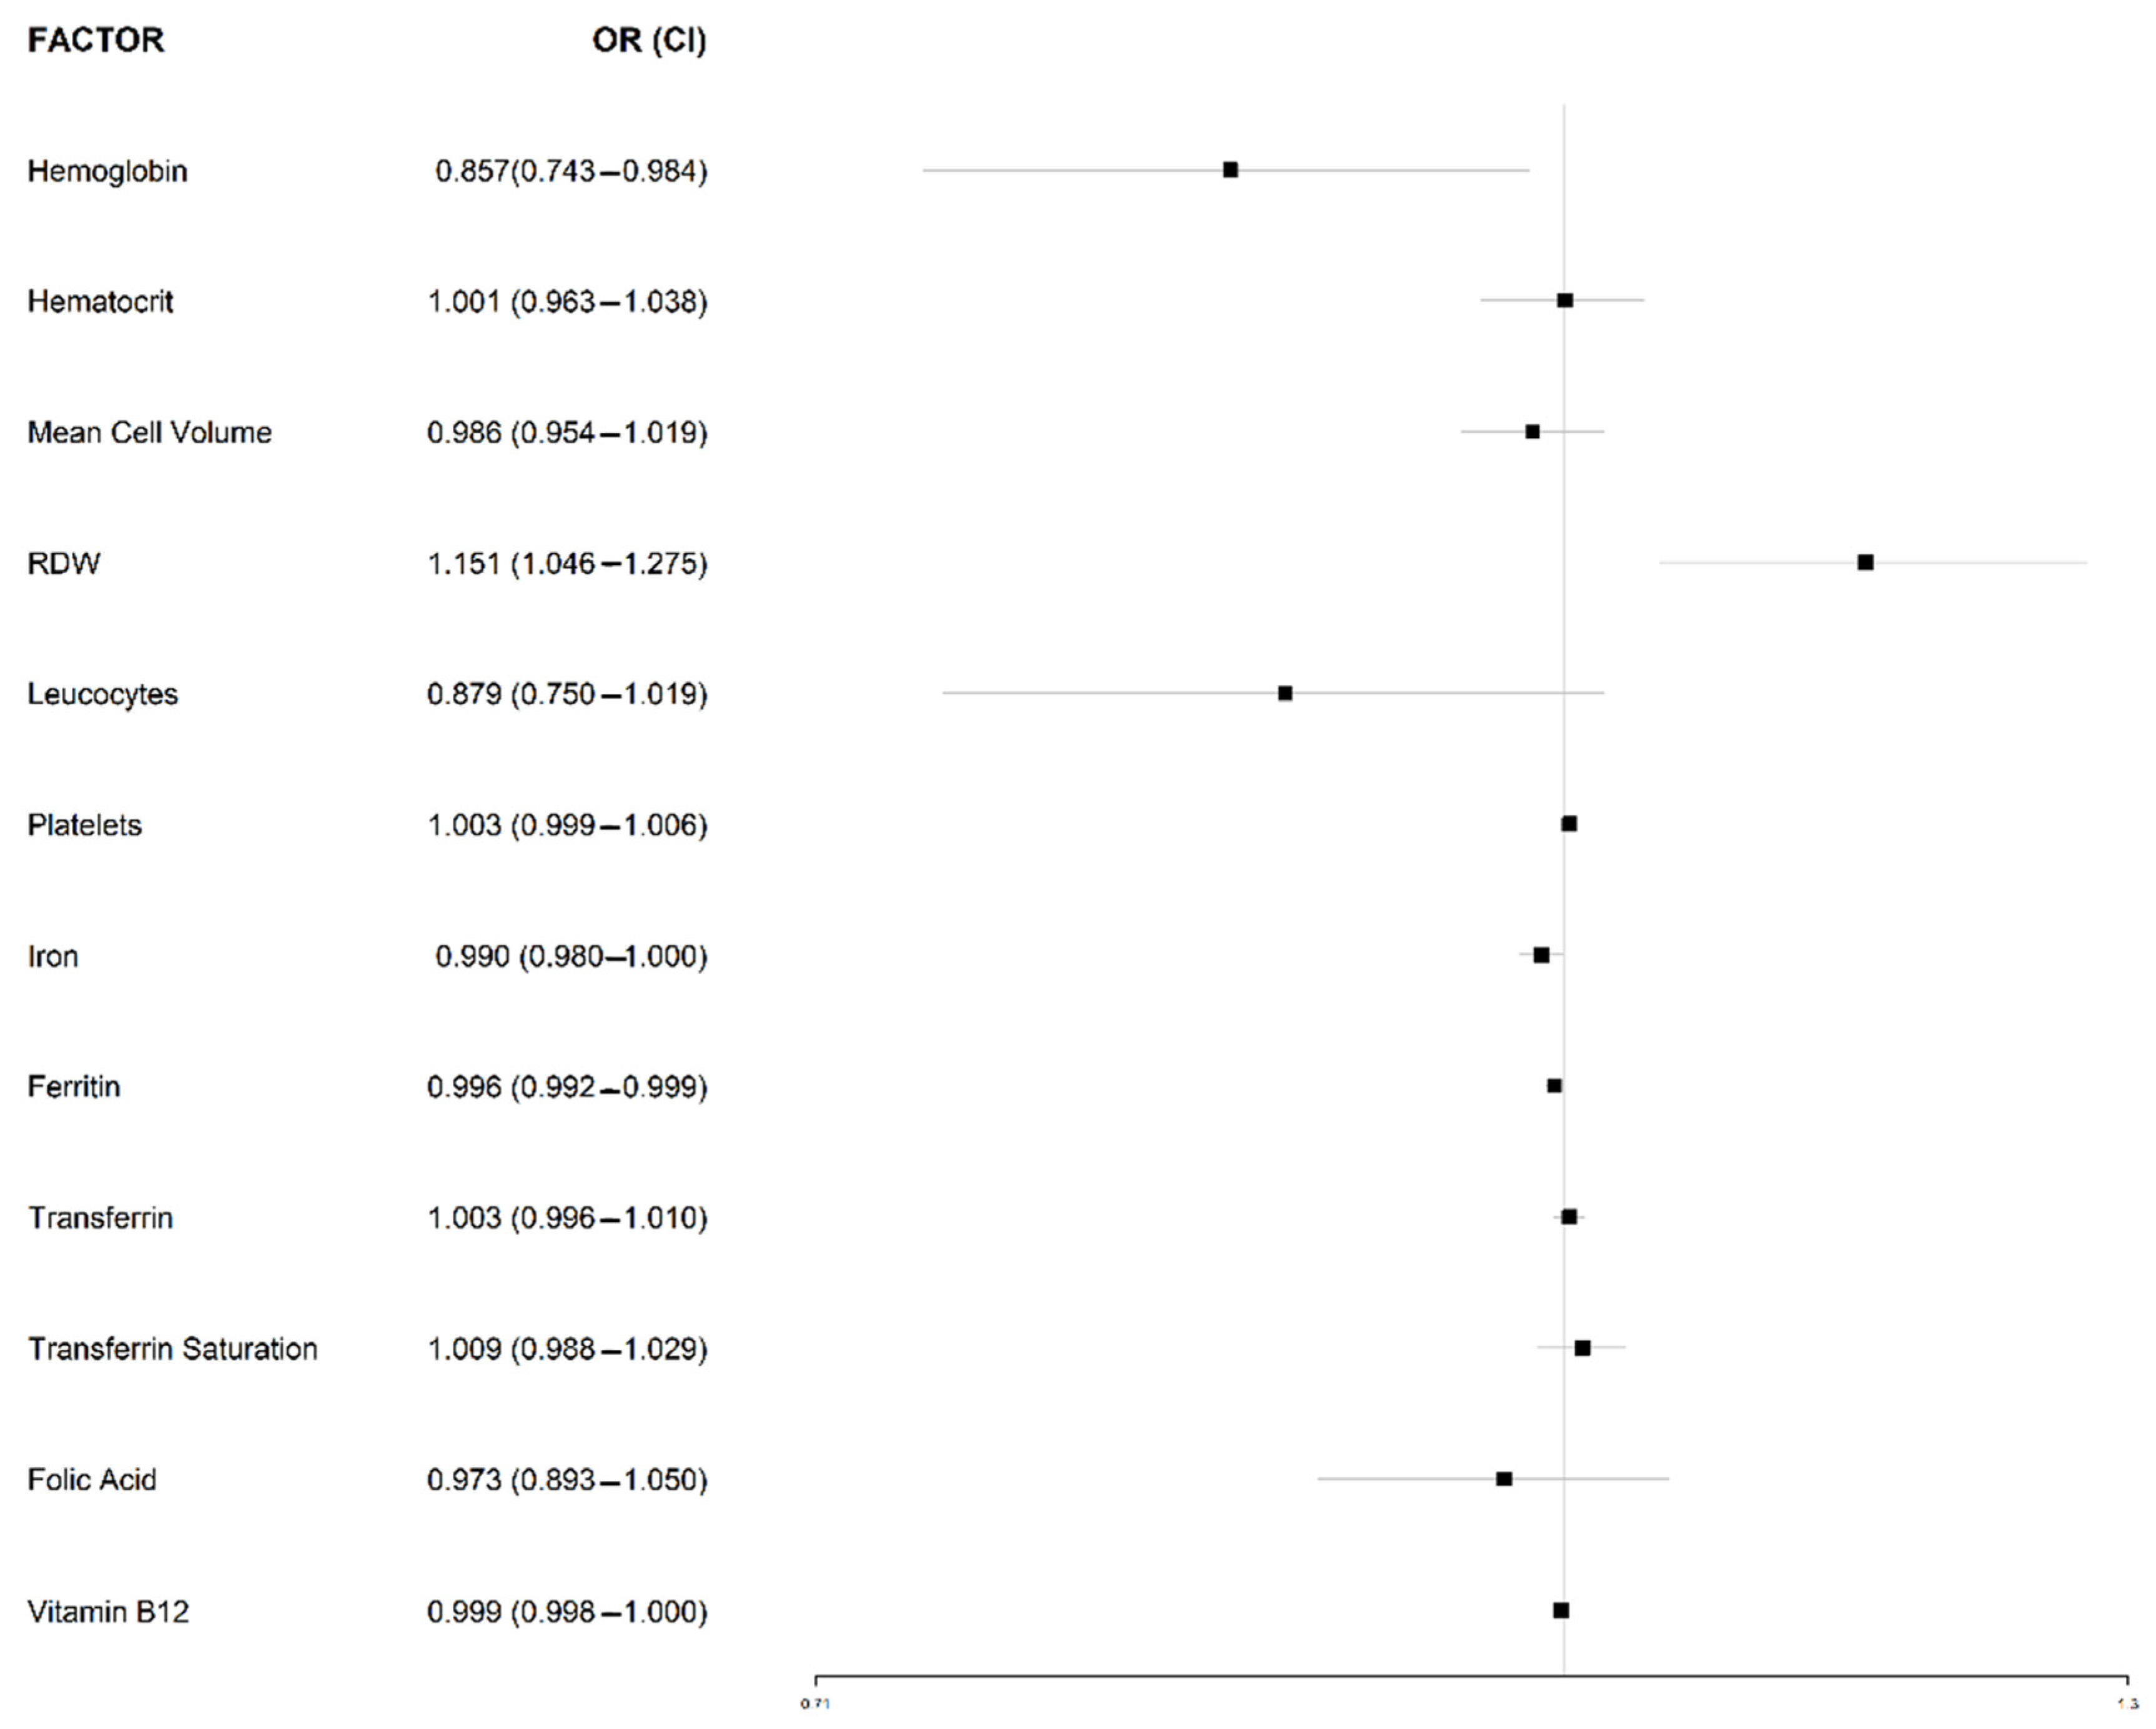
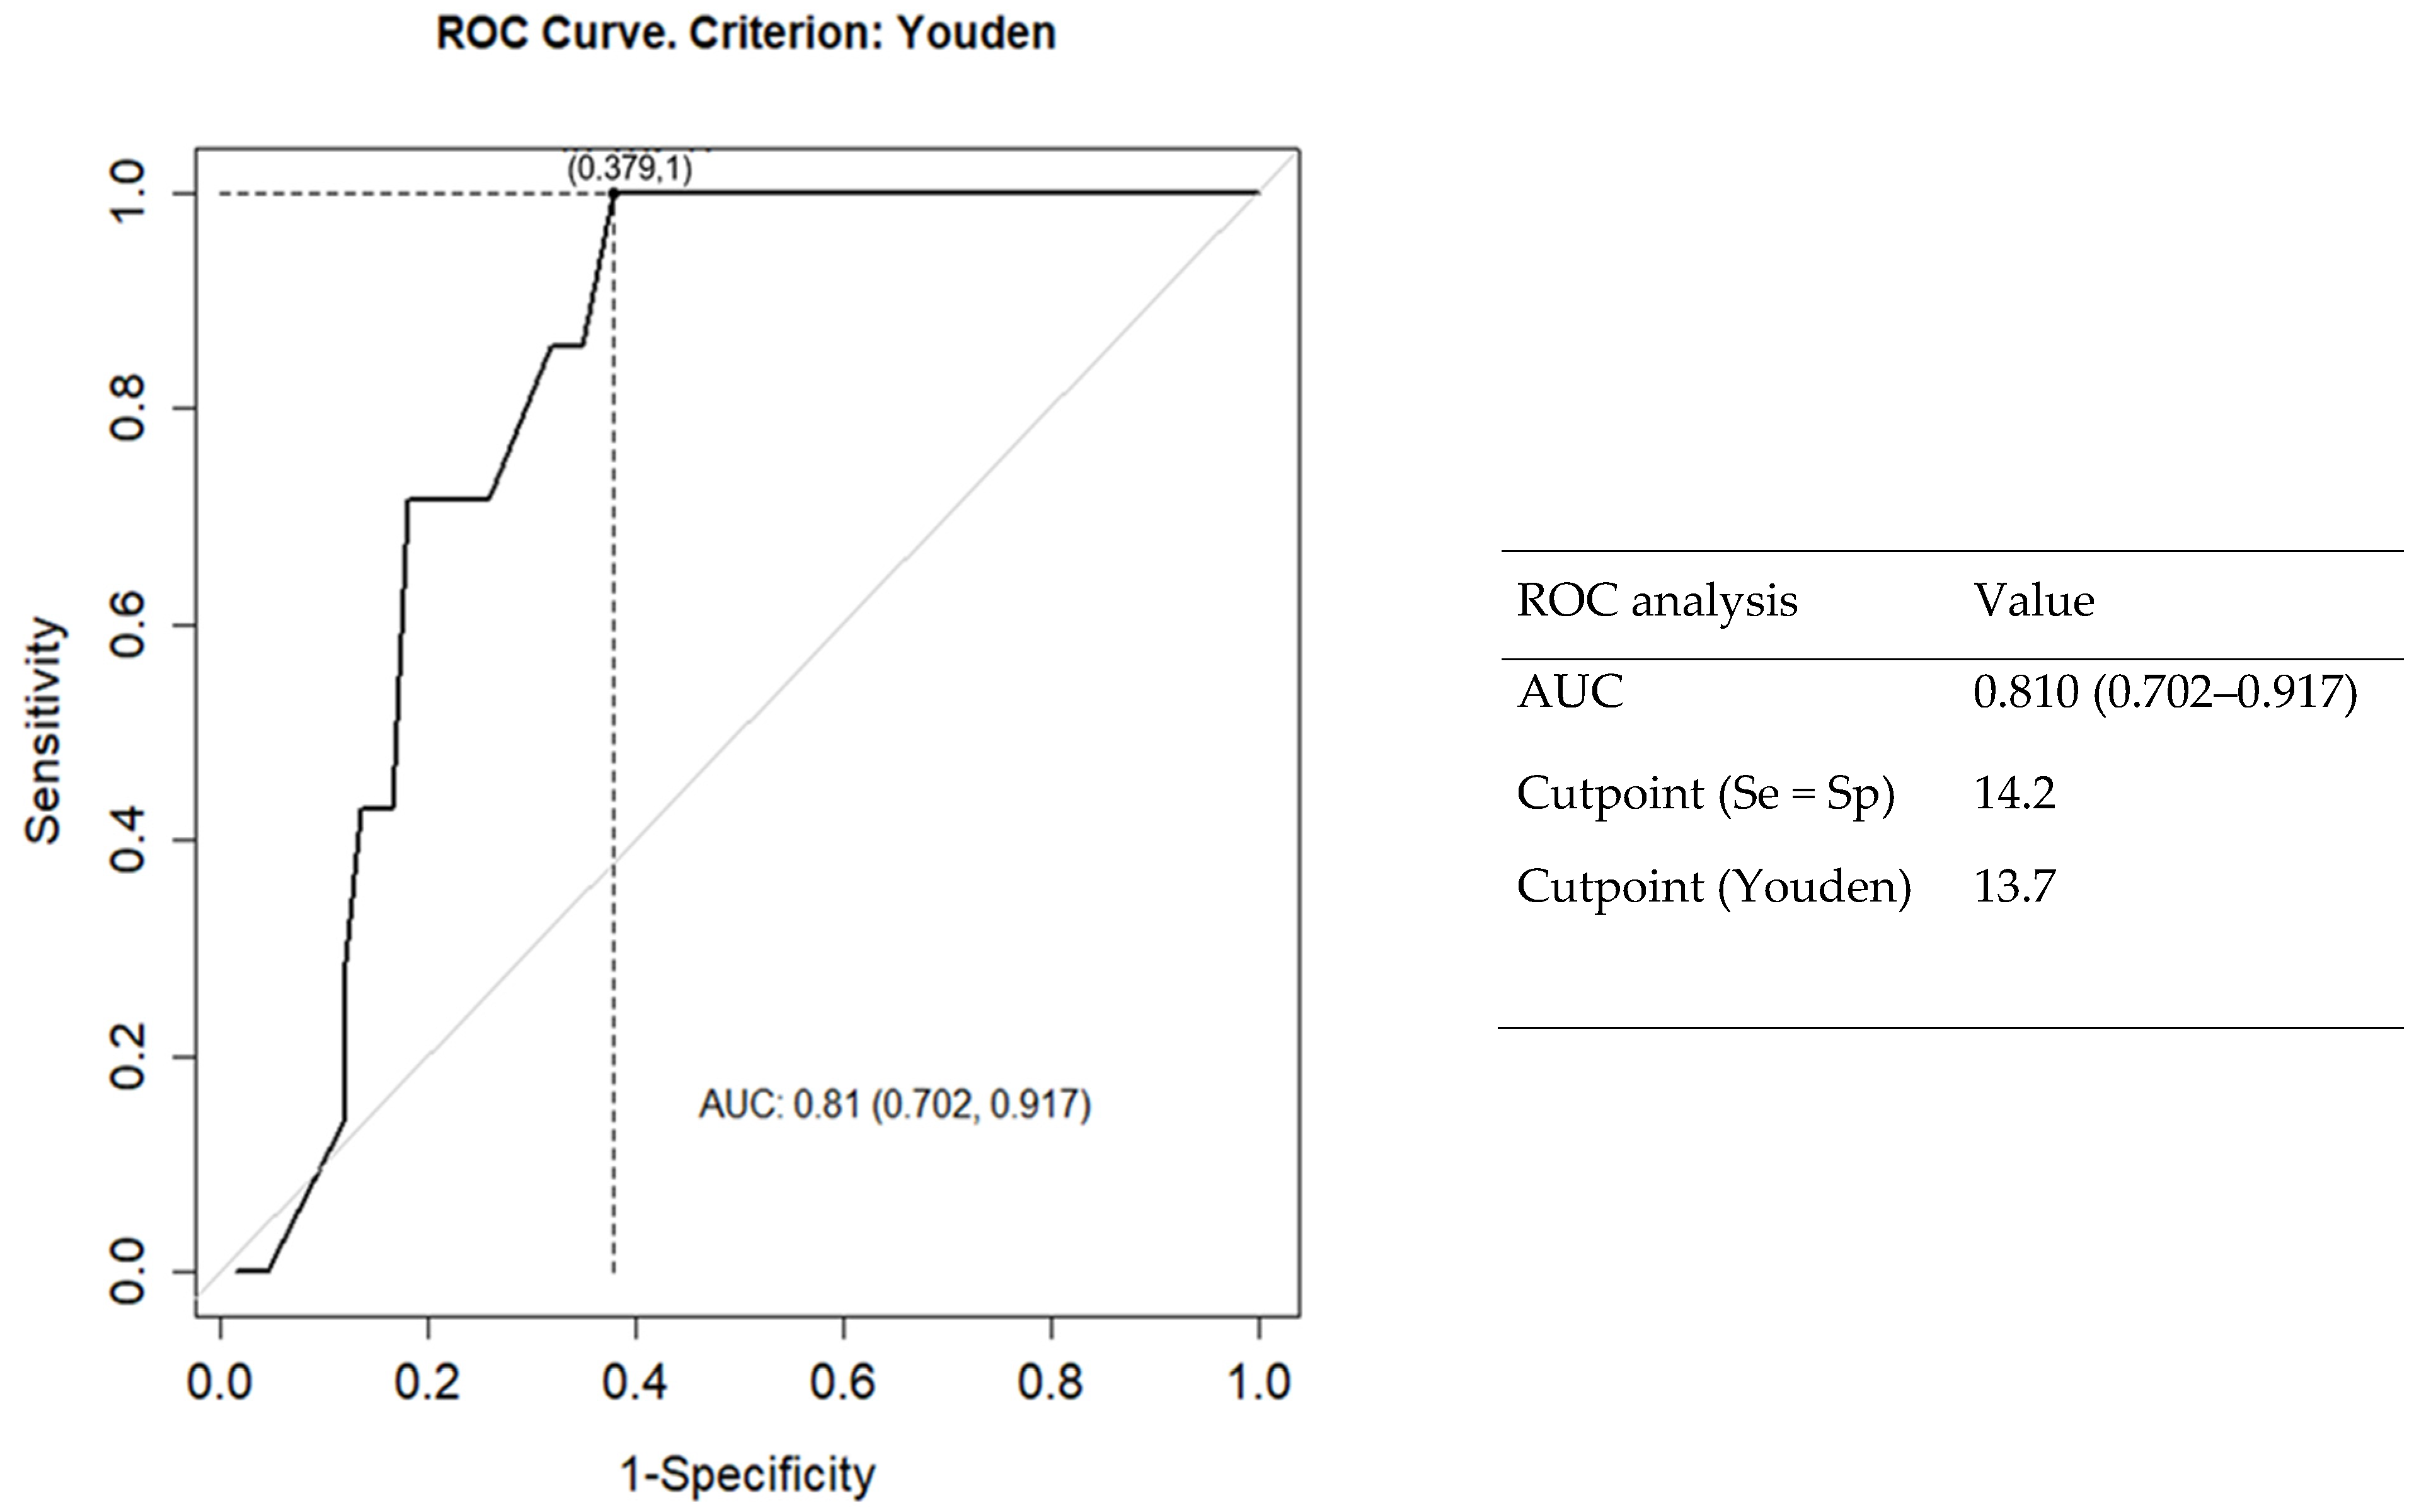
3.5. Comparative Hematological Features between Seropositive and Seronegative CD Patients
4. Discussion
5. Conclusions
Author Contributions
Funding
Institutional Review Board Statement
Informed Consent Statement
Data Availability Statement
Conflicts of Interest
References
- Collin, P.; Vilppula, A.; Luostarinen, L.; Holmes, G.K.T.; Kaukinen, K. Review article: Coeliac disease in later life must not be missed. Aliment. Pharmacol. Ther. 2018, 47, 563–572. [Google Scholar] [CrossRef] [PubMed]
- Therrien, A.; Kelly, C.P.; Silvester, J.A. Celiac Disease: Extraintestinal Manifestations and Associated Conditions. J. Clin. Gastroenterol. 2020, 54, 8–21. [Google Scholar] [CrossRef] [PubMed]
- Shiha, M.G.; Marks, L.J.; Sanders, D.S. Diagnosing coeliac disease in the elderly: A United Kingdom cohort study. Gastroenterol. Hepatol. Bed. Bench. 2020, 13, 37–43. [Google Scholar] [PubMed]
- Spencer, M.; Lenhart, A.; Baker, J.; Dickens, J.; Weissman, A.; Read, A.J.; Saini, S.; Saini, S.D. Primary care physicians are under-testing for celiac disease in patients with iron deficiency anemia: Results of a national survey. PLoS ONE 2017, 12, e0184754. [Google Scholar] [CrossRef]
- Cappello, M.; Morreale, G.C.; Licata, A. Elderly Onset Celiac Disease: A Narrative Review. Clin. Med. Insights Gastroenterol. 2016, 27, 414–419. [Google Scholar] [CrossRef]
- Katsumi, A.; Abe, A.; Tamura, S.; Matsushita, T. Anemia in older adults as a geriatric syndrome: A review. Geriatr. Gerontol. Int. 2021, 21, 549–554. [Google Scholar] [CrossRef]
- Romano, A.D.; Paglia, A.; Bellanti, F.; Villani, R.; Sangineto, M.; Vendemiale, G.; Serviddio, G. Molecular Aspects and Treatment of Iron Deficiency in the Elderly. Int. J. Mol.Sci. 2020, 21, 3821. [Google Scholar] [CrossRef]
- Sategna, C.; Scaglione, N.; Martini, S. Red cell distribution width as a marker of coeliac disease: A pro-spective study. Eur. J.Gastroenterol. Hepatol. 2002, 14, 177–181. [Google Scholar] [CrossRef]
- Guglielmi, V.; Manchisi, M.; Pellegrini, V.; Tutino, M.; Guerra, V. RDW: Nuovo test per lo screening del morbo celiaco? [RDW: New screening test for coeliac disease?]. Minerva Med. 2002, 93, 419–421. [Google Scholar]
- Goyal, H.; Lippi, G.; Gjymishka, A.; John, B.; Chhabra, R.; May, E. Prognostic significance of red blood cell distribution width in gastrointestinal disorders. World J. Gastroenterol. 2017, 23, 4879–4891. [Google Scholar] [CrossRef]
- Raiteri, A.; Granito, A.; Giamperoli, A.; Catenaro, T.; Negrini, G.; Tovoli, F. Current guidelines for the management of celiac disease: A systematic review with comparative analysis. World J. Gastroenterol. 2022, 28, 154–175. [Google Scholar] [CrossRef]
- Ministerio de Sanidad, Servicios Sociales e Igualdad; Servicio de Evaluación del Servicio Canario de la Salud (SESCS). Protocolo para el diagnóstico precoz de la enfermedad celíaca. Ed. 2018. NIPO: 731-18-022-0. Available online: https://www.sanidad.gob.es/profesionales/prestacionesSanitarias/publicaciones/Celiaquia/enfermedadCeliaca.pdf (accessed on 1 June 2022).
- World Health Organization (WHO). Haemoglobin Concentrations for the Diagnosis of Anaemia and Assessment of Severity. WHO/NMH/NHD/MNM/11.1A. Available online: https://apps.who.int/iris/bitstream/handle/10665/85839/WHO_NMH_NHD_MNM_11.1_eng.pdf (accessed on 12 May 2021).
- Spanish Society of Laboratory Medicine SEQCM. Available online: https://www.seqc.es/ (accessed on 9 July 2022).
- Oberhuber, G.; Granditsch, G.; Vogelsang, H. The histopathology of coeliac disease: Time for a standardized report scheme for pathologists. Eur. J. Gastroenterol. Hepatol. 1999, 11, 1185–1194. [Google Scholar] [CrossRef]
- Catassi, C.; Verdu, E.F.; Bai, J.C.; Lionetti, E. Coeliac disease. Lancet 2022, 399, 2413–2426. [Google Scholar] [CrossRef]
- Penny, H.A.; Raju, S.A.; Lau, M.S.; Marks, L.J.; Baggus, E.M.; Bai, J.C.; Bassotti, G.; Bontkes, H.J.; Carroccio, A.; Danciu, M.; et al. Accuracy of a no-biopsy approach for the diagnosis of coeliac disease across different adult cohorts. Gut 2021, 70, 876–883. [Google Scholar] [CrossRef]
- R Core Team. R: A Language and Environment for Statistical Computing; R Foundation for Statistical Computing: Vienna, Austria, 2019; Available online: https://www.R-project.org/ (accessed on 6 July 2022).
- Laurikka, P.; Nurminen, S.; Kivelä, L.; Kurppa, K. Extraintestinal Manifestations of Celiac Disease: Early Detection for Better Long-Term Outcomes. Nutrients 2018, 10, 1015. [Google Scholar] [CrossRef]
- Balaban, D.V.; Popp, A.; Ionita Radu, F.; Jinga, M. Hematologic Manifestations in Celiac Disease-A Practical Review. Medicina 2019, 55, 373. [Google Scholar] [CrossRef]
- Van Pelt, J.L.; Klatte, S.; Hwandih, T.; Barcaru, A.; Riphagen, I.J.; Linssen Jo Bakker, S.J.L. Reference Intervals for Sysmex XN hematological parameters as assessed in the Dutch lifelines cohort. Clin. Chem. Lab. Med. 2022, 60, 907–920. [Google Scholar] [CrossRef]
- Lippi, G.; Salvagno, G.L.; Guidi, G.C. Red blood cell distribution width is significantly associated with aging and gender. Clin. Chem. Lab. Med. 2014, 52, e197–e199. [Google Scholar] [CrossRef]
- Hoffmann, J.J.; Nabbe, K.C.; van den Broek, N.M. Effect of age and gender on reference intervals of red blood cell distribution width (RDW) and mean red cell volume (MCV). Clin. Chem. Lab. Med. 2015, 53, 2015–2019. [Google Scholar] [CrossRef]
- Harmanci, O.; Kav, T.; Sivri, B. Red cell distribution width can predict intestinal atrophy in selected patients with celiac disease. J. Clin. Lab. Anal. 2012, 26, 497–502. [Google Scholar] [CrossRef]
- Berry, N.; Basha, J.; Varma, N.; Varma, S.; Prasad, K.K.; Vaiphei, K.; Dhaka, N.; Sinha, S.K.; Kochhar, R. Anemia in celiac disease is multifactorial in etiology: A prospective study from India. J.G.H. Open. 2018, 2, 196–200. [Google Scholar] [CrossRef] [PubMed]
- Kalkan, Ç.; Karakaya, F.; Soykan, I. Similarities and differences between older and young adult patients with celiac disease. Geriatr. Gerontol. Int. 2017, 17, 2060–2067. [Google Scholar] [CrossRef]
- Vilppula, A.; Kaukinen, K.; Luostarinen, L.; Krekelä, I.; Patrikainen, H.; Valve, R.; Mäki, M.; Collin, P. Increasing prevalence and high incidence of celiac disease in elderly people: A population-based study. BMC Gastroenterol. 2009, 9, 1–5. [Google Scholar] [CrossRef] [PubMed]
- Mukherjee, R.; Egbuna, I.; Brar, P.; Hernandez, L.; McMahon, D.J.; Shane, E.J.; Bhagat, G.; Green, P.H. Celiac disease: Similar presentations in the elderly and young adults. Dig. Dis. Sci. 2010, 55, 3147–3153. [Google Scholar] [CrossRef] [PubMed]
- West, J.; Fleming, K.M.; Tata, L.J.; Card, T.R.; Crooks, C.J. Incidence and prevalence of celiac disease and dermatitis herpetiformis in the UK over two decades: Population-based study. Am. J. Gastroenterol. 2014, 109, 757–768. [Google Scholar] [CrossRef]
- Fueyo-Díaz, R.; Magallón-Botaya, R.; Masluk, B.; Palacios-Navarro, G.; Asensio-Martínez, A.; Gascón-Santos, S.; Olivan-Blázquezv, B.; Sebastián-Domingov, J.J. Prevalence of celiac disease in primary care: The need for its own code. BMC Health Serv. Res. 2019, 19, 578. [Google Scholar] [CrossRef]
- Mariné, M.; Farre, C.; Alsina, M.; Vilar, P.; Cortijo, M.; Salas, A.; Fernández-Bañares, F.; Rosinach, M.; Santaolalla, R.; Loras, C.; et al. The prevalence of coeliac disease is significantly higher in children compared with adults. Aliment. Pharmacol. Ther. 2011, 33, 477–486. [Google Scholar] [CrossRef]
- Lohi, S.; Mustalahti, K.; Kaukinen, K.; Laurila, K.; Collin, P.; Rissanen, H.; Lohi, O.; Bravi, E.; Gasparin, M.; Reunanen, A.; et al. Increasing prevalence of coeliac disease over time. Aliment. Pharmacol. Ther. 2007, 26, 1217–1225. [Google Scholar] [CrossRef]
- Salmi, T.T.; Collin, P.; Korponay-Szabo, I.R.; Laurila, K.; Partanen, J.; Huhtala, H.; Király, R.; Lorand, L.; Reunala, T.; Mäki, M.; et al. Endomysial antibody-negative coeliac disease: Clinical characteristics and intestinal autoantibody deposits. Gut 2006, 55, 1746–1753. [Google Scholar] [CrossRef]
- Freeman, H.J. Adult celiac disease in the elderly. World J. Gastroenterol. 2008, 14, 6911–6914. [Google Scholar] [CrossRef]
- Kreutz, J.M.; Adriaanse, M.P.M.; van der Ploeg, E.M.C.; Vreugdenhil, A.C.E. Narrative Review: Nutrient Deficiencies in Adults and Children with Treated and Untreated Celiac Disease. Nutrients 2020, 12, 500. [Google Scholar] [CrossRef]
- Mearns, E.S.; Taylor, A.; Thomas Craig, K.J.; Puglielli, S.; Leffler, D.A.; Sanders, D.S.; Lebwohl, B.; Hadjivassiliou, M. Neurological Manifestations of Neuropathy and Ataxia in Celiac Disease: A Systematic Review. Nutrients 2019, 11, 380. [Google Scholar] [CrossRef]
- Jackson, J.R.; Eaton, W.W.; Cascella, N.G.; Fasano, A.; Kelly, D.L. Neurologic and psychiatric manifestations of celiac disease and gluten sensitivity. Psychiatr. Q. 2012, 83, 91–102. [Google Scholar] [CrossRef]
- Ludvigsson, J.F.; Michaelsson, K.; Ekbom, A.; Montgomery, S.M. Coeliac disease and the risk of fractures-A general population-based cohort study. Aliment. Pharmacol. Ther. 2007, 25, 273–285. [Google Scholar] [CrossRef]
- Häuser, W.; Janke, K.H.; Klump, B.; Gregor, M.; Hinz, A. Anxiety and depression in adult patients with celiac disease on a gluten-free diet. World J. Gastroenterol. 2010, 14, 2780–2787. [Google Scholar] [CrossRef]
- Croall, I.D.; Sanders, D.S.; Hadjivassiliou, M.; Hoggard, N. Cognitive Deficit and White Matter Changes in Persons With Celiac Disease: A Population-Based Study. Gastroenterology 2020, 158, 2112–2122. [Google Scholar] [CrossRef]
- Fava, C.; Cattazzo, F.; Hu, Z.D.; Lippi, G.; Montagnana, M. The role of red blood cell distribution width (RDW) in cardiovascular risk assessment: Useful or hype? Ann. Transl. Med. 2019, 7, 581. [Google Scholar] [CrossRef]
- Ananthaseshan, S.; Bojakowski, K.; Sacharczuk, M.; Poznanski, P.; Skiba, D.S.; Prahl Wittberg, L.; McKenzie, J.; Szkulmowska, A.; Berg, N.; Andziak, P.; et al. Red blood cell distribution width is associated with increased interactions of blood cells with vascular wall. Sci.Rep. 2022, 12, 13676. [Google Scholar] [CrossRef]
- Wang, J.; Xiao, Q.; Li, Y. ΔRDW: A Novel Indicator with Predictive Value for the Diagnosis and Treatment of Multiple Diseases. Int. J. Gen.Med. 2021, 14, 8667–8675. [Google Scholar] [CrossRef]
- Kårhus, L.L.; Kriegbaum, M.; Grand, M.K.; Lind, B.S.; Møllehave, L.T.; Rumessen, J.J.; Andersen, C.L.; Linneberg, A. Biochemical abnormalities among patients referred for celiac disease antibody blood testing in a primary health care setting. Sci. Rep. 2022, 12, 6407. [Google Scholar] [CrossRef]
- Brusco, G.; Di Stefano, M.; Corazza, G.R. Increased red cell distribution width and coeliac disease. Dig. Liver. Dis. 2000, 32, 128–130. [Google Scholar] [CrossRef] [PubMed]
- Mitchell, R.M.; Robinson, T.J. Monitoring dietary compliance in coeliac disease using red cell distribution width. Int. J. Clin. Pract. 2002, 56, 249–250. [Google Scholar] [PubMed]
- Balaban, D.V.; Popp, A.; Beata, A.; Vasilescu, F.; Jinga, M. Diagnostic accuracy of red blood cell distribution width-to-lymphocyte ratio for celiac disease. R.R.M.L. 2018, 26, 45–50. [Google Scholar] [CrossRef]
- Yeşil, A.; Senateş, E.; Bayoğlu, I.V.; Erdem, E.D.; Demirtunç, R.; Kurdaş Övünç, A.O. Red cell distribution width: A novel marker of activity in inflammatory bowel disease. Gut Liver. 2011, 5, 460–467. [Google Scholar] [CrossRef] [PubMed]


| Test | Method | [Rf] Reference Value | |
|---|---|---|---|
| Hematological parameters | Hemoglobin concentration | Cyanide-free SLS | >130 g/L men >120 g/L women |
| Hct | HDF | 0.383–0.486 L/L men 0.355–0.449 L/L women | |
| MCV | a MCV Cal | 81–99 fL | |
| RDW | b RDW Cal | 11.6–14.3% | |
| WBC | FFC | 3.4–9.6 × 10⁹/L | |
| PLT | HDF | 135–317 × 109/L men 157–371 × 109/L women | |
| Biochemical parameters | |||
| IS | COL | 65–175 mg/dL men 50–170 mg/dL women | |
| IF | IA | 22–322 ng/dL men 10–291 ng/dL women | |
| TfR | IA | 250–380 mg/dL men 215–365 mg/dL women | |
| TS | c Cal | 15–50% men 20–50% women | |
| FA | CL | >5.4 ng/mL grey zone 3.4–5.4 ng/mL, deficiency <3.4 ng/mL | |
| VB12 | AEC | 211–911 pg/mL | |
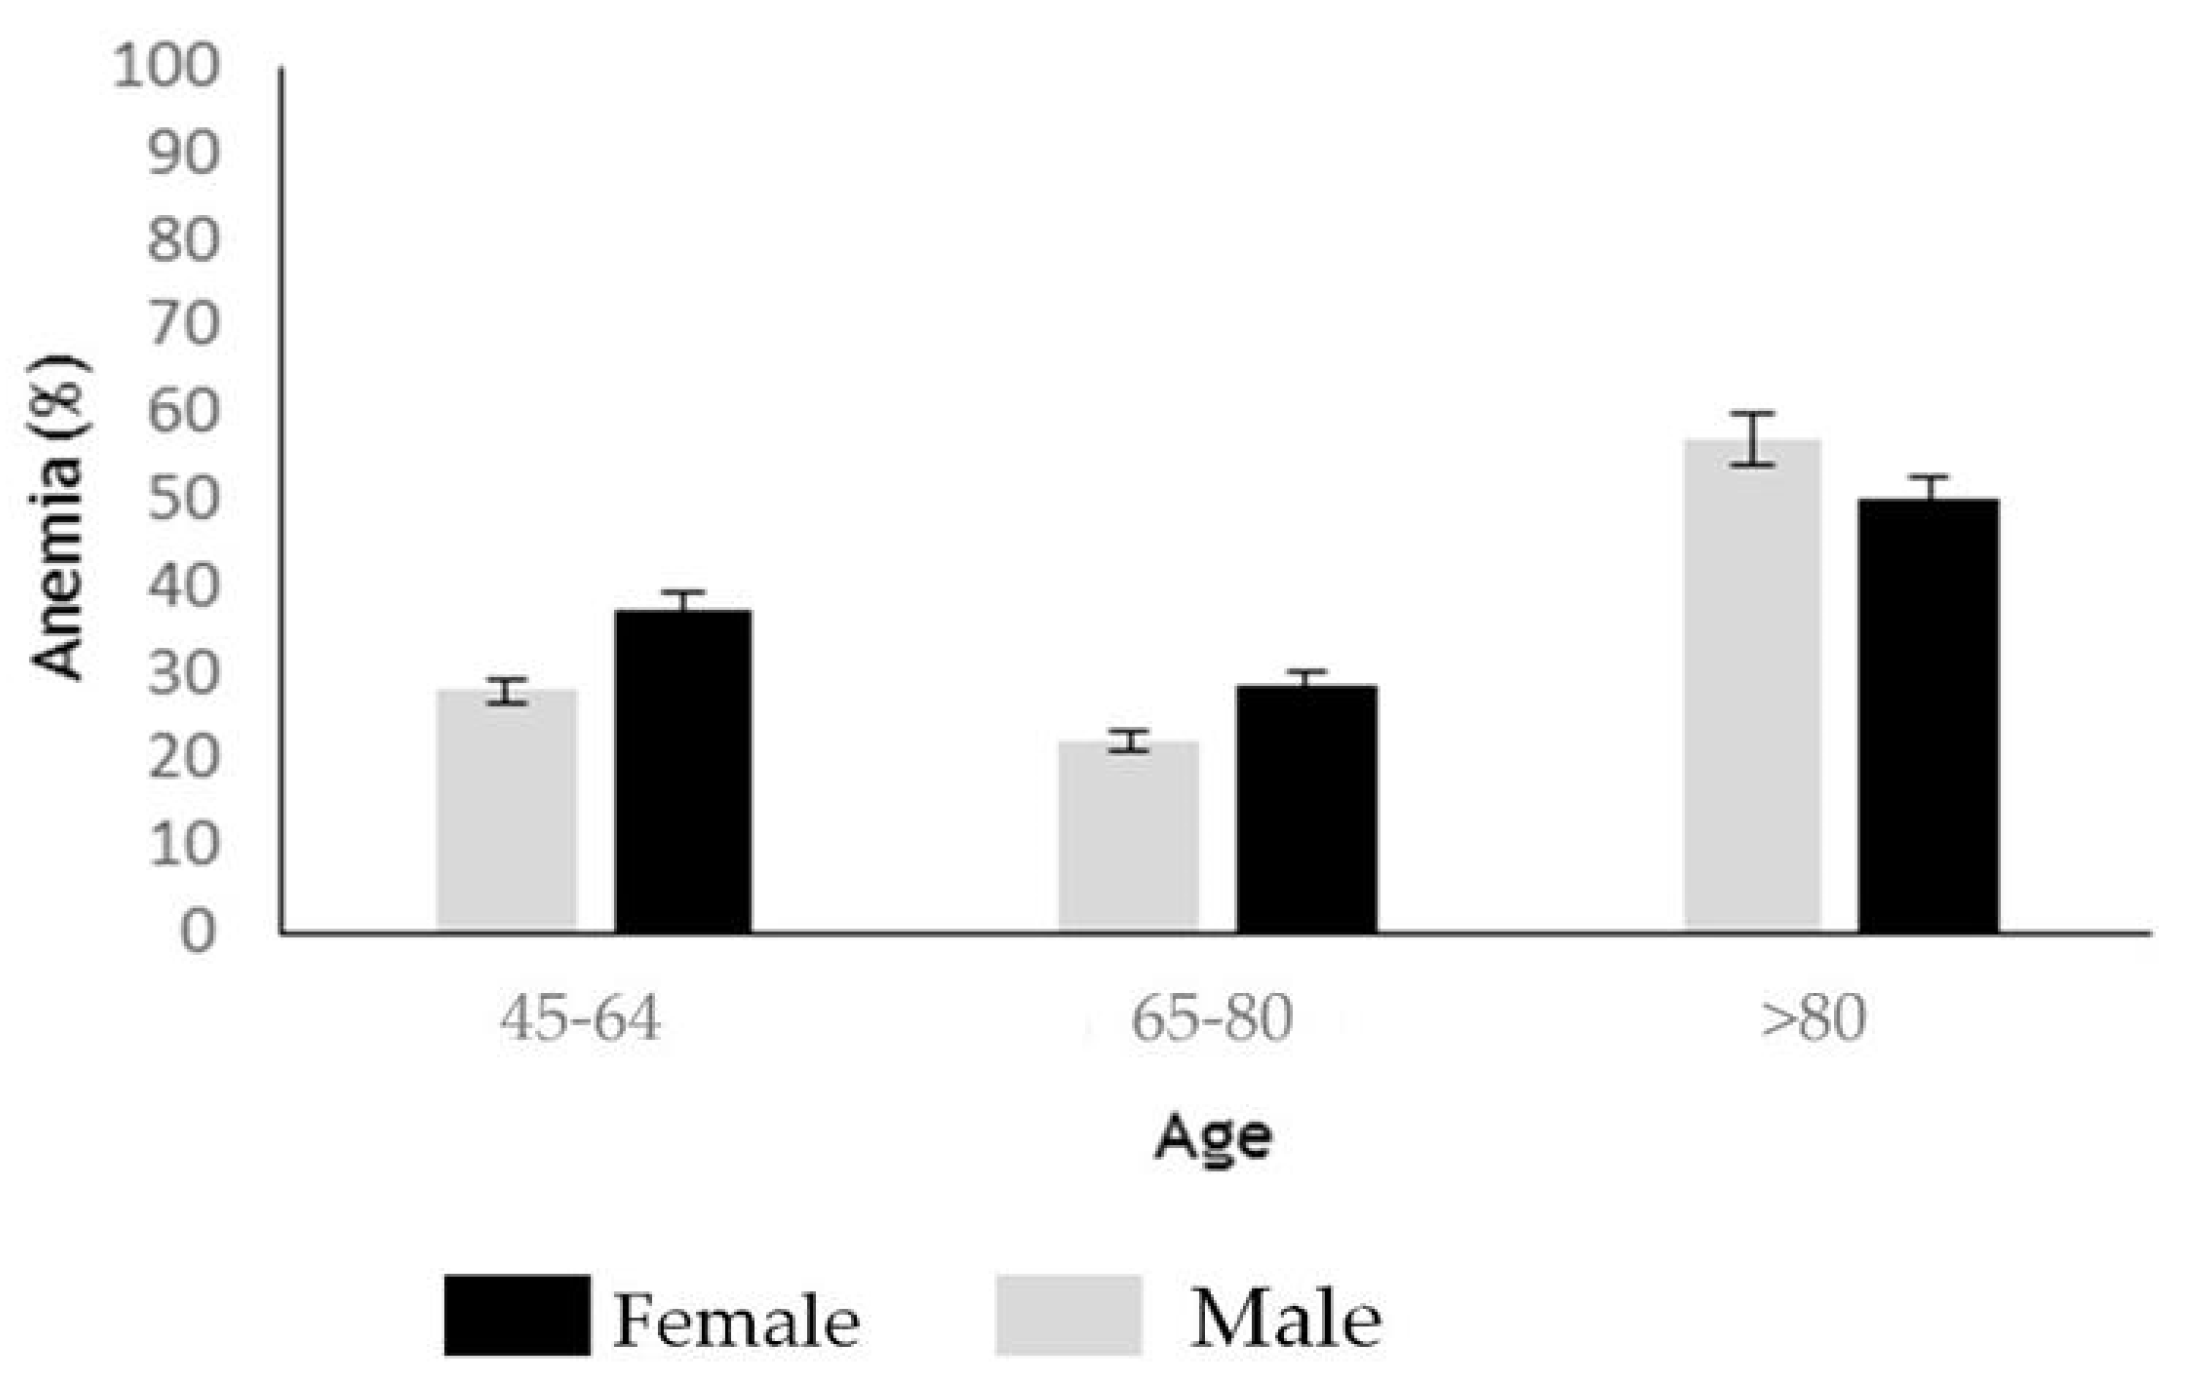
| Demographic characteristics | Mean ± SD | Median (IQR) | n = 101 | % |
|---|---|---|---|---|
| Female | 69 | 68.32 | ||
| Male | 32 | 31.68 | ||
| Age | 63.04 ±12.1 | 62 (52.3–73) | ||
| Gastrointestinal manifestations | 42 | 50.49% | ||
| Chronic diarrhea/malabsorption | 10 | 18.81 | ||
| Chronic abdominal pain, constipation, distended abdomen or irritable colon | 27 | 26.73 | ||
| Gastritis, recurrent vomiting, esophagitis and hepatopathy | 5 | 4.95 | ||
| Extra-intestinal manifestations no hematological | 50 | |||
| Cutaneous/mucosal manifestations: herpetiformis dermatitis, vitiligo | 7 | 6.93 | ||
| Neurological manifestations: headache and cognitive impairment | 6 | 5.94 | ||
| Neuropsychiatric manifestations: depression/anxiety | 12 | 11.88 | ||
| Arthritis/arthralgia and decreased bone mineralization, repetitive fractures | 8 | 7.92 | ||
| Chronic fatigue, diminished appetite | 4 | 3.96 | ||
| Others (kidney, cardiac, gynecologic) | 6 | 5.94 | ||
| Associated endocrine diseases: Hypothyroidism, diabetes type II | 7 | 6.93 | ||
| Familiar screening | 4 | 3.96 | ||
| Associated autoimmune diseases | 18 | 17.82 | ||
| Autoimmune thyroid dysfunction | 4 | 3.96 | ||
| Systemic autoimmune disease (Sjogren’s syndrome and others) | 11 | 10.89 | ||
| Organ-specific autoimmune diseases | 3 | 2.97 | ||
| Hematological Parameter | No CD (n = 168) | CD (n = 84) | p Value | |
|---|---|---|---|---|
| Anemia | ||||
| No | 133 (79.2) | 60 (71.42) | 0.171 | |
| Yes | 35 (20.8) | 24 (28.57) | ||
| a Anemia grade | ||||
| I | 28 (80.0) | 17 (70.83) | 0.576 | |
| II-III | 7 (20.0) | 7 (29.16) | ||
| Hct | ||||
| Normal value | 130 (77.4) | 61 (72.61) | 0.687 | |
| Low/moderate value | 38 (22.6) | 23(27.38) | ||
| MCV | ||||
| Macrocytic | 6 (3.6) | 9 (10.71) | <0.024 | |
| Normocytic | 152 (60.5) | 66 (78.57) | ||
| Microcytic | 10 (5.9) | 9 (10.71) | ||
| RDW | ||||
| Normal value | 109 (64.8) | 35 (41.6) | <0.001 | |
| High > 14.3% | 59 (35.2) | 49 (58.4) | ||
| WBC | ||||
| Normal value | 165 (98.2) | 81(96.42) | 0.380 | |
| leukopenia | 3 (1.8) | 3 (3.57) | ||
| PLT | ||||
| ≥150 × 109/L | 157 (93.5) | 77 (91.66) | 0.603 | |
| <150 × 109/L | 11 (6.5) | 7 (8.3) |
| No CD | Factors | OR (CI) | p Value |
| IF | 0.99 (0.98–1.00) | 0.556 | |
| tRf | 0.99 (0.96–1.01) | 0.456 | |
| TS | 1.10 (1.00–1.24) | 0.061 | |
| FA | 1.01 (0.85–1.21) | 0.883 | |
| VitB12 | 0.99 (0.99–1.01) | 0.364 | |
| IS | 0.93 (0.86–9.81) | 0.023 | |
| CD | Factors | OR (CI) | p Value |
| IF | 1.04 (1.01–1.09) | 0.025 | |
| tRf | 0.96 (0.91–1.01) | 0.245 | |
| TS | 0.56 (0.26–0.92) | 0.058 | |
| FA | 1.00 (0.76–1.25) | 0.937 | |
| VitB12 | 1.00 (0.99–1.00) | 0.181 | |
| IS | 1.27 (1.01–1.78) | 0.079 |
| Biochemical Parameter | No CD a (n/%) | Newly CD Diagnosed CD a (n/%) | p Value | |
|---|---|---|---|---|
| Normal | 29 (26.4) | 20 (37.0) | 0.160 | |
| IS | Low value | 81 (73.6) | 34 (63.0) | |
| Normal | 25 (21.5) | 18 (33.3) | 0.099 | |
| IF | Low value | 91 (78.5) | 36 (66.7) | |
| <250 | 26 (32.9) | 14 (32.5) | 0.820 | |
| TfR | >380 | 2 (2.5) | 2 (4.6) | |
| 250–380 | 51 (64.6) | 27 (62.9) | ||
| <18% | 19 (24.0) | 7 (16.2) | 0.316 | |
| TS | ≥18% | 60 (76.0) | 36 (83.8) | |
| Normal | 56 (78.9) | 22 (61.1) | 0.025 | |
| FA | Grey zone | 15 (21.1) | 14 (38.9) | |
| Deficit | 2 (2.8) | 6 (16.6) | ||
| ≥200 | 69 (98.6) | 31 (93.9) | 0.222 | |
| VitB12 | <200 | 1 (1.4) | 2 (6.1) |
| Atrophy | |||
|---|---|---|---|
| No | Yes | p Value | |
| RDW | 13.2 (12.8–13.5) | 14.7 (13.7–17.0) | 0.007 * |
Disclaimer/Publisher’s Note: The statements, opinions and data contained in all publications are solely those of the individual author(s) and contributor(s) and not of MDPI and/or the editor(s). MDPI and/or the editor(s) disclaim responsibility for any injury to people or property resulting from any ideas, methods, instructions or products referred to in the content. |
© 2022 by the authors. Licensee MDPI, Basel, Switzerland. This article is an open access article distributed under the terms and conditions of the Creative Commons Attribution (CC BY) license (https://creativecommons.org/licenses/by/4.0/).
Share and Cite
Cabo del Riego, J.M.; Núñez-Iglesias, M.J.; Paz Carreira, J.; Blanco Hortas, A.; Álvarez Fernández, T.; Novío Mallón, S.; Zaera, S.; Freire-Garabal Núñez, M. Red Cell Distribution Width as a Predictive Factor of Celiac Disease in Middle and Late Adulthood and Its Potential Utility as Celiac Disease Screening Criterion. Int. J. Environ. Res. Public Health 2023, 20, 66. https://doi.org/10.3390/ijerph20010066
Cabo del Riego JM, Núñez-Iglesias MJ, Paz Carreira J, Blanco Hortas A, Álvarez Fernández T, Novío Mallón S, Zaera S, Freire-Garabal Núñez M. Red Cell Distribution Width as a Predictive Factor of Celiac Disease in Middle and Late Adulthood and Its Potential Utility as Celiac Disease Screening Criterion. International Journal of Environmental Research and Public Health. 2023; 20(1):66. https://doi.org/10.3390/ijerph20010066
Chicago/Turabian StyleCabo del Riego, Julia María, María Jesús Núñez-Iglesias, José Paz Carreira, Andrés Blanco Hortas, Tamara Álvarez Fernández, Silvia Novío Mallón, Sofía Zaera, and Manuel Freire-Garabal Núñez. 2023. "Red Cell Distribution Width as a Predictive Factor of Celiac Disease in Middle and Late Adulthood and Its Potential Utility as Celiac Disease Screening Criterion" International Journal of Environmental Research and Public Health 20, no. 1: 66. https://doi.org/10.3390/ijerph20010066
APA StyleCabo del Riego, J. M., Núñez-Iglesias, M. J., Paz Carreira, J., Blanco Hortas, A., Álvarez Fernández, T., Novío Mallón, S., Zaera, S., & Freire-Garabal Núñez, M. (2023). Red Cell Distribution Width as a Predictive Factor of Celiac Disease in Middle and Late Adulthood and Its Potential Utility as Celiac Disease Screening Criterion. International Journal of Environmental Research and Public Health, 20(1), 66. https://doi.org/10.3390/ijerph20010066