Article

Determination of Pollution and Environmental Risk Assessment of Stormwater and the Receiving River, Case Study of the Sudół River Catchment, Poland

Faculty of Environmental Engineering and Energy, Politechnika Krakowska, 31-155 Kraków, Poland
*
Author to whom correspondence should be addressed.
Int. J. Environ. Res. Public Health 2023, 20(1), 504; https://doi.org/10.3390/ijerph20010504
Submission received: 23 November 2022 / Revised: 12 December 2022 / Accepted: 22 December 2022 / Published: 28 December 2022
(This article belongs to the Special Issue The Impact of Urbanization on Water Resources)

Abstract

:
Changes in the land use of urban catchments and the discharge of stormwater to rivers are causing surface water pollution. Measurements were taken of the quality of discharged stormwater from two areas with different types of development: a residential area and a residential–commercial area, as well as the quality of the Sudół River water below the sewer outlets. The following indicators were studied: TSS, COD, N–NO3, N–NO2, TKN, TN, TP, Zn, Cu, Hg, HOI, and PAHs. The influence of land use on the magnitudes of flows in the river was modeled using the SCS–CN method and the Snyder Unit Hydrograph Model. The results showed an increase in sealing and a resulting increase in surface runoff. Concentrations of pollutants in stormwater and analysis of the potential amounts of loadings contributed by the analyzed stormwater outlets indicate that they may be responsible for the failure to meet environmental targets in the Sudół River. Environmental risk assessment shows that the aquatic ecosystem is at risk. A risk factor indicating a high risk of adverse environmental effects was determined for N–NO3, Zn, and Cu, among others.

1. Introduction

Progressive urban development is adversely affecting the quality of surface water and the performance of sewage systems. This impact can be clearly seen through the disruption of the natural, dynamic, quantitative balance between precipitation and surface runoff processes. Urban catchments are characterized by a dynamic increase in sealed surfaces as a result of the construction of new buildings, roads, sidewalks, or parking lots, which contribute primarily to rapid and fast surface runoff [1], but also to an increase in the concentrations of pollutants entering the receiving watershed. The immediate cause is runoff from roofs, roads, or parking lots, which transport more and more pollutants in an increasingly shorter time [2]. Another factor that negatively affects surface water quality is the development of automobile transportation. It indirectly affects water quality because it is the source of a large amount of various pollutants entering the air.
As a result of the greenhouse effect, an increase in the number of extreme weather events, e.g., hurricanes, droughts, and heavy rainfall, is observed every year, thus determining the need to change the approach to the design of sewage systems [3]. There is a constant search for more and more effective tools for predicting possible hydrological risks and for the assessment of the functioning of the network (its overloading) and individual elements of the stormwater or combined sewer system [4,5].
Another important environmental issue, mainly for surface water quality reasons, is the development of methods for estimating the impact of rapid precipitation on the stormwater recipient, taking into account both the quantity of surface runoff and its quality [6].
The contact of precipitation with airborne pollutants causes it to be already initially polluted. Subsequently, pollution occurs as a result of contact with the catchment area and the formation of surface runoff, where along its path the concentration of pollutants gradually increases, culminating in the incorporation of the sewer system into the receiver [7]. The largest loads of pollutants enter the receiver from high-intensity and short-duration precipitation. Extended over time, low-intensity precipitation does not contribute significant flush loads of pollutants. The level of stormwater pollution is also influenced by the processes of accumulation and leaching of pollutants both in the catchment area and in the drainage system [8]. The rate of pollutant build-up and wash-off is very variable and depends to a large extent on the development and location of the catchment. Additionally, the variability of these processes results from the variability and intensity of precipitation during the year, which determine the load remaining after rainfall and the variability in the occurrence and length of precipitation-free periods [9,10]. Similar relationships also apply to the quality of surface water, which deteriorates in particular during floods (pluvial and fluvial floods) as a result of increased inflow of pollutants from drainage systems and polluted surface runoff, and also as a result of erosion processes [11,12].
Depending on the type of catchment development, surface runoff varies, both hydraulically (culmination time, volume of runoff) and qualitatively (concentration, pollutant load). Surface runoff is often classified in relation to the type of development [13,14,15].
It cannot be overlooked that the progressive pollution of the environment (in this case, surface water) affects not only nature, but also human health. It is estimated [16] that in the last 10 years as many pollutants have entered the Earth’s environment as in the previous 70 years. This is because the rate of spread of pollutants is increasing, which means that, for example, cancer in humans will occur more frequently. This fact is also confirmed by the World Health Organization’s announcement that as many as 75% of human diseases are due to poor environmental conditions [16].
It is therefore necessary to take appropriate measures to improve water and wastewater management in urban areas. This involves conducting studies or a creating a continuous monitoring system for the quantity and quality of stormwater discharged into surface waters [17].
Actions that should also be taken in the long term include the use of the potential of the blue–green infrastructure (BGI) and the management of water at the place of precipitation [18,19]. There are a number of combinations of gray and green infrastructure elements that make it possible to combine individual functions—e.g., retention and infiltration reservoirs that stop water runoff and allow it to slowly seep into the ground— with sedimentation ponds, plant passages, and other bioretention solutions, apart from retention, that participate in mechanical and biological water purification. Changes to the existing underground rainwater drainage systems require significant financial outlay. Their way of functioning requires improvement, so efforts should be made to relieve the network by building retention reservoirs, retention and infiltration reservoirs, or rainwater management at the site of precipitation. A number of studies prove that a greater degree of implementation of green solutions brings lower maintenance costs and better reduction of the amount of surface runoff and improvement in its quality [20,21,22,23].
In urbanized areas in particular, there are many conflicting economic, social, and economic interests related to water management. Urban rivers have long been used at suitable sites to discharge sewage and stormwater, leading to severe damage to aquatic ecosystems, often to the point that they no longer provide ecosystem services to society [24,25]. The current approach is primarily to pay attention to and properly value ecosystem services and to implement the idea of sustainable development [26,27,28]. Among the many benefits of this approach are those that relate to the environmental and social impacts. The environmental impact includes the following benefits: (a) reduction of rapid floods in watercourses, (b) reduction of water pollution, and (c) improvement of soil and water conditions in the catchment area. In turn, benefits of a social nature include: (a) eliminating (at least partially) losses due to flooding, (b) strengthening the ecological awareness of the inhabitants, and (c) improving the aesthetic values of urban areas [17].
Despite a number of studies cited above, it is still unclear what impact urban development without proper stormwater management has on surface water quality. Recognizing these problems, the present study investigated the quality of surface water runoff from urbanized areas and the quality of receiver waters. The aim of the study was to identify pollutant emissions from stormwater drainage systems in urbanized areas in the studied real catchment area of the Sudół River in Krakow. Additional objectives were: analysis of the impact of stormwater pollution on the quality of the Sudół River (threat to achieving the environmental goal: good water status) as well as assessment of environmental risk, i.e., the likelihood of negative effects as a result of exposure to potentially toxic environmental pollution. It is possible to assess the threat to achieving the environmental objective and the environmental risk in the studied catchment area using data from the measurement of concentrations of the following parameters: water quality in outflows from the stormwater drainage system and water quality of the Sudół River, to which stormwater is discharged. The influence of the type of development on the quality of surface runoff was evaluated by estimating and comparing the average concentrations for two different areas: (1) residential development and (2) commercial–service area. The results of pollutant concentrations determined in stormwater and the river were also compared to the limits contained in current regulations [29]. In addition, the authors compared changes in development in the study catchment in 2000 and 2018 and estimated how these changes affected the increase in surface runoff. The impact of the quality of discharged stormwater on the quality of the receiving water body—the Sudół River—was assessed. An innovative aspect of the work is the carrying out of an environmental risk assessment of pollution indicators for surface runoff from residential and service–communication areas and surface water to prevent environmental risks.

2. Materials and Methods

2.1. Sudół River Catchment

The studied catchment area of the Sudół River is located in the northern part of the city of Krakow and in the areas of the communes of Zielonki and Wielka Wieś. The 8.98-km-long Sudół is a right-bank tributary of the Prądnik River; its catchment area is 18.38 km2. The catchment area has a suburban character with a fairly diverse land use, predominantly agricultural and urbanized. In its southern part, within the administrative boundaries of the city of Krakow, industrial or commercial areas and low-density urban buildings predominate. In its central part, there are mainly areas of low-density housing, deciduous forests, meadows, and pastures, while the northern area is largely used for agriculture where there is low-density housing. Figure 1 shows the location of the study area against the background of an orthophotomap showing current land use with the main road transportation routes marked.
The boundary of the Sudół River catchment marked in Figure 1 does not entirely coincide with the boundary of the watershed according to the current Map of the Hydrological Division of Poland (MPHP). The reason for this is the heavily modified and anthropogenically transformed terrain equipped with a developed sewage infrastructure that also drains stormwater from neighboring catchments. Using GIS and SWAT software (QGIS 3.16: open-source, https://www.qgis.org (accessed on 20 November 2022); SWAT: USDA Agricultural Research Service, Temple, Texas, USA), the catchment area was verified by analyzing available databases, i.e., the Numerical Terrain Model (NMT), the National Integration of Utilities (KIUT), and base maps [30]. The result is an expansion of the catchment area of the Sudół River by an area of about 74.9 hectares served by stormwater drainage systems (area boundary marked in red in Figure 1). The drained areas are mainly road traffic routes; areas of industry, large-format trade, and services; and sealed areas of low- and high-intensity residential neighborhoods.
Development of the catchment area of the Sudół River (including the sewer catchment area) includes, according to the Corine Land Cover database (CLC 2018) [31]:
  • agriculture, arable land, cropping systems: 835.6 ha, 46.5% of the catchment area;
  • residential development and sports areas: 530.6 ha, 29.5%;
  • meadows, areas of grassy vegetation: 190.3 ha, 10.5%;
  • forests, wooded areas: 139.3 ha, 8%;
  • industrial and commercial areas: 100.2 ha, 5.5%.
Attention should also be paid to the major transportation routes highlighted in Figure 1, which, according to the Database of Topographical Objects (BDOT10k) [30], account for almost 2% of the catchment area (40.9 hectares). The Sudół catchment area includes the intersection of two national roads, some of the most important in the region, with a daily capacity of more than 45,000 vehicles per day [32], which can lead to increased pollution of air and rainwater with particulate matter, heavy metals, petroleum substances, and polycyclic aromatic hydrocarbons (PAHs).
The Sudół River belongs to the Prądnik surface water body (JCWP Prądnik RW200006213749), which is characterized as an upland watercourse on carbonate substrate (type RW_wap). According to current legislation [29], the environmental objectives for the studied watercourse, i.e., the limit values of surface water quality indicators for good status (Class II), are presented in Table 1.
The catchment area of the Sudół River is not monitored, but the higher-order river Prądnik is studied as part of the State Environmental Monitoring (PMŚ). The Sudół is the second largest of the Prądnik’s seven tributaries; the Sudół catchment constitutes about 10% of the Prądnik total catchment area (169.5 km2). The Prądnik is monitored at the estuarine measurement and control cross-section “Prądnik-Białucha Krakow Ujście” located about 4.7 km below the mouth of the Sudół River. The latest survey results (2020) show that the waters of the Prądnik reach [33]:
  • Class III in terms of biological elements,
  • Class II exceedances for physical and chemical elements, including class II exceedances for nutrients (TKN, N–NO3, N–NO2, TN, P–PO4, and TP), and class II for particularly harmful substances (including class II concentrations of Zn, Cu, HOI).

2.2. Water Sampling and Research on the Quality of Surface Runoff and Waters of the Sudół River

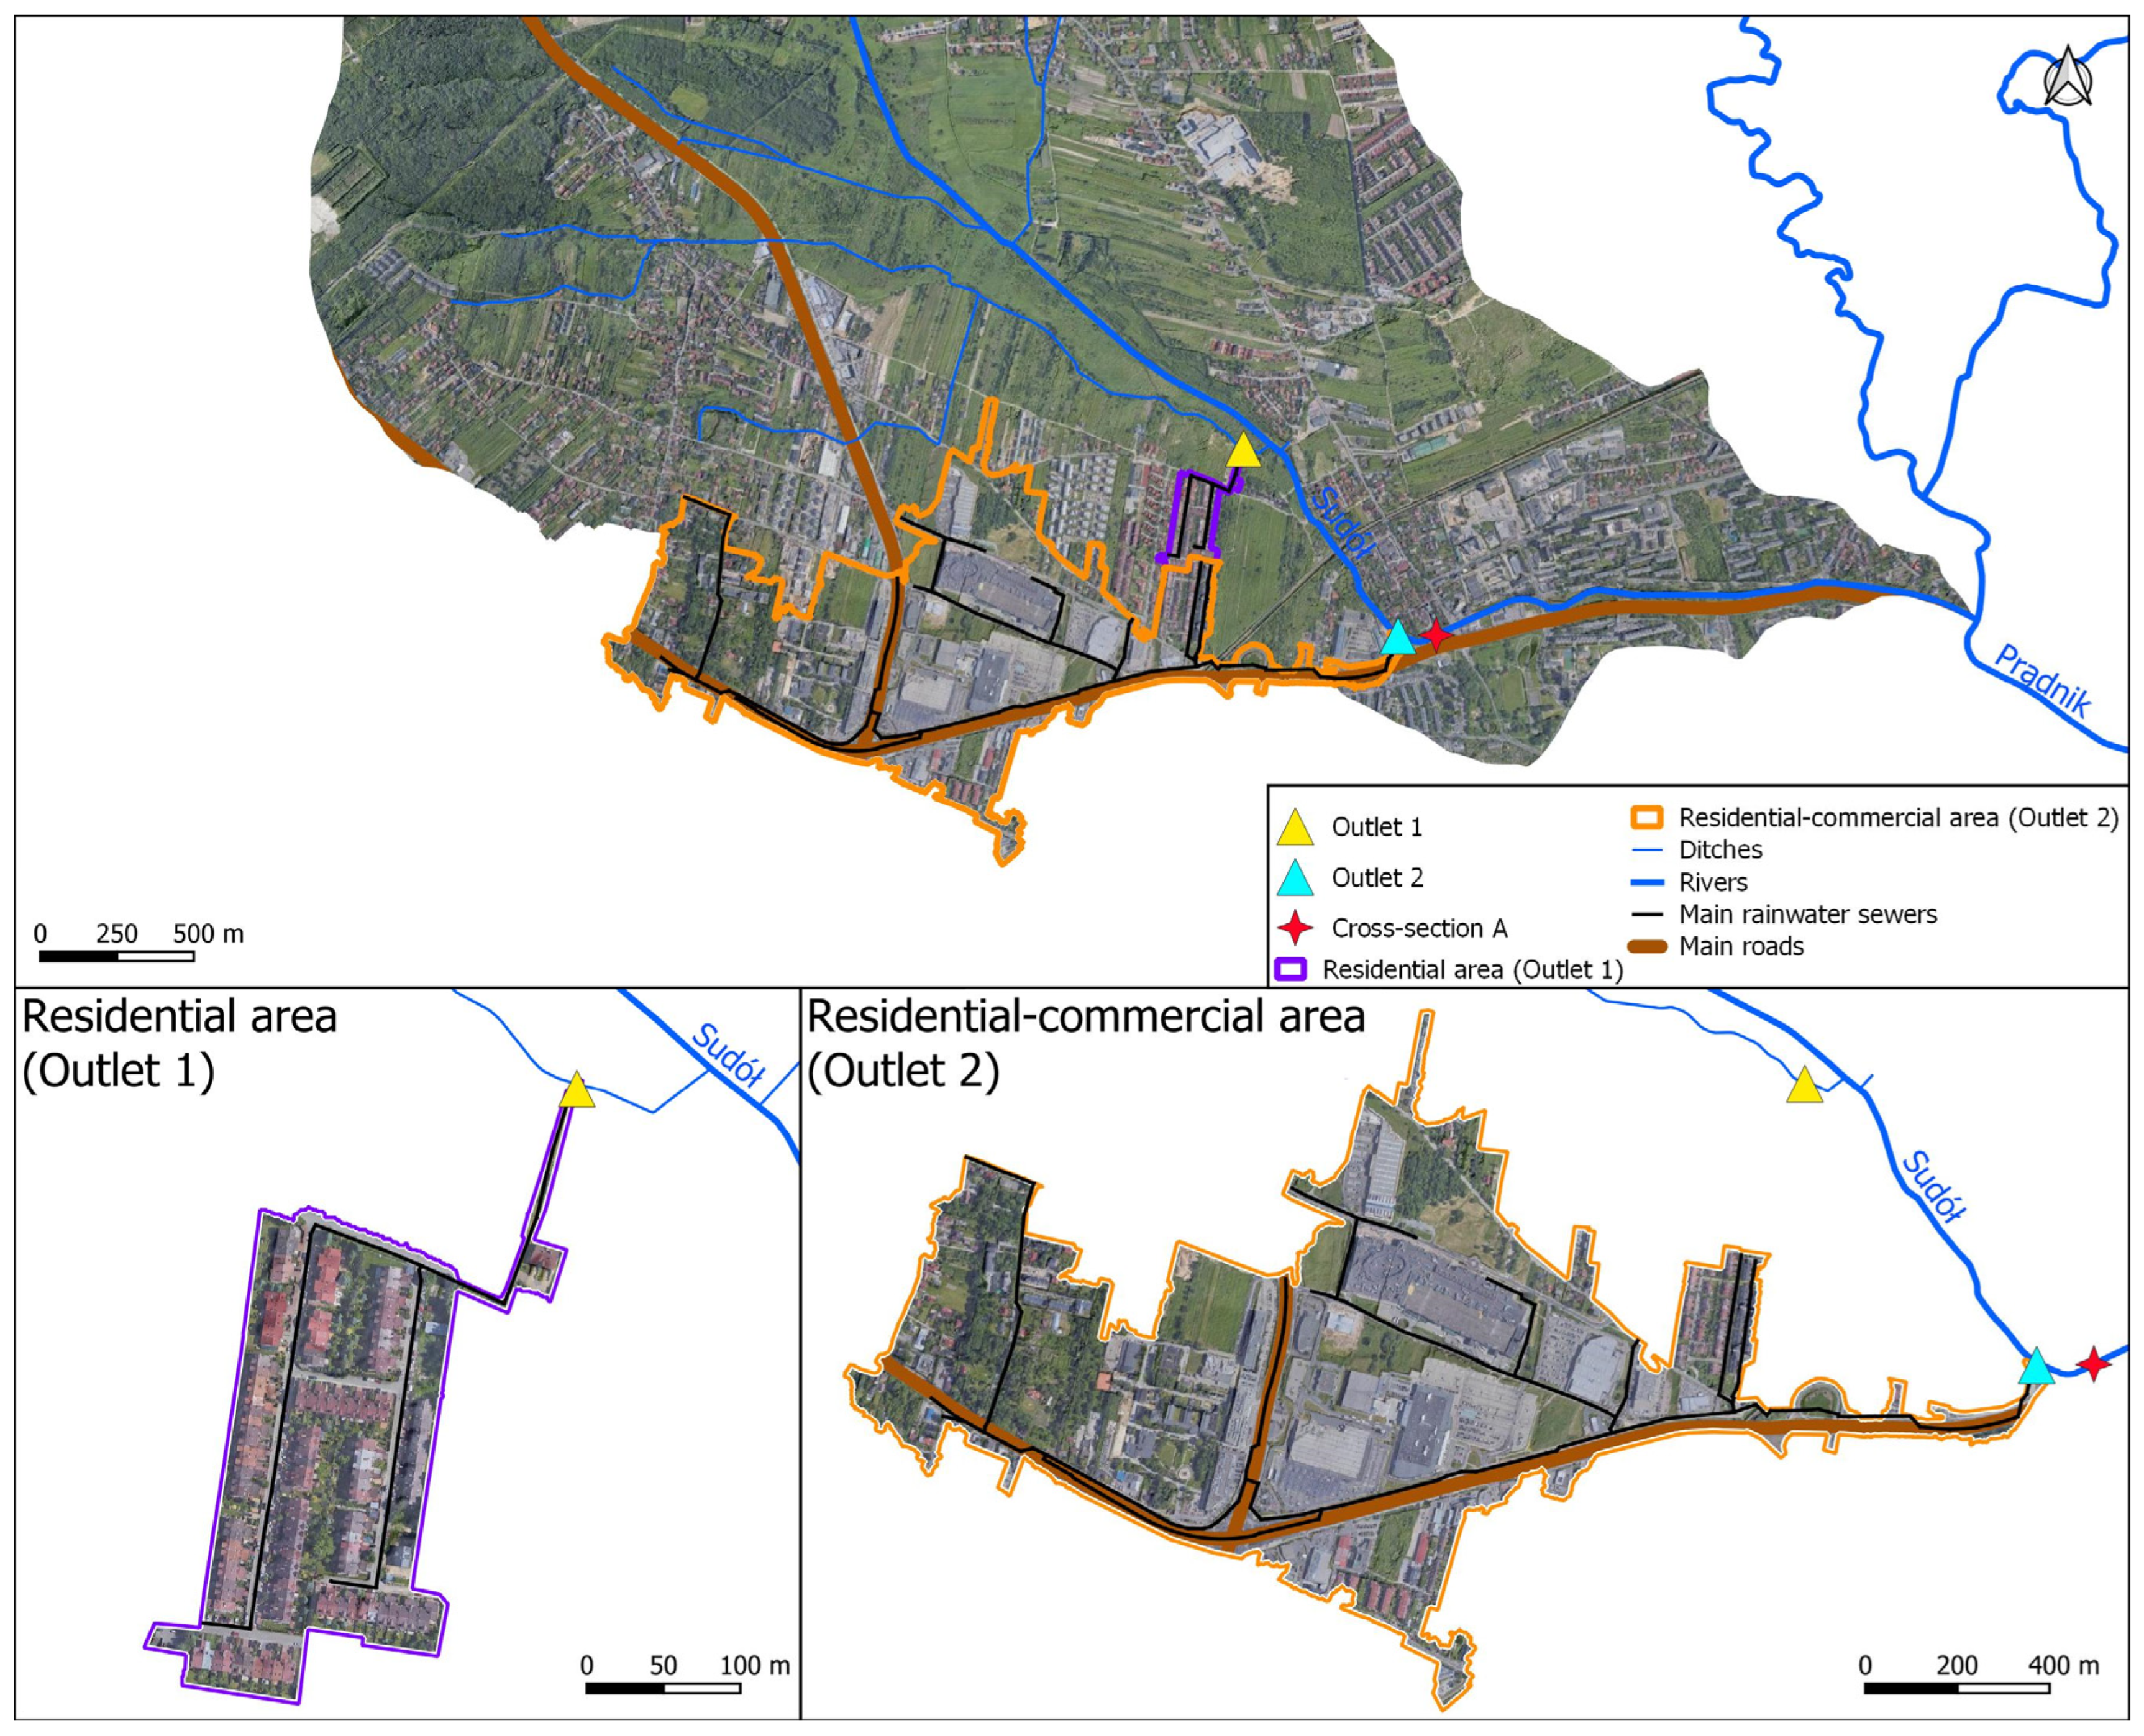
2.2.1. Sampling Locations

In order to identify the actual water quality status of the Sudół River and the impact of surface runoff from the stormwater drainage system on the Sudół water quality, the research work included measurement campaigns of river water quality and selected outflows from the stormwater drainage system.
The study of surface runoff quality included two areas drained by stormwater drainage systems with discharge of stormwater to surface waters:
  • residential area: an area of low-density urban development with about 118 terraced houses with home gardens; stormwater drainage also drains local access roads and pedestrian routes; stormwater drainage catchment area of 4.22 hectares; the length of the drainage network of 1.3 km with drainage of stormwater into the drainage ditch draining into the Sudół in 6.25 km, marked as outlet 1 in Figure 2,
  • an area of industrial, commercial and communications land and low-density residential development: about 65 ha of single- and multi-family residential development; more than 54 ha of industrial and commercial land and roads; less than 1.3 ha of biologically active land (meadows and pastures), accounting for about 1% of the catchment area; a stormwater drainage system of about 53.4 km serves as a catchment area of 120.31 ha in total and discharges stormwater directly into the Sudół River in 7.01 km, marked as outlet 2 in Figure 2.
Waters of the Sudół River were sampled at 7.14 km (cross-section A in Figure 2), located about 130 m downstream of outlet 2, 1.83 km to the Sudół confluence with the Prądnik River. Cross-section A encloses a catchment area of about 17.2 km2.

2.2.2. Stormwater and Surface Water Pollution Indicators Tested

The pollutants that occur in stormwater can be classified into several main categories: solids (insoluble), heavy metals, trace substances, organic compounds, herbicides, and petroleum substances [34,35]. Another classification is presented in the work [36], where 25 priority pollutants, i.e., the most dangerous for the environment and humans, were identified, which require special attention when studying the quality of stormwater. These pollutants were divided into five categories (Table 2).
For the analysis of surface runoff quality, 10 measurement cycles were carried out from 2019 to 2022 by sampling stormwater flowing from outlets 1 and 2 of the stormwater drainage systems indicated in Figure 2.
Sudół waters were sampled and analyzed in three measurement cycles in 2022.
The study focused on selected groups of indicators characterizing: (a) physical condition: total suspended solids (TSS) concentration; (b) oxygen conditions and organic pollutants: chemical oxygen demand COD; (c) biogenic conditions: Kjeldahl nitrogen TKN, nitrate nitrogen N–NO3, nitrite nitrogen N–NO2, total nitrogen TN, and total phosphorus TP, were examined. In addition, specific synthetic and non-synthetic pollutants in the form of petroleum hydrocarbons (hydrocarbon oil index HOI) [37], as well as heavy metals such as zinc (Zn), copper (Cu), and mercury (Hg) were also evaluated. The assessment also included the determination of substances particularly harmful to the aquatic environment identified as water policy priority substances, which include polycyclic aromatic hydrocarbons (PAHs). The resulting PAH concentration is the sum of the concentrations of the compounds: benzo(b)fluoranthene, benzo(k)fluoranthene, benzo(a)pyrene, benzo(ghi)perylene and indeno(123-cd)pyrene.
Total suspended solids are considered the most significant water pollutant in urban areas [38]. Total suspended solids originate from dust fallout mainly from coal combustion, dust emissions, and pollutants emitted by transportation [39,40,41]. Total suspended solids have the ability to sorb other pollutants on their surface, such as heavy metals, petroleum substances, hydrocarbons, or nitrogen and phosphorus compounds, which is directly reflected in the results of other indicators tested, which are significantly exceeded. Increased suspended solids in the outlets from the drainage system may also be caused by leaching of sediments accumulated in collectors and rainwater wells. Suspended sediment load is related to flow, catchment parameters, and seasonality (season of the year or even month) [42,43].
Chemical oxygen demand (COD) was determined in waters because it conventionally determines the amount of chemically degradable substances. According to many studies, it showed strong correlations with the concentration of total suspended solids, among others [44]. Biogenic compounds are parameters that should be studied especially when green areas have a large share of the total catchment area or when the catchment includes agricultural land. Biogenic compounds include nitrogen and phosphorus, which are responsible for eutrophication, that is, excessive growth of periphyton (diatoms, green algae, and cyanobacteria) and macrophytes (algae, bryophytes). The most commonly studied are nitrate nitrogen, total nitrogen, and total phosphorus. The various forms of nitrogen in waters come from: atmospheric diffusion, surface runoff, domestic sewage, and industry. Sources of phosphorus in water can be rock weathering, soil erosion, leaching of phosphate minerals from the ground, and decomposition of plant and animal matter.
Heavy metals, which are a group of pollutants dangerous to both flora and fauna, are also determined in waters. Heavy metals are a byproduct of fuel combustion processes [45]. In addition, petroleum hydrocarbons (HOI) are determined in stormwater and river waters, the presence of which in water is due to human activities, which include the use of diesel, lubricating oils, and transformer oils in all machinery and vehicles [46]. Polycyclic aromatic hydrocarbons (PAHs) are also determined in water. Their presence in water can result from human activities, which include the burning of fossil fuels (under Polish conditions, the cause of their occurrence can be individual, distributed heating systems) and the burning of liquid fuels in vehicles with internal combustion engines as well as tire abrasion. PAHs emitted into the atmosphere can be freely transported over long distances and can cause water pollution [47].

2.2.3. Methods for Determining Indicator Concentrations

The collected water samples from the drainage outlets and the Sudoł River were subjected to physical and chemical analysis at an accredited testing laboratory belonging to the Waterworks of the City of Krakow S.A. This laboratory holds a certificate number AB 776 issued by the Polish Accreditation Center [48]. Determinations of individual indicators were carried out using the following methods:
  • total suspended solids by weight according to PN-EN 872:2007 + Ap1:2007;
  • chemical oxygen demand (COD) by spectrophotometric method according to PN-ISO 15705:2005;
  • Kjeldahl nitrogen concentration by spectrophotometric method according to PN-EN 25663: 2001;
  • nitrate nitrogen concentration by spectrophotometric method according to PN-82/C-04576/08;
  • nitrite nitrogen concentration by spectrophotometric method according to PN-EN 26777: 1999;
  • total nitrogen concentration from calculations according to PN-73C-04576/14;
  • total phosphorus concentration by spectrophotometric method according to PN-EN ISO 6878:2006 (pkt 7) + Ap1:2010 + Ap2:2010;
  • hydrocarbon oil index (petroleum hydrocarbons) by gas chromatography with flame-ionization detection (GC–FID) according to PN-EN ISO 9377-2:2003;
  • concentration of metals: zinc and copper by flame atomic absorption spectrometry (FAAS) according to PN-ISO 8288:2002, method A; mercury by atomic absorption spectrometry with amalgamation technique according to PB-W-38 issue 3, dated 04.01.2021.
  • concentration of polycyclic aromatic hydrocarbons (PAHs) calculated as the sum of benzo(b)fluoranthene, benzo(k)fluoranthene, benzo(a)pyrene, ben-zo(ghi)perylene, and indeno(123-cd)pyrene determined by high performance liquid chromatography with fluorescence detection (HPLC–FLD) according to PN-EN ISO 17993:2005.

2.3. Surface Runoff Modeling

The change in development in urbanized areas causes an increase in soil sealing; the construction of buildings (residential, commercial, industrial, etc.) and accompanying infrastructure (roads, parking lots, pedestrian routes) creates impervious surfaces that hinder or prevent the infiltration of rainwater into the ground. Sealing of areas brings an increase in the share of surface runoff in the water balance, as well as increased inflow of pollutants.
The average amount of annual precipitation in Krakow in the last multi-year period 1991–2021 was 673 mm. The average number of days with precipitation above 0.1 mm was 172 days, with the majority being precipitation with daily totals up to 10 mm (0.1–1 mm 65 days, 1–5 mm 66 days, 5–10 mm 24 days); precipitation with daily totals above 10 mm occurred on average for 17 days per year [49]. For the purpose of this study, a design precipitation of 19.38 mm (p = 20%, frequency of 1 in 5 years) determined from a local precipitation model for the city of Krakow was used.

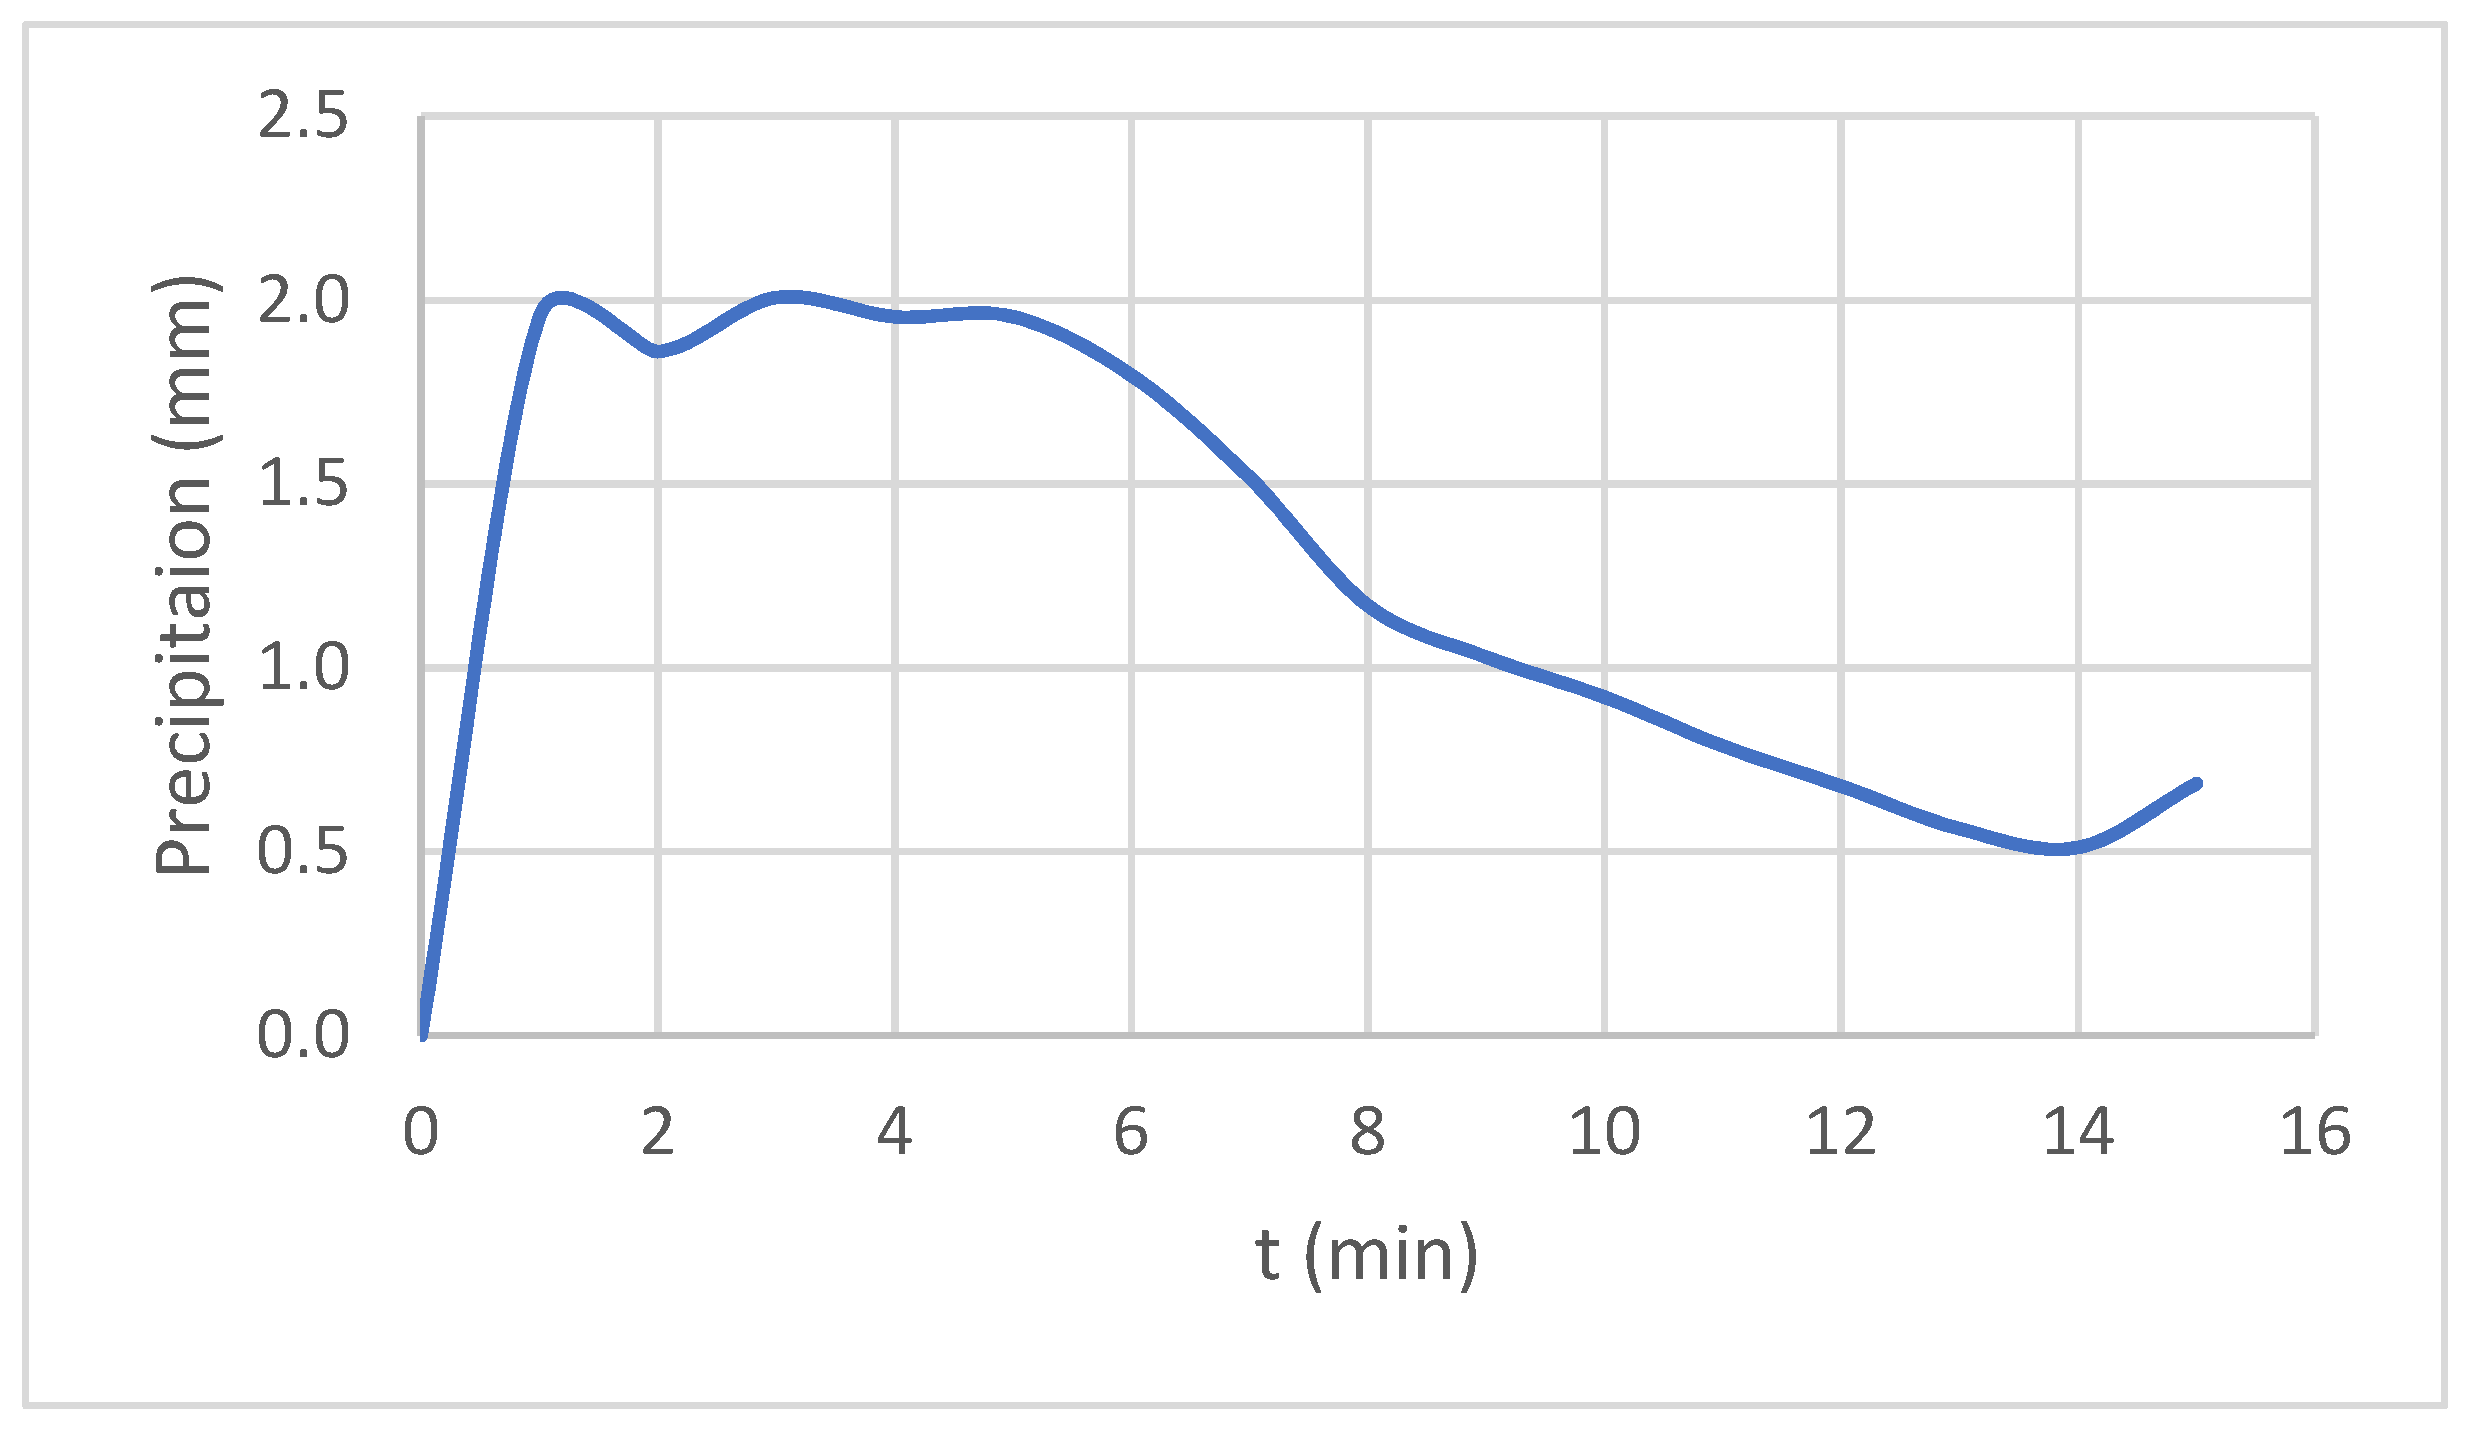
2.3.1. Precipitation Modeling

For the modeling and sizing of the drainage system of the city of Krakow, the local precipitation model developed by Krakow Water [50] was used. The model was developed based on the distribution series of phase precipitation maxima for durations (phases) ranging from 5 to 4320 min, from observations in the period 1986–2019. Four local model hyetographs were also developed based on them. For the purposes of this work, in accordance with the recommendations of Krakow Water [50] and the Polish standard [51], rainfall with a probability of occurrence of p = 20% (frequency of 1 in 5 years) and a duration of 15 min was adopted for the design of infrastructure in urban centers, service areas, and industry for the design of drainage systems. The precipitation with such parameters is 19.38 mm, and its intensity is equal to 215.33 dm3/(s∙ha). The distribution of precipitation according to the type 1 hyetograph was adopted; the frequency of rainfall events with a distribution over time consistent with this hyetograph is one rainfall event per approximately three torrential rainfall events [50] (Figure 3).

2.3.2. Runoff Modelling

A review of approaches to modeling the impact of sealing on the hydrology of urbanized catchments was done by Jacobson [52] and Lisennbee et al. [53] in review papers; other review papers include [54,55,56,57]. The aforementioned papers analyze ways to identify and quantify this impact, showing the most commonly used ways to model the impact of sealing include hydrological models such as HydroCAD, L–THIA, MIKE Products, MOUSE, MUSIC, SWAT, SWMM, and others. Additionally, modeling the surface runoff by applying the Soil Conservation Service Curve Number method (SCS–CN) is used [58,59,60,61,62,63].
In this study, hydrological modeling is conducted using:
  • calculations of effective precipitation by the SCS–CN method,
  • transformation of effective precipitation into surface runoff using the Snyder Unit Hydrograph Model.

2.3.3. SCS–CN Method

The SCS method is commonly used for hydrological modeling in both controlled and uncontrolled catchments [64,65]. This method to assess the impact of urbanization on changes in hydrology was used, among others, by Li et al. [66], who studied the hydrologic effects of urbanization on direct runoff characteristics in Shenyang (China) and by Sjöman and Gill [67] in the analysis of sealing due to changes in land use in the Höjeå river catchment (Sweden). In the SCS–CN method, effective precipitation depends on the soil group and land use of the catchment area. These factors are captured by the dimensionless parameter CN, taking values in the range of (0, 100]. The amount of excess rainfall is calculated from the formula [68,69]:
P e = { ( P 0.2 S ) 2 P + 0.8 S ,   w h e n   P 0.2 S 0 ,   w h e n   P < 0.2 S ,
where:
P e = excess rainfall (mm),
P = total rainfall (mm),
S = maximum potential catchment retention (mm).
Maximum potential catchment retention S is determined by the relationship [68]:
S = 25.4   ( 1000 CN 10 ) ,
where:
CN is the parameter (curve number) of distribution of precipitation to runoff (0 = no runoff and 100 = total runoff).
In urban areas, the CN parameter—the curve number for a highly sealed surface, such as asphalt surfaces, from which almost all of the precipitation goes into surface runoff—is 98. For biologically active green surfaces such as lawns or urban parks, the curve number (CN) varies from 39 to 89, depending on the quality of the green areas and also on soil conditions (i.e., lower CN values for more permeable soils such as sands and high CN values for soils with high clay content) [67,69]. The SCS–CN method categorizes soils into one of four different groups: (A) sand, loamy sand, (B) silt loam or loam, (C) sandy clay loam, and (D) clay loam, silty clay loam, sandy clay, silty clay, or clay [67]. Table 3 summarizes the values of the CN parameter for the urban catchment area.
For areas with variable development, the CN value can be determined as a weighted average from the formula:
CN = CN a v . = 1 A i = 1 n ( CN i · A i ) ,
where:
CN a v . = average value of the parameter CN ,
CN i A i = the value of the CN parameter for the i-th homogeneous surface,
A i = area of the i-th homogeneous surface (km2),
A = catchment area (km2).

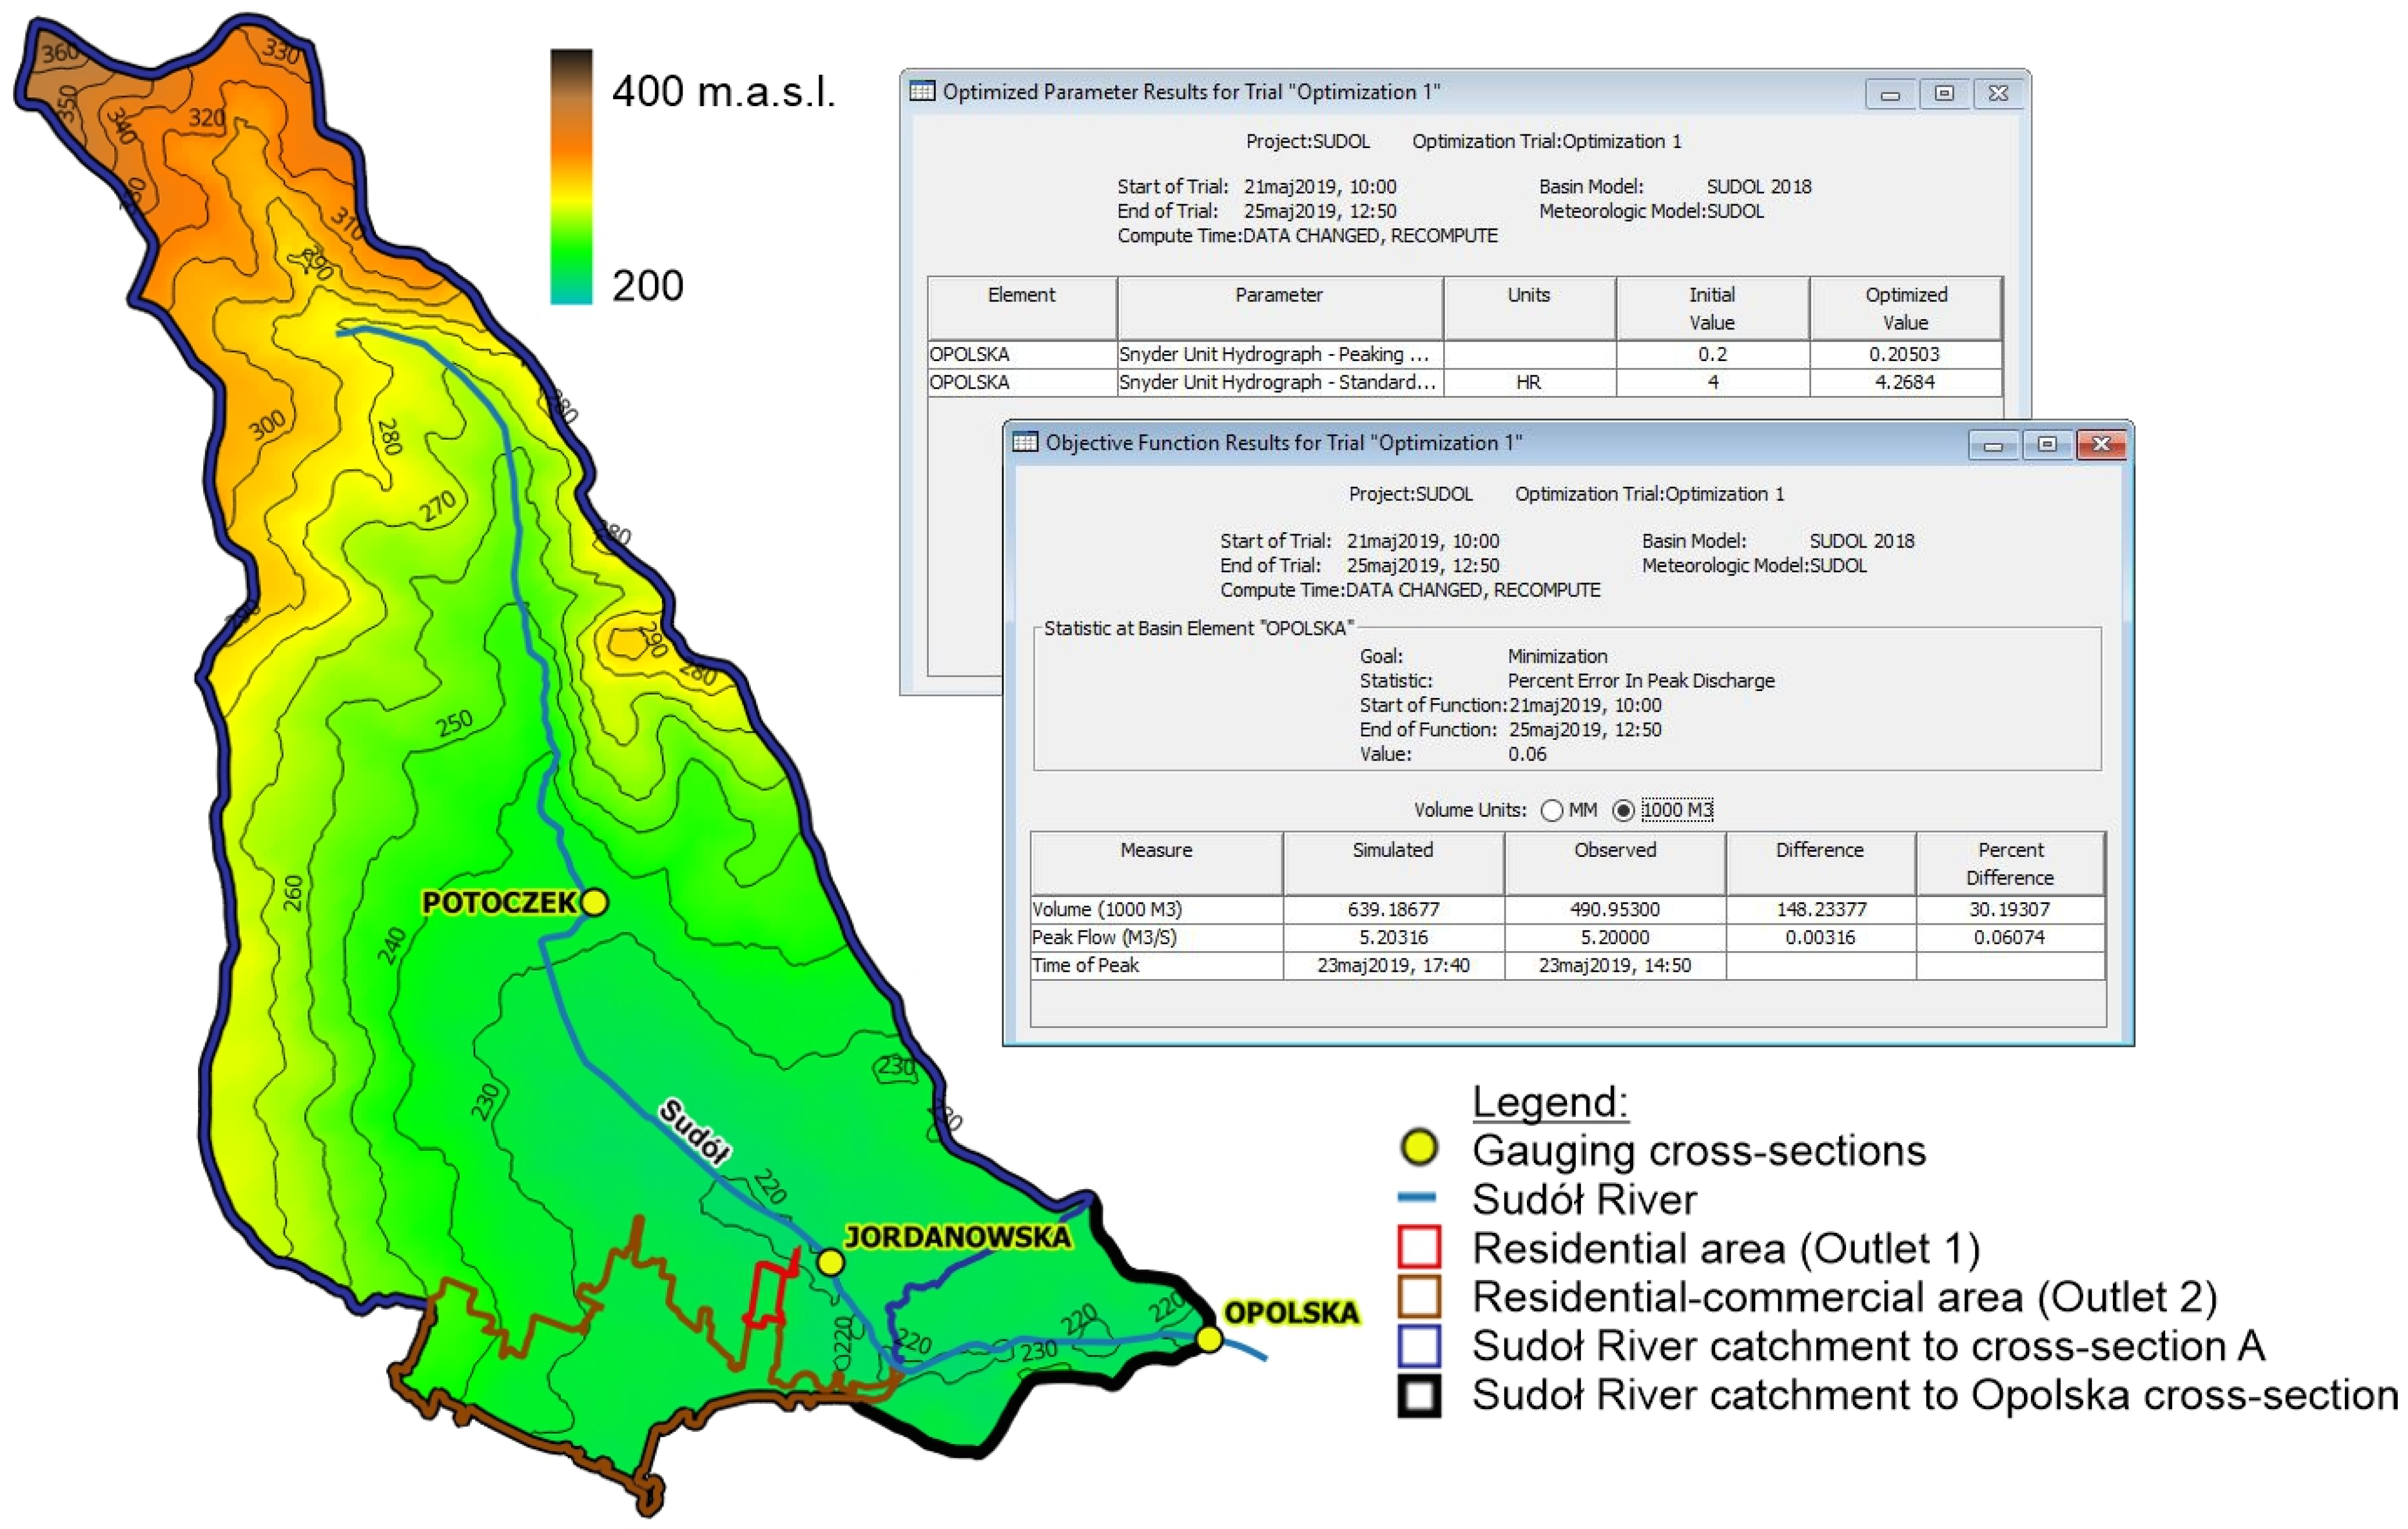
2.3.4. Snyder Unit Hydrograph Model

Quantitative modeling of runoff generation and transfer to the outlet is necessary to assess the impact of urbanization and land use on changes in hydrology. For ungauged catchments, modeling can be used by employing unit hydrograph models. To calculate the transformation of effective precipitation into surface runoff for the Sudół River, the HEC–HMS program was used, in which the Snyder Unit Hydrograph Model (SUHM) [70] is applied to determine the flow in a controlled catchment.
The results of many studies indicate the accuracy and usefulness of the SUHM for derivation of the runoff hydrograph: Jena and Tiwari [71] applied SHUM in watersheds in the West Bengal state (India), and El Hassan et al. [72], Haibo et al. [73], and Babu et al. [74] used the SUHM (embedded in the HEC–HMS) to simulate rainfall-runoff processes. Other applications concerned the development of a synthetic unit hydrograph, e.g., for arid catchments (Oman) [75] and applications of SUHM to assess flood hazards in Georgia [76] and in India [77,78]. A review of other SUHM applications is also presented by Bahrami et al. [79]. Polish research includes work by Młyński et al. [68] that analyzes the possibility of using selected rainfall-runoff models, including the Snyder UHM, to determine the design hydrograph and the associated peak flow in a mountain catchment, showing fewer errors of the EBA4SUB model than the Snyder UH and NRCS–UH models and pointing to it as an alternative to these models.
SHUM is based on the concept of the unit hydrograph, whose basic parameters are: the lag t p , peak flow U p , and total time base t r [70]. The parameters of the mathematical model are estimated based on certain physiographic characteristics of the catchment (for uncontrolled catchments) or can be determined by optimization methods (for controlled catchments).
The time of occurrence of the culmination of the unit hydrograph t p is calculated from the formula [70]:
t p = 5.5 · t r ,
where:
t p = the basin lag (h),
t r = standard duration of effective rainfall (h).
Using the catchment parameters, the lag time can be determined from the equation [70]:
t p = 0.75 · C t · ( L · L C ) 0.3 ,
where:
C t = basin coefficient related to catchment area retention ( C t = 1.8–2.2),
L = length of the main stream from the outlet to the divide (km),
L C = length along the main stream from the outlet to a point nearest the watershed centroid (km).
The culminating flow U p is calculated from the formula [70]:
U p A = 2.75 C p t p ,
where:
C p = Snyder model parameter related to catchment retention ( C p = 0.4–0.8);
A = catchment area (km2).
tp = the basin lag (h).
Within the framework of the present study, a mathematical model of the catchment area of the Sudół River was developed based on data from the automatic measurement system established in the Sudół River catchment [80]. Location of three gauging cross-sections (Potoczek, Jordanowska, and Opolska) of the measurement system on the Sudół River is presented in Figure 4.
The model was run using the HEC–HMS 4.7 computer program.
Two basic components of a streamflow hydrograph are: (1) direct runoff and (2) baseflow [70,81]. Baseflow is the sustained or “fair-weather” runoff of prior precipitation that was stored temporarily in the watershed, plus the delayed subsurface runoff from the current storm.
There are three methods of separation of baseflow: straight line, fixed base, and variable gradient [70,81]. The Sudoł model assumed a constant, monthly-varying value of the baseline flow (a standard option of the HEC–MS model), which was determined on the basis of data from the automatic measurement system of the Sudół River. For the month of May 2019, the base flow was 0.07 m3/s.
The topography of the catchment area and the hydrographic network is shown in Figure 4.
Since the maximum flow was the most important variable in the calculations, the rainfall of May 2019, which caused high levels and flows in the Sudół watercourse, was adopted for the calibration of the model. Figure 5 shows the water level of April 2019 (high water) and August 2020 (low water).
The model calibration used precipitation-flow data from 2019 for the Opolska gauging cross-section (Figure 6). For calculation purposes, each area was defined as an independent catchment. The model used two methods:
  • SCS to calculate the effective precipitation based on the CN parameter, according to Equations (1)–(3),
  • SNYDER UHM (Standard) to calculate the transformation of effective precipitation into surface runoff for a controlled catchment according to Equations (4)–(6).
The following parameters of the Snyder model were assumed for the calculations:
  • Standard Lag (HR): 4.2684
  • Peaking Coefficient: 0.20503.

2.4. Water Quality and Enviromental Risk Assesment

2.4.1. Estimation of Pollutant Load

For the studied pollutant indicators, the value of the load flowing with runoff from the catchment was determined using the formula [82]:
P L = 0.0864 · P C · Q   ,
where:
P L = pollutant load (g/s),
P C = pollutant concentration (mg/L),
Q = outflow from the sewer outlet/flow in the river (m3/s).

2.4.2. Environmental Risk Assessment

Based on the risk quotient (RQ), the potential ecological risk of organic compounds on aquatic ecosystems is assessed, that is, the likelihood of negative effects due to exposure to potentially toxic environmental contaminants [83]. RQ can be calculated for three representative trophic levels of an aquatic ecosystem, which are fish, invertebrates, and algae [84]. Risk analysis involves comparing the maximum measured environmental concentration of a given compound, i.e., measured environmental concentration (MEC), to the predicted concentration of the substance below which no harmful environmental effects are observed, i.e., predicted no effect concentration (PNEC) [85]. RQ values for individual indicators were calculated according to the formula [86,87]:
RQ = MEC PNEC ,
To determine the environmental risk for each indicator, the following classification was adopted [88]:
RQ < 1 = no environmental risk,
1 ≤ RQ < 10 = there is little potential for adverse effects,
10 ≤ RQ < 100 = potential for adverse effects is significant,
RQ ≥ 100 = adverse effects are to be expected.
PNEC values were taken from the available literature (Table 4). If more than one value was found for the analyzed compound for a given trophic level, the lowest value was taken into account, thus reflecting the environmental risk for the most sensitive species [89]. The PNEC is determined as a quotient of the results of toxicity tests, consisting of the determination of the concentration of a substance causing specific harmful effects and the corresponding value of a safety factor selected according to the guidelines of Directive 2000/60/EC [90,91].

3. Results

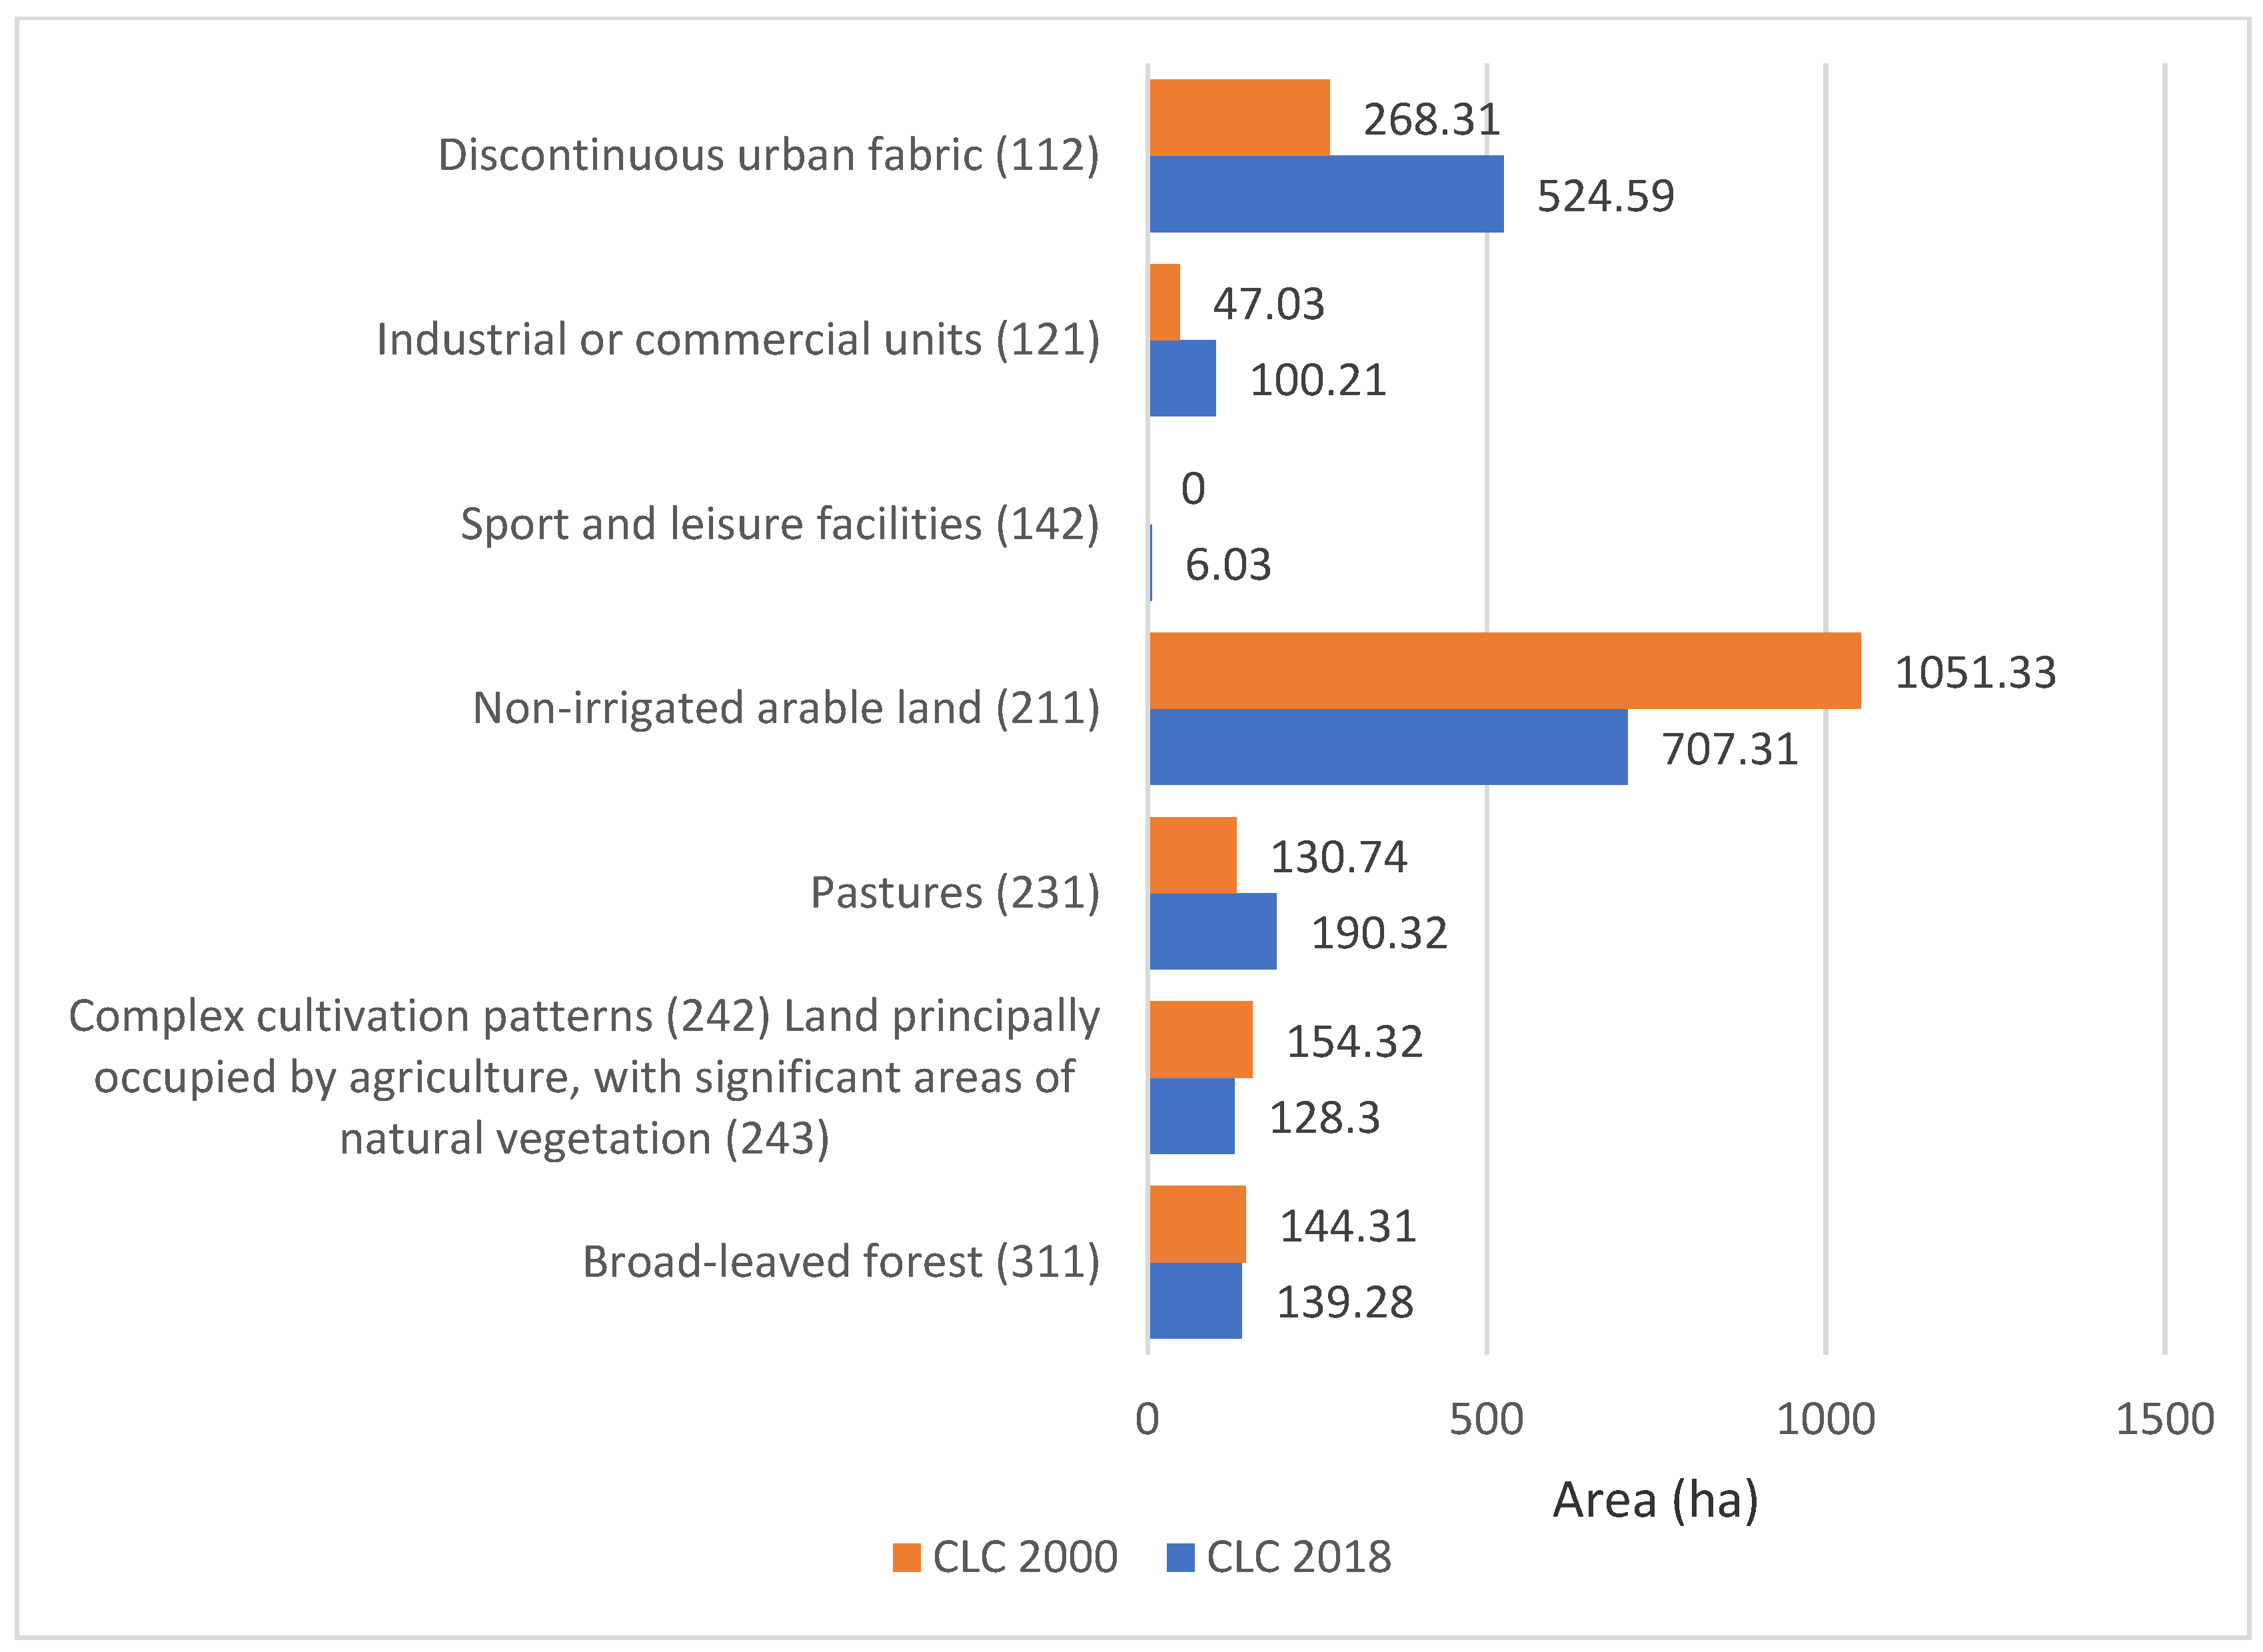
3.1. Changes in Land Use in the Sudół Catchment Area

Analysis of the collected data allowed us to characterize the study area, taking into account the change in land use according to Corine Land Cover from 2000 and 2018. The result of the study is illustrated below in Figure 7; the changes in the development of the study area took place over 18 years. The progressive urbanization of urban and suburban space is clearly visible.
The analysis shows that in the process of urbanization, built-up areas are replacing biologically active areas. The consequence is a systematic increase in sealed areas. In the catchment area of the Sudół River, a high increase in industrial and commercial areas (an increase of 113%) and residential areas (by more than 96%) is evident. A summary of the various forms of land use in 2000 and 2018 is provided in Figure 8.
Figure 8 also shows that during the analyzed time period of 2000–2018, in addition to a noticeable decrease in biologically active land (arable land, deciduous forests), there was also a favorable increase in land covered with disorganized greenery in the form of meadows and pastures. This is estimated to be an increase of about 60 hectares (46%). The area of forests, although it decreased by 3.5%, still represents nearly 140 hectares of significant area located in the upper sections of the ditches supplying water to the Sudół River. Thus, it continues to play a retention role, reducing or at least delaying the outflow of stormwater through the ditches.
Development in the two urbanized areas analyzed, from which stormwater is discharged by the stormwater drainage system to the Sudół River, also underwent changes in the period 2000–2018:
  • The residential area with stormwater drainage through outlet 1: this area has not been subject to significant changes in development during the period under review; vegetation areas slightly reduced their area by 0.01 hectares in favor of residential development.
  • Residential and commercial area with stormwater drainage through outlet 2: changes are definitely more pronounced; the area was subject to intensive development in the period 2000–2018. There has been a liquidation of biologically active areas; all of the arable land present in 2000 has been replaced by sealed areas under industrial and commercial areas, an increase of 25.9 hectares or nearly 92%, and under low-density housing, an increase of 4.92 hectares or more than 8%. The calculations show that 31.76 hectares of land changed designation.
Using CLC 2018 coverage, development data, and soil data [98], the CN parameter was calculated (Table 5) together with the catchment area to perform calculations of rainfall transformation into surface runoff. The calculations used the precipitation scenario presented in Section 2.3.1. Calculations were carried out for two periods consistent with CLC 2000 and CLC 2018 data.

3.2. Changes in Flow Due to Changes in Land Use

Table 6 summarizes the results of precipitation–flow transformation calculations for the precipitation scenario for the computational cross sections in the Sudół River drainage basin. Compiling the results of the calculations, it can be seen that in the period 2000–2018 there was an increase in flow (both maximum flow and flow volume). On the scale of the entire catchment, this is a change of 2.6%, which indicates increased sealing of the catchment area. There is a slight increase in flow in the catchment of outlet 1 (a residential area), where changes in development were small. The highest changes of more than 16% were recorded in the catchment of outlet 2 (residential–commercial area), where developed areas (residential neighborhoods and industrial and commercial areas) increased significantly.

3.3. Water Quality of the Sudół River

Three measurement cycles of water quality of the Sudół River were carried out in spring (sample taken in March), summer (sample taken in May), and autumn (September). Table 7 summarizes the results of measurements of concentrations of selected pollutants and also lists the minimum, average, and maximum concentrations.
Of the indicators tested, according to current legislation [29], limits have been set only for some of the indicators shown in Table 1. The remaining indicators have been tested (TSS, COD, TKN, and N–NO2), but according to current legislation, no accurate interpretation can be made due to the lack of limits to which the marked values can be compared. For these four indicators, the authors only made a general interpretation.
The concentration of suspended TSS reached its highest value of 180 mg/L in a sample taken in March, and it was more than 3 times higher than the concentration measured in September. In samples in which high concentrations of TSS were found, they were also accompanied by high concentrations of COD.
Among the biogenic compounds tested, the limits for Class II are set for total nitrogen, nitrate nitrogen, and total phosphorus (Table 1). For total nitrogen, the exceedance is twofold and for total phosphorus nearly fivefold. Biogenic compound pollution of the Sudół waters may also be the cause of Class II exceedances on the higher-order river, the Prądnik River, which are recorded in the monitoring [33].
The tested concentration of petroleum hydrocarbons HOI exceeded the permissible limit for Class II equal to 0.2 mg/L only in the sample from March 2022, and in the remaining samples the concentrations were below the minimum quantification level. Zn concentrations exceeded the permissible limits for Class II (Table 1). HOI and Zn contamination of Sudół waters, as in the case of biogenic compounds, can also be the cause of Class II exceedances on the upstream river Prądnik [33]. The study of Hg and Cu concentrations does not provide clear answers, as their concentrations were below the minimum quantification level.
PAHs are also determined in the waters. The results show that the limit comparable to benzo(a)pyrene was exceeded (Table 1). Of the three samples tested, the highest concentration of PAHs was recorded in a water sample from March 2022, when it also exceeded the permissible maximum concentration of PAHs.

3.4. Quality of Stormwater

There were 10 cycles of measurements of the quality of stormwater from 2 outlets of drainage systems into the Sudół River. Table 8 summarizes the results of pollutant concentrations measured in the outflow from the stormwater drainage system of a residential area, while Table 9 shows the results of measurements in the outflow from the stormwater drainage system covering a residential–commercial area.
The obtained values of concentrations were related to the limits for surface water presented in Table 1. The performed measurements allow for comparing the quality of stormwater discharged from areas with different intensities of development: (1) a low-intensity residential area with a local network of access roads, outlet 1, and (2) a residential–commercial area with a developed transportation network with heavy traffic, outlet 2:
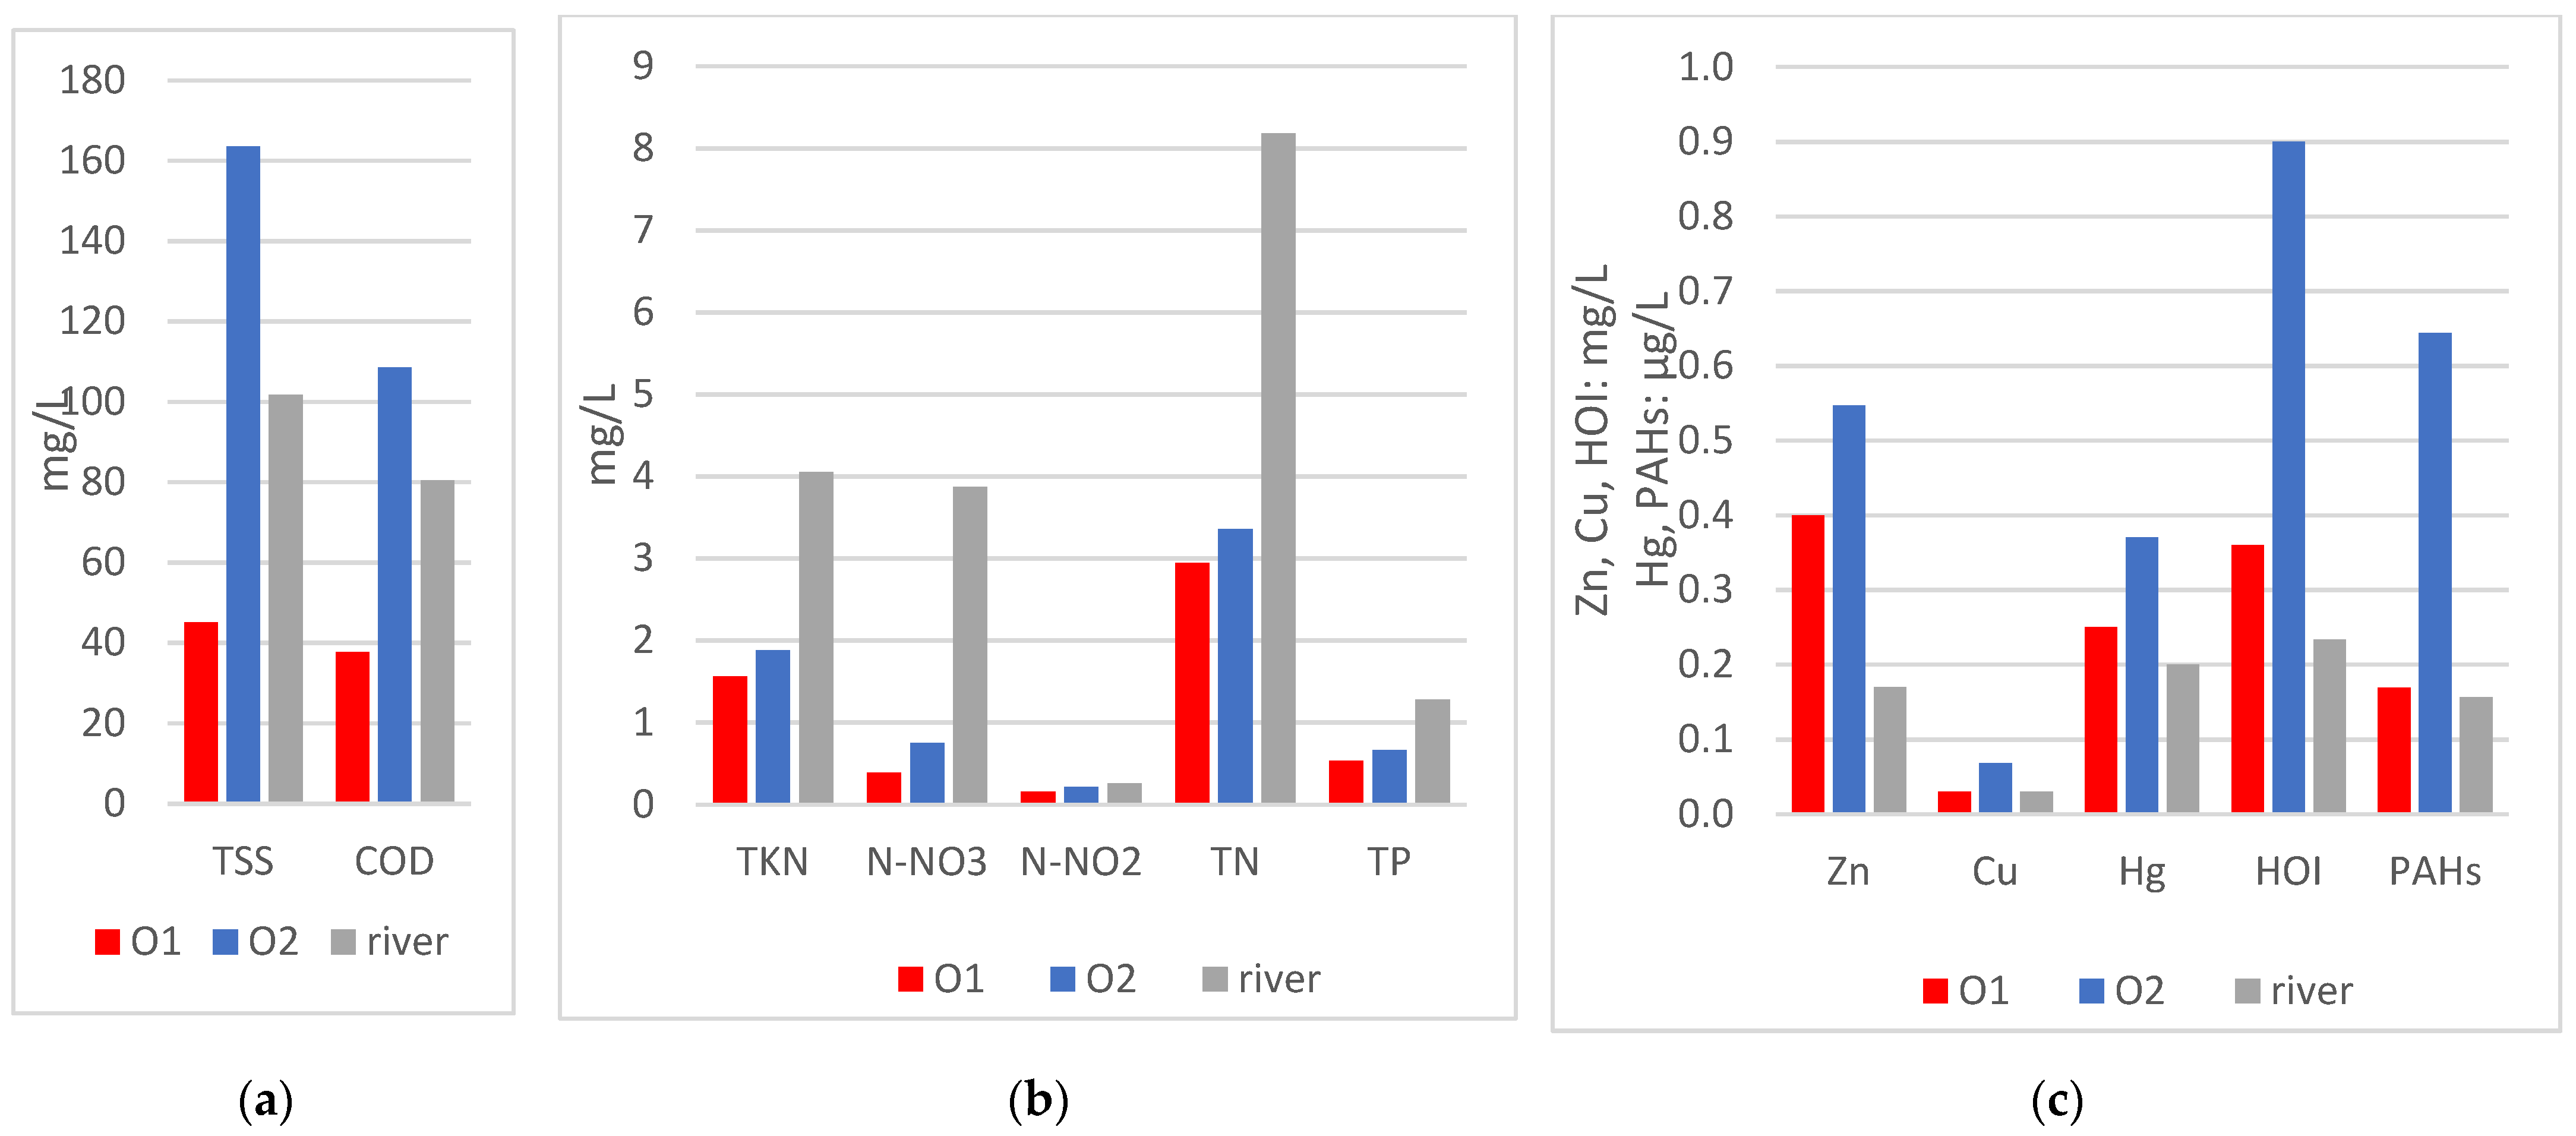
  • Average concentrations of biogenic compounds: the concentration of N–NO3 does not exceed standards; TN was exceeded in outlet 2; and TP exceeds the limit concentration more than twice in the outflows from both outlets.
  • The concentration of petroleum hydrocarbons expressed as HOI for both outlets was exceeded compared to the limit value. The indicator was nearly three times higher for outlet 2 from a more heavily urbanized residential–commercial area with a developed transportation network.
  • Zn concentrations were exceeded compared to the limit for both outlets.
  • The concentrations of the other heavy metals tested (Cu and Hg) in outlet 1 were below the minimum quantification level; in outlet 2, the concentrations were exceeded compared to the limits.
  • The problems, in turn, are the high concentrations of PAHs, which for outlet 1 and outlet 2 were higher than the limit value and, comparing the concentrations for both outlets, it can be seen that they are nearly four times higher for outlet 2 from a more heavily urbanized residential–commercial area with a developed transportation network.
For the rest of the studied indicators, no limits are defined, their comparative evaluation was performed (Table 10), and the following relationships were obtained:
  • TSS concentrations were more than 3.5 times higher for outlet 2 from a more heavily urbanized residential–commercial area with a developed transportation network;
  • COD was also about three times higher for outlet 2;
  • Kjeldahl nitrogen concentration TKN and N–NO2 concentration were similar for both outlets.

3.5. Estimation of the Impact of Polluted Runoff on River Quality

Based on the results of the study, an estimate was made of the impact of polluted runoff on water quality in the Sudół River. Figure 9 presents the average concentrations of pollutant indicators calculated from the measurements (Table 7, Table 8 and Table 9). The highest pollutant concentrations for almost all pollutant indicators tested (except biogenic compounds) are found in outlet 2, which discharges stormwater from a highly urbanized catchment area including residential, commercial, and high-traffic roads (Figure 9a,c). Biogenic pollutants have the highest average concentrations in the river’s waters (Figure 9b). Pollutant concentrations from outlet 1 (residential area) are higher than in the river for HOI, Zn, Hg, and PAHs, and lower than in the river for indicators TSS, COD, and TN.
Based on the average concentrations in the sewage basins and in the river shown above, and based on the results of hydrological modeling (Table 6), the average loads (according to Formula (7)) that run off in surface runoff from the residential area and the service and transportation area were calculated, as well as the pollutant loads in the river. The results are illustrated in the graphs below (Figure 10).
Estimated pollution load calculations demonstrate:
  • The amount of load depends not only on the concentration, but also on the size of the outflow, so the contribution of outlet 1, which discharges stormwater from a settlement with a small area, is insignificant (less than 1% for all pollution indicators).
  • The total loads discharged from the two studied outlets of the rainfall sewer system may account for 2% to as much as 48% of the loads present in the waters of the Sudół River below the mouth of these outlets.
  • The lowest contribution to river loads from outlets 1 and 2 is estimated in biogenic compounds, from 2–10%, Figure 10b, as the river is more polluted than the discharged stormwater, as also shown in the concentration graph in Figure 9b.
  • The share of loads from outlets 1 and 2 in the amount of TSS and COD is 19% and 16%, respectively (Figure 10a).
  • The highest share of pollutant loads discharged in stormwater from outlets 1 and 2 in the river loadings is for PAH, i.e., 48% and 45% share for HOI, respectively, and for heavy metals: 22% for Hg, 38% for Zn, and 27% for Cu (Figure 10c). The results show how significant the impact can be of untreated storm drain runoff from sealed heavily polluted areas such as roads, parking lots, and other impervious surfaces.

3.6. Environmental Risk Assessment

The RQ values calculated for water samples from surface runoff and the river allowed us to determine the probability of negative effects in the ecosystem due to exposure to a given pollutant. PNEC values taken from the literature are included in Table 4.
Table 11 shows the estimated RQ values for a given compound. When estimating environmental risk values, it is assumed that if the concentrations of MEC are higher than the PNEC, they may cause hazardous effects on aquatic organisms.
In order to best determine the environmental risk, three scenarios were developed that represent the possibility of negative effects for the optimistic, pessimistic, and most likely outlook. For the optimistic scenario, the RQ is calculated for an MEC equal to the lowest determined value of the parameter in question; for the pessimistic scenario, the highest value is taken as the MEC, while for the most likely, and therefore realistic, the MEC is the average. If the MEC is below the MQL, then no RQ was calculated for the minimum value; for the maximum value, MEC equal to the MQL was taken, while the average value of the measurement result was set at half the value of the given limit of determination [99].
The optimistic scenario, i.e., assuming the least possible environmental impact, yields convergent results for outlets 1 and 2. Only Zn is estimated to slightly cause adverse effects in the ecosystem, and in turn, N–NO3 shows an RQ almost 6 times higher for outlet O2 than O1, showing significant and low potential for adverse effects in the ecosystem, respectively. For the river, the RQ of N–NO3 is the highest, at more than twice the lower limit at which adverse effects in the ecosystem should be expected.
The pessimistic scenario has the most adverse effects of the analyzed micropollutants on aquatic organisms. For all compounds, except HOI, ecological risk occurs because RQ > 1. For the primary pollutants (except nitrate nitrogen), the RQ for outlet O2 is 1.4 to 3.7 times higher than for outlet O1 and the river. N–NO3 shows the highest RQ for the river, which is as much as five times the limit above which ecosystem impacts are most likely to occur.
Calculations for the realistic scenario, which is a good approximation of the real conditions in the study catchments, show that the aquatic ecosystem is at risk. The risk factor for primary pollutants ranged from 1.5 for TSS in outlet O1 to as high as 387.3 for N–NO3 in the river. For heavy metals, the RQ took values ranging from a few to dozens, with the lowest values obtained for Hg and the highest for Cu.

4. Discussion

Figure 11 shows the analyses carried out for the Sudół River catchment case study, which is subject to intensive changes in land use in Krakow.
The analysis of CLC 2000 and 2018 shows an increase in sealed areas (Figure 7 and Figure 8 and Table 5), which causes an increase in flow (Table 6). In the section closing the catchment for the analyzed design precipitation of 19.38 mm (with p = 20% and duration of 15 min), an increase in flow of 2.62% was estimated, but in selected areas it may cause a larger increase in runoff, e.g., analyzed outlet 2 may increase by 16.22%. Similar analyses were performed by, among others, Ociepa and Suligowski for the urbanized catchment area in Kielce, Poland [11,100], Sjöman and Gill for a catchment area in Sweden [67], and Li et al. for the city of Shenyang in China [66]. However, the results are difficult to compare due to the individual nature of each location (land use and land cover, soils, climate, etc.).
The main objective of this work was to investigate the qualitative aspects of stormwater. Stormwater discharged from areas of different land use have different quality parameters. Measurement campaigns were undertaken to determine the concentrations of 12 key parameters: (1) the quality of stormwater in the outflows from the drainage system from two urban areas of different sizes and different land uses, and (2) the water quality of the Sudół River, to which the stormwater is discharged. The results of 10 measurements of the quality of stormwater are presented in Table 8 and Table 9. The obtained results of the study were also referenced in a review study by De Buyck et al. in 2021 [101], which reviewed 39 publications from 1999–2019, based on which, among others, the average and maximum concentrations of pollutants in stormwater were calculated. A comparison of the obtained values of the average and maximum concentrations of the pollutants studied in the present study and the calculations made by De Buyck et al. is presented in Table 12. In order to relate the obtained results of the study to previous Polish studies, a comparison was made with the results of Strzebońska et al. [102], who conducted a study of the quality of roof runoff in Krakow, and studies of the quality of stormwater in cities by Poznań [103], Częstochowa [104], and Kielce [105].
The calculated mean and maximum concentrations from all measurements (outlet 1 and outlet 2) show higher values for all tested biogenic compounds; additionally, the determined mean concentration for COD is higher than in the work of De Buyck et al.
In the study [102], 31 pollutant indicators were determined, including N–NO3, Cu, and Zn indicators in common with the present work. Demonstrated concentrations in roof runoff, which should be of better quality than the runoff studied in our work covering runoff from rooftops, roads, and parking areas, were lower for N–NO3 and Cu indicators, while Zn concentrations were higher.
The determined concentrations in outlets 1 and 2 were also compared to other studies on stormwater quality in Polish cities, presented in Table 12:
  • The study in Poznań [103] includes 8 parameters in common with the present work. The results of stormwater quality in Krakow were worse in terms of average concentrations for indicators TSS, TKN, N–NO2, TP, and Cu; however, significant differences are found for N–NO2: more than 18 times higher mean and max concentration; TP: more than 2.7 times higher mean concentration and 4.8 times maximum concentration; and Cu: more than 2 times higher mean concentration, but the recorded maximum concentration is lower by half.
  • In the study in Częstochowa [104], three parameters common to this study were taken into account: TSS, COD, and Cu. The results of the quality of stormwater in Krakow were worse in terms of mean Cu concentration (10 times higher), COD with similar mean concentration, and TSS with a two-times lower concentration.
  • In the study in Kielce [105], four parameters common to this study were taken into account: TSS, Zn, Cu, and Hg. The results of stormwater quality in Krakow were better in terms of average concentrations for TSS (just below the lower limit of the range of mean concentrations), Cu (about 2 times lower than the lower limit of the range of mean concentrations), Hg (over 1000 times the lower limit of the range of mean concentrations), and Zn (at the upper limit of the range of average concentrations).
The analyses carried out and the concentrations obtained prove that land use has an impact on the quality of stormwater and, as a result, on the quality of surface water. Concentrations from two drainage outlets were examined: a small residential area (outlet 1) and a residential and commercial area with a developed transportation network with heavy traffic (outlet 2). The comparison made in Table 10 and Figure 9 shows that the more intensive development (outlet 2), which includes, e.g., commercial areas and high-traffic roads, results in average concentrations higher than in low-density residential areas (outlet 1). In particular, this applies to such pollutants as TSS, COD, HOI, Cu, and PAHs; their average concentrations were more than two times higher in outlet 2 than in outlet 1. Similar conclusions were obtained, e.g., in a study for different types of land use in Singapore [106]: concentration in stormwater from residential area is lower than from areas such as business districts, industry, and residential roads in term of parameters TSS, Zn, and Cu. A similar study was also performed by Wang et al. [13] showing that the average concentrations of TSS, COD, Zn, and Cu in runoff of rainwater in Chongqing (China) from urban traffic roads are much higher than from residential roads, commercial areas, and roof runoff. Paule et al. [15] studied the relationship between land use change and stormwater runoff quality in Yongin, South Korea. A correlation has been shown between the increase in concentrations of TSS, COD, TN, and TP and the increase in commercial, parking lot, residential, and road areas.
Threats to aquatic ecosystems were investigated through environmental risk assessment for stormwater discharged through outlets 1 and 2 and the Sudół River. The magnitude of the RQ for COD, TP, and N–NO3 was calculated, taking into account the limits for waters in which freshwater fish can live. Due to the high concentrations of N–NO3, it is reasonable to believe that this compound could cause negative effects among fish. In the river, the RQ is more than three times the values for which such an impact should be expected. Despite the fact that phosphorus and nitrogen are essential nutrients, their excess in the waters leads to eutrophication. Algal blooms limit the development of shallow-water vegetation and produce poisonous substances that are a threat to animal organisms and human health and life [107]. A significant amount of suspended matter in the water is not toxic in itself, but the threat is posed by various substances sorbing on it that are dangerous to the aquatic ecosystem [108]. In the studies conducted, a positive correlation between RQ for suspended solids and heavy metals is noticeable. Cu compounds can cause significant risks to the aquatic environment. They are considered harmful to aquatic ecosystems, and crustaceans are considered the most sensitive organisms [95]. Fish, on the other hand, exhibit a wide range of toxicity values, but their ability to reproduce and grow can be impaired when chronically exposed to Cu [109]. Zn shows toxicity to aquatic organisms, especially plankton [110]. According to Gebar et al. [91], a negative effect occurs in half of the arthropod population studied at an RQ of 7.3 calculated according to the PNEC adopted by the authors. In the calculations carried out for the realistic scenario, this value was exceeded at least twice, which clearly suggests that a negative effect of exposure of living organisms to this element is very likely to occur. Another highly toxic metal is Hg, and its presence in surface waters poses a threat to living organisms. Its compounds can accumulate in mollusks, fish, and successively further up the food chain to humans [111]. Hg concentrations at ng/L levels cause toxicity in Daphnia [112], so of the three freshwater locations studied, these organisms are most vulnerable in river waters. In contrast, a study by Zhang et al. shows that fish have a higher tolerance to Hg than do phytoplankton and invertebrates [113]. In addition to heavy metals, PAHs are well-known contaminants due to their strong carcinogenic and mutagenic properties [97]. These compounds, despite their low water solubility and hydrophobicity, have been found in surface waters. The results obtained for the realistic scenario correlate with the literature data. The RQ for four select PAHs in Yellow River waters in China is <1 [114], while in Brazil it is up to 4 [97].
The conducted research proves that urbanization and the accompanying changes in land use have led to changes in hydrology and increased pollution of surface waters, and this may pose a threat to aquatic ecosystems in the Sudół River catchment. For this reason, it is important to introduce stormwater management rules to stop such negative trends and reduce threats. There are many studies that show the beneficial effect of the use of stormwater control measures (SCMs) on reducing pollution and surface runoff. Pennino et al. [115] indicate that the use of stormwater green infrastructure brings a significant reduction in flash hydrology and pollution concentration. SCMs reduce the concentration of phosphorus [116,117], and they can limit, delay, or stabilize the supply of nitrogen [115,118,119,120]; in the case of suspension, no influence on their reduction is shown [115,116], but of course it depends on the type of SCMs, their location, and the scale of the solutions used [115,118,119]. A study by Walsh et al. [116] showed that extensive use of dispersed SCMs can reverse the negative effects of urbanization and improve stream water quality. Therefore, it seems advisable to introduce administrative recommendations (or even an obligation) to apply stormwater control measures for all new investments, as well as to strengthen their implementation through economic instruments, such as rainwater charges and investment co-financing. Economic incentives can also induce owners of already built-up real estate to change their stormwater management. As we have shown in our previous work [121,122,123], the existing economic instruments in Poland need to be changed in order to effectively encourage property owners to invest in sustainable rainwater management.

5. Conclusions

An assessment of the impact of land use changes and stormwater management in selected developed areas (a small residential area and a larger residential–commercial area with an intensive traffic network) on the surface water quality of the Sudół River was conducted, with the following findings:
  • The changes in land use from 2000 to 2018 were estimated at the scale of the entire catchment and their impact on the change in sealing and changes in hydrology, showing that progressive urbanization has resulted in the conversion of land used for agriculture into residential land (an increase of more than 96%) and industrial and commercial land (an increase of 113%), resulting in an increase in the degree of sealing (the CN curve at the scale of the entire catchment changed from 77.72 to 78.28), which is reflected in an increase in surface runoff and flows in the river (hydrological modeling for precipitation with p = 20% shows a 2.6% increase in flow in the estuary section of the catchment).
  • Changes in development lead to changes in hydrology: a clear impact was found from the analyses in 1 of the 2 areas studied: the residential–commercial area, where 31.76 ha of land changed its use in the period 2000–2018 (which accounts for 40% of the area), resulting in changes in the CN curve from a value of 85.47 to 88.05 and a 16% increase in outflow from the stormwater drainage system for p = 20% rainfall.
  • We conducted a study of the quality of stormwater discharges from the analyzed 2 areas to show significant pollution, in particular, in terms of such pollutants as TSS (average concentration in outlet 1: 45 mg/L, in outlet 2: 164 mg/L), petroleum hydrocarbons (HOI in O1: 0.36 mg/L; in O2: 0.9 mg/L), PAHs (in O1: 0.1689 µg/L; in O2: 0.6438 µg/L), and heavy metals (Cu in O1: 0.03 mg/L; in O2: 0.0685 mg/L, Zn in O1: 0.4 mg/L; in O2: 0.547 mg/L, and Hg in O1: 0.0003 mg/L; in O2: 0.0004 mg/L). Concentrations of these pollutants in particular from outlet 2 from a residential–commercial area with a heavy traffic transportation network were 2 times (TSS, Cu, and Hg), 3 times (Zn), and even 4 times (HOI and PAHs) higher than in the waters of the Sudół River.
  • Estimated pollutant loads contributed by stormwater may account for a significant share of the loads observed in the river in the 130 m cross-section downstream of outlet 2. Calculations conducted for precipitation p = 20% and average concentrations show that outlet 2, draining from a highly urbanized, sealed catchment, may account for more than 40% of the load of petroleum hydrocarbons and PAHs, as well as 21–37% of the load of heavy metals analyzed.
  • Environmental risk assessment of surface runoff and waters of the Sudół catchment shows the highest risks for N–NO3, with the highest risk found in the river waters. High risks are also shown for heavy metals, the highest for Cu concentrations in stormwater discharged by outlet 2; for this outlet, a significant level of risk is found for Zn. For waters from outlet 1, a significant level of risk is found for Zn and Cu.
The existing approach to stormwater management in the form of its discharge directly into the waters of the Sudół River and drainage ditches without treatment may be responsible for the exceedances of permissible concentrations in the river in terms of the indicators TN, TP, Zn, Cu, Hg, petroleum hydrocarbons (HOI), and polycyclic aromatic hydrocarbons (PAHs), as the recorded concentrations of these indicators in particular in outlet 2 exceed the concentration limits allowed for Class II surface water.
Such problems are likely to occur in 1/3 of the Sudół catchment area—this percentage is currently made up of residential neighborhoods and industrial and commercial areas. If the catchment area is subjected to further continuous development, this may contribute to the persistence of poor physical and chemical status or even its deterioration, and thus contribute to the threat of not achieving good water status in the Sudół catchment area.
Development is inevitable, but it is necessary to strive for stormwater management that will limit surface runoff and reduce its pollution. The use of green infrastructure can reduce stormwater pollution [124,125], as studies show that it is possible to apply solutions that can reduce both biogenic pollution [20,120,126] and substances such as heavy metals [127,128] and PAHs [35,129].

Author Contributions

Conceptualization, I.G., A.G., K.M. and J.P.; methodology, I.G., M.B., A.G., K.M. and J.P.; software, M.B. and K.M.; validation, M.B.; formal analysis, I.G., M.B., A.G., K.M. and J.P.; investigation, I.G., M.B., A.G., K.M. and J.P.; resources, M.B. and K.M.; data curation, M.B. and K.M.; writing—original draft preparation, I.G.; writing—review and editing, I.G., M.B., A.G., K.M. and J.P.; visualization, M.B. and K.M. All authors have read and agreed to the published version of the manuscript.

Funding

This research received no external funding.

Institutional Review Board Statement

Not applicable.

Informed Consent Statement

Not applicable.

Data Availability Statement

Not applicable.

Conflicts of Interest

The authors declare no conflict of interest.

Abbreviations

COD—Chemical oxygen demand, HOI—Hydrocarbon oil index, N–NO2—Nitrite nitrogen, N–NO3—Nitrate nitrogen, PAHs—Polycyclic aromatic hydrocarbons, P–PO4—Phosphate phosphorus, TKN—Kjeldahl nitrogen, TN—Total nitrogen, TP—Total phosphorus, TSS—Total suspended solids.

References

  1. Yao, L.; Wei, W.; Chen, L. How does imperviousness impact the urban rainfall-runoff process under various storm cases? Ecol. Indic. 2016, 60, 893–905. [Google Scholar] [CrossRef]
  2. Sañudo-Fontaneda, L.A.; Charlesworth, S.M.; Castro-Fresno, D.; Andres-Valeri, V.C.A.; Rodriguez-Hernandez, J. Water quality and quantity assessment of pervious pavements performance in experimental car park areas. Water Sci. Technol. 2014, 69, 1526–1533. [Google Scholar] [CrossRef] [PubMed]
  3. Dokulil, M.T. Climate impacts on ecohydrological processes in aquatic systems. Ecohydrol. Hydrobiol. 2016, 16, 66–70. [Google Scholar] [CrossRef]
  4. Jang, S.; Cho, M.; Yoon, J.; Yoon, Y.; Kim, S.; Kim, G.; Kim, L.; Aksoy, H. Using SWMM as a tool for hydrologic impact assessment. Desalination 2007, 212, 344–356. [Google Scholar] [CrossRef]
  5. Arnbjerg-Nielsen, K.; Willems, P.; Olsson, J.; Beecham, S.; Pathirana, A.; Bülow Gregersen, I.; Madsen, H.; Nguyen, V.T.V. Impacts of climate change on rainfall extremes and urban drainage systems: A review. Water Sci. Technol. 2013, 68, 16–28. [Google Scholar] [CrossRef] [PubMed]
  6. Zawilski, M.; Sakson, G. Ocena emisji zawiesin odprowadzanych kanalizacją deszczową z terenów zurbanizowanych. Ochr. Sr. 2013, 35, 33–40. [Google Scholar]
  7. Gomes, R.B.; Nogueira, R.; Oliveira, J.M.; Peixoto, J.; Brito, A.G. Determination of total and available fractions of PAHs by SPME in oily wastewaters: Overcoming interference from NAPL and NOM. Environ. Sci. Pollut. Res. 2009, 16, 671–678. [Google Scholar] [CrossRef] [Green Version]
  8. Müller, A.; Österlund, H.; Marsalek, J.; Viklander, M. The pollution conveyed by urban runoff: A review of sources. Sci. Total Environ. 2020, 709, 136125. [Google Scholar] [CrossRef] [PubMed]
  9. Vaze, J.; Chiew, F.H.S. Experimental study of pollutant accumulation on an urban road surface. Urban Water 2002, 4, 379–389. [Google Scholar] [CrossRef]
  10. Wijesiri, B.; Egodawatta, P.; McGree, J.; Goonetilleke, A. Incorporating process variability into stormwater quality modelling. Sci. Total Environ. 2015, 533, 454–461. [Google Scholar] [CrossRef] [Green Version]
  11. Ciupa, T.; Suligowski, R.; Wałek, G. Impact of an urban area on the dynamics and features of suspended solids transport in a small catchment during floods. Ecohydrol. Hydrobiol. 2021, 21, 595–603. [Google Scholar] [CrossRef]
  12. Chen Ching, Y.; Heng Lee, Y.; Ekhwan Toriman, M.; Abdullah, M.; Bin Yatim, B. Effect of the big flood events on the water quality of the Muar River, Malaysia. Sustain. Water Resour. Manag. 2015, 1, 97–110. [Google Scholar] [CrossRef] [Green Version]
  13. Wang, S.; He, Q.; Ai, H.; Wang, Z.; Zhang, Q. Pollutant concentrations and pollution loads in stormwater runoff from different land uses in Chongqing. J. Environ. Sci. 2013, 25, 502–510. [Google Scholar] [CrossRef] [PubMed]
  14. Liu, A.; Egodawatta, P.; Guan, Y.; Goonetilleke, A. Influence of rainfall and catchment characteristics on urban stormwater quality. Sci. Total Environ. 2013, 444, 255–262. [Google Scholar] [CrossRef] [Green Version]
  15. Paule, M.A.; Memon, S.A.; Lee, B.-Y.; Umer, S.R.; Lee, C.-H. Stormwater runoff quality in correlation to land use and land cover development in Yongin, South Korea. Water Sci. Technol. 2014, 70, 218–225. [Google Scholar] [CrossRef]
  16. Stepnowski, P.; Synak, E.; Szafranek, B.; Kaczyński, Z. Monitoring i Analityka Zanieczyszczeń w Środowisku; Wydawnictwo Uniwersytetu Gdańskiego: Gdańsk, Poland, 2010; ISBN 9788373267121. [Google Scholar]
  17. Deakin, M.; Reid, A. Sustainable urban development: Use of the environmental assessment methods. Sustain. Cities Soc. 2014, 10, 39–48. [Google Scholar] [CrossRef]
  18. Dong, X.; Yuan, P.; Song, Y.; Yi, W. Optimizing Green-Gray Infrastructure for Non-Point Source Pollution Control under Future Uncertainties. Int. J. Environ. Res. Public Health 2021, 18, 7586. [Google Scholar] [CrossRef]
  19. Alves, A.; Gersonius, B.; Kapelan, Z.; Vojinovic, Z.; Sanchez, A. Assessing the Co-Benefits of green-blue-grey infrastructure for sustainable urban flood risk management. J. Environ. Manag. 2019, 239, 244–254. [Google Scholar] [CrossRef]
  20. Wang, S.; Lin, X.; Yu, H.; Wang, Z.; Xia, H.; An, J.; Fan, G. Nitrogen removal from urban stormwater runoff by stepped bioretention systems. Ecol. Eng. 2017, 106, 340–348. [Google Scholar] [CrossRef]
  21. Locatelli, L.; Guerrero, M.; Russo, B.; Martí nez-Gomariz, E.; Sunyer, D.; Martí nez, M. Socio-Economic Assessment of Green Infrastructure for Climate Change Adaptation in the Context of Urban Drainage Planning. Sustainability 2020, 12, 3792. [Google Scholar] [CrossRef]
  22. Wilson, C.E.; Hunt, W.F.; Winston, R.J.; Smith, P. Comparison of Runoff Quality and Quantity from a Commercial Low-Impact and Conventional Development in Raleigh, North Carolina. J. Environ. Eng. 2015, 141, 05014005. [Google Scholar] [CrossRef]
  23. Xing, Y.J.; Chen, T.L.; Gao, M.Y.; Pei, S.L.; Pan, W.B.; Chiang, P.C. Comprehensive Performance Evaluation of Green Infrastructure Practices for Urban Watersheds Using an Engineering–Environmental–Economic (3E) Model. Sustainability 2021, 13, 4678. [Google Scholar] [CrossRef]
  24. Everard, M.; Moggridge, H.L. Rediscovering the value of urban rivers. Urban Ecosyst. 2011, 15, 293–314. [Google Scholar] [CrossRef]
  25. Ibrahim, A.; Bartsch, K.; Sharifi, E. Green infrastructure needs green governance: Lessons from Australia’s largest integrated stormwater management project, the River Torrens Linear Park. J. Clean. Prod. 2020, 261, 121202. [Google Scholar] [CrossRef]
  26. Pearson, R.G.; Davis, A.M.; Birtles, R.A.; Pearson, R.G.; Davis, A.M.; Birtles, R.A. Enhancing whole-of-river conservation. Mar. Freshw. Res. 2022, 73, 729–741. [Google Scholar] [CrossRef]
  27. Słyś, D. Zrównoważone Systemy Odwodnienia Miast; Dolnośląskie Wydawnictwo Edukacyjne: Wrocław, Poland, 2013. [Google Scholar]
  28. Keele, V.; Gilvear, D.; Large, A.; Tree, A.; Boon, P. A new method for assessing river ecosystem services and its application to rivers in Scotland with and without nature conservation designations. River Res. Appl. 2019, 35, 1338–1358. [Google Scholar] [CrossRef]
  29. Rozporządzenie Ministra Infrastruktury z Dnia 25 Czerwca 2021 r. w Sprawie Klasyfikacji Stanu Ekologicznego, Potencjału Ekologicznego i Stanu Chemicznego Oraz Sposobu Klasyfikacji Stanu Jednolitych Części Wód Powierzchniowych, a Także Środowiskowych Norm Jakości Dla Substancji Priorytetowych. Available online: https://isap.sejm.gov.pl/isap.nsf/DocDetails.xsp?id=WDU20210001475 (accessed on 2 November 2022).
  30. GUGiK Dane PZGiK—Główny Urząd Geodezji i Kartografii—Portal Gov.pl. Available online: https://www.gov.pl/web/gugik/dane-pzgik4 (accessed on 24 November 2021).
  31. GIOŚ—Corine. Available online: https://clc.gios.gov.pl/ (accessed on 2 November 2022).
  32. Generalny Pomiar Ruchu 2020/2021—Generalna Dyrekcja Dróg Krajowych i Autostrad—Portal Gov.pl. Available online: https://www.gov.pl/web/gddkia/generalny-pomiar-ruchu-20202021 (accessed on 11 November 2022).
  33. Wyniki Badań Monitoringu Jakości Wód, Województwo Małopolskie. Available online: https://www.gios.gov.pl/pl/malopolskie-dr (accessed on 2 November 2022).
  34. Björklund, K.; Malmqvist, P.A.; Strömvall, A.M. Simulating organic pollutant flows in urban stormwater: Development and evaluation of a model for nonylphenols and phthalates. Water Sci. Technol. 2011, 63, 508–515. [Google Scholar] [CrossRef]
  35. Sébastian, C.; Barraud, S.; Gonzalez-Merchan, C.; Perrodin, Y.; Visiedo, R. Stormwater retention basin efficiency regarding micropollutant loads and ecotoxicity. Water Sci. Technol. 2014, 69, 974–981. [Google Scholar] [CrossRef]
  36. Eriksson, E.; Baun, A.; Scholes, L.; Ledin, A.; Ahlman, S.; Revitt, M.; Noutsopoulos, C.; Mikkelsen, P.S. Selected stormwater priority pollutants—A European perspective. Sci. Total Environ. 2007, 383, 41–51. [Google Scholar] [CrossRef]
  37. Raposo, A.; Mansilha, C.; Veber, A.; Melo, A.; Rodrigues, J.; Matias, R.; Rebelo, H.; Grossinho, J.; Cano, M.; Almeida, C.; et al. Occurrence of polycyclic aromatic hydrocarbons, microplastics and biofilms in Alqueva surface water at touristic spots. Sci. Total Environ. 2022, 850, 157983. [Google Scholar] [CrossRef]
  38. Soonthornnonda, P.; Christensen, E.R. Source apportionment of pollutants and flows of combined sewer wastewater. Water Res. 2008, 42, 1989–1998. [Google Scholar] [CrossRef] [PubMed]
  39. Brown, J.N.; Peake, B.M. Sources of heavy metals and polycyclic aromatic hydrocarbons in urban stormwater runoff. Sci. Total Environ. 2006, 359, 145–155. [Google Scholar] [CrossRef] [PubMed]
  40. Etyemezian, V.; Kuhns, H.; Gillies, J.; Chow, J.; Hendrickson, K.; McGown, M.; Pitchford, M. Vehicle-based road dust emission measurement (III): Effect of speed, traffic volume, location, and season on PM10 road dust emissions in the Treasure Valley, ID. Atmos. Environ. 2003, 37, 4583–4593. [Google Scholar] [CrossRef]
  41. Kuhns, H. Vehicle-based road dust emission measurement—Part II: Effect of precipitation, wintertime road sanding, and street sweepers on inferred PM10 emission potentials from paved and unpaved roads. Atmos. Environ. 2003, 37, 4573–4582. [Google Scholar] [CrossRef]
  42. Szalińska, E.; Orlińska-Woźniak, P.; Wilk, P. Sediment load variability in response to climate and land use changes in a Carpathian catchment (Raba River, Poland). J. Soils Sediments 2020, 20, 2641–2652. [Google Scholar] [CrossRef] [Green Version]
  43. Moslemzadeh, M.; Roueinian, K.; Salarijazi, M. Improving the estimation of sedimentation in multi-purpose dam reservoirs, considering hydrography and time scale classification of sediment rating curve (case study: Dez Dam). Arab. J. Geosci. 2022, 15, 1–7. [Google Scholar] [CrossRef]
  44. Wałęga, A.; Krzanowski, S. Znaczenie Procesu Sedymentacji w Oczyszczaniu Ścieków Opadowych z Terenów Zurbanizowanych. Infrastr. Ekol. Ter. Wiej. 2008, 2, 169–178. [Google Scholar]
  45. Zoppou, C. Review of urban storm water models. Environ. Model. Softw. 2001, 16, 195–231. [Google Scholar] [CrossRef]
  46. Nyström, F.; Nordqvist, K.; Herrmann, I.; Hedström, A.; Viklander, M. Removal of metals and hydrocarbons from stormwater using coagulation and flocculation. Water Res. 2020, 182, 115919. [Google Scholar] [CrossRef]
  47. Luo, X.; Mai, B.; Yang, Q.; Fu, J.; Sheng, G.; Wang, Z. Polycyclic aromatic hydrocarbons (PAHs) and organochlorine pesticides in water columns from the Pearl River and the Macao harbor in the Pearl River Delta in South China. Mar. Pollut. Bull. 2004, 48, 1102–1115. [Google Scholar] [CrossRef]
  48. Laboratoria Badawcze/Akredytacje Aktywne/Akredytowane Podmioty/Polskie Centrum Akredytacji. Available online: https://www.pca.gov.pl/akredytowane-podmioty/akredytacje-aktywne/laboratoria-badawcze/AB776,podmiot.html (accessed on 2 November 2022).
  49. Normy klimatyczne 1991–2020—Portal Klimat IMGW-PiB. Available online: https://klimat.imgw.pl/pl/climate-normals/OPAD_SUMA (accessed on 1 November 2022).
  50. Wytyczne Eksploatacyjne w Zakresie Projektowania, Realizacji i Odbiorów Urządzeń i Przyłączy Wodociągowych i Kanalizacyjnych (Guidelines for the Design, Implementation and Acceptance of Water and Sewage Equipment and Connections). Available online: https://wodociagi.krakow.pl/strefa-klienta/dla-projektanta/ (accessed on 1 November 2022).
  51. PN-EN 752: 2017 Drain and Sewer Systems Outside Buildings—Sewer System Management. Available online: https://sklep.pkn.pl/pn-en-752-2017-06e.html (accessed on 1 November 2022).
  52. Jacobson, C.R. Identification and quantification of the hydrological impacts of imperviousness in urban catchments: A review. J. Environ. Manag. 2011, 92, 1438–1448. [Google Scholar] [CrossRef] [PubMed]
  53. Lisenbee, W.A.; Hathaway, J.M.; Burns, M.J.; Fletcher, T.D. Modeling bioretention stormwater systems: Current models and future research needs. Environ. Model. Softw. 2021, 144, 105146. [Google Scholar] [CrossRef]
  54. Bosley, E. Hydrologic Evaluation of Low Impact Development Using a Continuous, Spatially-Distributed Model. Ph.D. Thesis, Virginia Polytechnic Institute and State University, Blacksburg, VA, USA, 2008. [Google Scholar]
  55. Elliott, A.H.; Trowsdale, S.A. A review of models for low impact urban stormwater drainage. Environ. Model. Softw. 2007, 22, 394–405. [Google Scholar] [CrossRef]
  56. Ferrans, P.; Torres, M.N.; Temprano, J.; Rodríguez Sánchez, J.P. Sustainable Urban Drainage System (SUDS) modeling supporting decision-making: A systematic quantitative review. Sci. Total Environ. 2022, 806, 150447. [Google Scholar] [CrossRef] [PubMed]
  57. Liu, Q.; Cui, W.; Tian, Z.; Tang, Y.; Tillotson, M.; Liu, J. Stormwater Management Modeling in “Sponge City” Construction: Current State and Future Directions. Front. Environ. Sci. 2022, 9, 816093. [Google Scholar] [CrossRef]
  58. Xu, C.; Rahman, M.; Haase, D.; Wu, Y.; Su, M.; Pauleit, S. Surface runoff in urban areas: The role of residential cover and urban growth form. J. Clean. Prod. 2020, 262, 121421. [Google Scholar] [CrossRef]
  59. Wałęga, A.; Radecki Pawlik, A.; Cupak, A.; Hathaway, J.; Pukowiec, M. Influence of Changes of Catchment Permeability and Frequency of Rainfall on Critical Storm Duration in an Urbanized Catchment—A Case Study, Cracow, Poland. Water 2019, 11, 2557. [Google Scholar] [CrossRef] [Green Version]
  60. Petroselli, A.; Wałęga, A.; Młyński, D.; Radecki-Pawlik, A.; Cupak, A.; Hathaway, J. Rainfall-runoff modeling: A modification of the EBA4SUB framework for ungauged and highly impervious urban catchments. J. Hydrol. 2022, 606, 127371. [Google Scholar] [CrossRef]
  61. Maragno, D.; Gaglio, M.; Robbi, M.; Appiotti, F.; Fano, E.A.; Gissi, E. Fine-scale analysis of urban flooding reduction from green infrastructure: An ecosystem services approach for the management of water flows. Ecol. Modell. 2018, 386, 1–10. [Google Scholar] [CrossRef]
  62. Gittleman, M.; Farmer, C.J.Q.; Kremer, P.; McPhearson, T. Estimating stormwater runoff for community gardens in New York City. Urban Ecosyst. 2017, 20, 129–139. [Google Scholar] [CrossRef] [Green Version]
  63. Whitford, V.; Ennos, A.R.; Handley, J.F. “City form and natural process”—Indicators for the ecological performance of urban areas and their application to Merseyside, UK. Landsc. Urban Plan. 2001, 57, 91–103. [Google Scholar] [CrossRef]
  64. Bahrami, E.; Salarijazi, M.; Mohammadrezapour, O.; Haghighat Jou, P. Evaluation of SCS model for flood characteristic prediction in an ungauged catchment considering effects of excess rainfall and base flow separation. J. Earth Syst. Sci. 2021, 131, 11. [Google Scholar] [CrossRef]
  65. Geetha, K.; Mishra, S.K.; Eldho, T.I.; Rastogi, A.K.; Pandey, R.P. SCS-CN-based Continuous Simulation Model for Hydrologic Forecasting. Water Resour. Manag. 2007, 22, 165–190. [Google Scholar] [CrossRef]
  66. Li, C.; Liu, M.; Hu, Y.; Shi, T.; Qu, X.; Walter, M.T. Effects of urbanization on direct runoff characteristics in urban functional zones. Sci. Total Environ. 2018, 643, 301–311. [Google Scholar] [CrossRef]
  67. Sjöman, J.D.; Gill, S.E. Residential runoff—The role of spatial density and surface cover, with a case study in the Höjeå river catchment, southern Sweden. Urban For. Urban Green. 2014, 13, 304–314. [Google Scholar] [CrossRef]
  68. Młyński, D.; Wałęga, A.; Książek, L.; Florek, J.; Petroselli, A. Possibility of Using Selected Rainfall-Runoff Models for Determining the Design Hydrograph in Mountainous Catchments: A Case Study in Poland. Water 2020, 12, 1450. [Google Scholar] [CrossRef]
  69. Cronshey, R.; McCuen, R.H.; Miller, N.; Rawls, W.; Robbins, S.; Woodward, D. Urban Hydrology for Small Watersheds, 2nd ed.; USDA: Washington, DC, USA, 1986; ISBN NTIS #PB87101580.
  70. Snyder Unit Hydrograph Model. Available online: https://www.hec.usace.army.mil/confluence/hmsdocs/hmstrm/surface-runoff/snyder-unit-hydrograph-model (accessed on 5 November 2022).
  71. Jena, S.K.; Tiwari, K.N. Modeling synthetic unit hydrograph parameters with geomorphologic parameters of watersheds. J. Hydrol. 2006, 319, 1–14. [Google Scholar] [CrossRef]
  72. El Hassan, A.A.; Sharif, H.O.; Jackson, T.; Chintalapudi, S. Performance of a conceptual and physically based model in simulating the response of a semi-urbanized watershed in San Antonio, Texas. Hydrol. Process. 2012, 27, 3394–3408. [Google Scholar] [CrossRef]
  73. Ma, H.; Dong, X.; Chang, W. Application of Synthetic Unit Hydrograph on HEC-HMS Model for Flood Forecasting. MATEC Web Conf. 2018, 246, 01076. [Google Scholar]
  74. Babu, R.R.; Mishra, P.; Kumar, R.N.; Reddy, K.S. Application of HEC-HMS for simulation of peak runoff rates from a small watershed. Adv. Appl. Res. 2015, 7, 9. [Google Scholar] [CrossRef]
  75. Gunawardhana, L.N.; Al-Rawas, G.A.; Baawain, M.S. Spatial regression approach to estimate synthetic unit hydrograph by geomorphic characteristics of watersheds in arid regions. J. Arid Land 2020, 12, 950–963. [Google Scholar] [CrossRef]
  76. Egiazarova, D.; Kordzakhia, M.; Wałęga, A.; Drożdżal, E.; Milczarek, M.; Radecka, A. Application of polish experience in the implementation of the flood directive in georgia—Hydrological calculations. Acta Sci. Pol. Form. Circumiectus 2017, 3, 89–110. [Google Scholar] [CrossRef]
  77. Sharma, S. Snyder Unit Hydrograph and GIS for Estimation of Flood for Un-Gauged Catchments in Lower Tapi Basin, India. Hydrol. Curr. Res. 2015, 6, 195. [Google Scholar] [CrossRef]
  78. Prasad, R.N.; Pani, P. Geo-hydrological analysis and sub watershed prioritization for flash flood risk using weighted sum model and Snyder’s synthetic unit hydrograph. Model. Earth Syst. Environ. 2017, 3, 1491–1502. [Google Scholar] [CrossRef]
  79. Bahrami, E.; Salarijazi, M.; Nejatian, S. Estimation of flood hydrographs in the ungauged mountainous watershed with Gray synthetic unit hydrograph model. Arab. J. Geosci. 2022, 15, 761. [Google Scholar] [CrossRef]
  80. Zlewnia Badawcza Potoku Sudół—KATEDRA GEOINŻYNIERII I GOSPODARKI WODNEJ. Available online: http://gigw.pl/?page_id=1824 (accessed on 11 November 2022).
  81. Bahrami, E.; Mohammadrezapour, O.; Salarijazi, M.; Jou, P.H. Effect of Base Flow and Rainfall Excess Separation on Runoff Hydrograph Estimation using Gamma Model (Case Study: Jong Catchment). KSCE J. Civ. Eng. 2019, 233, 1420–1426. [Google Scholar] [CrossRef]
  82. Araujo de Medeiros, G.; Claudia Camargo de Lima Tresmondi, A.; Pimentel Villar de Queiroz, B.; Hashimoto Fengler, F.; Henrique Rosa, A.; Martins Fialho, J.; Silva Lopes, R.; Villafanha Negro, C.; Ferreira dos Santos, L.; Irio Ribeiro, A. Water quality, pollutant loads, and multivariate analysis of the effects of sewage discharges into urban streams of Southeast Brazil. Energy Ecol. Environ. 2017, 2, 259–276. [Google Scholar] [CrossRef] [Green Version]
  83. Bréchignac, F. Protection of the environment: How to position radioprotection in an ecological risk assessment perspective. Sci. Total Environ. 2003, 307, 35–54. [Google Scholar] [CrossRef]
  84. Bodar, C.W.M. Environmental Risk Limits for Zinc; National Institute for Public Health and the Environment: Bilthoven, The Netherlands, 2007. [Google Scholar]
  85. von der Ohe, P.C.; Dulio, V.; Slobodnik, J.; De Deckere, E.; Kühne, R.; Ebert, R.U.; Ginebreda, A.; De Cooman, W.; Schüürmann, G.; Brack, W. A new risk assessment approach for the prioritization of 500 classical and emerging organic microcontaminants as potential river basin specific pollutants under the European Water Framework Directive. Sci. Total Environ. 2011, 409, 2064–2077. [Google Scholar] [CrossRef]
  86. Shao, Y.; Chen, Z.; Hollert, H.; Zhou, S.; Deutschmann, B.; Seiler, T.B. Toxicity of 10 organic micropollutants and their mixture: Implications for aquatic risk assessment. Sci. Total Environ. 2019, 666, 1273–1282. [Google Scholar] [CrossRef]
  87. Durak, J.; Rokoszak, T.; Skiba, A.; Furman, P.; Styszko, K. Environmental risk assessment of priority biocidal substances on Polish surface water sample. Environ. Sci. Pollut. Res. 2021, 28, 1254–1266. [Google Scholar] [CrossRef] [PubMed]
  88. Cristale, J.; Katsoyiannis, A.; Sweetman, A.J.; Jones, K.C.; Lacorte, S. Occurrence and risk assessment of organophosphorus and brominated flame retardants in the River Aire (UK). Environ. Pollut. 2013, 179, 194–200. [Google Scholar] [CrossRef] [PubMed]
  89. Gruszecka, A.; Helios-Rybicka, E. Pb, Tl i As w wodach, osadach i glebach w otoczeniu składowisk odpadów poflotacyjnych w rejonie Bukowna—Ocena ryzyka ekologicznego. Geologia 2009, 35, 233–242. [Google Scholar]
  90. Directive 2000/60/EC of the European Parliament and the Council of 23 October 2000 Establishing a Framework for Community Action in the Field of Water Policy (OJ L 327, 22/12/2000, 1–73). Available online: https://eur-lex.europa.eu/eli/dir/2000/60/oj (accessed on 1 November 2022).
  91. Castelhano Gebara, R.; de Oliveira Gonçalves Alho, L.; Bruno de Abreu, C.; da Silva Mansano, A.; Moreira, R.A.; Swerts Rocha, G.; da Graça Gama Melão, M. Toxicity and Risk Assessment of Zinc and Aluminum Mixtures to Ceriodaphnia silvestrii (Crustacea: Cladocera). Environ. Toxicol. Chem. 2021, 40, 2912–2922. [Google Scholar] [CrossRef] [PubMed]
  92. Directive 2006/44/EC of the European Parliament and of the Council of 6 September 2006 on the Quality of Fresh Waters Needing Protection or Improvement in Order to Support Fish Life (OJ L 264, 25/9/2006, 20–31). Available online: https://eur-lex.europa.eu/eli/dir/2006/44/oj (accessed on 1 November 2022).
  93. Wan Mohtar, W.H.M.; Abdul Maulud, K.N.; Muhammad, N.S.; Sharil, S.; Yaseen, Z.M. Spatial and temporal risk quotient based river assessment for water resources management. Environ. Pollut. 2019, 248, 133–144. [Google Scholar] [CrossRef]
  94. Redman, A.D.; Parkerton, T.F.; Leon Paumen, M.; Butler, J.D.; Letinski, D.J.; den Haan, K. A re-evaluation of PETROTOX for predicting acute and chronic toxicity of petroleum substances. Environ. Toxicol. Chem. 2017, 36, 2245–2252. [Google Scholar] [CrossRef]
  95. Park, J.; Kim, S.D. Derivation of Predicted No Effect Concentrations (PNECs) for Heavy Metals in Freshwater Organisms in Korea Using Species Sensitivity Distributions (SSDs). Miner 2020, 10, 697. [Google Scholar] [CrossRef]
  96. Xu, J.; Zhao, C.; Wei, D.; Du, Y. A toxicity-based method for evaluating safety of reclaimed water for environmental reuses. J. Environ. Sci. 2014, 26, 1961–1969. [Google Scholar] [CrossRef]
  97. Santos, E.; Souza, M.R.R.; Vilela Junior, A.R.; Soares, L.S.; Frena, M.; Alexandre, M.R. Polycyclic aromatic hydrocarbons (PAH) in superficial water from a tropical estuarine system: Distribution, seasonal variations, sources and ecological risk assessment. Mar. Pollut. Bull. 2018, 127, 352–358. [Google Scholar] [CrossRef]
  98. Mapa glebowo-ROLNICZA—Małopolska Infrastruktura Informacji Przestrzennej. Available online: https://miip.geomalopolska.pl/mapa/glebowo_rolnicza.html (accessed on 11 November 2022).
  99. Commission Directive 2009/90/EC of 31 July 2009 Laying Down, Pursuant to Directive 2000/60/EC of the European Parliament and of the Council, Technical Specifications for Chemical Analysis and Monitoring of Water Status. 2009. Available online: https://eur-lex.europa.eu/eli/dir/2009/90/oj (accessed on 1 November 2022).
  100. Ciupa, T.; Suligowski, R. Impact of the City on the Rapid Increase in the Runoff and Transport of Suspended and Dissolved Solids During Rainfall—The Example of the Silnica River (Kielce, Poland). Water 2020, 12, 2693. [Google Scholar] [CrossRef]
  101. De, P.-J.; Stijn, B.; Van, W.H.; Ann, H.; Diederik, D.; Rousseau, P.L.; De Buyck, P.-J.; Van Hulle, S.W.H.; Dumoulin, Á.A.; Rousseau, Á.D.P.L.; et al. Roof runoff contamination: A review on pollutant nature, material leaching and deposition. Rev. Environ. Sci. Bio/Technol. 2021, 201, 549–606. [Google Scholar]
  102. Strzebońska, M.; Gruszecka-Kosowska, A.; Kostka, A. Chemistry and Microbiology of Urban Roof Runoff in Kraków, Poland with Ecological and Health Risk Implications. Appl. Sci. 2020, 10, 8554. [Google Scholar] [CrossRef]
  103. Barałkiewicz, D.; Chudzińska, M.; Szpakowska, B.; Świerk, D.; Gołdyn, R.; Dondajewska, R. Storm water contamination and its effect on the quality of urban surface waters. Environ. Monit. Assess. 2014, 186, 6789–6803. [Google Scholar] [CrossRef] [Green Version]
  104. Ociepa, E. Ocena zanieczyszczenia ścieków deszczowych trafiających do systemów kanalizacyjnych. Inżynieria I Ochr. Sr. 2011, 14, 357–364. [Google Scholar]
  105. Bąk, Ł.; Górski, J.; Górska, K.; Szeląg, B. Zawartość zawiesin i metali ciȩżkich w wybranych falach ścieków deszczowych w zlewni miejskiej. Ochr. Sr. 2012, 34, 49–52. [Google Scholar]
  106. Song, H.; Qin, T.; Wang, J.; Wong, T.H.F. Characteristics of Stormwater Quality in Singapore Catchments in 9 Different Types of Land Use. Water 2019, 11, 1089. [Google Scholar] [CrossRef] [Green Version]
  107. Ansari, A.A.; Gill, S.S.; Khan, F.A. Eutrophication: Threat to Aquatic Ecosystems. In Eutrophication: Causes, Consequences and Control; Springer: Berlin/Heidelberg, Germany, 2010; pp. 143–170. [Google Scholar]
  108. Witczak, S.; Kania, J.; Kmiecik, E. Katalog Wybranych Fizycznych i Chemicznych Wskaźników Zanieczyszczeń wód Podziemnych i Metod Ich Oznaczania; Biblioteka Monitoringu Środowiska: Warszawa, Poland, 2013; ISBN 978-83-61227-13-7. [Google Scholar]
  109. Sloman, K.A.; Baker, D.W.; Wood, C.M.; McDonald, G. Social interactions affect physiological consequences of sublethal copper exposure in rainbow trout, Oncorhynchus mykiss. Environ. Toxicol. Chem. 2002, 21, 1255–1263. [Google Scholar] [CrossRef]
  110. Maciejewska, M.; Sowińska, A. Proekologiczne kompozyty gumowe o obniżonej zawartości cynku. Technol. I Jakość Wyr. 2018, 63, 55–65. [Google Scholar]
  111. Sánchez Uría, J.E.; Sanz-Medel, A. Inorganic and methylmercury speciation in environmental samples. Talanta 1998, 47, 509–524. [Google Scholar] [CrossRef]
  112. Le Faucheur, S.; Vasiliu, D.; Catianis, I.; Zazu, M.; Dranguet, P.; Beauvais-Flück, R.; Loizeau, J.L.; Cosio, C.; Ungureanu, C.; Ungureanu, V.G.; et al. Environmental quality assessment of reservoirs impacted by Hg from chlor-alkali technologies: Case study of a recovery. Environ. Sci. Pollut. Res. 2016, 23, 22542–22553. [Google Scholar] [CrossRef]
  113. Zhang, Y.; Liu, Y.; Niu, Z.; Jin, S. Ecological risk assessment of toxic organic pollutant and heavy metals in water and sediment from a landscape lake in Tianjin City, China. Environ. Sci. Pollut. Res. 2017, 24, 12301–12311. [Google Scholar] [CrossRef] [PubMed]
  114. Sun, J.H.; Wang, G.L.; Chai, Y.; Zhang, G.; Li, J.; Feng, J. Distribution of polycyclic aromatic hydrocarbons (PAHs) in Henan Reach of the Yellow River, Middle China. Ecotoxicol. Environ. Saf. 2009, 72, 1614–1624. [Google Scholar] [CrossRef]
  115. Pennino, M.J.; McDonald, R.I.; Jaffe, P.R. Watershed-scale impacts of stormwater green infrastructure on hydrology, nutrient fluxes, and combined sewer overflows in the mid-Atlantic region. Sci. Total Environ. 2016, 565, 1044–1053. [Google Scholar] [CrossRef] [PubMed] [Green Version]
  116. Walsh, C.J.; Imberger, M.J.; Burns, M.J.; Fletcher, T.D.; Bos, D.G. Dispersed Urban-Stormwater Control Improved Stream Water Quality in a Catchment-Scale Experiment. Water Resour. Res. 2022, 58. [Google Scholar] [CrossRef]
  117. Hopkins, K.G.; Loperfido, J.V.; Craig, L.S.; Noe, G.B.; Hogan, D.M. Comparison of sediment and nutrient export and runoff characteristics from watersheds with centralized versus distributed stormwater management. J. Environ. Manag. 2017, 203, 286–298. [Google Scholar] [CrossRef] [PubMed]
  118. Scarlett, R.D.; McMillan, S.K.; Bell, C.D.; Clinton, S.M.; Jefferson, A.J.; Rao, P.S.C. Influence of stormwater control measures on water quality at nested sites in a small suburban watershed. Urban Water J. 2018, 15, 868–879. [Google Scholar] [CrossRef]
  119. Bell, C.D.; McMillan, S.K.; Clinton, S.M.; Jefferson, A.J. Characterizing the Effects of Stormwater Mitigation on Nutrient Export and Stream Concentrations. Environ. Manag. 2017, 59, 604–618. [Google Scholar] [CrossRef]
  120. Osman, M.; Wan Yusof, K.; Takaijudin, H.; Goh, H.W.; Abdul Malek, M.; Azizan, N.A.; Ab. Ghani, A.; Sa’id Abdurrasheed, A. A Review of Nitrogen Removal for Urban Stormwater Runoff in Bioretention System. Sustainability 2019, 11, 5415. [Google Scholar] [CrossRef]
  121. Godyń, I.; Grela, A.; Stajno, D.; Tokarska, P. Sustainable Rainwater Management Concept in a Housing Estate with a Financial Feasibility Assessment and Motivational Rainwater Fee System Efficiency Analysis. Water 2020, 12, 151. [Google Scholar] [CrossRef] [Green Version]
  122. Godyń, I.; Muszyński, K.; Grela, A. Assessment of the Impact of Loss-of-Retention Fees on Green Infrastructure Investments. Water 2022, 14, 560. [Google Scholar] [CrossRef]
  123. Godyń, I. Economic Incentives in Stormwater Management: A Study of Practice Gaps in Poland. Water 2022, 14, 3817. [Google Scholar] [CrossRef]
  124. LeFevre, G.H.; Paus, K.H.; Natarajan, P.; Gulliver, J.S.; Novak, P.J.; Hozalski, R.M. Review of Dissolved Pollutants in Urban Storm Water and Their Removal and Fate in Bioretention Cells. J. Environ. Eng. 2014, 141, 04014050. [Google Scholar] [CrossRef]
  125. Hatt, B.E.; Fletcher, T.D.; Deletic, A. Hydrologic and pollutant removal performance of stormwater biofiltration systems at the field scale. J. Hydrol. 2009, 365, 310–321. [Google Scholar] [CrossRef]
  126. Bratieres, K.; Fletcher, T.D.; Deletic, A.; Zinger, Y. Nutrient and sediment removal by stormwater biofilters: A large-scale design optimisation study. Water Res. 2008, 42, 3930–3940. [Google Scholar] [CrossRef] [PubMed]
  127. Haile, T.M.; Fuerhacker, M. Simultaneous adsorption of heavy metals from roadway stormwater runoff using different filter media in column studies. Water 2018, 10, 1160. [Google Scholar] [CrossRef] [Green Version]
  128. Hamedani, A.S.; Bazilio, A.; Soleimanifar, H.; Shipley, H.; Giacomoni, M. Improving the Treatment Performance of Low Impact Development Practices—Comparison of Sand and Bioretention Soil Mixtures Using Column Experiments. Water 2021, 13, 1210. [Google Scholar] [CrossRef]
  129. Schmitt, N.; Wanko, A.; Laurent, J.; Bois, P.; Molle, P.; Mosé, R. Constructed wetlands treating stormwater from separate sewer networks in a residential Strasbourg urban catchment area: Micropollutant removal and fate. J. Environ. Chem. Eng. 2015, 3, 2816–2824. [Google Scholar] [CrossRef]
Figure 1. Location of the study area of the Sudół catchment with depiction of current land use based on an orthophotomap.
Ijerph 20 00504 g001
Figure 2. Catchment development in water sampling areas.
Ijerph 20 00504 g002
Figure 3. The design rainfall hyetograph type 1, precipitation with a probability of occurrence p = 20%.
Ijerph 20 00504 g003
Figure 4. Structure and tabular summary of the results of the calibration of the mathematical model of the catchment area of the Sudół River.
Ijerph 20 00504 g004
Figure 5. The water level in the Sudół River: (a) April 2019 (high water); (b) August 2020 (low water).
Ijerph 20 00504 g005
Figure 6. Graphical summary of model calibration results for the Sudół River catchment area.
Ijerph 20 00504 g006
Figure 7. Illustration of changes in the development of the studied catchment of the Sudół River using CLC 2000 and CLC 2018 data.
Ijerph 20 00504 g007
Figure 8. Summary of changes in land use of the total catchment area of the Sudół River in 2000 and 2018, according to Corine Land Cover.
Ijerph 20 00504 g008
Figure 9. Comparison of average concentrations of pollutant indicators in stormwater from outlets O1 and O2 and in the river: (a) concentrations of suspended solids and COD; (b) concentrations of biogenic compounds; (c) concentrations of heavy metals, HOI, and PAHs.
Ijerph 20 00504 g009
Figure 10. Average loads of pollutant indicators discharged during rainfall with p = 20% in stormwater from outlets O1 and O2 and in the river: (a) loads of TSS and COD; (b) loads of biogenic compounds; (c) loads of heavy metals, HOI, and PAHs.
Ijerph 20 00504 g010
Figure 11. Graphical illustration of the conducted analyses.
Ijerph 20 00504 g011
Table 1. Summary of the permissible values characterizing the good status (class II) of surface water quality for JCWP Prądnik.
ParameterUnitLimit Value for Good Status (Class II)
Nitrate nitrogenmg N–NO3/L<2.0
Total nitrogenmg N/L<3.0
Total phosphorusmg P/L<0.25
Zincmg Zn/L<0.1
Coppermg Cu/L<0.01
Petroleum hydrocarbons—hydrocarbon oil index (HOI)mg/L<0.2
Mercuryμg/L<0.07 (maximum)
Polycyclic aromatic hydrocarbons (PAHs)—benzo(a)pyreneμg/L<0.00017 (mean)
<0.27 (maximum)
Table 2. Selected stormwater priority pollutants (indicator parameters) [36].
No.TypeName
1Basic parameterspH, Biochemical oxygen demand BOD, Chemical oxygen demand COD, Suspended solids, Nitrogen, Phosphorus
2MetalsZinc Zn, Cadmium Cd, Chromium as Chromate Cr(IV), Copper Cu, Nickel Ni, Lead Pb, Platinum Pt
3Polycyclic aromatic hydrocarbons (PAHs)Benzo[a]pyrene, Naphthalene, Pyrene
4HerbicidesTerbutylazine, Pendimethalin, Phenmedipham, Glyphosate
5MiscellaneousNonylphenol ethoxylates and degradation products, Pentachlorophenol, Di(2-ethylhexyl) phthalate, Polychlorinated biphenyl 28, Methyl tert-butyl ether
Table 3. CN parameter values for a land use typical of an urban catchment area [69].
Cover DescriptionCurve Numbers for Hydrologic Soil Group
Cover Type and Hydrologic ConditionAverage Percent Impervious AreaABCD
Open space (lawns, parks, cemeteries, etc.):
    Poor condition (grass cover <50%) 68798689
    Poor condition (grass cover 50% to 75%) 49694984
    Poor condition (grass cover >75%) 39617480
Impervious areas:
    Paved parking lots, roofs, driveways, etc. (excluding right-of-way) 98989898
    Street and roads: 98989898
       Paved; curbs and storm sewers (excluding right-of-way)
       Paved; open ditches (including right-of-way) 83899293
       Gravel (including right-of-way) 76858991
       Dirt (including right-of-way) 72828789
Urban district:
    Commercial and business8589929495
    Industrial7281889193
Residential district by average lot size:
    1/8 acre or less (506 m2 or less)6577859092
    1/4 acre (1012 m2)3861758387
    1/3 acre (1349 m2)3057728186
    1/2 acre (2023 m2)2554708085
    1 acre (4047 m2)2051687984
    2 acres (8094 m2)1246657782
Table 4. PNEC values for selected surface water pollutants.
Parameter PNEC
(mg/L)
Source
TSS25[92]
COD25[93]
TN0.01[92]
TP0.2[92]
HOI10[94]
Zn0.0302[95]
Cu0.0013[95]
Hg0.00018[96]
PAHs0.00017[97]
Table 5. Summary of parameters for individual calculation sections.
Cross-Section on the Sudół River Area
(km2)
CN CLC 2000CN CLC 2018
Residential development: outlet 10.04283.7483.74
Residential and commercial area: outlet 21.20385.4788.05
Sudół: cross-section A17.96076.9777.58
Sudół: whole catchment 19.09077.7278.28
Table 6. Summary of the results of flow calculations for the cross-sections of the Sudół River catchment area.
Cross-Section on the Sudół River CLC 2000CLC 2018Flow Increment in Years 2000–2018
QmaxOutflow VolumeQmaxOutflow Volume
m3/sm3m3/sm3
Residential development: outlet 10.003230.500.003230.600.05%
Residential and commercial area: outlet 20.1017225.440.1178397.1216.22%
Sudół: cross-section A0.98570,767.401.01372,751.352.80%
Sudół: whole catchment 1.08477,812.701.11279,848.222.62%
Table 7. Results of studies of water quality of the Sudół River: measured, minimum, maximum, and average concentrations of selected indicators of pollution.
Sample CodeMonth of SamplingTSSCODTKNN–NO3N–NO2TNTPHOIZnCuHgPAHs
mg/Lmg/Lmg/Lmg/Lmg/Lmg/Lmg/Lmg/Lmg/Lmg/Lmg/Lµg/L
737Mar 2022180165.03.3002.1800.1215.601.070.500.33<MQL<MQL0.350
1110May 20227449.27.9305.0200.54513.501.99<MQL0.09<MQL<MQL0.028
1917Sep 20225126.90.9194.4200.1085.450.78<MQL0.09<MQL<MQL0.091
Min5126.90.9192.1800.1085.450.78<MQL0.09<MQL<MQL0.028
Max180165.07.9305.0200.54513.501.990.500.33<MQL<MQL0.350
Mean *10280.44.0503.8730.2588.1831.280.2330.170.030.00020.1563
<MQL: below the minimum quantification level (MQL); *: <MQL were substituted with MQL/2 in calculations of mean values [99].
Table 8. Results of stormwater quality examination from outlet 1 (residential area): measured, minimum, maximum, and average concentrations of selected pollutant indicators.
Sample CodeMonth of SamplingTSSCODTKNN–NO3N–NO2TNTPHOIZnCuHgPAHs
mg/Lmg/Lmg/Lmg/Lmg/Lmg/Lmg/Lmg/Lmg/Lmg/Lmg/Lµg/L
293Feb 202069.00.409ntntnt0.0630.700.39<MQL<MQLnt
309Feb 202112082.85.6200.4440.0666.1301.2000.600.78<MQL<MQL0.310
388Feb 20222915.71.7800.086<MQL1.7801.780<MQL0.28<MQL<MQL0.160
736Mar 202299131.02.3000.5660.0562.9200.250<MQL0.71<MQL<MQL0.240
1109May 20222043.03.9500.4300.0554.4400.418<MQL0.55<MQL<MQL0.021
1926Aug 2019108.20.385ntntnt0.129<MQL0.11<MQL<MQLnt
1916Sep 20229543.20.8250.7340.0561.6200.7800.400.36<MQL<MQL0.048
2134Sep 201986.30.220ntntnt0.2780.400.31<MQL<MQL0.160
2074Nov 20204826.1<MQL0.0460.7120.7580.2390.300.27<MQL<MQL0.360
2551Nov 20191611.3<MQLntntnt0.2080.800.24<MQL<MQL0.052
Min66.30.0460.046<MQL0.7580.063<MQL0.11<MQL<MQL0.021
Max120131.05.6200.7340.7126.1301.7800.800.78<MQL<MQL0.360
Mean *4537.71.5580.3840.1582.9410.5350.360.400.030.00030.1689
nt: not tested; <MQL: below the minimum quantification level (MQL); *: <MQL were substituted with MQL/2 in calculations of mean values [99].
Table 9. Results of stormwater quality examination from outlet 2 (residential–commercial area): measured, minimum, maximum, and average concentrations of selected pollutant indicators.
Sample CodeMonth of SamplingTSSCODTKNN–NO3N–NO2TNTPHOI ZnCuHgPAH
mg/Lmg/Lmg/Lmg/Lmg/Lmg/Lmg/Lmg/Lmg/Lmg/Lmg/Lµg/L
292Feb 20205834.00.731ntntnt0.2140.80.24<MQL0.0003nt
308Feb 2021320252.02.2300.4730.0752.780.8522.11.190.180<MQL1.100
387Feb 2022440214.03.3900.2580.0293.682.7201.20.940.115<MQL1.300
735Mar 2022440308.03.9000.9460.1985.041.0902.11.060.150<MQL0.880
1108May 202231113.03.5501.3800.2085.140.5050.20.65<MQL<MQL0.032
1925Aug 2019187.22.420ntntnt0.390<MQL0.12<MQL<MQLnt
1915Sep 20221612.10.8521.0200.0411.910.185<MQL0.23<MQL<MQL0.048
2133Sep 20193518.61.120ntntnt0.1460.80.41<MQL<MQL0.840
2073Nov 202018074.40.4260.4360.7111.5700.4340.60.370.0600.00070.760
2550Nov 20199851.60.169ntntnt0.0711.00.26<MQL0.00070.190
Min167.20.1690.2580.0291.570.071<MQL0.12<MQL<MQL0.0032
Max440308.03.9001.3800.7115.142.7202.11.190.1800.00071.300
Mean *164108.51.8790.7520.2103.3530.6611.10.5470.12630.00060.644
nt: not tested; <MQL: below the minimum quantification level; *: <MQL were substituted with MQL/2 in calculations of mean values [99].
Table 10. Comparison of the determined average concentrations of pollutants analyzed in the outflow from the residential area and the residential–commercial area.
ParameterUnitConcentration in Outlet O1Concentration in Outlet O2O1/O2
Concentration
Ratio
TSSmg/L451643.6
CODmg/L37.7108.52.9
TKNmg/L1.5581.8791.2
N–NO3mg/L0.3840.7522.0
N–NO2mg/L0.1580.2101.3
TNmg/L2.9413.3531.1
TPmg/L0.5350.6611.2
HOImg/L0.360.902.5
Znmg/L0.4000.5471.4
Cumg/L0.03000.06852.3
Hgmg/L0.00030.00041.5
PAHsµg/L0.16890.64383.8
Table 11. Calculated risk quotient values for three sampling locations for stormwater and surface water allowing for assessment of potential ecological risk.
Parameter RQ for Outlet 1 RQ for Outlet 2 RQ for River
Scenario
Realistic PessimisticOptimisticRealistic PessimisticOptimisticRealistic PessimisticOptimistic
TSS 1.8 4.8 0.2 6.5 17.6 0.6 4.1 7.2 3.0
COD1.5 5.2 0.3 4.3 12.3 0.3 3.2 6.6 2.0
N–NO3 38.4 73.4 4.6 75.2 138.0 25.8 387.3 502.0 218.0
TP 2.7 8.9 0.3 3.3 13.6 0.4 6.4 10.0 5.4
HOI 0.04 0.1 <MQL 0.1 0.2 <MQL 0.020.1 <MQL
Zn 13.2 25.8 3.6 18.1 39.4 4.0 5.6 10.9 3.0
Cu23.1 46.2 <MQL 97.2 138.5 <MQL 23.1 <MQL <MQL
Hg8.9 22.2 <MQL 3.3 3.9 <MQL 11.1 <MQL <MQL
PAHs 1.0 2.1 0.1 3.8 7.6 0.2 0.9 2.1 0.2
Adopted evaluation scale:
no environmental risklow potential for adverse effectsconsiderable potential for adverse effectsadverse effects are expected
RQ < 1 1 ≤ RQ < 10 10 ≤ RQ < 100 RQ ≥ 100
Table 12. Comparison of the determined maximum and average concentrations of pollutants in the analyzed outflows and literature.
ParameterUnitOutlets 1 and 2Review of Global Research [101]Polish Research [102,103,104,105]
MeanMaxMeanMaxMeanMax
TSSmg/L104.350440124.937113016.85–55.31 [103]
195.59 [104]
106.00–5514.00 [105]
736 [103]
410 [104]
7432 [105]
CODmg/L73.07730868.93360.275.348 [104]129 [104]
TKNmg/L1.7185.6201.0492.8001.240–1.701 [103]5.540 [103]
N–NO3mg/L0.5681.3800.0100.0100.440–0.900 [103]0.091 [102]
4.110 [103]
N–NO2mg/L0.1840.7121.5562.1700.010 [103]0.040 [103]
TNmg/L3.1476.1302.5618.7442.690–3.580 [103]14.600 [103]
TPmg/L0.5982.7200.3761.7570.120–0.220 [103]0.570 [103]
HOImg/L0.6302.100
Znmg/L0.4741.1900.1841.9790.029–0.697 [103]
0.158–0.473 [105]
0.091 [102]
7.820 [103]
0.858 [105]
Cumg/L0.0490.1800.0360.6450.006–0.024 [103]
0.005 [104]
0.089–0.195 [105]
0.091 [102]
0.326 [103]
0.008 [104]
0.320 [105]
Hgmg/L0.00030.00070.0080.1000.304–0.992 [105]1.405 [105]
PAHsµg/L0.4061.3001.8289.570
Disclaimer/Publisher’s Note: The statements, opinions and data contained in all publications are solely those of the individual author(s) and contributor(s) and not of MDPI and/or the editor(s). MDPI and/or the editor(s) disclaim responsibility for any injury to people or property resulting from any ideas, methods, instructions or products referred to in the content.

