
A Cross-Sectional Study on Self-Perceived Health and Physical Activity Level in the Spanish Population

 ,
,  ,
,  ,
,  , ,
, , 
 , and
, and 
Abstract
:1. Introduction
2. Materials and Methods
2.1. Study Desing
2.2. Ethical Concerns
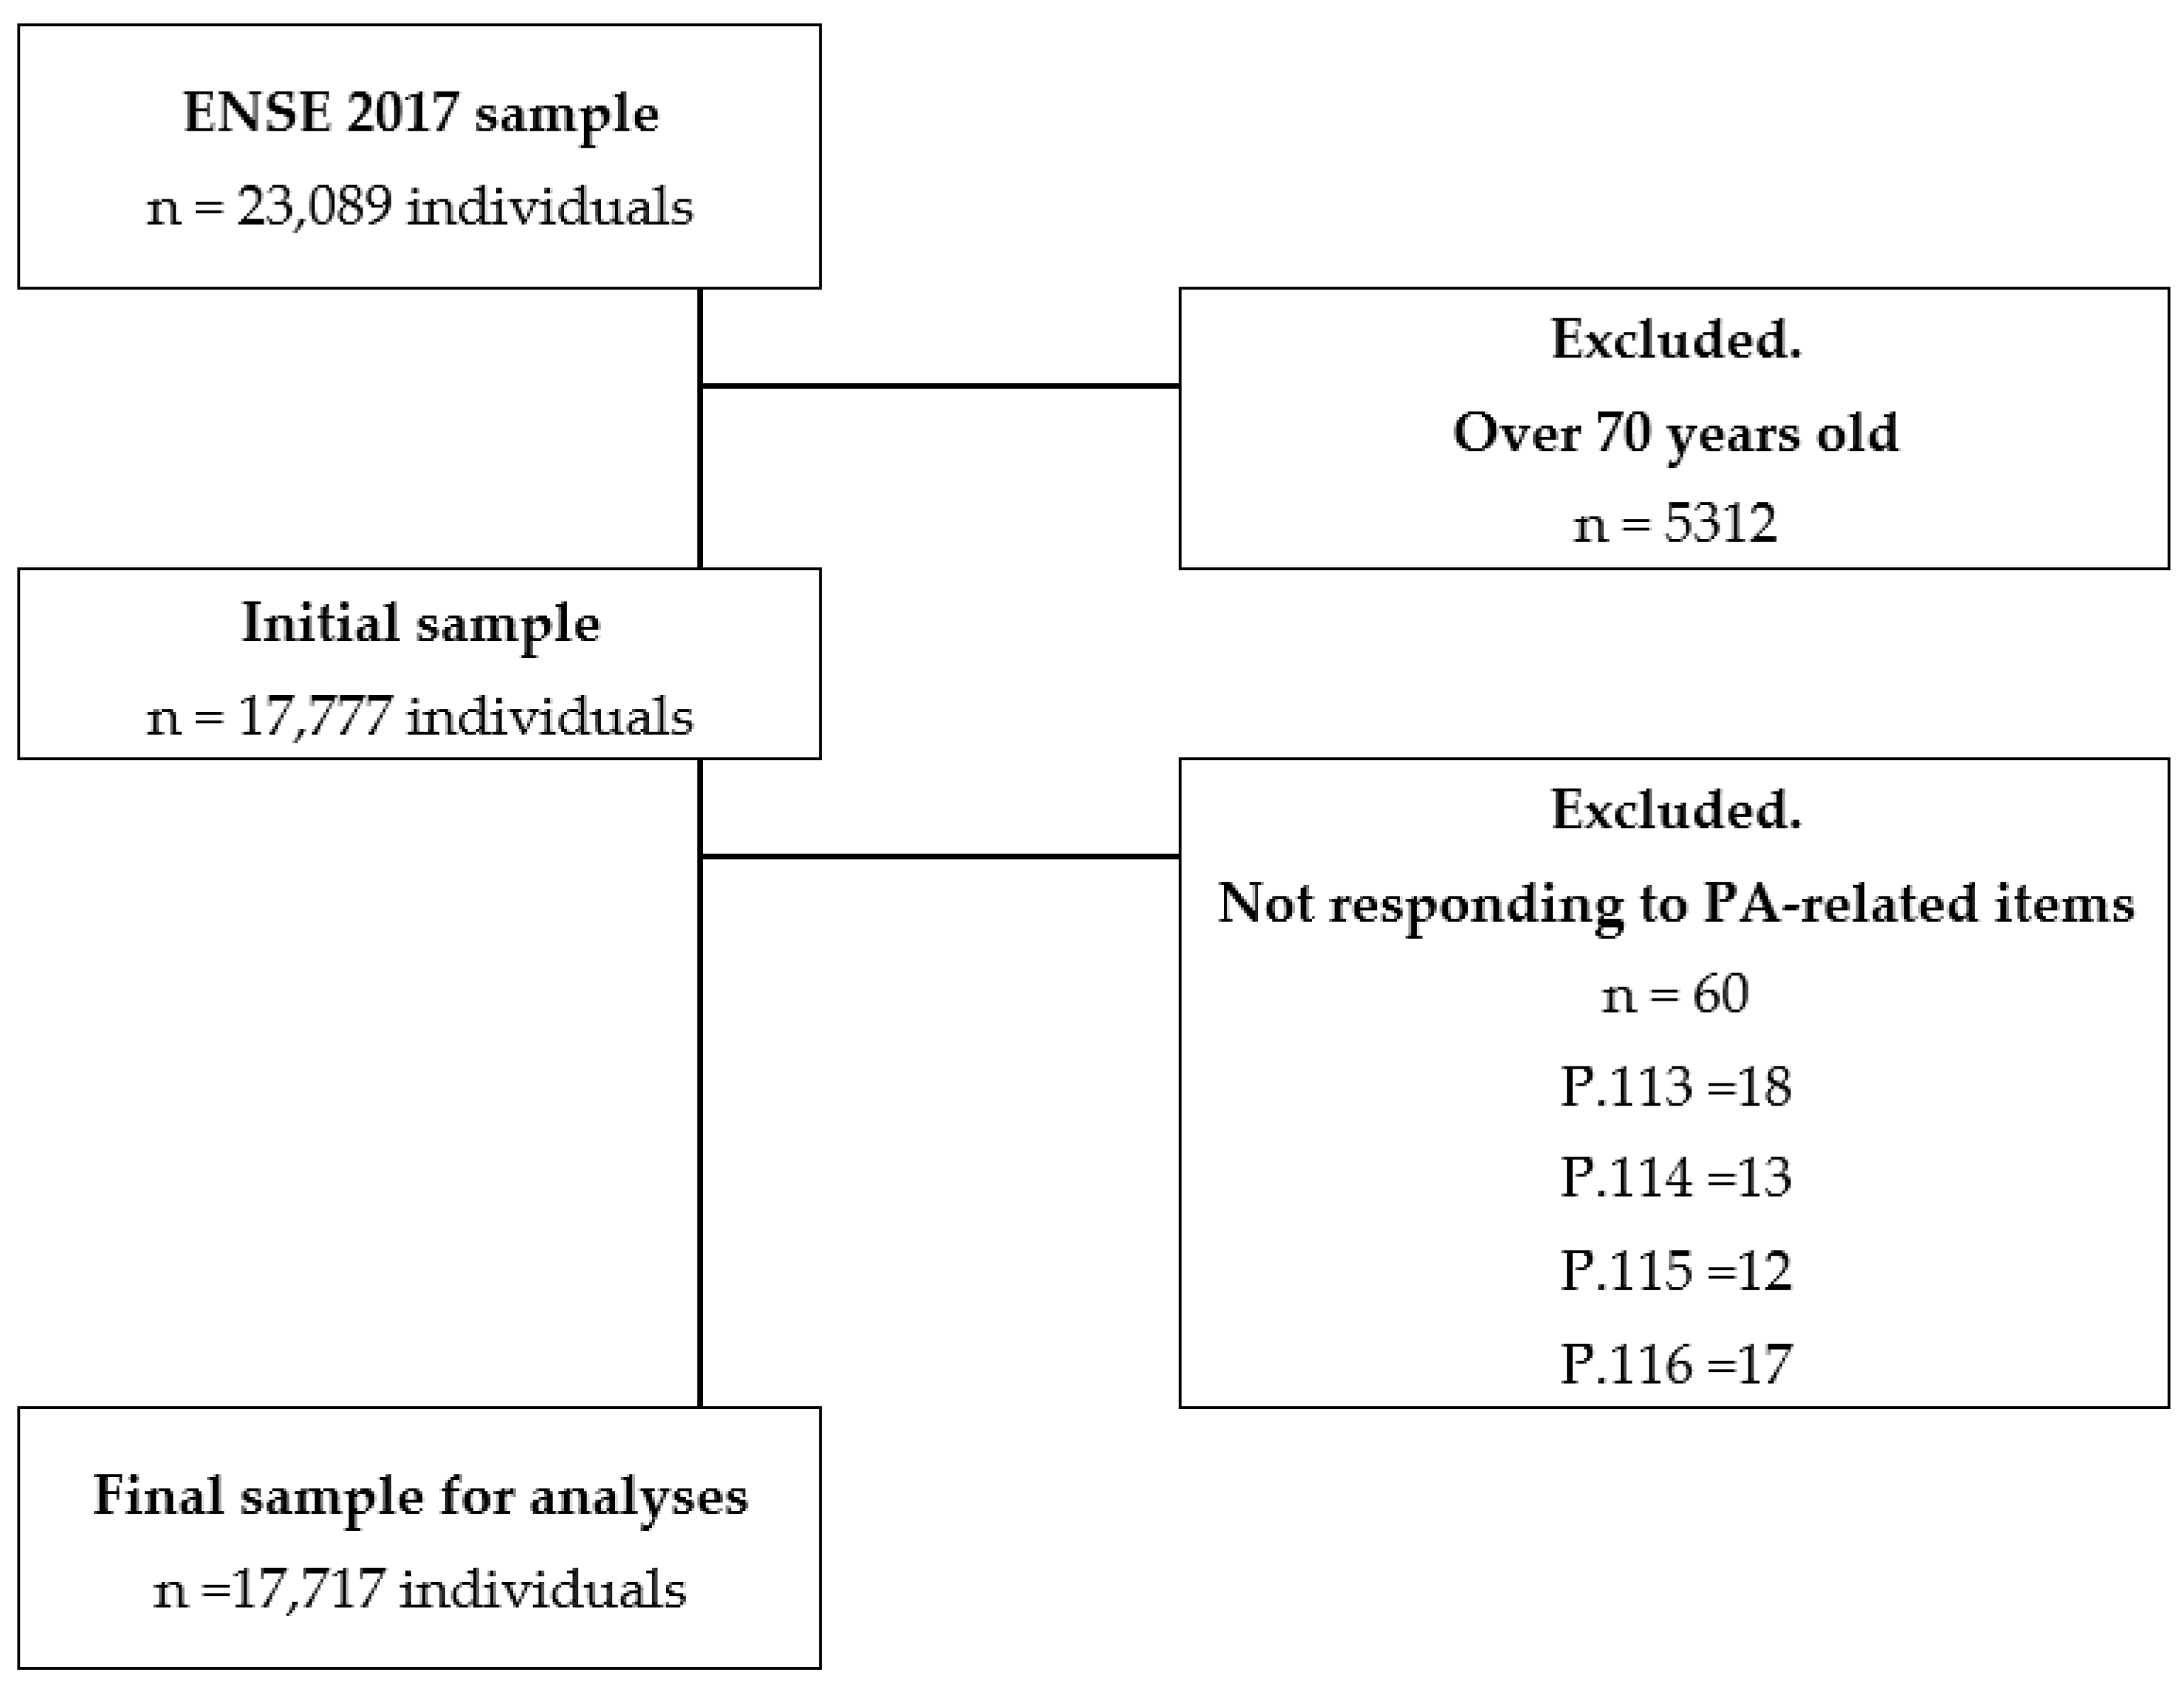
2.3. Participants
2.4. Measures and Variables
- Extracted variables: Related to the items “Age”, “Sex” (male and female), G21 (self-perceived health, with possible answers: very bad, bad, fair, good, good, very good, do not know, or no response (NS/NC)), Q.113 (weekly frequency of intense PA), Q.114 (average duration of intense PA performed), Q.115 (weekly frequency of moderate PA), Q.116 (average duration of moderate PA performed), and Q.117 (time spent walking in the last seven days).
- Elaborated variables:
- Age groups: Taking data from the item “Age”, the new variable Age groups were created: young people (15–35 years), young adults (35–49 years), older adults (50–64 years), and older adults (65–69 years) [29].
- Physical Activity Index (PAI): With data from the PA-related items, the procedure followed in previous studies were used to build the PAI variable [30,31], using an adaptation of the Nes et al. Physical Activity Index [32], with values between 0 and 67.5 using the items Q.113, Q.114, Q.115, and Q.116. These corresponded to questions on the PA of the participants using the Spanish version of the International Physical Activity Questionnaire (IPAQ) [33]. The PAI was calculated using the following formula: (intensity factor for intense activity × frequency factor for intense activity × duration factor for in-tense activity) + (intensity factor for moderate activity × frequency factor for moderate activity × duration factor for moderate activity). Previously, different factors had been assigned to the participants’ answers to ENSE 2017 [28] items Q.113, Q.114, Q.115, and Q.116. The intensity factor was 10 for intense activity and 5 for moderate activity, questions Q.114 and Q.116. Frequency factor: to the answers given by the participants to items Q.114 (“How many days did you do intense PA?”) and Q.116 (“How many days did you do moderate PA?”), the following factors were applied: 0 for never, 1 for one day a week, 2 for 2–3 days a week, and 3 for more than three days a week [26]. Duration factor: to the answers given by the participants to items Q.115 (“How much time did you spend in total on intense PA?”) and Q.116 (“How much time did you spend in total on moderate PA?”), factor 1 (<30 min) and 1.5 (>30 min) were applied.
- Physical Activity Level (PAL): Participants were grouped according to their PAI. In addition, item Q.117 regarding the time spent walking during the last seven days was used to discriminate between walkers and inactive people within PAI = 0. A total of 6 levels were established. On the one hand, there were two levels corresponding to individuals with PAI = 0: “Inactive”, those who did not perform moderate or intense PA for more than 10 min any day of the week and those who responded with “no day more than 10 min consecutively”, and “Walkers”, who responded with “one or more days, more than 10 min consecutively”. On the other hand, there were 4 PA levels for people with PAI > 0. These last four levels correspond to the 75th, 90th, 95th, and higher percentiles concerning all participants’ PAI considering the following: “Low” for persons with a PAI between 1 and 5, 75th percentile; “Medium” for PAI between 16a and 30, 90th percentile; “High”, PAI between 31 and 45, 95th percentile; and “Very high”, PAI > 45, values higher than the 95th percentile.
2.5. Statistical Analysis
3. Results
4. Discussion
4.1. Main Findings and Theoretical Implications
4.2. Practical Implications
4.3. Limitations and Future Lines
5. Conclusions
Supplementary Materials
Author Contributions
Funding
Institutional Review Board Statement
Informed Consent Statement
Data Availability Statement
Conflicts of Interest
References
- González, K.; Fuentes, J.; Márquez, J.L. Physical Inactivity, Sedentary Behavior and Chronic Diseases. Korean J. Fam. Med. 2017, 38, 111–115. [Google Scholar] [CrossRef] [PubMed] [Green Version]
- Park, J.H.; Moon, J.H.; Kim, H.J.; Kong, M.H.; Oh, Y.H. Sedentary Lifestyle: Overview of Updated Evidence of Potential Health Risks. Korean J. Fam. Med. 2020, 41, 365–373. [Google Scholar] [CrossRef] [PubMed]
- Guthold, R.; Stevens, G.A.; Riley, L.M.; Bull, F.C. Worldwide Trends in Insufficient Physical Activity from 2001 to 2016: A Pooled Analysis of 358 Population-Based Surveys with 1·9 Million Participants. Lancet Glob. Health 2018, 6, 1077–1086. [Google Scholar] [CrossRef] [Green Version]
- Guthold, R.; Stevens, G.A.; Riley, L.M.; Bull, F.C. Global Trends in Insufficient Physical Activity among Adolescents: A Pooled Analysis of 298 Population-Based Surveys with 1·6 Million Participants. Lancet Child Adolesc. Health 2020, 4, 23–35. [Google Scholar] [CrossRef]
- World Health Organization. Global Action Plan on Physical Activity 2018–2030: More Active People for a Healthier World; World Health Organization: Geneva, Switzerland, 2018; ISBN 978-92-4-151418-7. [Google Scholar]
- World Health Organization. WHO Guidelines on Physical Activity and Sedentary Behaviour; World Health Organization: Geneva, Switzerland, 2020; ISBN 978-92-4-001512-8. [Google Scholar]
- Secretaría General de Información Sanitaria Serie Informes Monográficos 2: Actividad Física, Descanso y Sueño. In Encuesta Nacional de Salud de España 2017; Gobierno de España: Madrid, Spain, 2019.
- Thivel, D.; Tremblay, A.; Genin, P.M.; Panahi, S.; Rivière, D.; Duclos, M. Physical Activity, Inactivity, and Sedentary Behaviors: Definitions and Implications in Occupational Health. Front. Public Health 2018, 6, 288. [Google Scholar] [CrossRef] [PubMed]
- Jakicic, J.M.; Rogers, R.J.; Davis, K.K.; Collins, K.A. Role of Physical Activity and Exercise in Treating Patients with Overweight and Obesity. Clin. Chem. 2018, 64, 99–107. [Google Scholar] [CrossRef] [PubMed]
- Sangrajrang, S.; Chaiwerawattan, A.; Ploysawang, P.; Nooklang, K.; Jamsri, P.; Somharnwong, S. Obesity, Diet and Physical Inactivity and Risk of Breast Cancer in Thai Women. Asian Pac. J. Cancer Prev. 2013, 14, 7023–7027. [Google Scholar] [CrossRef]
- Sanchis-Gomar, F.; Lucia, A.; Yvert, T.; Ruiz-Casado, A.; Pareja-Galeano, H.; Santos-Lozano, A.; Fiuza-Luces, C.; Garatachea, N.; Lippi, G.; Bouchard, C.; et al. Physical Inactivity and Low Fitness Deserve More Attention to Alter Cancer Risk and Prognosis. Cancer Prev. Res. 2015, 8, 105–110. [Google Scholar] [CrossRef] [Green Version]
- Amanat, S.; Ghahri, S.; Dianatinasab, A.; Fararouei, M.; Dianatinasab, M. Exercise and Type 2 Diabetes. In Advances in Experimental Medicine and Biology; Springer: Berlin/Heidelberg, Germany, 2020; Volume 1228, pp. 91–105. [Google Scholar]
- McDowell, C.P.; Dishman, R.K.; Gordon, B.R.; Herring, M.P. Physical Activity and Anxiety: A Systematic Review and Meta-Analysis of Prospective Cohort Studies. Am. J. Prev. Med. 2019, 57, 545–556. [Google Scholar] [CrossRef]
- Schuch, F.B.; Vancampfort, D.; Firth, J.; Rosenbaum, S.; Ward, P.B.; Silva, E.S.; Hallgren, M.; De Leon, A.P.; Dunn, A.L.; Deslandes, A.C.; et al. Physical Activity and Incident Depression: A Meta-Analysis of Prospective Cohort Studies. Am. J. Psychiatry 2018, 175, 631–648. [Google Scholar] [CrossRef]
- O’Neill, A.; O’Sullivan, K.; McCreesh, K. Lower Levels of Physical Activity Are Associated with Pain Progression in Older Adults, a Longitudinal Study. Eur. J. Pain 2021, 25, 1462–1467. [Google Scholar] [CrossRef]
- Koolhaas, C.M.; Dhana, K.; Rooij, F.J.A.; Schoufour, J.D.; Hofman, A.; Franco, O.H. Physical Activity Types and Health-Related Quality of Life among Middle-Aged and Elderly Adults: The Rotterdam Study. J. Nutr. Health Aging 2018, 22, 246–253. [Google Scholar] [CrossRef] [PubMed]
- Lavie, C.J.; Ozemek, C.; Carbone, S.; Katzmarzyk, P.T.; Blair, S.N. Sedentary Behavior, Exercise, and Cardiovascular Health. Circ. Res. 2019, 124, 799–815. [Google Scholar] [CrossRef]
- Patel, A.V.; Friedenreich, C.M.; Moore, S.C.; Hayes, S.C.; Silver, J.K.; Campbell, K.L.; Winters-Stone, K.; Gerber, L.H.; George, S.M.; Fulton, J.E.; et al. American College of Sports Medicine Roundtable Report on Physical Activity, Sedentary Behavior, and Cancer Prevention and Control. Med. Sci. Sports Exerc. 2019, 51, 2391–2402. [Google Scholar] [CrossRef] [PubMed] [Green Version]
- Law, L.F.; Sluka, K.A. How Does Physical Activity Modulate Pain? Pain 2017, 158, 369–370. [Google Scholar] [CrossRef] [Green Version]
- Harris, M.A. The Relationship between Physical Inactivity and Mental Wellbeing: Findings from a Gamification-Based Community-Wide Physical Activity Intervention. Health Psychol. Open 2018, 5, 2055102917753853. [Google Scholar] [CrossRef] [PubMed] [Green Version]
- Bonner, W.I.A.; Weiler, R.; Orisatoki, R.; Lu, X.; Andkhoie, M.; Ramsay, D.; Yaghoubi, M.; Steeves, M.; Szafron, M.; Farag, M. Determinants of Self-Perceived Health for Canadians Aged 40 and Older and Policy Implications. Int. J. Equity Health 2017, 16, 94. [Google Scholar] [CrossRef] [Green Version]
- Cloninger, C.R.; Zohar, A.H. Personality and the Perception of Health and Happiness. J. Affect. Disord. 2011, 128, 24–32. [Google Scholar] [CrossRef]
- Machón, M.; Vergara, I.; Dorronsoro, M.; Vrotsou, K.; Larrañaga, I. Self-Perceived Health in Functionally Independent Older People: Associated Factors. BMC Geriatr. 2016, 16, 66. [Google Scholar] [CrossRef] [PubMed] [Green Version]
- Pereira-de-Sousa, A.M.; López-Rodríguez, J.A. Salud autopercibida en ancianos jóvenes españoles y portugueses tras la recesión según la Encuesta Europea de Salud: Un estudio transversal. Aten. Primaria 2021, 53, 102064. [Google Scholar] [CrossRef]
- Ministerio de Sanidad, Consumo y Bienestar Social, Gobierno de España Encuesta Nacional de Salud. 2017. Available online: https://www.sanidad.gob.es/estadEstudios/estadisticas/encuestaNacional/encuesta2017.htm (accessed on 3 March 2022).
- European Parliament and of the Council. Regulation (EU) 2016/679 of the 27 April 2016 on the Protection of Natural Persons with Regard to the Processing of Personal Data and on the Free Movement of Such Data, and Repealing Directive 95/46/EC (General Data Protection Regulation); Official Journal of the European Union: Luxembourg, 2016. [Google Scholar]
- Sanidad Consumo, M.; Social, B. Encuesta Nacional de Salud 2017 ENSE 2017: Metodología. Available online: https://www.ine.es/metodologia/t15/t153041917.pdf (accessed on 3 March 2022).
- Ministerio de Sanidad, Consumo y Bienestar Social Cuestionario de Adultos. In Encuesta Nacional de Salud de España 2017; Gobierno de España: Madrid, Spain, 2019.
- Tenforde, M.W.; Kim, S.S.; Lindsell, C.J.; Billig Rose, E.; Shapiro, N.I.; Files, D.C.; Gibbs, K.W.; Erickson, H.L.; Steingrub, J.S.; Smithline, H.A.; et al. Symptom Duration and Risk Factors for Delayed Return to Usual Health Among Outpatients with COVID-19 in a Multistate Health Care Systems Network—United States, March–June 2020. MMWR Morb. Mortal. Wkly. Rep. 2020, 69, 993–998. [Google Scholar] [CrossRef]
- Denche-Zamorano, Á.; Franco-García, J.M.; Carlos-Vivas, J.; Mendoza-Muñoz, M.; Pereira-Payo, D.; Pastor-Cisneros, R.; Merellano-Navarro, E.; Adsuar, J.C. Increased Risks of Mental Disorders: Youth with Inactive Physical Activity. Healthcare 2022, 10, 237. [Google Scholar] [CrossRef]
- Galán-Arroyo, C.; Pereira-Payo, D.; Rojo-Ramos, J.; Hernández-Mocholí, M.A.; Merellano-Navarro, E.; Pérez-Gómez, J.; Denche-Zamorano, Á.; Adsuar, J.C. Increased Odds for Depression and Antidepressant Use in the Inactive Spanish Population. Int. J. Environ. Res. Public Health 2022, 19, 2829. [Google Scholar] [CrossRef] [PubMed]
- Nes, B.M.; Janszky, I.; Vatten, L.J.; Nilsen, T.I.L.; Aspenes, S.T.; WislØff, U. Estimating VO2peak from a Nonexercise Prediction Model: The HUNT Study, Norway. Med. Sci. Sports Exerc. 2011, 43, 2024–2030. [Google Scholar] [CrossRef] [PubMed]
- Craig, C.L.; Marshall, A.L.; Sjöström, M.; Bauman, A.E.; Booth, M.L.; Ainsworth, B.E.; Pratt, M.; Ekelund, U.L.; Yngve, A.; Sallis, J.F.; et al. International Physical Activity Questionnaire: 12-Country Reliability and Validity. Med. Sci. Sports Exerc. 2003, 35, 1381–1395. [Google Scholar] [CrossRef] [PubMed] [Green Version]
- Gómez-Mármol, A.; Nicolás, M.M. Estudio de las dimensiones de la salud autopercibida en mujeres adultas. Rev. Esp. Comun. Salud 2013, 4, 93–103. [Google Scholar]
- Morcillo Cebolla, V.; de Lorenzo-Cáceres Ascanio, A.; Domínguez Ruiz de León, P.; Rodríguez Barrientos, R.; Torijano Castillo, M.J. Desigualdades en la salud autopercibida de la población española mayor de 65 años. Gac. Sanit. 2014, 28, 511–521. [Google Scholar] [CrossRef] [Green Version]
- Vela, Y.W. Presencia de Vulnerabilidad al Estrés e Impacto en la Salud Auto percibida: Un Estudio Comparativo entre Hombres y Mujeres. Rev. Electrón. Cienc. Soc. Humanid. Apoyadas Tecnol. 2014, 3, 47–56. [Google Scholar]
- Shooshtari, S. Determinants of Self-Perceived Health. Health Rep. 2001, 13, 19. [Google Scholar]
- Hanson, S.; Jones, A. Is There Evidence That Walking Groups Have Health Benefits? A Systematic Review and Meta-Analysis. Br. J. Sports Med. 2015, 49, 710–715. [Google Scholar] [CrossRef] [Green Version]
- Rodriguez-Hernandez, M.G.; Wadsworth, D.W. The Effect of 2 Walking Programs on Aerobic Fitness, Body Composition, and Physical Activity in Sedentary Office Employees. PLoS ONE 2019, 14, e0210447. [Google Scholar] [CrossRef] [PubMed] [Green Version]
- Song, C.; Ikei, H.; Park, B.J.; Lee, J.; Kagawa, T.; Miyazaki, Y. Psychological Benefits of Walking through Forest Areas. Int. J. Environ. Res. Public Health 2018, 15, 2804. [Google Scholar] [CrossRef] [PubMed] [Green Version]
- Chiang, T.L.; Chen, C.; Hsu, C.H.; Lin, Y.C.; Wu, H.J. Is the Goal of 12,000 Steps per Day Sufficient for Improving Body Composition and Metabolic Syndrome? The Necessity of Combining Exercise Intensity: A Randomized Controlled Trial. BMC Public Health 2019, 19, 1215. [Google Scholar] [CrossRef] [PubMed] [Green Version]
- Gebel, K.; Ding, D.; Chey, T.; Stamatakis, E.; Brown, W.J.; Bauman, A.E. Effect of Moderate to Vigorous Physical Activity on All-Cause Mortality in Middle-Aged and Older Australians. JAMA Intern. Med. 2015, 175, 970–977. [Google Scholar] [CrossRef]
- O’Brien, M.W.; Kimmerly, D.S.; Mekari, S. Greater Habitual Moderate-to-Vigorous Physical Activity Is Associated with Better Executive Function and Higher Prefrontal Oxygenation in Older Adults. GeroScience 2021, 43, 2707–2718. [Google Scholar] [CrossRef]
- Pharr, J.R.; Lough, N.L.; Terencio, A.M. Sociodemographic Determinants of Physical Activity and Sport Participation among Women in the United States. Sports 2020, 8, 96. [Google Scholar] [CrossRef]
- Edwards, E.S.; Sackett, S.C. Psychosocial Variables Related to Why Women Are Less Active than Men and Related Health Implications. Clin. Med. Insights Women’s Health 2016, 9 (Suppl. 1), 34668. [Google Scholar] [CrossRef] [Green Version]
- Nienhuis, C.P.; Lesser, I.A. The Impact of COVID-19 on Women’s Physical Activity Behavior and Mental Well-Being. Int. J. Environ. Res. Public Health 2020, 17, 9036. [Google Scholar] [CrossRef]
- Suryadinata, R.V.; Wirjatmadi, B.; Adriani, M.; Lorensia, A. Effect of Age and Weight on Physical Activity. J. Public Health Res. 2020, 9, 187–190. [Google Scholar] [CrossRef]
- Alley, S.J.; Schoeppe, S.; Rebar, A.L.; Hayman, M.; Vandelanotte, C. Age differences in physical activity intentions and implementation intention preferences. J. Behav. Med. 2018, 41, 406–415. [Google Scholar] [CrossRef]
- Giacomozzi, C.; Palmieri, L.; Gargiulo, L.; Noce, C.L.; Iannucci, L.; Di Lonardo, A.; Vannucchi, S.; Onder, G.; Colivicchi, F.; Giampaoli, S.; et al. The Perceived Health Status from Young Adults to Elderly: Results of the Mehm Questionnaire within the Cuore Project Survey 2008–2012. Int. J. Environ. Res. Public Health 2020, 17, 6160. [Google Scholar] [CrossRef] [PubMed]
- Padilla-Moledo, C.; Fernández-Santos, J.D.R.; Izquierdo-Gómez, R.; Esteban-Cornejo, I.; Rio-Cozar, P.; Carbonell-Baeza, A.; Castro-Piñero, J. Physical Fitness and Self-Rated Health in Children and Adolescents: Cross-Sectional and Longitudinal Study. Int. J. Environ. Res. Public Health 2020, 17, 2413. [Google Scholar] [CrossRef] [PubMed]
- Cui, Y.; Sweeney, E.; Forbes, C.; DeClercq, V.; Grandy, S.A.; Keats, M.; Parker, L.; Yu, Z.M.; Dummer, T.J.B. The Association between Physical Activity and Self-Rated Health in Atlantic Canadians. J. Women Aging 2021, 33, 596–610. [Google Scholar] [CrossRef] [PubMed]
- Trachte, F.; Geyer, S.; Sperlich, S. Impact of Physical Activity on Self-Rated Health in Older People: Do the Effects Vary by Socioeconomic Status? J. Public Health 2016, 38, 754–759. [Google Scholar] [CrossRef] [Green Version]
- Kaleta, D.; Makowiec-Dąbrowska, T.; Dziankowska-Zaborszczyk, E.; Jegier, A. Physical Activity and Self-Perceived Health Status. Int. J. Occup. Med. Environ. Health 2006, 19, 61. [Google Scholar] [CrossRef] [PubMed] [Green Version]
- Okano, G.; Miyake, H.; Mori, M. Leisure Time Physical Activity as a Determinant of Self-Perceived Health and Fitness in Middle-Aged Male Employees. J. Occup. Health 2003, 45, 286–292. [Google Scholar] [CrossRef] [Green Version]
- Moral-García, J.E.; Agraso-López, A.D.; Ramos-Morcillo, A.J.; Jiménez, A.; Jiménez-Eguizábal, A. The Influence of Physical Activity, Diet, Weight Status and Substance Abuse on Students’ Self-Perceived Health. Int. J. Environ. Res. Public Health 2020, 17, 1387. [Google Scholar] [CrossRef] [Green Version]
- Tison, G.H.; Avram, R.; Kuhar, P.; Abreau, S.; Marcus, G.M.; Pletcher, M.J.; Olgin, J.E. Worldwide Effect of COVID-19 on Physical Activity: A Descriptive Study. Ann. Intern. Med. 2020, 173, 767–770. [Google Scholar] [CrossRef]
- López, J.; Pérez-Rojo, G.; Noriega, C.; Velasco, C.; Carretero, I.; López-Frutos, P.; Galarraga, L. Las Respuestas al Confinamiento Por La Pandemia de La COVID-19 Desde Una Perspectiva Emocional: La Función Familiar Como Patrón Diferencial En Las Personas Mayores. Behav. Psychol. Conduct. 2021, 29, 331–344. [Google Scholar] [CrossRef]
- Amini, H.; Isanejad, A.; Chamani, N.; Movahedi-Fard, F.; Salimi, F.; Moezi, M.; Habibi, S. Physical Activity during COVID-19 Pandemic in the Iranian Population: A Brief Report. Heliyon 2020, 6, e05411. [Google Scholar] [CrossRef]
- Dunton, G.F.; Do, B.; Wang, S.D. Early Effects of the COVID-19 Pandemic on Physical Activity and Sedentary Behavior in Children Living in the US. BMC Public Health 2020, 20, 1351. [Google Scholar] [CrossRef] [PubMed]
- Martinez, E.Z.; Silva, F.M.; Morigi, T.Z.; Zucoloto, M.L.; Silva, T.L.; Joaquim, A.G.; Dall’Agnol, G.; Galdino, G.; Martinez, M.O.Z.; Silva, W.R. da Physical Activity in Periods of Social Distancing Due to COVID-19: A Cross-Sectional Survey. Ciênc. Saúde Coletiva 2020, 25, 4157–4168. [Google Scholar] [CrossRef]
- Buneviciene, I.; Bunevicius, R.; Bagdonas, S.; Bunevicius, A. The Impact of Pre-Existing Conditions and Perceived Health Status on Mental Health during the COVID-19 Pandemic. J. Public Health 2022, 44, e88–e95. [Google Scholar] [CrossRef] [PubMed]
- Becerra-Canales, B.; Ybaseta-Medina, J. Salud Autopercibida En Trabajadores de Enfermería Del Primer Nivel de Atención Durnate La Pandemia de COVID-19. Rev. Med. Panacea 2020, 9, 113–117. [Google Scholar]
- Stanton, R.; To, Q.G.; Khalesi, S.; Williams, S.L.; Alley, S.J.; Thwaite, T.L.; Fenning, A.S.; Vandelanotte, C. Depression, Anxiety and Stress during COVID-19: Associations with Changes in Physical Activity, Sleep, Tobacco and Alcohol Use in Australian Adults. Int. J. Environ. Res. Public Health 2020, 17, 4065. [Google Scholar] [CrossRef] [PubMed]
- Cheval, B.; Sivaramakrishnan, H.; Maltagliati, S.; Fessler, L.; Forestier, C.; Sarrazin, P.; Orsholits, D.; Chalabaev, A.; Sander, D.; Ntoumanis, N.; et al. Relationships between Changes in Self-Reported Physical Activity, Sedentary Behaviour and Health during the Coronavirus (COVID-19) Pandemic in France and Switzerland. J. Sports Sci. 2021, 39, 699–704. [Google Scholar] [CrossRef]
- Findlay, L.; Arim, R. Canadians Report Lower Self-Perceived Mental Health during the COVID-19 Pandemic. Health Rep. 2020, 31, 2–27. [Google Scholar] [CrossRef]
- Broche-Pérez, Y.; Fernández-Fleites, Z.; Fernández-Castillo, E.; Jiménez-Puig, E.; Vizcaíno-Escobar, A.E.; Ferrer-Lozano, D.M.; Martínez-Rodríguez, L.; Martín-González, R. Anxiety, Health Self-Perception, and Worry About the Resurgence of COVID-19 Predict Fear Reactions Among Genders in the Cuban Population. Front. Glob. Womens Health 2021, 2, 634088. [Google Scholar] [CrossRef]
- Cabona, C.; Ferraro, P.M.; Meo, G.; Roccatagliata, L.; Schenone, A.; Inglese, M.; Villani, F.; Caponnetto, C. Predictors of Self-Perceived Health Worsening over COVID-19 Emergency in ALS. Neurol. Sci. 2021, 42, 1231–1236. [Google Scholar] [CrossRef]
- Ruiz-Frutos, C.; Palomino-Baldeón, J.C.; Ortega-Moreno, M.; Villavicencio-Guardia, M.d.C.; Dias, A.; Bernardes, J.M.; Gómez-Salgado, J. Effects of the COVID-19 Pandemic on Mental Health in Peru: Psychological Distress. Healthcare 2021, 9, 691. [Google Scholar] [CrossRef]
- Árbol, J.R.; Ruiz-Osta, A.; Montoro Aguilar, C.I.M. Personality Traits, Cognitive Styles, Coping Strategies, and Psychological Impact of the COVID-19 Pandemic Lockdown on Healthy Youngsters. Behav. Sci. 2021, 12, 5. [Google Scholar] [CrossRef] [PubMed]
- Puccinelli, P.J.; da Costa, T.S.; Seffrin, A.; de Lira, C.A.B.; Vancini, R.L.; Nikolaidis, P.T.; Knechtle, B.; Rosemann, T.; Hill, L.; Andrade, M.S. Reduced Level of Physical Activity during COVID-19 Pandemic Is Associated with Depression and Anxiety Levels: An Internet-Based Survey. BMC Public Health 2021, 21, 425. [Google Scholar] [CrossRef]
- López-Sánchez, G.F.; López-Bueno, R.; Gil-Salmerón, A.; Zauder, R.; Skalska, M.; Jastrzębska, J.; Jastrzębski, Z.; Schuch, F.B.; Grabovac, I.; Tully, M.A.; et al. Comparison of Physical Activity Levels in Spanish Adults with Chronic Conditions before and during COVID-19 Quarantine. Eur. J. Public Health 2021, 31, 161–166. [Google Scholar] [CrossRef] [PubMed]
- Wilke, J.; Mohr, L.; Tenforde, A.S.; Edouard, P.; Fossati, C.; González-Gross, M.; Sánchez Ramírez, C.; Laiño, F.; Tan, B.; Pillay, J.D.; et al. A Pandemic within the Pandemic? Physical Activity Levels Substantially Decreased in Countries Affected by COVID-19. Int. J. Environ. Res. Public Health 2021, 18, 2235. [Google Scholar] [CrossRef] [PubMed]
- Stockwell, S.; Trott, M.; Tully, M.; Shin, J.; Barnett, Y.; Butler, L.; McDermott, D.; Schuch, F.; Smith, L. Changes in Physical Activity and Sedentary Behaviours from before to during the COVID-19 Pandemic Lockdown: A Systematic Review. BMJ Open Sport Exerc. Med. 2021, 7, e000960. [Google Scholar] [CrossRef] [PubMed]
- An, K.Y. Comparison between Walking and Moderate-to-Vigorous Physical Activity: Associations with Metabolic Syndrome Components in Korean Older Adults. Epidemiol. Health 2021, 42, e2020066. [Google Scholar] [CrossRef]
- Reyes Rincón, H.; Campos Uscanga, Y. Beneficios de la actividad física en espacios naturales sobre la salud del adulto mayor. ENE Rev. Enferm. 2020, 14, 2. [Google Scholar] [CrossRef]
- Bronikowska, M.; Bronikowski, M.; Schott, N. “You Think You Are Too Old to Play?” Playing Games and Aging. Hum. Mov. 2011, 12, 24–30. [Google Scholar] [CrossRef]

| Ages (Years) | Total = 17,777 | Men = 8529 | Women = 9248 | p |
|---|---|---|---|---|
| Median (IQR) | 47 (21) | 47 (21) | 47 (21) | 0.295 |
| Mean (SD) | 45.8 (14.1) | 45.7 (14.1) | 46.0 (14.1) | |
| Age Group (years) | Total n (%) | Men n (%) | Women n (%) | p * |
| 15–34 | 3894 (21.9) | 1864 (21.9) | 2030 (22.0) | 0.260 |
| 35–49 | 6195 (34.8) | 3007 (35.3) | 3188 (34.5) | |
| 50–64 | 5977 (33.6) | 2874 (33.7) | 3103 (33.6) | |
| 65–69 | 1711 (9.6) | 784 (9.2) | 927 (10.0) | |
| Self-perceived health | Total = 17,777 n (%) | Men = 8529 n (%) | Women = 9248 n (%) | |
| Very bad | 263 (1.5) | 97 (1.1) | 166 (1.8) b | <0.001 |
| Bad | 896 (5.0) | 392 (4.6) | 504 (5.4) b | |
| Fair | 3462 (19.5) | 1457 (17.1) | 2005 (21.7) b | |
| Good | 9252 (52.0) | 4584 (53.7) | 4668 (50.5) b | |
| Very good | 3904 (22.0) | 1999 (23.4) | 1905 (20.6) b | |
| PAL | Total = 17,717 n (%) | Men = 8489 n (%) | Women = 9228 n (%) | |
| Inactive | 2533 (14.3) | 1175 (13.8) | 1358 (14.7) | <0.001 |
| Walkers | 8067 (45.5) | 3390 (39.9) | 4667 (50.7)) b | |
| Low | 2433 (13.7) | 1120 (13.2) | 1313 (14.2) b | |
| Medium | 2456 (13.9) | 1341 (15.8) | 1115 (12.1) b | |
| High | 1472 (8.3) | 954 (11.2) | 518 (5.6) b | |
| Very high | 756 (4.3) | 509 (6.0) | 247 (2.7) b |
| PAL | 15–34 Years n (%) | 35–49 Years n (%) | 50–64 Years n (%) | 65–69 Years n (%) | p |
|---|---|---|---|---|---|
| Inactive (n = 2533) | 472 (12.2) | 935 (15.1) | 878 (14.7) | 248 (14.5) | <0.001 |
| Walkers (n = 8067) | 1385 (35.8) | 2565 (41.5) | 3124 (52.5) | 993 (58.0) | |
| Low (n = 2433) | 572 (14.8) | 970 (15.7) | 696 (11.7) | 195 (11.4) | |
| Medium (n = 2456) | 637 (16.4) | 881 (14.3) | 743 (12.5) | 195 (11.4) | |
| High (n = 1472) | 560 (14.5) | 554 (9.0) | 306 (5.1) | 52 (3.0) | |
| Very high (n = 756) | 247 (6.4) | 272 (4.4) | 209 (3.5) | 28 (1.6) | |
| Total (n = 17717) | 3873 | 6177 | 5956 | 1711 |
| Self-Perceived Health: General Population | ||||||
|---|---|---|---|---|---|---|
| PAL | Very bad n (%) | Bad n (%) | Fair n (%) | Good n (%) | Very Good n (%) | p |
| Inactive (n = 2533) | 120 (4.7) | 275 (10.9) | 603 (23.8) | 1202 (45.5) | 333 (13.1) | <0.001 |
| Walkers (n = 8067) | 110 (1.4) | 460 (5.7) | 1861 (23.1) | 4257 (52.8) | 1379 (17.1) | |
| Low (n = 2433) | 11 (0.5) | 80 (3.3) | 399 (16.4) | 1353 (55.6) | 590 (24.2) | |
| Medium (n = 2456) | 12 (0.5) | 44 (1.8) | 363 (14.8) | 1340 (54.6) | 697 (28.4) | |
| High (n = 1472) | 6 (0.4) | 19 (1.3) | 148 (10.1) | 719 (48.8) | 580 (39.4) | |
| Very high (n = 756) | 4 (0.5) | 17 (2.2) | 78 (10.3) | 353 (46.7) | 304 (40.2) | |
| TOTAL (n = 17,717) | 263 | 895 | 3452 | 9224 | 3883 | |
| Self-Perceived Health: Women | ||||||
| PAL | Very bad n(%) | Bad n(%) | Fair n(%) | Good n(%) | Very Good n(%) | |
| Inactive (n = 1358) | 71 (5.2) | 152 (11.2) | 360 (26.5) | 599 (44.1) | 176 (13.0) | <0.001 |
| Walkers (n = 4677) | 80 (1.7) | 258 (5.5) | 1112 (23.8) | 2402 (51.4) | 825 (17.6) | |
| Low (n = 1313) | 7 (0.5) | 57 (4.3) | 248 (18.9) | 699 (53.2) | 302 (23.0) | |
| Medium (n = 1115) | 3 (0.3) | 23 (2.1) | 180 (16.1) | 596 (53.5) | 313 (28.1) | |
| High (n = 518) | 4 (0.8) | 5 (1.0) | 62 (12.0) | 257 (49.6) | 190 (36.7) | |
| Very high (n = 247) | 1 (0.4) | 9 (3.6) | 38 (15.4) | 107 (43.3) | 92 (37.2) | |
| TOTAL (n = 9228) | 166 | 504 | 2000 | 4660 | 1898 | |
| Self-Perceived Health: Men | ||||||
| PAL | Very bad n(%) | Bad n(%) | Fair n(%) | Good n(%) | Very Good n(%) | |
| Inactive (n = 1175) | 49 (4.2) | 123 (10.5) | 243 (20.7) | 603 (51.3) | 157 (13.4) | <0.001 |
| Walkers (n = 3390) | 30 (0.9) | 202 (6.0) | 749 (22.1) | 1855 (54.7) | 554 (16.3) | |
| Low (n = 1120) | 4 (0.4) | 23 (2.1) | 151 (13.5) | 654 (58.4) | 288 (25.7) | |
| Medium (n = 1341) | 9 (0.7) | 21 (1.6) | 183 (13.6) | 744 (55.5) | 384 (28.6) | |
| High (n = 954) | 2 (0.2) | 14 (1.5) | 86 (9.0) | 462 (48.4) | 390 (40.9) | |
| Very high (n = 509) | 3 (0.6) | 8 (1.6) | 40 (7.9) | 246 (48.3) | 212 (41.7) | |
| TOTAL (n = 8489) | 97 | 391 | 1452 | 4564 | 1985 | |
| Self-Perceived Health: Very Bad | ||||||
|---|---|---|---|---|---|---|
| PAL | OR | CI 95% | RR | CI 95% | p | |
| Inactives | Walkers | 3.60 | 2.77–4.68 | 3.48 | 2.69–4.48 | <0.001 |
| Low | 10.95 | 5.89–20.35 | 10.48 | 5.67–19.38 | <0.001 | |
| Medium | 10.13 | 5.58–18.38 | 9.70 | 5.37–17.51 | <0.001 | |
| High | 12.15 | 5.34–27.66 | 11.62 | 5.13–26.32 | <0.001 | |
| Very high | 9.35 | 3.44–25.40 | 8.95 | 3.32–24.17 | <0.001 | |
| Walkers | Low | 3.04 | 1.64–5.67 | 3.02 | 1.63–5.60 | <0.001 |
| Medium | 2.82 | 1.55–5.12 | 2.79 | 1.54–5.06 | <0.001 | |
| High | 3.38 | 1.48–7.70 | 3.35 | 1.47–7.60 | <0.005 | |
| Very high | 2.60 | 0.96–7.07 | 2.58 | 0.95–6.97 | 0.052 | |
| Self-Perceived Health: Bad | ||||||
| PAL | OR | CI 95% | RR | CI 95% | ||
| Inactives | Walkers | 2.01 | 1.72–2.36 | 1.90 | 1.65–2.20 | <0.001 |
| Low | 3.58 | 2.78–4.63 | 3.30 | 2.59–4.21 | <0.001 | |
| Medium | 6.68 | 4.83–9.23 | 6.06 | 4.43–8.29 | <0.001 | |
| High | 9.31 | 5.82–14.90 | 8.41 | 5.31–13.33 | <0.001 | |
| Very high | 5.30 | 3.22–8.70 | 4.83 | 2.98–7.83 | <0.001 | |
| Walkers | Low | 1.78 | 1.40–2.27 | 1.73 | 1.37–2.19 | <0.001 |
| Medium | 3.32 | 2.43–4.53 | 3.18 | 2.34–4.32 | <0.001 | |
| High | 4.62 | 2.91–7.34 | 4.42 | 2.80–6.97 | <0.001 | |
| Very high | 2.63 | 1.61–4.29 | 2.54 | 1.57–4.09 | <0.001 | |
| Self-Perceived Health: Fair | ||||||
| PAL | OR | CI 95% | RR | CI 95% | ||
| Inactives | Walkers | 1.04 | 0.94–1.16 | 1.03 | 0.95–1.12 | 0.444 |
| Low | 1.59 | 1.38–1.83 | 1.45 | 1.30–1.63 | <0.001 | |
| Medium | 1.80 | 1.56–2.08 | 1.61 | 1.43–1.81 | <0.001 | |
| High | 2.80 | 2.31–3.39 | 2.37 | 2.00–2.80 | <0.001 | |
| Very high | 2.72 | 2.11–3.49 | 2.31 | 1.85–2.88 | <0.001 | |
| Walkers | Low | 1.53 | 1.36–1.72 | 1.41 | 1.28–1.55 | <0.001 |
| Medium | 1.73 | 1.53–1.96 | 1.56 | 1.41–1.73 | <0.001 | |
| High | 2.68 | 2.25–3.20 | 2.29 | 1.96–2.69 | <0.001 | |
| Very high | 2.61 | 2.05–3.31 | 2.24 | 1.81–2.77 | <0.001 | |
| PAL | ||||||
|---|---|---|---|---|---|---|
| Variables | Total | Men | Women | |||
| rho | p | rho | p | rho | p | |
| Age | −0.161 | <0.001 | −0.229 | <0.001 | −0.092 | <0.001 |
| SPH | 0.244 | <0.001 | 0.269 | <0.001 | 0.210 | <0.001 |
Publisher’s Note: MDPI stays neutral with regard to jurisdictional claims in published maps and institutional affiliations. |
© 2022 by the authors. Licensee MDPI, Basel, Switzerland. This article is an open access article distributed under the terms and conditions of the Creative Commons Attribution (CC BY) license (https://creativecommons.org/licenses/by/4.0/).
Share and Cite
Denche-Zamorano, Á.; Mendoza-Muñoz, M.; Carlos-Vivas, J.; Muñoz-Bermejo, L.; Rojo-Ramos, J.; Pastor-Cisneros, R.; Giakoni-Ramírez, F.; Godoy-Cumillaf, A.; Barrios-Fernandez, S. A Cross-Sectional Study on Self-Perceived Health and Physical Activity Level in the Spanish Population. Int. J. Environ. Res. Public Health 2022, 19, 5656. https://doi.org/10.3390/ijerph19095656
Denche-Zamorano Á, Mendoza-Muñoz M, Carlos-Vivas J, Muñoz-Bermejo L, Rojo-Ramos J, Pastor-Cisneros R, Giakoni-Ramírez F, Godoy-Cumillaf A, Barrios-Fernandez S. A Cross-Sectional Study on Self-Perceived Health and Physical Activity Level in the Spanish Population. International Journal of Environmental Research and Public Health. 2022; 19(9):5656. https://doi.org/10.3390/ijerph19095656
Chicago/Turabian StyleDenche-Zamorano, Ángel, María Mendoza-Muñoz, Jorge Carlos-Vivas, Laura Muñoz-Bermejo, Jorge Rojo-Ramos, Raquel Pastor-Cisneros, Frano Giakoni-Ramírez, Andrés Godoy-Cumillaf, and Sabina Barrios-Fernandez. 2022. "A Cross-Sectional Study on Self-Perceived Health and Physical Activity Level in the Spanish Population" International Journal of Environmental Research and Public Health 19, no. 9: 5656. https://doi.org/10.3390/ijerph19095656
APA StyleDenche-Zamorano, Á., Mendoza-Muñoz, M., Carlos-Vivas, J., Muñoz-Bermejo, L., Rojo-Ramos, J., Pastor-Cisneros, R., Giakoni-Ramírez, F., Godoy-Cumillaf, A., & Barrios-Fernandez, S. (2022). A Cross-Sectional Study on Self-Perceived Health and Physical Activity Level in the Spanish Population. International Journal of Environmental Research and Public Health, 19(9), 5656. https://doi.org/10.3390/ijerph19095656