1. Introduction
Aortic dissection (AD) is a medial rupture caused by intramural hemorrhage, which leads to the separation of the aortic wall layer, followed by the separation of the true and false lumen [
1]. AD is a dangerous cardiovascular disease with many complications and high mortality. Mortality can reach as high as 50% within 48 h of onset and 60–70% within a week [
2,
3]. Rapid diagnosis is very important for the treatment of AD.
However, the clinical manifestations of AD are complex and changeable. AD patients often lack specific symptoms and signs. Additionally, the location, lesion degree and scale of AD are different. Clinicians tend to observe the common symptoms of AD to diagnose it, such as chest pain and back pain. However, for patients without pain, atypical symptoms make the diagnosis more difficult. Thus, AD is easily missed or misdiagnosed [
4]. More than 1/3 of AD cases are missed in actual cases of AD [
5,
6,
7], and the rate at which acute aortic syndrome is missed in the emergency room is close to 80% [
8]. The rarity of AD is also one of the reasons for the high rate of missed diagnosis. The incidence of AD is about 11.9 cases per 100,000 people [
9], and the incidence of AD in the emergency room is 5.93–24.92 cases per 100,000 people [
10]. With the popularization of imaging technologies, such as computerized tomography angiography (CTA) and magnetic resonance imaging (MRI), the diagnosis rate of AD has increased significantly [
4].
In Chinese rural and remote areas, many hospitals lack medical imaging equipment. However, routine examinations are common in every hospital. Because of AD’s rarity, many clinicians in Chinese rural or remote hospitals have less experience diagnosing AD patients. Developing an AD screening model based on patients’ routine examination data could be an effective way to help clinicians identify patients at high risk of AD in the early phase and save patients’ lives.
With the rapid development of artificial intelligence, machine learning methods were adopted in the medical domain [
11,
12,
13]. Our AD screening model based on machine learning includes two parts: the construction of an AD dataset and the application of a supervised learning algorithm to build a classifier for screening AD patients.
In some disease screening models, the combination of multiple signs and symptoms promises to increase diagnostic accuracy [
14,
15]. The screening model for AD disease is the same. Due to AD disease having no specific signs and symptoms, we collected the patients’ symptoms, routine examination data, lifestyle habits and family genetic history from electrical health records in XiangYa Hospital to construct an AD dataset. T-SNE [
16] was used to visualize the distribution of the AD data.
Because of AD’s rarity, the ratio of non-AD patients to AD patients in the AD dataset was extremely high. In order to solve the problem caused by data imbalance, we developed a cluster-based ensemble learning model: Cluster Random Undersampling Smote–Tomek Bagging (CRST-Bagging) to help clinicians screen for AD patients in clinical practice. In this model, we proposed a new resampling method: CRST, which can increase the number of AD patients by oversampling algorithm Smote and decrease the number of non-AD patients by kmeans++ and undersampling algorithm Tomek-link. It reduces the imbalance between AD patients and non-AD patients, which can help improve the accuracy of the screening model. In order to demonstrate the effectiveness of the CRST-Bagging model, we compared it with other classic imbalance methods on the AD dataset. Experimental results show that the proposed model is more effective than other models, which proves the effectiveness of our model.
The main contributions of this paper are as follows:
We constructed an AD dataset based on patients’ routine examination data, lifestyle habits and family genetic history from EMRs from Xiangya Hospital. Data preprocessing and data visualization in the AD dataset were used to obtain prior knowledge of the AD data distribution to help us understand the data.
An integrated sampling method—CRST—was proposed to reduce the imbalance ratio of the AD data effectively. CRST combines the advantages of kmeans++ and the Smote–Tomek algorithm. This method not only makes the collected non-AD patients and AD patients more representative but also ensures the randomness of sampling. CRST is suitable for dealing with a highly imbalanced dataset.
The CRST-Bagging model was developed to help clinicians screen for AD patients. In the model, our proposed resampling method CRST and Bagging ensemble algorithm are combined to improve the robustness and generalization ability for AD screening.
The rest of this article is arranged as follows. In the second section, we introduced the related work. In the third section, we introduced the dataset, our CRST resampling method and the ensemble model CRST-Bagging for AD screening. In the fourth section, we presented our experimental results and evaluated the model’s performance. In the fifth section, we discussed our results and future work. Finally, the last section concludes the paper.
2. Related Work
With the accumulation of a large amount of medical data, researchers focused on using machine learning methods to help clinicians predict AD diseases based on image data. The CNN algorithm [
17] can diagnose AD through plain CT image data and has achieved good results in accuracy, sensitivity and specificity. The application of this algorithm improves the diagnosis rate of AD patients who have atypical symptoms detected by conventional CT plain scan. Harris et al. [
18] developed a CNN model based on enhanced CT image data, which can diagnose and classify AD and aortic rupture. The model recognizes the severity of the patient’s condition, so critically ill AD patients can be diagnosed first and obtain medical assistance. Cheng et al. [
19] used a U-Net framework to classify AD based on contrast-enhanced CT images. Among 1000 CT images from 20 patients, the accuracy rate reached 85.0%.
However, in actual situations, due to the lack of clinician experience or unsupported examination equipment, it is often difficult to carry out necessary imaging in time. This results in missing or misdiagnosing AD patients, which threatens patients’ lives. Therefore, researchers have worked to develop methods to screen AD patients in the early phase of their routine examination. Based on routine examination data, Huo et al. [
20] applied many machine learning algorithms, including the Bayesian network, Naive Bayes, decision tree J48 and SVM, to classify AD patients in the emergency room. Their dataset is small, only containing 492 samples: 330 patients with AD and 162 patients misdiagnosed as AD, but the goal of their study was to decrease the number of misdiagnosed non-AD patients. Different from their work, our research goal is to screen for patients at high risk of AD.
Applying a machine-learning algorithm to screen for AD disease has some problems. The rarity of AD leads to a serious imbalance in the dataset. If the traditional machine learning algorithm were applied to the AD dataset directly, the model would tend to be more biased towards the majority class. This causes a high missed diagnosis ratio. The resampling method is one of the most effective methods to solve imbalance problems. SMOTE [
21,
22] and Tomek-links [
23,
24] are excellent methods for oversampling and undersampling, respectively. However, single up-sampling or undersampling cannot deal with our extreme imbalance of large-scale AD datasets. Khushi et al. [
25] studied the problem of data imbalance on two medical datasets related to lung cancer (the imbalance ratio is 24.7 and 25.2, respectively). Twenty-three class imbalance methods were compared. The results show that the Smote–Tomek method achieved the best results because the integrated sampling method has more advantages in highly imbalanced data.
Due to the lack of special symptoms and signs of AD, it is very difficult to distinguish between AD and other cardiovascular diseases patients. This also makes it difficult for a machine-learning algorithm to determine the complicated boundaries between AD patients and non-AD patients. Algorithms combining the resampling method with the ensemble algorithm, such as RUSBoost [
26] and SMOTEBagging [
27], were used to improve the prediction ability when using an imbalanced dataset. The SMOTEBagging algorithm was applied in screening for AD patients. Liu et al. [
28] investigated the performance of several different machine learning algorithms in the screening of AD patients based on routine examination data. The SMOTEBagging algorithm performed the best in their study.
The works mentioned above provide us with ideas to develop a cluster-based ensemble learning model for aortic dissection screening. A more detailed explanation is given in
Section 3.
3. Materials and Methods
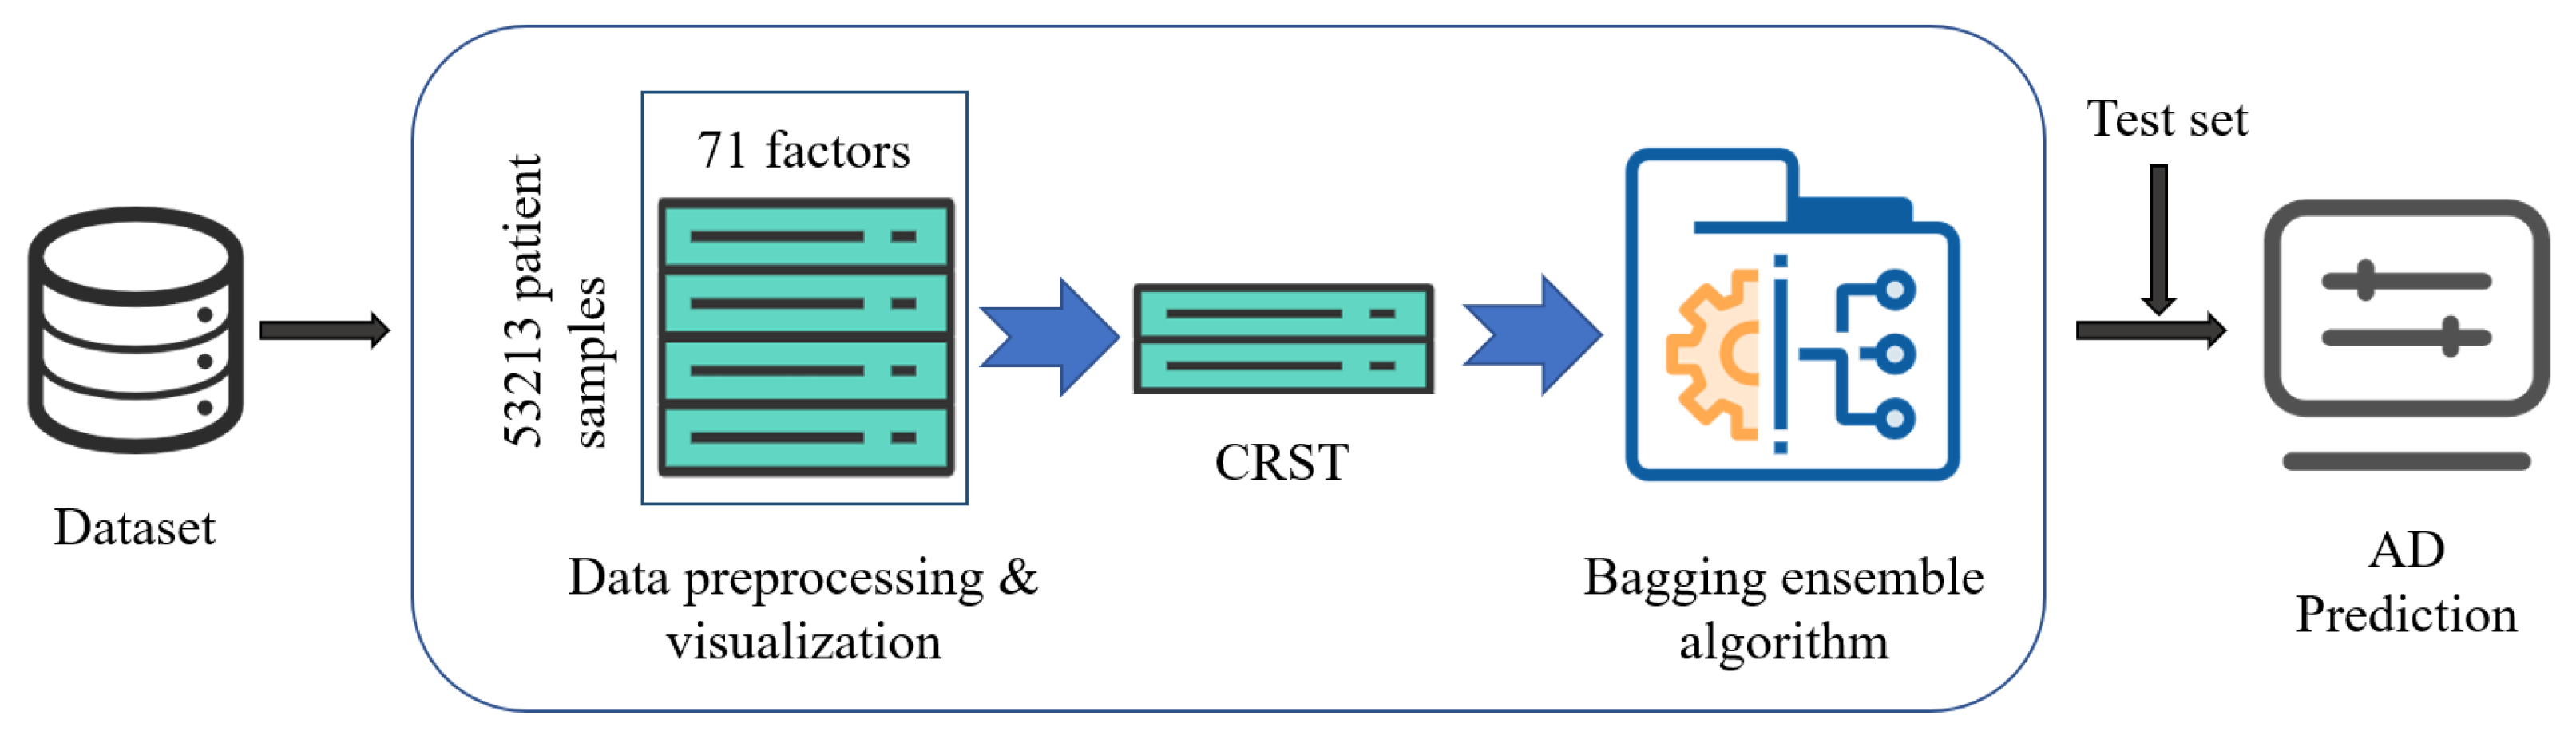
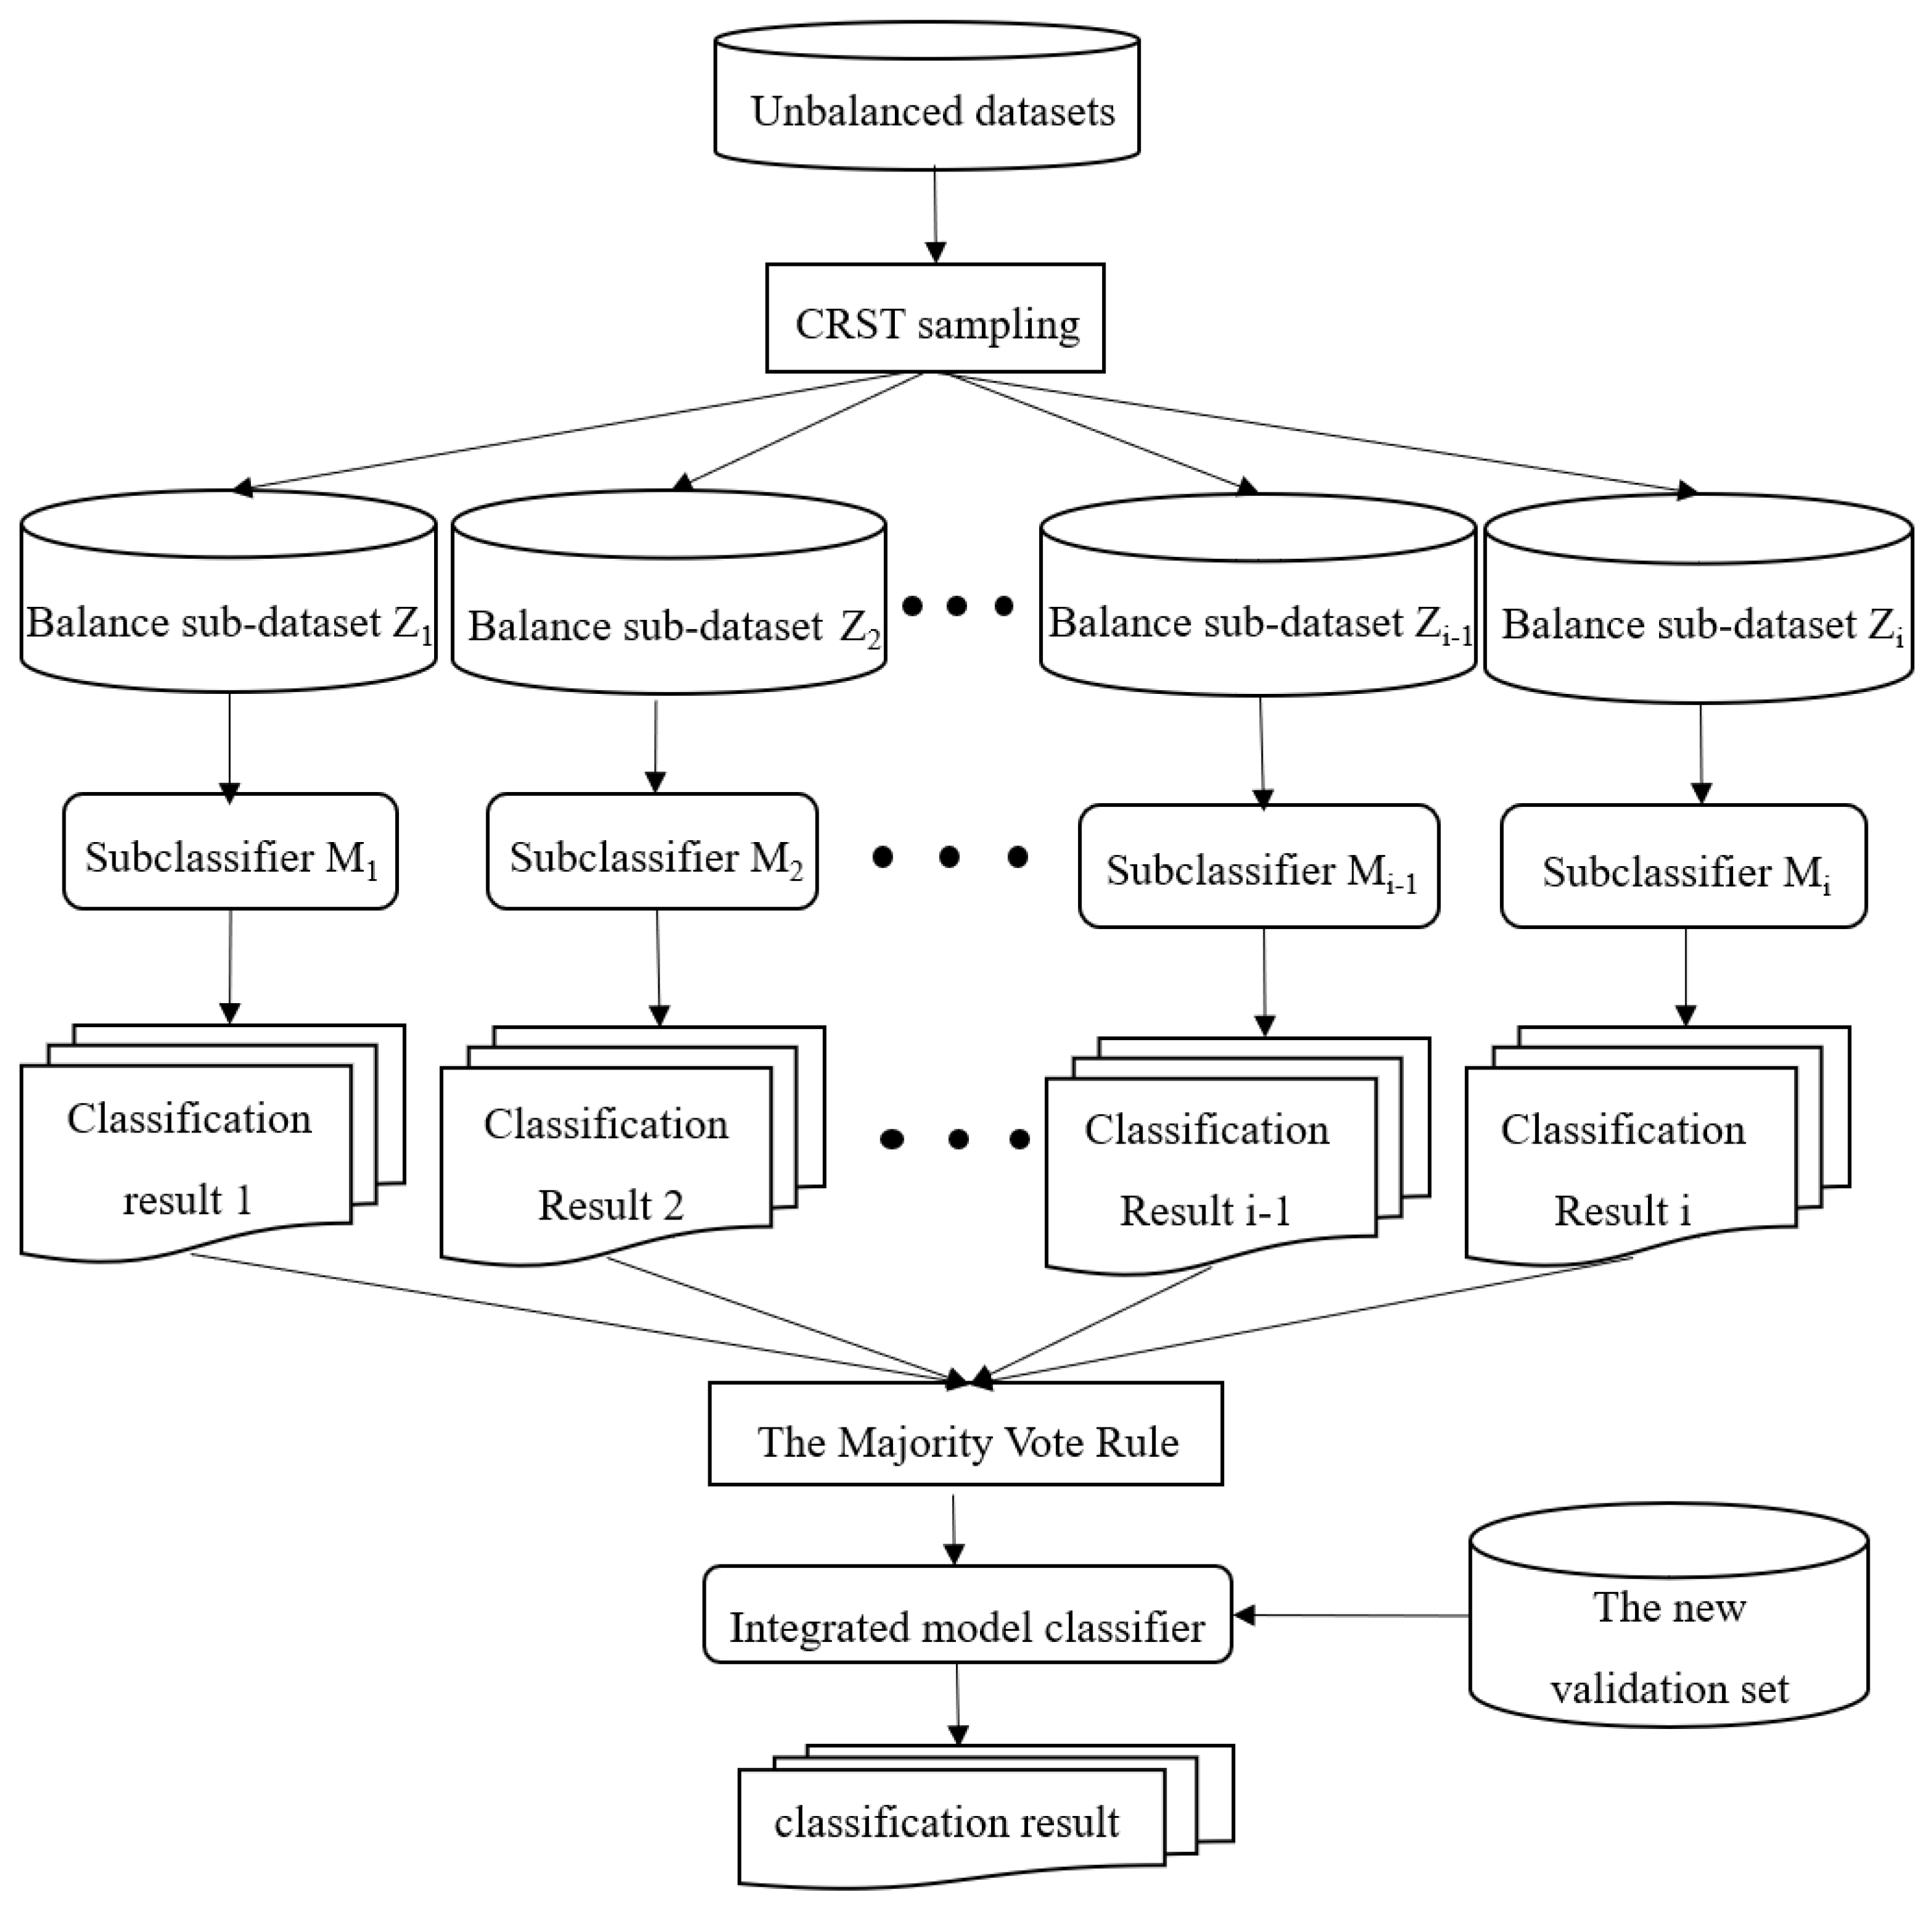
The structure of the CRST-Bagging model for AD screening is shown in
Figure 1. Data preprocessing (including missing value handling and data normalization) is carried out first. Cluster Random Undersampling Smote–Tomek (CRST) is proposed to resample the imbalanced dataset to reduce the imbalance ratio of the data. Finally, the Bagging ensemble model (CRST-Bagging) is used to construct a powerful classifier to predict AD. The methods are described in detail below.
3.1. Dataset
3.1.1. Data Overview and Visualization
Our AD dataset was created from the examination indicators of 53,213 patients, which were collected from Xiangya Hospital in Hunan Province from 2008 to 2016. The data include 802 patients with AD and 52,411 patients with other cardiovascular diseases (including viral myocarditis, myocardial infarction and coronary heart disease). The dataset has 71 features. These features were collected from electrical medical records and include the patients’ routine examination data, living habits and family genetic history. (see
Table S1 of the Supplementary Materials). The AD patients’ ages range from 18 to 89 years. The average age of the AD patients in the dataset is 56. There are 206 AD patients with chest pain. The dataset has a high imbalance ratio, with approximately 67 times more non-AD samples than AD samples.
We also used a test set to verify our model’s classification performance and generalization ability better. The test set includes the examination indicators of 235 patients from the same hospital, of which there were 83 patients with AD and 152 patients with other cardiovascular diseases; the data format is the same as the aforementioned dataset. The AD patients’ ages range from 18 to 83 years. The average age of AD patients in the test set is 58. There are 56 AD patients with chest pain.
All the AD patients in these two datasets were diagnosed by CT, MRI, CTA or aortic surgery.
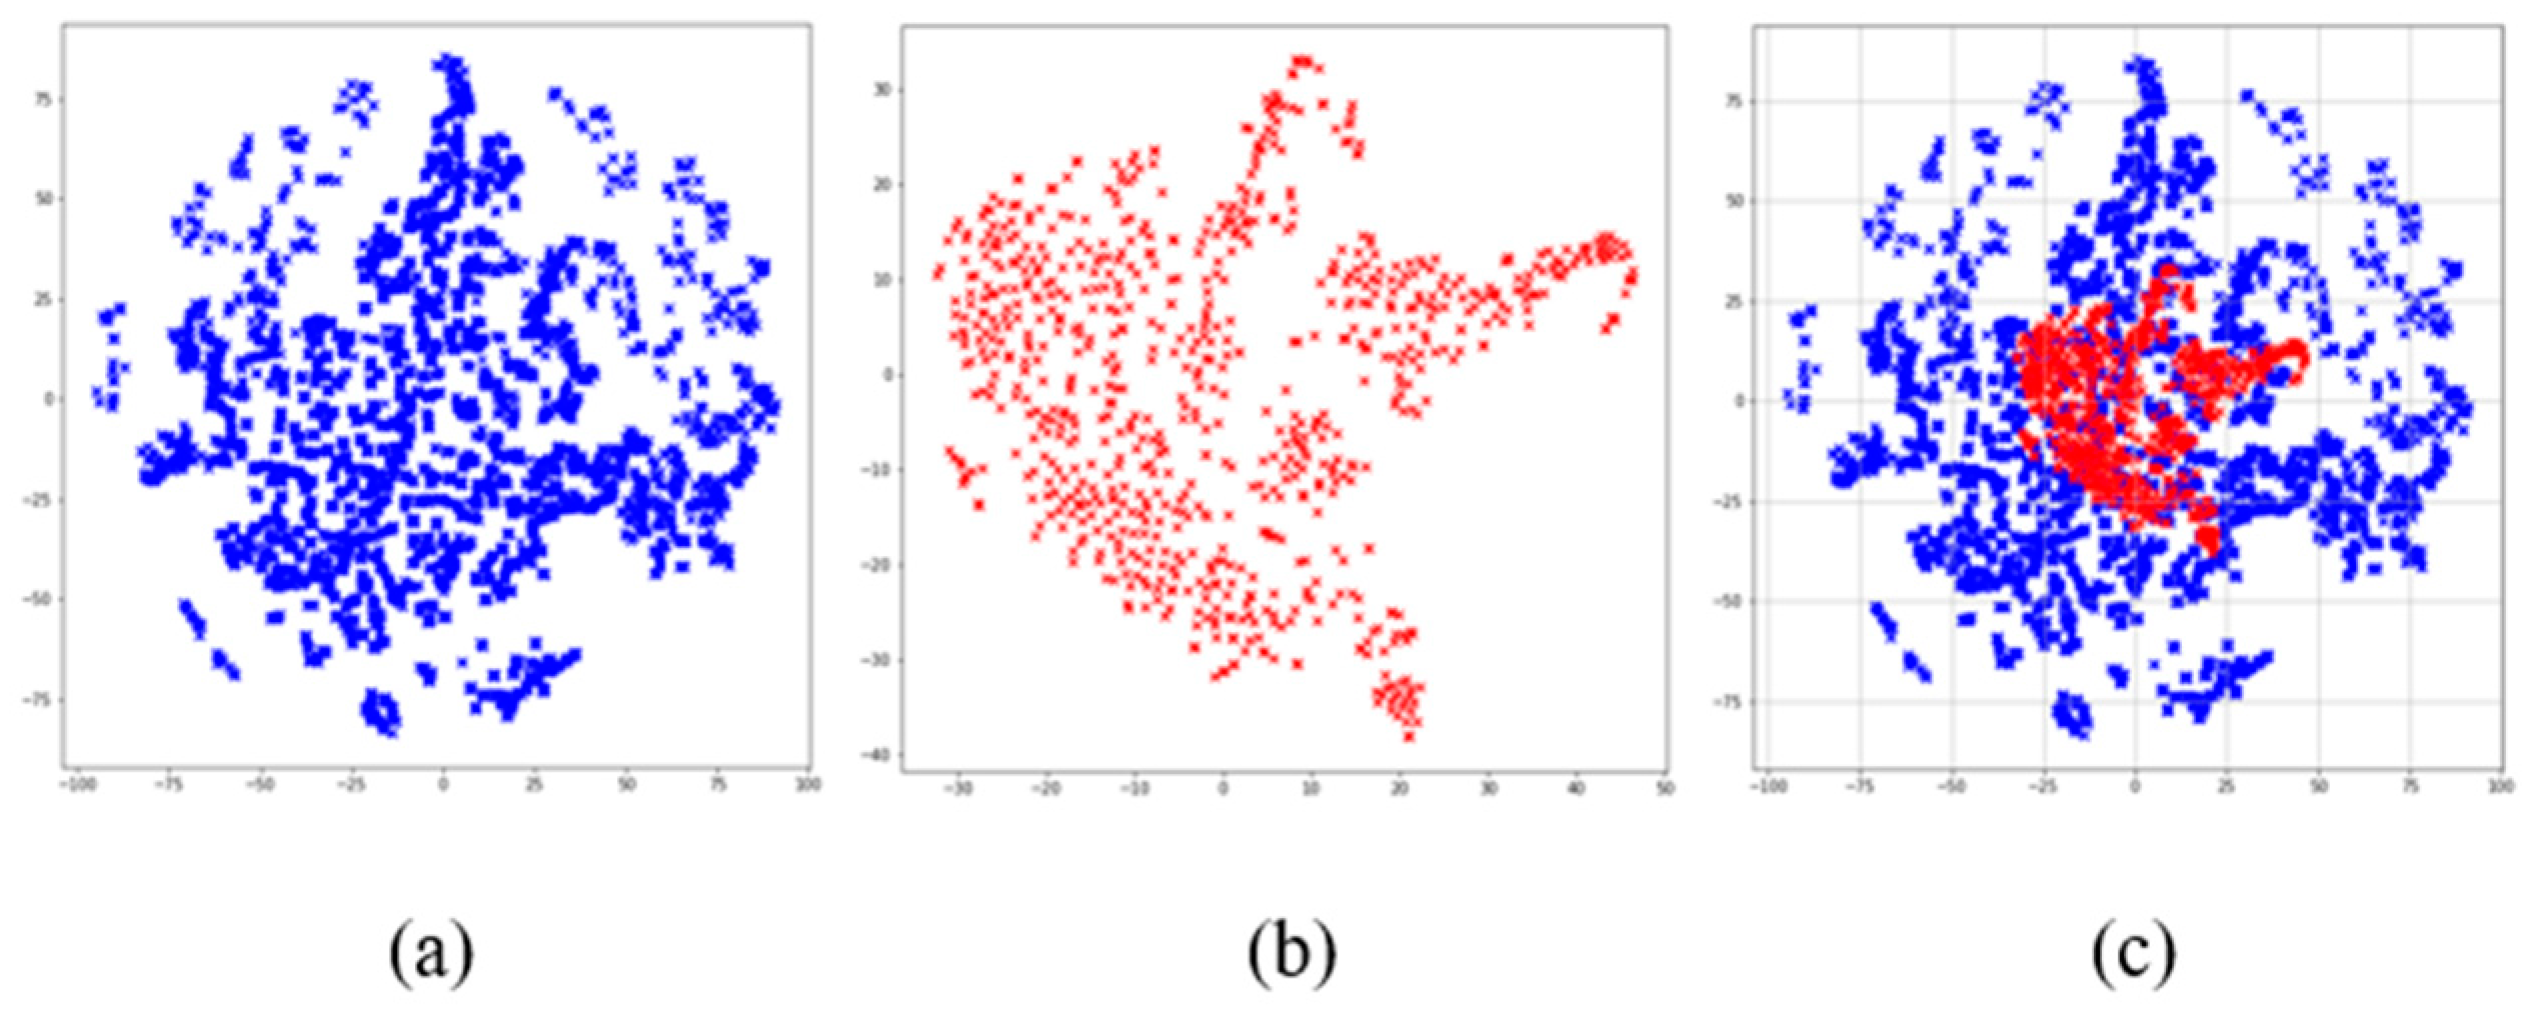
In addition, we used the t-SNE algorithm to reduce the dimensions of the dataset, which is convenient for visualizing the data. The visualization results after dimensionality reduction are shown in
Figure 2, where it can be seen that the data distribution of non-AD patients is agglomerated into many groups. This shows there is a certain similarity between some cases of non-AD patients. There is an obvious overlap between the two kinds of samples in space from the visualization of data distribution. This indicates that the boundary between AD and non-AD patients is ambiguous. Therefore, it is necessary to construct an ensemble classification model.
3.1.2. Data Preprocess
In the AD dataset, there are some non-numerical features. The features such as smoking, drinking and family inheritance are binary coded. At the same time, the years of smoking and drinking are coded according to different degrees and ranges. All the numeric data are scaled to [0, 1].
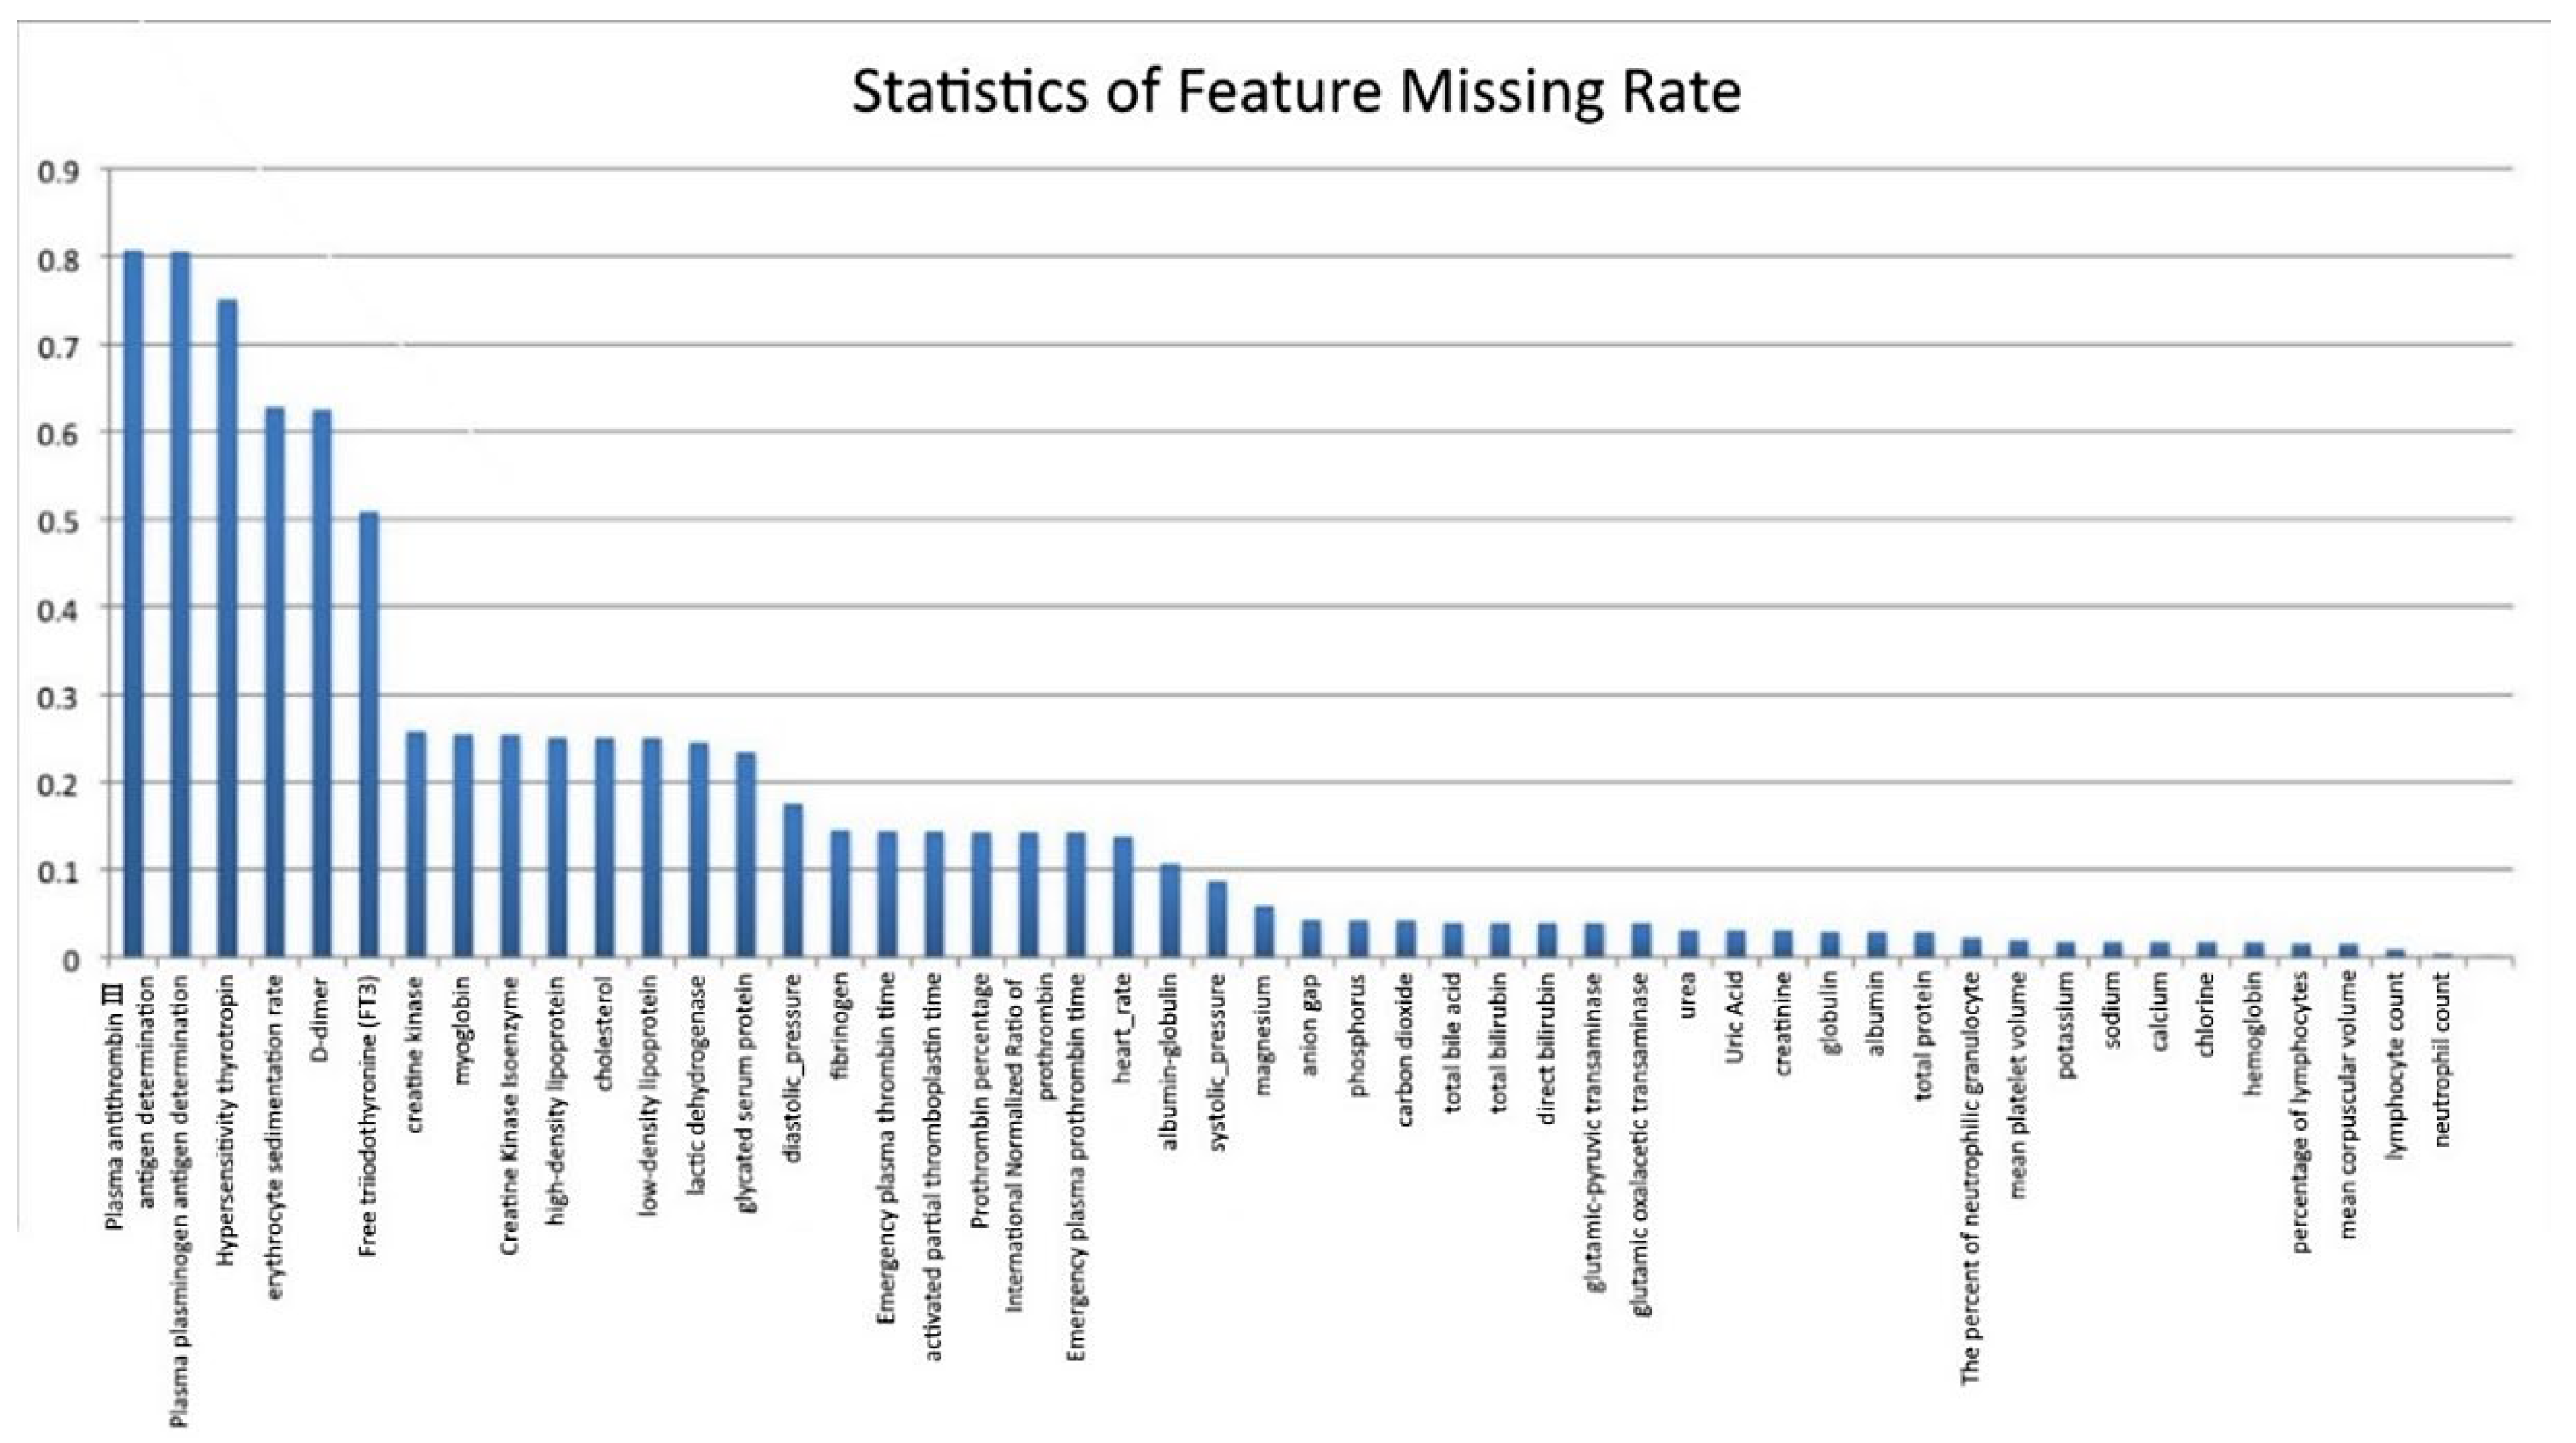
We compiled statistics on the missing rate of samples and features in the original AD dataset, as shown in
Figure 3 (the abscissa represents the features, and the ordinate represents the missing rate). Six features with a deletion rate of more than 50% were found, namely Antithrombin III antigen (AT: Ag) (missing rate is 81.5%), Plasminogen antigen (PLGAg) (missing rate is 80.7%), Hypersensitivity thyrotropin (S-TSH) (missing rate is 75.6%), erythrocyte sedimentation rate (ESR) (missing rate is 63.8%), D-dimer (missing rate is 62.6%) and free triiodothyronine (FT3) (missing rate is 51.9%).
Due to the high missing rate of the aforementioned six features, it is difficult to fill them. The general method is to delete them. However, existing medical studies have shown that D-dimer is an important feature for the clinical diagnosis of AD, so it cannot be deleted directly. Although no research has proved that the other five features play a key role in the diagnosis of AD, direct deletion causes information loss. Therefore, the XGBoost method is used to analyze feature importance [
29,
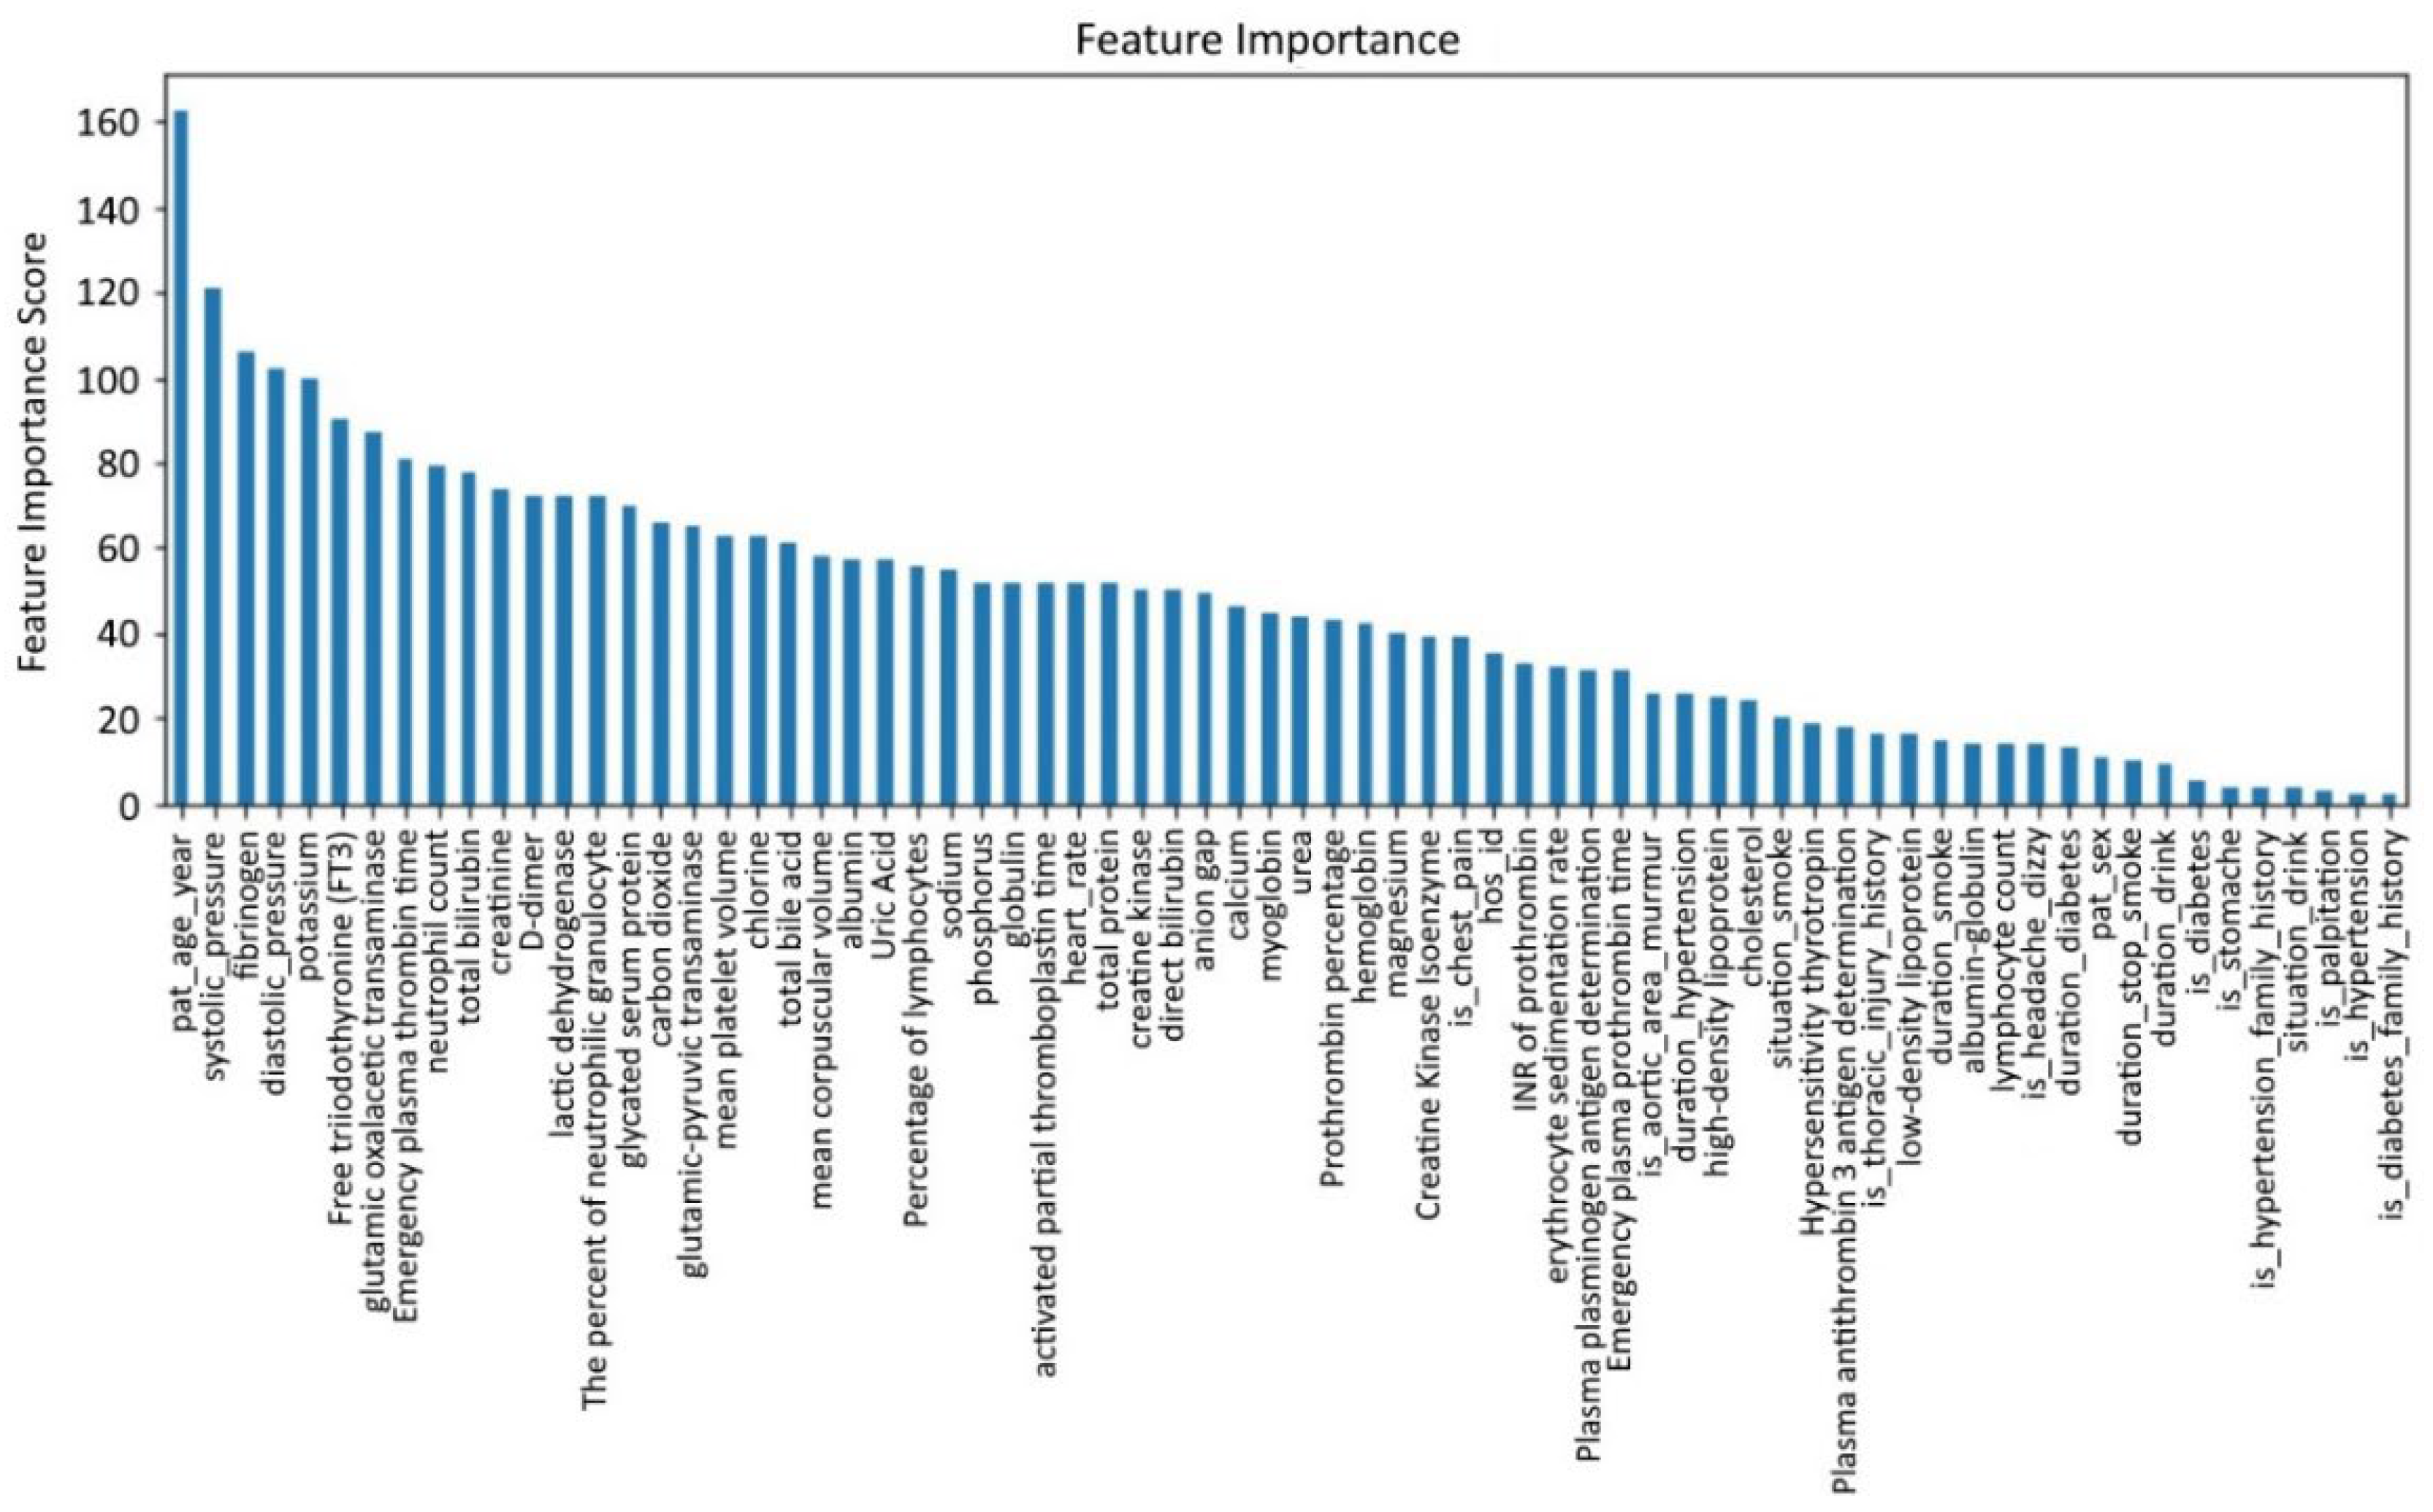
30]. The result is shown in
Figure 4, with the abscissa as a feature and the ordinate as feature importance scores.
From
Figure 4, we find that among the six features with a deletion rate greater than 50%, the feature importance scores of FT3 and D-dimer rank in the top 10, which indicates these two features are important for detecting whether a patient suffers from AD. Therefore, we only remove the four features: AT: Ag, PLGAg, S-TSH, ESR. Therefore, FT3 and D-dimer remain and are filled with features of the complete samples. The adjusted new dataset size is (5,321,367).
In this paper, the missing value was filled by the method of random filling by class. Compared with ordinary random filling, the method of random filling by class fills the positive and negative samples. The missing values of the samples were randomly filled with the non-null values of the same kind of samples. This filling method can effectively avoid the intersection of feature values.
3.2. Cluster Random Undersampling Smote–Tomek Approach (CRST)
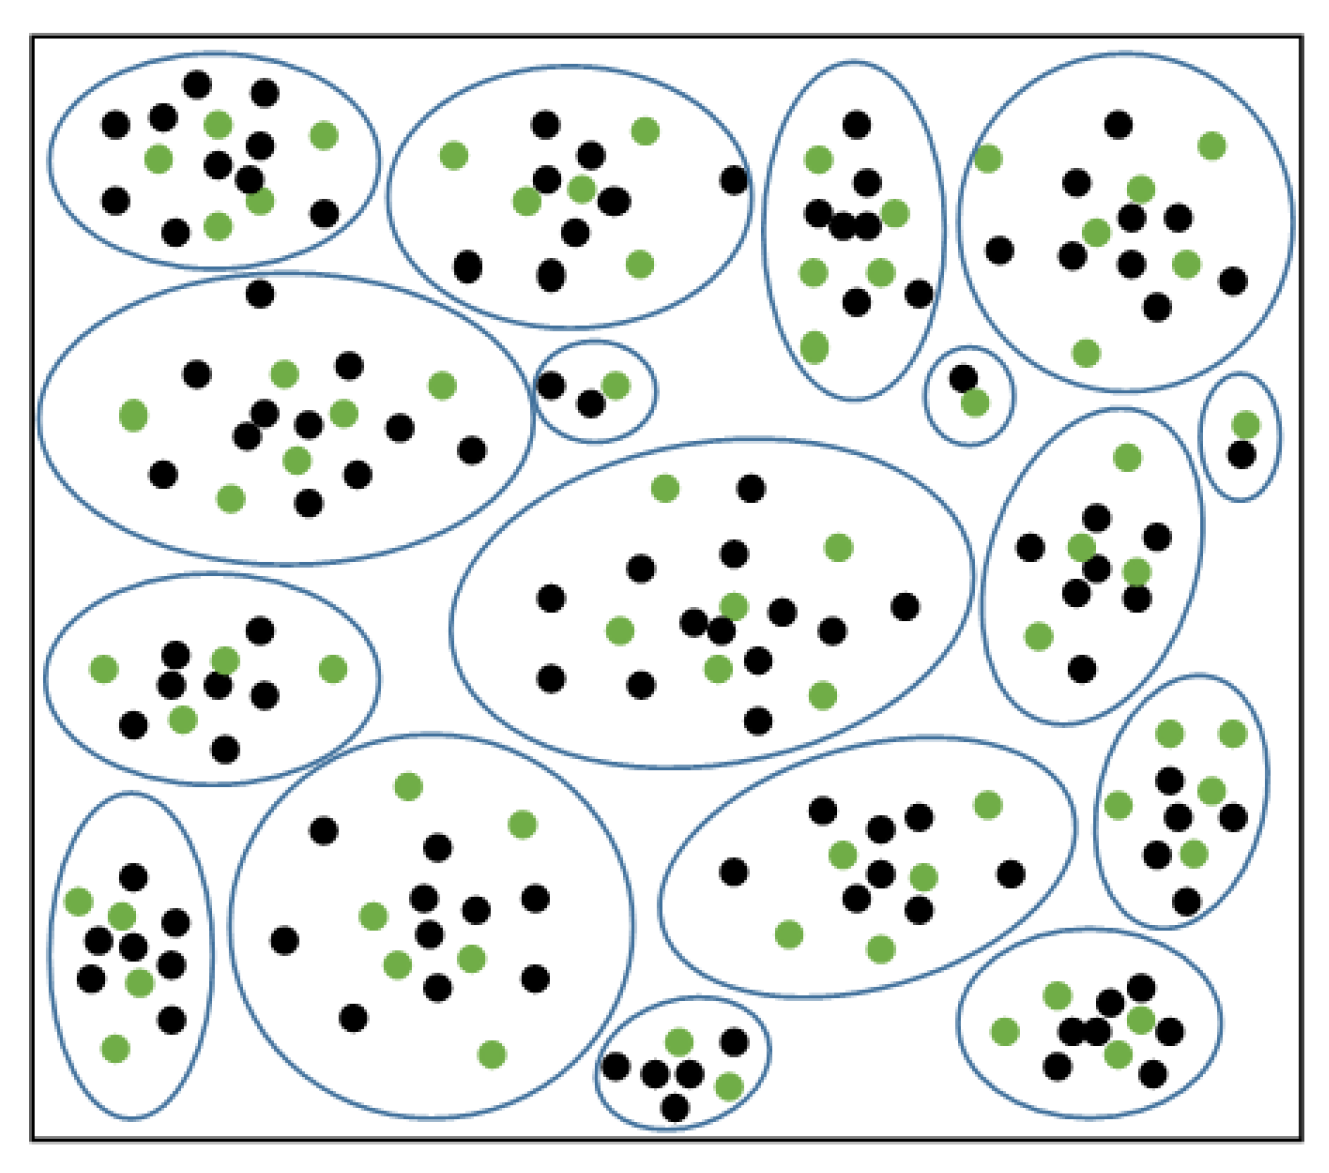
Figure 2 shows there are many small groups in the non-AD patients. According to the characteristic of the AD set, we used the Cluster Random Undersampling Smote–Tomek Approach (CRST). It combines the advantages of K-means++ and the Smote–Tomek sampling method.
First, the training samples in the majority class were clustered by the K-means++ algorithm, in which K was obtained by super-parameter optimization. Then random undersampling was carried out for each cluster. The degree of sampling p% can be determined by the actual situation. After the undersampling, the Smote–Tomek combined sampling method was used to form a new balanced dataset. By iterating these operations many times, we obtained several new balanced sub-datasets.
The clustering of samples in the majority of classes is visualized in
Figure 5. The green dots are the selected, remaining majority class sample points after p% random undersampling for each cluster. The sample points can be uniformly sampled in each cluster by undersampling, maintaining the original data distribution.
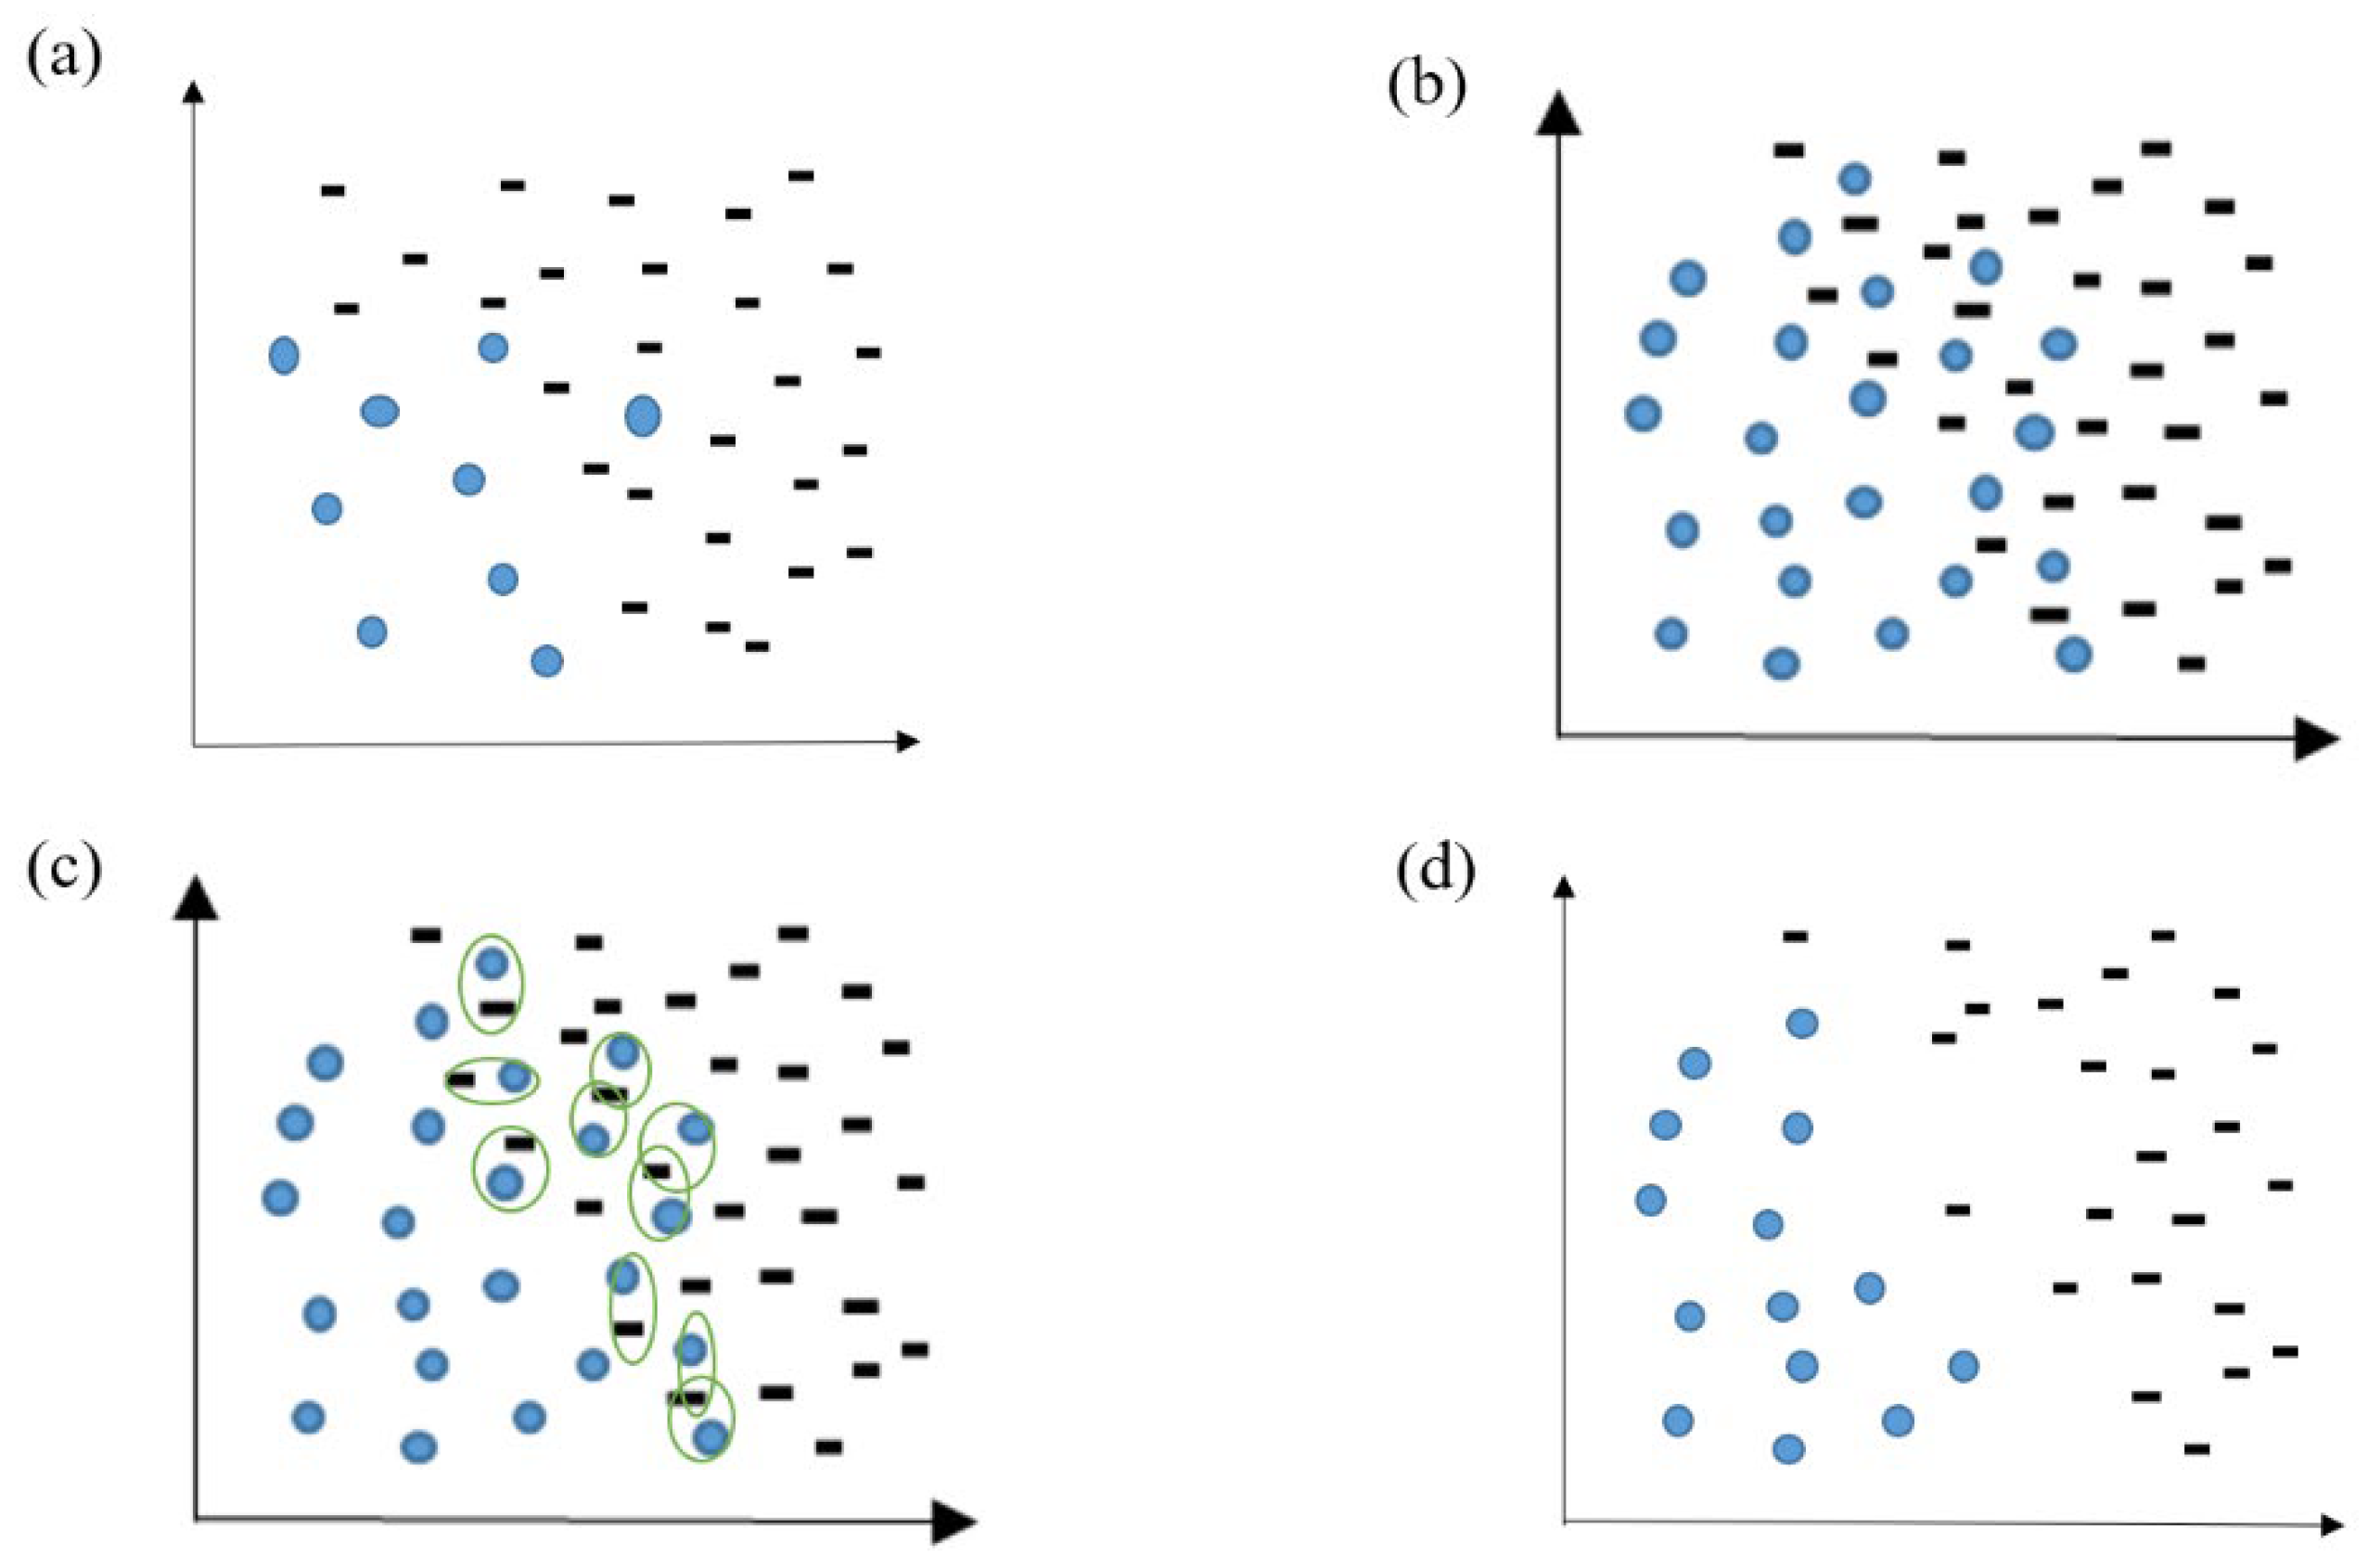
Finally, the Smote–Tomek(S-T) sampling method was applied to generate some minority samples. The sample loss caused by the undersampling was compensated, and the imbalance ratio was alleviated. As shown in
Figure 6, S-T generated minority samples through the SMOTE method, while the Tomek-link method was adopted to solve the problem of fuzzy boundaries caused by the excessive generation of minority samples. This method can reduce the redundancy of samples. The algorithm’s procedure is shown in
Table 1.
3.3. Ensemble Model Based on CRST
Due to the high-dimensional and complex characteristics of the AD dataset, it is necessary to construct a nonlinear classification model with strong generalization ability. On the basis of the CRST sampling method proposed in
Section 3.2, combined with the Bagging [
31] algorithm, a cluster-based ensemble model, CRST-Bagging, was developed to screen for AD patients. It overcomes the limitations of a single classifier.
The CRST-Bagging algorithm generates a new sample set
by using the CRST sampling method iteratively. Then each sub-sample set
is used to construct a sub-classifier
separately. A complete ensemble model classifier can be obtained by integrating the results of the T sub-classifier. The integration rule used in the algorithm is the Majority Vote rule [
32]. For the classifier, if
is greater than or equal to
, then
obtains one vote; if
is less than
, then
obtains one vote.
and
represent the sample category. This rule can be expressed by Formulas (1) and (2). The model structure is shown in
Figure 7.
4. Experiment
In order to evaluate the CRST sampling method’s effectiveness in resampling the AD dataset, we compared the method with the classical sampling methods Smote [
21] and Smote–Tomek [
23]. We also compared the classification performance of the CRST-Bagging model, RUSBoost [
26] and SMOTEBagging [
27] on the AD dataset. RUSBoost and SMOTEBagging are classic ensemble learning algorithms for imbalanced datasets.
4.1. Evaluation Metrics
Because of the extremely high imbalance ratio in the AD dataset, we use Precision, Recall and F1-score metrics to evaluate the CRST sampling method, CRST-Bagging model and other models. The formulas of these evaluation metrics are as follows:
Here, TP is the number of true positives, FP is the number of false positives, TN is the number of true negatives and FP is the number of false negatives. The positive class indicates “AD patient”: the negative class indicates “non-AD patient”.
4.2. Validity Experiment of the CRST Sampling Method
We compared XGBoost, Smote, Smote–Tomek and CCST with the CRST sampling method on the AD dataset and used the seven-fold cross-validation to measure the sampling performance. In order to ensure the consistency of the experiment, XGBoost was used as the classifier for the comparative experiment. The parameters of the three methods were set as follows:
Smote and Smote–Tomek(S-T): The samples in the majority class were randomly sampled, so the ratio of majority to a minority was 2:1. Then Smote and S-T were carried out so that the ratio of positive and negative samples after resampling was 1:1. There were 1604 samples in each category;
CCST: The CCST method refers to the clustering of most class training sample sets by the K-means++ algorithm. N sample points closest to the center of each cluster were selected. Then the Smote–Tomek method was applied to balance the data. We set K = 802; N = 2. After undersampling, there were 1604 majority samples;
CRST: The number of clusters K was obtained by the super-parameter selection, which was 30. First, 3.1% of each cluster class was selected for undersampling, then S-T was applied to the samples in the minority class. There were 1624 samples in each category.
The results are as follows:
The experimental results of the seven-fold cross-validation on the original dataset (5,321,367) are shown in
Table 2. Our proposed resampling method CRST performed well, with the best value in recall (0.774) and F1-score (0.778), although S-T has the highest value in precision. The overall performance of CRST is the best. The performance of XGBoost is the worst among these algorithms because of the imbalanced AD dataset.
4.3. CRST-Bagging Model Effect Comparison Experiment
We also conducted experiments on the AD dataset to compare the prediction ability of CRST-Bagging, RUSBoost and SMOTEBagging. The experimental details of the various algorithms of this experiment are as follows:
RUSBoost: The base learner type was decision tree C4.5, the number was 100 and the depth was 5;
SMOTEBagging [
28]: The number of clusters was set at K = 5, the base learner was decision tree C4.5, the number was 100 and the depth was 6;
CRST-Bagging: The number of clusters was set at K = 50; p% = 3.1%;
Table 3 shows the experimental results of RUSBoost, SMOTEBagging and CRST-Bagging on the original dataset (53,213, 67) using seven-fold cross-validation. The results on the original dataset show CRST-Bagging performed best out of the three models. The precision, recall, and F1 score are 84.1%, 78.3%, and 81.1%, respectively. SMOTEBagging is the second-best, and RUSBoost is the worst.
In order to test the generalization ability of the model, we evaluated the models’ prediction ability on the test set (235, 67). The experimental results of the three algorithms are shown in
Table 4. SMOTEBagging has the best precision on the test dataset (84.2%), but CRST-Bagging has the best recall value (80.7%) and the best F1 score (82.1%). CRST-Bagging has the best overall performance.
Table 5 shows the confusion matrix of the three algorithms on the test dataset. SMOTEBagging has one less misdiagnosis case than CRST-Bagging, but CRST-Bagging has three fewer missed diagnosis cases than SMOTEBagging. RUSBoost performed the worst.
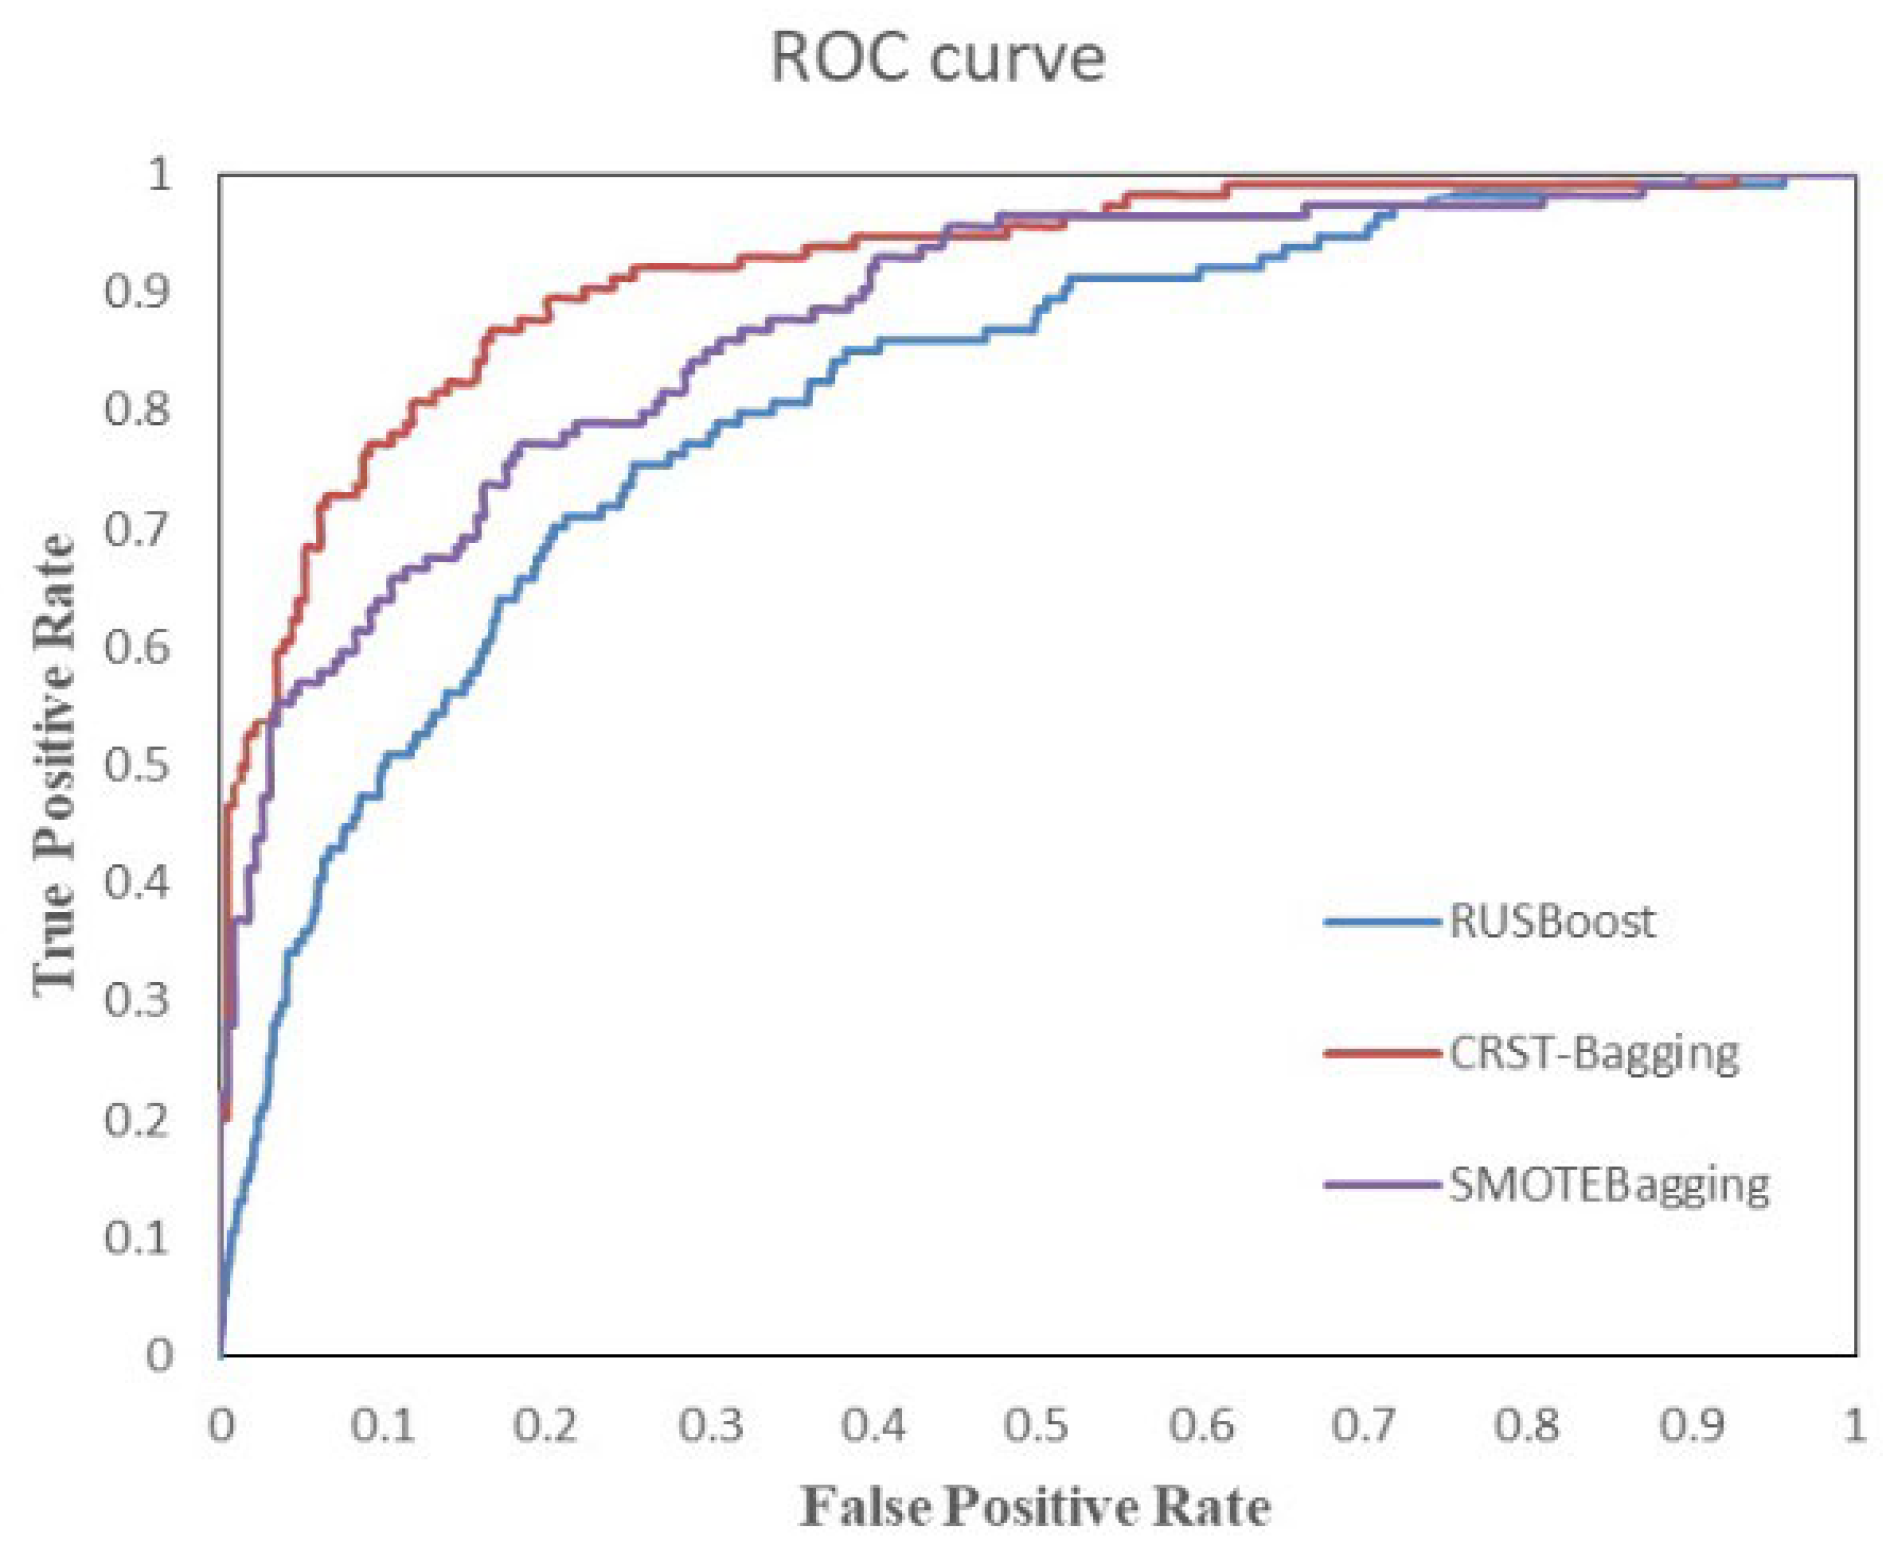
Figure 8 shows the ROC curve of three algorithms on the test set. It reflects the relationship between classification specificity and sensitivity. The area under the curve (AUC) represents the diagnostic effect. The larger the AUC value, the better the diagnostic effect of the model. The ROC plot in
Figure 8 also demonstrates that the CRST-Bagging works best, which indicates that the model is better at predicting patients with AD.
5. Discussion
AD is a rare and high-risk cardiovascular disease. Its complex clinical manifestations and various atypical symptoms lead to serious misdiagnosis and missed diagnosis. In many Chinese basic hospitals, where the equipment is not advanced enough, it is difficult for patients to perform the examination items such as CT and MRI. AD screening is an effective way to determine which patients need further examination. Our study uses routine examinations and machine learning to build a screening model for AD in its early phase.
Because of the rarity of AD, the imbalance of our AD dataset is extremely high. We developed a CRST resampling method to solve the imbalance problem. Compared to XGBoost, the performance of XGBoost was the worst, which means that the extreme imbalance between AD patients and non-AD patients leads the bad diagnostic ability. Compared to other classic resampling methods, CRST performed best overall, with the highest values in recall (77.4%) and F1 (77.8%). This is because two undersamplings (Kmeans++ and Tomek) and one oversampling (Smote) are carried out in CRST, which can effectively reduce the imbalance in the AD dataset. In CRST, Kmeans++ is used to cluster non-AD patients, and a certain percentage of non-AD patients is randomly selected from the clusters. It not only makes the selected non-AD patients effectively represent the characteristics of most non-AD patients but also ensures the randomness of sampling. CRST can relieve the obstacles that imbalanced data bring to the construction of AD screening models.
We compared the CRST-Bagging model with RUSBoost and SMOTEBagging. The experimental results on the original dataset (5,321,367) indicate that the CRST-Bagging model performed the best among the three models (
Table 3). The experiment on the test dataset is to examine the generalization ability of the model. The results (
Table 4) show that CRST-bagging achieved the best overall performance: best recall value (78.3%) and best F1 value (81.1%). The confusion matrices of the three models are listed in
Table 5. The CRST-Bagging missed 16 diagnoses, less than RUSBoost [
23] and SMOTEBagging [
24]. There are 13 misdiagnosed cases, only one case more than SMOTEBagging. This indicates that CRST-Bagging can effectively decrease the number of missed cases without increasing the number of misdiagnosis cases substantially. Because AD is a serious acute disease with high mortality, missed diagnosis is more dangerous than a misdiagnosis.
Clinically, CT, MRI, and TransEsophageal Echocardiography (TEE) are reliable tools for diagnosing AD [
4]. The doctor has the responsibility of screening for the patients with a high risk of AD to be further examined by CT, MRI or TEE. However, in initial diagnosis, the missed diagnosis rate of AD is high: 35.5% [
5], 39.69% [
6], 38.2% [
7]; the missed diagnosis rate in acute aortic syndrome in the emergency room is even close to 80% [
8]. Our CRST-Bagging model obtained a missed diagnosis rate of 19.2%, while SMOTEBagging’s missed diagnosis rate was 22.9% and RUSBoost’s missed diagnosis rate was 24.1%. Compared with clinical statistical data and other ensemble models, CRST-Bagging reduced the missed diagnosis rate of AD significantly. This means CRST-Bagging is an effective model to screen for AD patients in the early phase. It can help doctors make decisions about further correct treatment, especially in rural or remote areas.
Our study has certain limitations. First, our study is a retrospective analysis, and there were some missing data. We adopted the method of random filling by class, but this may lead to some bias. Second, due to the rarity of AD, our dataset includes only 802 AD patients of different ages. Our study took it as a whole without considering the difference in misdiagnosis rate and missed diagnosis rate of AD patients of different ages.
In the future, we will collect more patient data and divide the data into subgroups based on age. Studies will be performed in each data sub-group to reduce misdiagnosis and missed diagnoses. Based on the AD data, analytical results, and our proposed auxiliary diagnostic model, we will study the pathological mechanism and key diagnostic indicators of AD from the perspective of interpretability and explore whether there is a more definite clinical diagnostic method for AD.
6. Conclusions
In this paper, we proposed a cluster-based ensemble learning model named CRST-Bagging to assist in screening for AD by using routine examination data. In this model, we have proposed a cluster-based resampling method (CRST) to solve the problem of highly imbalanced data in the AD dataset. Then we used the Bagging algorithm to classify the AD and non-AD patients. We used the data from Xiangya hospital to evaluate the effectiveness of our resampling method and the prediction ability of our model. The experimental results show that our resampling method can effectively solve the problem of the imbalanced AD dataset. In addition, the performance of CRST-bagging is reasonably good at predicting AD patients, which can effectively decrease the number of missed diagnosis cases while ensuring a low number of misdiagnosis cases. Due to the rarity and complexity of AD, as well as the insufficiency of medical equipment in Chinese rural or remote areas, it is difficult for clinicians to diagnose AD, thus missing the best time for the patient’s treatment. Our model can help clinicians screen for AD patients in the early phase so that recommendations for further treatment can be made. This is an effective way to save AD patients’ lives, especially in areas without sufficient clinicians and medical equipment.
Author Contributions
Conceptualization, Y.G. and L.L.; data curation, L.L., G.Z. and J.L.; methodology, M.W. and L.Z.; project administration, Y.G. and L.L.; validation, Y.G., L.L. and G.Z.; writing—original draft preparation, M.W. and Y.G.; writing—review and editing, Y.G. and L.L. All authors have read and agreed to the published version of the manuscript.
Funding
This research was funded by National Natural Science Foundation of China, grant number 61502537, and Strategic Emerging Industry Technological Research and Major Technological Achievement Transformation Project, High-tech Development and Industrialization Office, grant number 2019GK4013.
Institutional Review Board Statement
The authors are accountable for all aspects of the work in ensuring that questions related to the accuracy or integrity of any part of the work are appropriately investigated and resolved. The study was conducted in accordance with the Declaration of Helsinki (as revised in 2013). The study was conducted in accordance with the Declaration of Helsinki, and approved by the Ethics Committee of Xiangya Hospital, Central South University (201502042).
Informed Consent Statement
Informed consent was obtained from all subjects involved in the study.
Data Availability Statement
A description of the dataset and features are provided in the manuscript. Since access to this dataset requires the approval of the hospital to which these EMRs belong, the dataset cannot be made publicly available.
Conflicts of Interest
The authors declare no conflict of interest.
Abbreviations
| Abbreviation | Meaning |
| AD | aortic dissection |
| LSTM | long short-term memory |
| PAVE | Pattern Attention model with Value Embedding |
| CT | Computed Tomography |
| AT: Ag | Antithrombin III antigen |
| PLGAg | Plasminogen antigen |
| S-TSH | Hypersensitivity thyrotropin |
| ESR | erythrocyte sedimentation rate |
| FT3 | free triiodothyronine |
| XGBoost | eXtreme Gradient Boosting |
| T-SNE | t-distributed stochastic neighbor embedding |
| CRST | Cluster Random UnderSampling Smote–Tomek Approach |
| CRST-Bagging | Cluster Random Undersampling Smote–Tomek Bagging |
| S-T | Smote–Tomek |
| CCST | Cluster-Center Under-Sampling and Smote–Tomek Approach |
References
- Erbel, R.; Aboyans, V.; Boileau, C.; Bossone, E.; Di Bartolomeo, R.; Eggebrecht, H.; Evangelista, A.; Falk, V.; Frank, H.; Gaemperli, O.; et al. Corrigendum to: 2014 ESC Guidelines on the Diagnosis and Treatment of Aortic Diseases. Eur. Heart J. 2015, 36, 2779. [Google Scholar] [CrossRef] [PubMed]
- Nienaber, C.A.; Clough, R.E. Management of Acute Aortic Dissection. Lancet 2015, 385, 800–811. [Google Scholar] [CrossRef]
- De León Ayala, I.A.; Chen, Y.-F. Acute Aortic Dissection: An Update. Kaohsiung J. Med. Sci. 2012, 28, 299–305. [Google Scholar] [CrossRef] [PubMed] [Green Version]
- Mussa, F.F.; Horton, J.D.; Moridzadeh, R.; Nicholson, J.; Trimarchi, S.; Eagle, K.A. Acute Aortic Dissection and Intramural Hematoma: A Systematic Review. JAMA 2016, 316, 754–763. [Google Scholar] [CrossRef] [PubMed]
- Chen, X.; Xiao-Min, L.; Chen, X. Analysis of Emergency Misdiagnosis of 22 Cases of Aortic Dissection. Clin. Misdiagnosis Misther. 2016, 29, 30–31. [Google Scholar]
- Teng, Y.; Gao, Y.; Feng, S. Analysis of Emergency Misdiagnosis of 131 Cases of Aortic Dissection. Clin. Misdiagnosis Misther. 2012, 8, 1873. [Google Scholar]
- Chua, M.; Ibrahim, I.; Neo, X.; Sorokin, V.; Shen, L.; Ooi, S.B.S. Acute Aortic Dissection in the ED: Risk Factors and Predictors for Missed Diagnosis. Am. J. Emerg. Med. 2012, 30, 1622–1626. [Google Scholar] [CrossRef]
- Zaschke, L.; Habazettl, H.; Thurau, J.; Matschilles, C.; Göhlich, A.; Montagner, M.; Falk, V.; Kurz, S.D. Acute Type A Aortic Dissection: Aortic Dissection Detection Risk Score in Emergency Care—Surgical Delay Because of Initial Misdiagnosis. Eur. Heart J. Acute Cardiovasc. Care 2020, 9, S40–S47. [Google Scholar] [CrossRef]
- Kurz, S.D.; Falk, V.; Kempfert, J.; Gieb, M.; Ruschinski, T.M.; Kukucka, M.; Tsokos, M.; Grubitzsch, H.; Herbst, H.; Semmler, J.; et al. Insight into the Incidence of Acute Aortic Dissection in the German Region of Berlin and Brandenburg. Int. J. Cardiol. 2017, 241, 326–329. [Google Scholar] [CrossRef] [Green Version]
- Wundram, M.; Falk, V.; Eulert-Grehn, J.-J.; Herbst, H.; Thurau, J.; Leidel, B.A.; Göncz, E.; Bauer, W.; Habazettl, H.; Kurz, S.D. Incidence of Acute Type A Aortic Dissection in Emergency Departments. Sci. Rep. 2020, 10, 7434. [Google Scholar] [CrossRef]
- Huang, Z.; Chan, T.-M.; Dong, W. MACE Prediction of Acute Coronary Syndrome via Boosted Resampling Classification Using Electronic Medical Records. J. Biomed. Inform. 2017, 66, 161–170. [Google Scholar] [CrossRef] [PubMed]
- Zhou, P.-Y.; Wong, A.K.C. Explanation and Prediction of Clinical Data with Imbalanced Class Distribution Based on Pattern Discovery and Disentanglement. BMC Med. Inform. Decis. Mak. 2021, 21, 16. [Google Scholar] [CrossRef] [PubMed]
- Deberneh, H.M.; Kim, I. Prediction of Type 2 Diabetes Based on Machine Learning Algorithm. Int. J. Environ. Res. Public Health 2021, 18, 3317. [Google Scholar] [CrossRef] [PubMed]
- Maselli, F.; Palladino, M.; Barbari, V.; Storari, L.; Rossettini, G.; Testa, M. The Diagnostic Value of Red Flags in Thoracolumbar Pain: A Systematic Review. Disabil. Rehabil. 2020, 1–17. [Google Scholar] [CrossRef] [PubMed]
- Finucane, L.M.; Downie, A.; Mercer, C.; Greenhalgh, S.M.; Boissonnault, W.G.; Pool-Goudzwaard, A.L.; Beneciuk, J.M.; Leech, R.L.; Selfe, J. International Framework for Red Flags for Potential Serious Spinal Pathologies. J. Orthop. Sports Phys. Ther. 2020, 50, 350–372. [Google Scholar] [CrossRef]
- Van der Maaten, L.; Hinton, G. Visualizing Data Using T-SNE. J. Mach. Learn. Res. 2008, 9, 2579–2605. [Google Scholar]
- Hata, A.; Yanagawa, M.; Yamagata, K.; Suzuki, Y.; Kido, S.; Kawata, A.; Doi, S.; Yoshida, Y.; Miyata, T.; Tsubamoto, M.; et al. Deep Learning Algorithm for Detection of Aortic Dissection on Non-Contrast-Enhanced CT. Eur. Radiol. 2021, 31, 1151–1159. [Google Scholar] [CrossRef]
- Harris, R.J.; Kim, S.; Lohr, J.; Towey, S.; Velichkovich, Z.; Kabachenko, T.; Driscoll, I.; Baker, B. Classification of Aortic Dissection and Rupture on Post-Contrast CT Images Using a Convolutional Neural Network. J. Digit. Imaging 2019, 32, 939–946. [Google Scholar] [CrossRef]
- Cheng, J.; Tian, S.; Yu, L.; Ma, X.; Xing, Y. A Deep Learning Algorithm Using Contrast-Enhanced Computed Tomography (CT) Images for Segmentation and Rapid Automatic Detection of Aortic Dissection. Biomed. Signal Process. Control 2020, 62, 102145. [Google Scholar] [CrossRef]
- Huo, D.; Kou, B.; Zhou, Z.; Lv, M. A Machine Learning Model to Classify Aortic Dissection Patients in the Early Diagnosis Phase. Sci. Rep. 2019, 9, 2701. [Google Scholar] [CrossRef]
- Chawla, N.V.; Bowyer, K.W.; Hall, L.O.; Kegelmeyer, W.P. SMOTE: Synthetic Minority Over-Sampling Technique. J. Artif. Intell. Res. 2002, 16, 321–357. [Google Scholar] [CrossRef]
- Rok, B.; Lusa, L. SMOTE for High-Dimensional Class-Imbalanced Data. BMC Bioinform. 2013, 14, 106–121. [Google Scholar]
- Tomek, I. Two Modifications of CNN. IEEE Trans. Syst. Man Cybern. 1976, 6, 769–772. [Google Scholar] [CrossRef] [Green Version]
- Batista, G.E.; Prati, R.C.; Monard, M.C. A Study of the Behavior of Several Methods for Balancing Machine Learning Training Data. ACM SIGKDD Explor. Newsl. 2004, 6, 20–29. [Google Scholar] [CrossRef]
- Khushi, M.; Shaukat, K.; Alam, T.M.; Hameed, I.A.; Uddin, S.; Luo, S.; Yang, X.; Reyes, M.C. A Comparative Performance Analysis of Data Resampling Methods on Imbalance Medical Data. IEEE Access 2021, 9, 109960–109975. [Google Scholar] [CrossRef]
- Seiffert, C.; Khoshgoftaar, T.M.; Van Hulse, J.; Napolitano, A. RUSBoost: A Hybrid Approach to Alleviating Class Imbalance. IEEE Trans. Syst. Man Cybern. A 2010, 40, 185–197. [Google Scholar] [CrossRef]
- Wang, S.; Yao, X. Diversity Analysis on Imbalanced Data Sets by Using Ensemble Models. In Proceedings of the 2009 IEEE Symposium on Computational Intelligence and Data Mining, Nashville, TN, USA, 30 March–2 April 2009; pp. 324–331. [Google Scholar]
- Liu, L.; Zhang, C.; Zhang, G.; Gao, Y.; Luo, J.; Zhang, W.; Li, Y.; Mu, Y. A Study of Aortic Dissection Screening Method Based on Multiple Machine Learning Models. J. Thorac. Dis. 2020, 12, 605–614. [Google Scholar] [CrossRef]
- Chen, T.; Guestrin, C. XGBoost: A Scalable Tree Boosting System. In Proceedings of the 22nd ACM SIGKDD International Conference on Knowledge Discovery and Data Mining, ACM, San Francisco, CA, USA, 13–17 August 2016; pp. 785–794. [Google Scholar]
- Zhang, D.; Qian, L.; Mao, B.; Huang, C.; Huang, B.; Si, Y. A Data-Driven Design for Fault Detection of Wind Turbines Using Random Forests and XGboost. IEEE Access 2018, 6, 21020–21031. [Google Scholar] [CrossRef]
- Breiman, L. Bagging Predictors. Mach. Learn. 1996, 24, 123–140. [Google Scholar] [CrossRef] [Green Version]
- Kittler, J.; Hatef, M.; Duin, R.P.W.; Matas, J. On Combining Classifiers. IEEE Trans. Pattern Anal. Mach. Intell. 1998, 20, 226–239. [Google Scholar] [CrossRef] [Green Version]
| Publisher’s Note: MDPI stays neutral with regard to jurisdictional claims in published maps and institutional affiliations. |
© 2022 by the authors. Licensee MDPI, Basel, Switzerland. This article is an open access article distributed under the terms and conditions of the Creative Commons Attribution (CC BY) license (https://creativecommons.org/licenses/by/4.0/).


