
Influence of Perfluoroalkyl Substances on Occurrence of Coronavirus Disease 2019


Abstract
:1. Purpose
2. Introduction
3. Materials and Methods
3.1. Data Acquisition
3.1.1. Blood PFAS Data
3.1.2. COVID-19 Incidence Data
3.1.3. Population Count Data
3.2. Methods
- The publicly available COVID-19 incidence count data by age grouping and gender were downloaded for the location in which the participants of the given PFAS study resided. These COVID-19 incidence counts were cumulative since the start of data collection by the State or local agency in charge of acquiring and presenting the COVID-19 data on the dashboard (i.e., total counts were obtained).
- ○
- As these data were downloaded, the age groups were delineated for the presented COVID-19 incidence count data.
- Within each of the COVID-19 incidence age groups encountered in step #1, incidence counts were estimated for each age (year) by dividing the total incidence count for that age group by the number of years represented within the group. This approach assumes that COVID-19 incidence was uniformly spread across the years within that group, and therefore, each year within an age group had the same COVID-19 incidence count estimate.
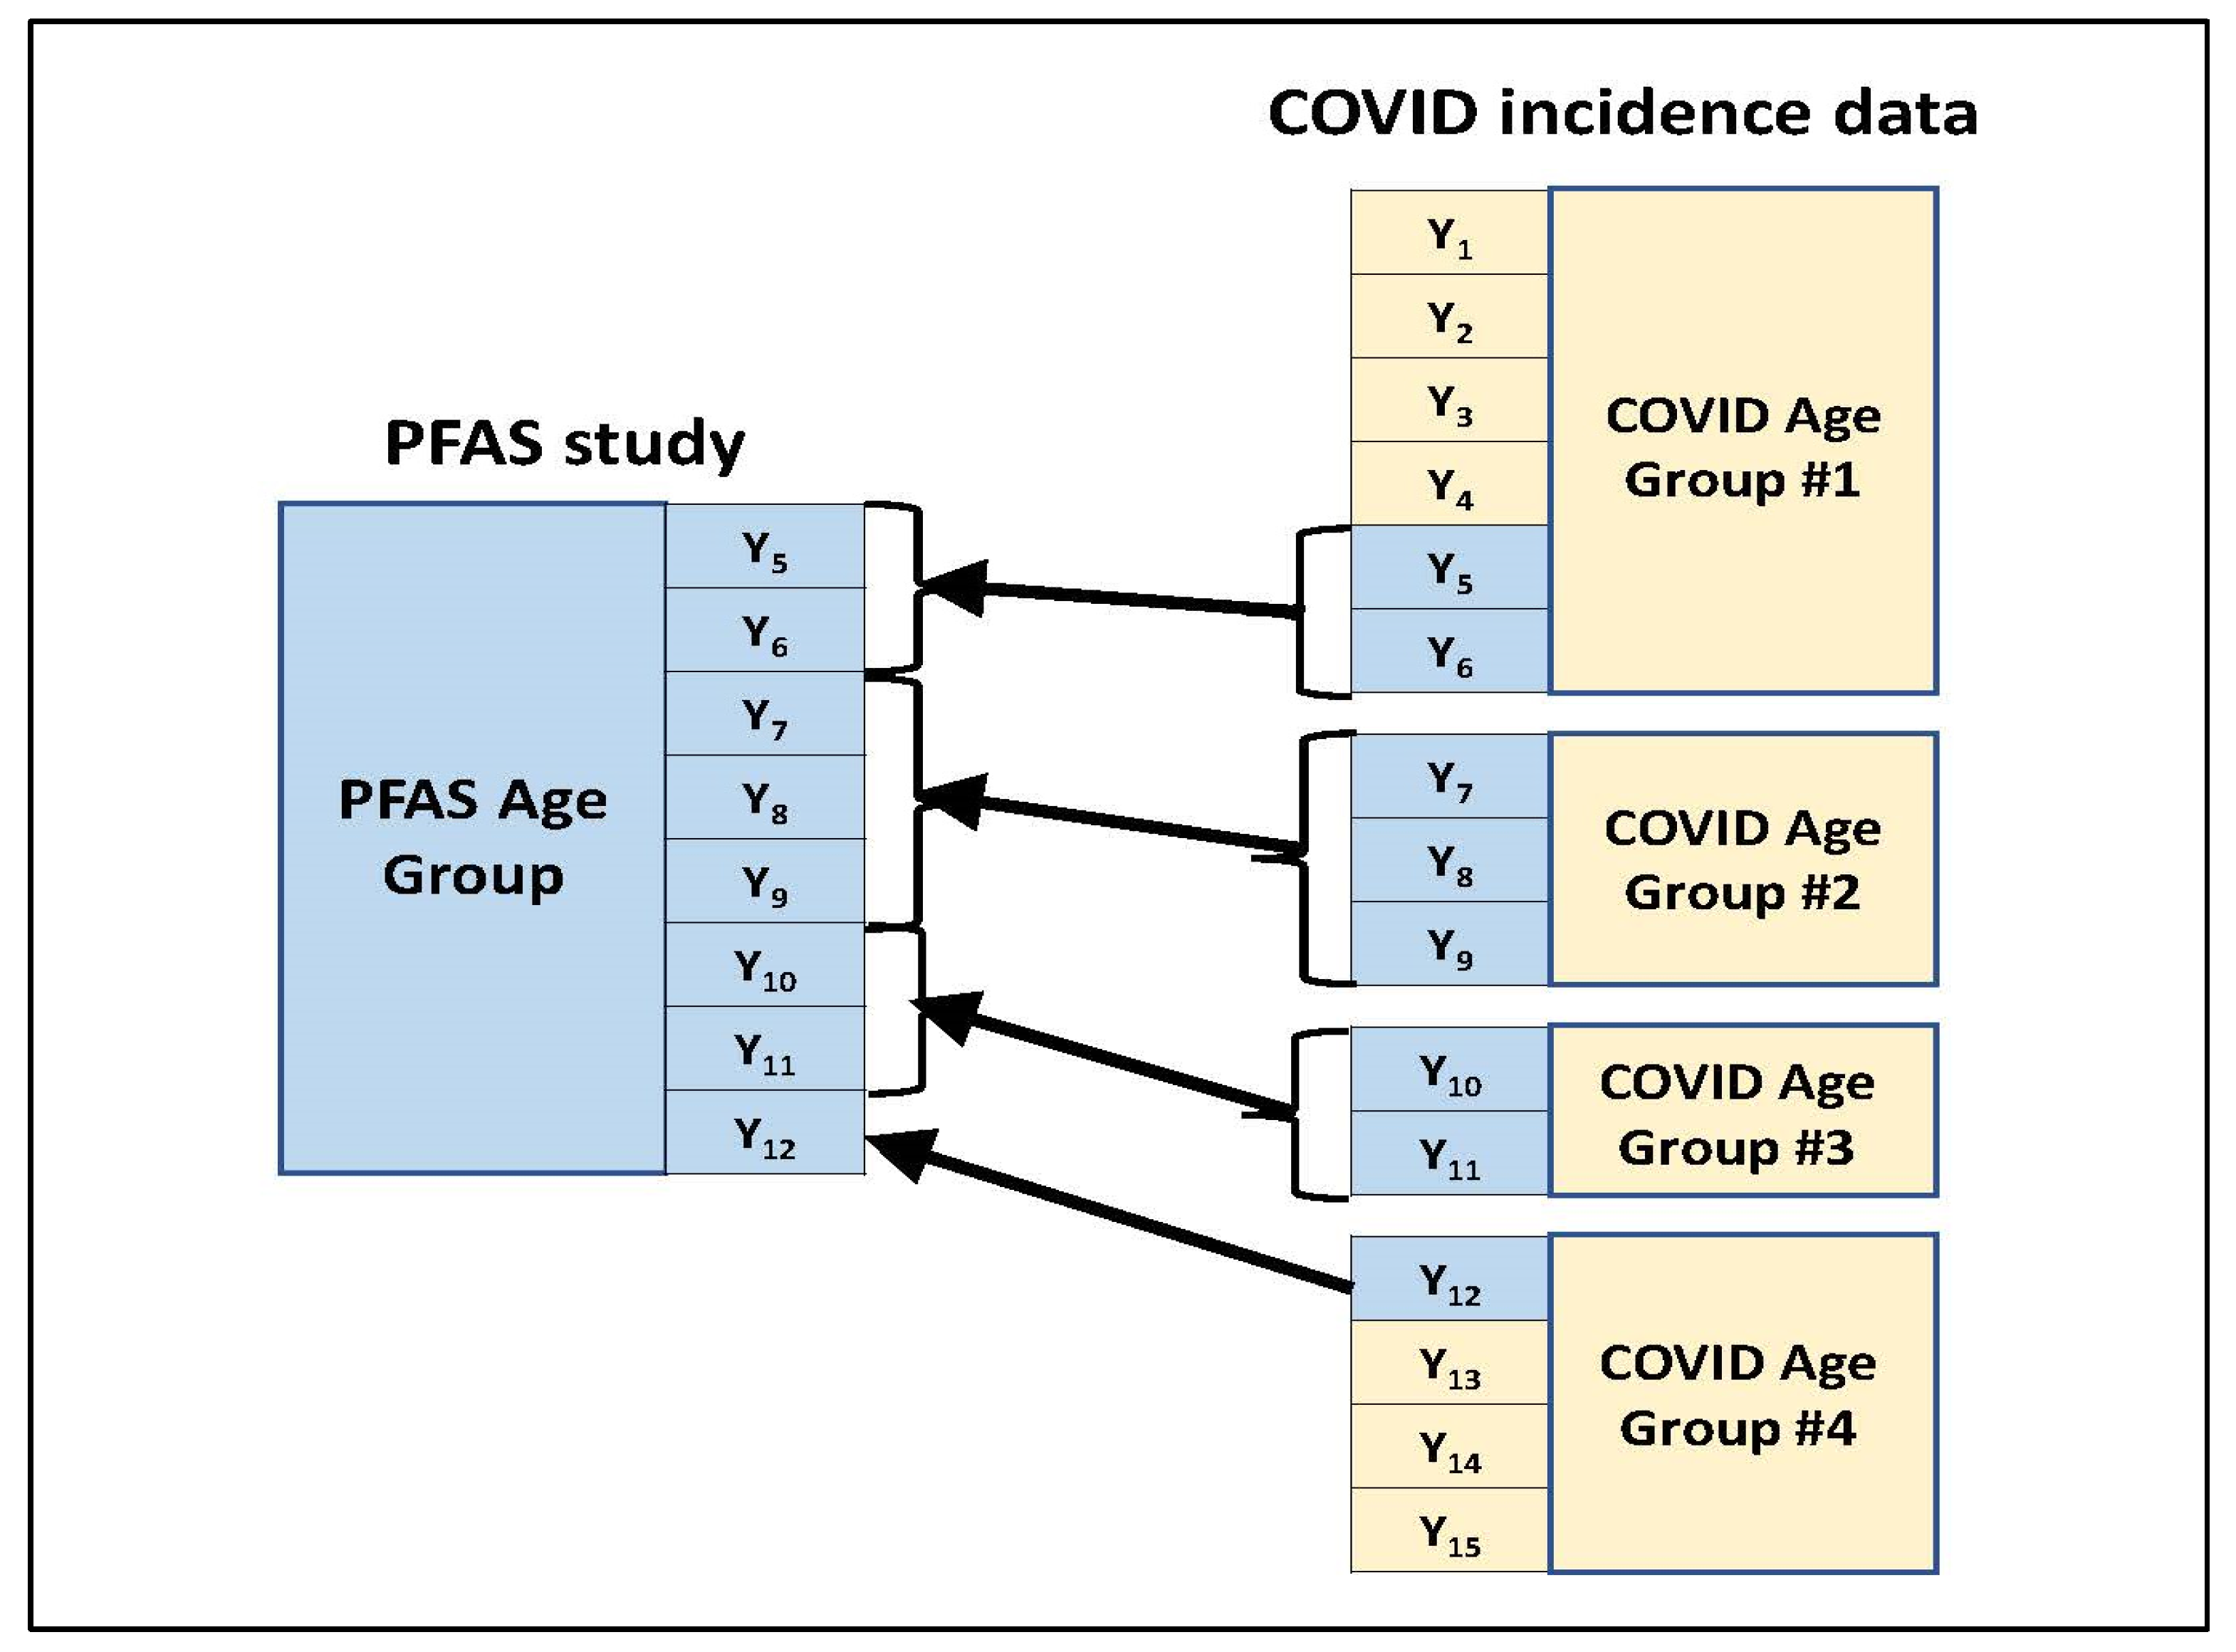
- For a given age group present in the blood PFAS concentration summary, those age groups used to present the COVID-19 incidence counts were identified which overlapped with the PFAS age group in some way. Figure 1 illustrates this through an example. In this example, the PFAS study age group spans eight years (Y5 to Y12) which are represented among four age groups used in the COVID-19 incidence data for the study location. (These four COVID-19 age groups which overlap with the PFAS age group jointly span a total of 15 years—Y1 to Y15.) Two of the four COVID-19 age groups (#2 and #3) fall within the PFAS age group in their entirety. For each of the other two COVID-19 age groups (#1 and #4), only a subset of their represented years falls within the PFAS age group.
- Across all years within the given PFAS age group, the year-specific estimated COVID-19 incidence counts calculated in step #2 were summed to obtain an estimated COVID-19 incidence count for that PFAS age group.
- Steps #3 and #4 were repeated for each age group in the blood PFAS concentration summary, yielding a COVID-19 incidence count estimate for each group.
- Measures for summary statistics related to the distribution of PFAS concentrations in blood (specifically, the 50th and 75th percentiles for both PFOS and PFOA) for the age group.
- COVID-19 incidence measure for the age group (i.e., percentage relative to the group’s population).
- New Jersey COVID-19 data: https://covid19.nj.gov/ accessed on 4 February 2022.
- North Carolina COVID-19 data: https://covid19.ncdhhs.gov/dashboard/cases-demographics accessed on 4 February 2022.
- Ohio COVID-19 data: https://coronavirus.ohio.gov/wps/portal/gov/covid-19/dashboards accessed on 4 February 2022.
- NHANES data: https://covid.cdc.gov/covid-data-tracker/#demographics accessed on 4 February 2022.
4. Results
5. Discussion
6. Conclusions
Author Contributions
Funding
Institutional Review Board Statement
Informed Consent Statement
Data Availability Statement
Acknowledgments
Conflicts of Interest
References
- Von Holst, H.; Nayak, P.; Dembek, Z.; Buehler, S.; Echeverria, D.; Fallacara, D.; John, H. Perfluorylalkyl substances exposure and immunity, allergic response, infection, and asthma in children: Review of epidemiologic studies. Heliyon 2021, 7, e08160. [Google Scholar] [CrossRef] [PubMed]
- Agency for Toxic Substances and Disease Registry. What Are the Health Effects of PFAS? 24 June 2020. Available online: https://www.atsdr.cdc.gov/pfas/health-effects/index.html (accessed on 22 April 2022).
- Environmental Working Group. Letter from Robert R. Redfield, MD to Representative Daniel T. Kildee. 6 November 2020. Available online: https://www.ewg.org/sites/default/files/u352/00256729_Kildee_Final.pdf (accessed on 22 April 2022).
- Grandjean, P.; Timmermann, C.A.D.; Kruse, M.; Nielsen, F.; Vinholt, P.J.; Boding, L.; Heilmann, C.; Molbak, K. Severity of COVID-19 at elevated exposure to perfluorinated alkylates. PLoS ONE 2020, 15, e0244815. [Google Scholar] [CrossRef] [PubMed]
- U.S. Centers for Disease Control and Prevention. Early Release: Per- and Polyfluorinated Substances (PFAS) Tables, NHANES 2011–2018. 2021. Available online: https://www.cdc.gov/exposurereport/pfas_early_release.html (accessed on 22 April 2022).
- Park, S.K.; Peng, Q.; Ding, N.; Mukherjee, B.; Harlow, S.D. Determinants of per- and polyfluoroalkyl substances (PFAS) in midlife women: Evidence of racial/ethnic and geographic differences in PFAS exposure. Environ. Res. 2019, 175, 186–199. [Google Scholar] [CrossRef] [PubMed]
- Romano, M.E.; Xu, Y.; Calafat, A.M.; Yolton, K.; Chen, A.; Webster, G.M.; Eliot, M.N.; Howard, C.R.; Lanphear, B.P.; Braun, J.M. Maternal serum perfluoroalkyl substances during pregnancy and duration of breastfeeding. Environ. Res. 2016, 149, 239–246. [Google Scholar] [CrossRef] [Green Version]
- Blake, B.E.; Pinney, S.M.; Hines, E.P.; Fenton, S.E.; Ferguson, K.K. Associations between longitudinal serum perfluoroalkyl substance (PFAS) levels and measures of thyroid hormone, kidney function, and body mass index in the Fernald Community Cohort. Environ. Pollut. 2018, 242, 894–904. [Google Scholar] [CrossRef]
- Waterfield, G.; Rogers, M.; Grandjean, P.; Auffhammer, M.; Sunding, D. Reducing exposure to high levels of perfluorinated compounds in drinking water improves reproductive outcomes: Evidence from an intervention in Minnesota. Environ. Health 2020, 19, 42. [Google Scholar] [CrossRef] [Green Version]
- Trowbridge, J.; Gerona, R.R.; Lin, T.; Rudel, R.A.; Bessonneau, V.; Buren, H.; Morello-Frosch, R. Exposure to perfluoroalkyl substances in a cohort of women firefighters and office workers in San Francisco. Environ. Sci. Technol. 2020, 54, 3363–3374. [Google Scholar] [CrossRef]
- Eick, S.M.; Enright, E.A.; Geiger, S.D.; Dzwilewski, K.L.C.; DeMicco, E.; Smith, S.; Park, J.-S.; Aguiar, A.; Woodruff, T.J.; Morello-Frosch, R.; et al. Associations of Maternal Stress, Prenatal Exposure to Per- and Polyfluoroalkyl Substances (PFAS), and Demographic Risk Factors with Birth Outcomes and Offspring Neurodevelopment: An Overview of the ECHO.CA.IL Prospective Birth Cohorts. Int. J. Environ. Res. Public Health 2021, 18, 742. [Google Scholar] [CrossRef]
- Kotlarz, N.; McCord, J.; Collier, D.; Lea, C.S.; Strynar, M.; Lindstrom, A.B.; Wilkie, A.A.; Islam, J.Y.; Matney, K.; Tarte, P.; et al. Measurement of Novel, Drinking Water-Associated PFAS in Blood from Adults and Children in Wilmington, North Carolina. Env. Health Perspect. 2020, 128, 77005. [Google Scholar] [CrossRef]
- Saleeby, B.; Shimizu, M.S.; Garcia, R.I.S.; Avery, G.B.; Kieber, R.J.; Mead, R.N.; Skrabal, S.A. Isomers of emerging per- and polyfluoroalkyl substances in water and sediment from the Cape Fear River, North Carolina, USA. Chemosphere 2021, 262, 128359. [Google Scholar] [CrossRef]
- Yu, C.H.; Riker, C.D.; Lu, S.-E.; Fan, Z.T. Biomonitoring of emerging contaminants, perfluoroalkyl and polyfluoroalkyl substances (PFAS), in New Jersey adults in 2016–2018. Int. J. Hyg. Environ. Health 2020, 223, 34–44. [Google Scholar] [CrossRef] [PubMed]
- U.S. Centers for Disease Control and Prevention. Coronavirus Disease 2019 (COVID-2019) 2021 Case Definition. 24 August 2021. Available online: https://ndc.services.cdc.gov/case-definitions/coronavirus-disease-2019-2021/ (accessed on 22 April 2022).
- United States Census Bureau. County Population by Characteristics: 2010–2019. Available online: https://www.census.gov/data/datasets/time-series/demo/popest/2010s-counties-detail.html (accessed on 22 April 2022).
- Christensen, K.Y.; Raymond, M.; Thompson, B.A.; Anderson, H.A. Perfluoroalkyl substances in older male anglers in Wisconsin. Environ. Int. 2016, 91, 312–318. [Google Scholar] [CrossRef] [PubMed]
- Daly, E.R.; Chan, B.P.; Talbot, E.A.; Nassif, J.; Bean, C.; Cavallo, S.J.; Metcalf, E.; Simone, K.; Woolf, A.D. Per- and polyfluoroalkyl substance (PFAS) exposure assessment in a community exposed to contaminated drinking water, New Hampshire, 2015. Int. J. Hyg. Environ. Health 2018, 221, 569–577. [Google Scholar] [CrossRef] [PubMed]
- Tanner, E.M.; Bloom, M.S.; Wu, Q.; Kannan, K.; Yucel, R.M.; Shresta, S.; Fitzgerald, E.F. Occupational exposure to perfluoroalkyl substances and serum levels of perfluorooctanesulfonic acid (PFAS) and perfluorooctanoic acid (PFOS) in an aging population from upstate New York: A retrospective cohort study. Int. Arch. Occup. Environ. Health 2018, 91, 145–154. [Google Scholar] [CrossRef] [PubMed]
- Lim, T.C.; Wang, B.; Huang, J.; Deng, S.; Yu, G. Emission inventory for PFOS in China: Review of past methodologies and suggestions. Sci. World J. 2011, 11, 1963–1980. [Google Scholar] [CrossRef] [Green Version]
- Gomis, M.I.; Vestergren, R.; Borg, D.; Cousins, I.T. Comparing the toxic potency in vivo of long-chain perfluoroalkyl acids and fluorinated alternatives. Environ. Int. 2018, 113, 1–9. [Google Scholar] [CrossRef]
- Agency for Toxic Substances and Disease Registry. PFAS in the U.S. Population. 24 June 2020. Available online: https://www.atsdr.cdc.gov/pfas/health-effects/us-population.html#:~:text=As%20the%20use%20of%20some,declined%20by%20more%20than%2060%25 (accessed on 22 April 2022).
- U.S. Centers for Disease Control and Prevention. Risk for COVID-19 Infection, Hospitalization, and Death by Age Group. Rate Ratios Compared to 18- to 29-year-olds. 19 July 2021. Available online: https://www.cdc.gov/coronavirus/2019-ncov/covid-data/investigations-discovery/hospitalization-death-by-age.html (accessed on 4 February 2022).
- D’ascanio, M.; Innammorato, M.; Pasquariello, L.; Pizzirusso, D.; Guerrieri, G.; Castelli, S.; Pezzuto, A.; De Vitis, C.; Anibaldi, P.; Marcolongo, A.; et al. Age is not the only risk factor in COVID-19: The role of comorbidities and of long staying in residential care homes. BMC Geriatr. 2021, 21, 63. [Google Scholar] [CrossRef]
- Catelan, D.; Biggeri, A.; Russo, F.; Gregori, D.; Pitter, G.; Da Re, F.; Fletcher, T.; Canova, C. Exposure to Perfluoroalkyl Substances and Mortality for COVID-19: A Spatial Ecological Analysis in the Veneto Region (Italy). Int. J. Environ. Res. Public Health 2021, 18, 2734. [Google Scholar] [CrossRef]
- Quinete, N.; Hauser-Davis, R.A. Drinking water pollutants may affect the immune system: Concerns regarding COVID-19 health effects. Environ. Sci. Pollut. Res. Int. 2021, 28, 1235–1246. [Google Scholar] [CrossRef]
- Grandjean, P.; Heilmann, C.; Weihe, P.; Nielsen, F.; Mogensen, U.B.; Timmermann, A.; Budtz-Jorgensen, E. Estimated exposures to perfluorinated compounds in infancy predict attenuated vaccine antibody concentrations at age 5 years. J. Immunotoxicol. 2017, 14, 188–195. [Google Scholar] [CrossRef]
- Looker, C.; Luster, M.I.; Calafat, A.M.; Johnson, V.J.; Burleson, G.R.; Burleson, F.G.; Fletcher, T. Influenza vaccine response in adults exposed to perfluorooctanoate and perfluorooctanesulfonate. Toxicol. Sci. 2014, 138, 76–88. [Google Scholar] [CrossRef] [PubMed] [Green Version]
- National Toxicology Program. National Institute of Environmental Health Sciences. U.S. Department of Health and Human Services. 2016. Monograph on Immunotoxicity Associated with Exposure to Perfluorooctanoic Acid (PFOA) and Perfluorooctane Sulfonate (PFOS). Research Triangle Park, NC. National Toxicology Program. Available online: https://ntp.niehs.nih.gov/ntp/ohat/pfoa_pfos/pfoa_pfosmonograph_508.pdf (accessed on 22 April 2022).


| Reference # | Study Name/Location | Target Population | Sample Collection Period | # Study Participants |
|---|---|---|---|---|
| [12] | GenX Exposure Study | Residents ≥6 years of age in New Hanover County, NC, USA | 2017–2018 | 344 |
| [7] | Health Outcomes and Measures of the Environment (HOME) Study (pregnant women recruited) | Females of child-bearing age residing in Butler, Clermont, Hamilton, and Warren counties in Southwest Ohio | 2003–2005 | 336 |
| [14] | New Jersey Biomonitoring (NJBM) Study | New Jersey residents from 20 to 74 years of age | 2016–2018 | 1030 |
| [5] | NHANES | U.S. population | 2017–2018 | 1929 |
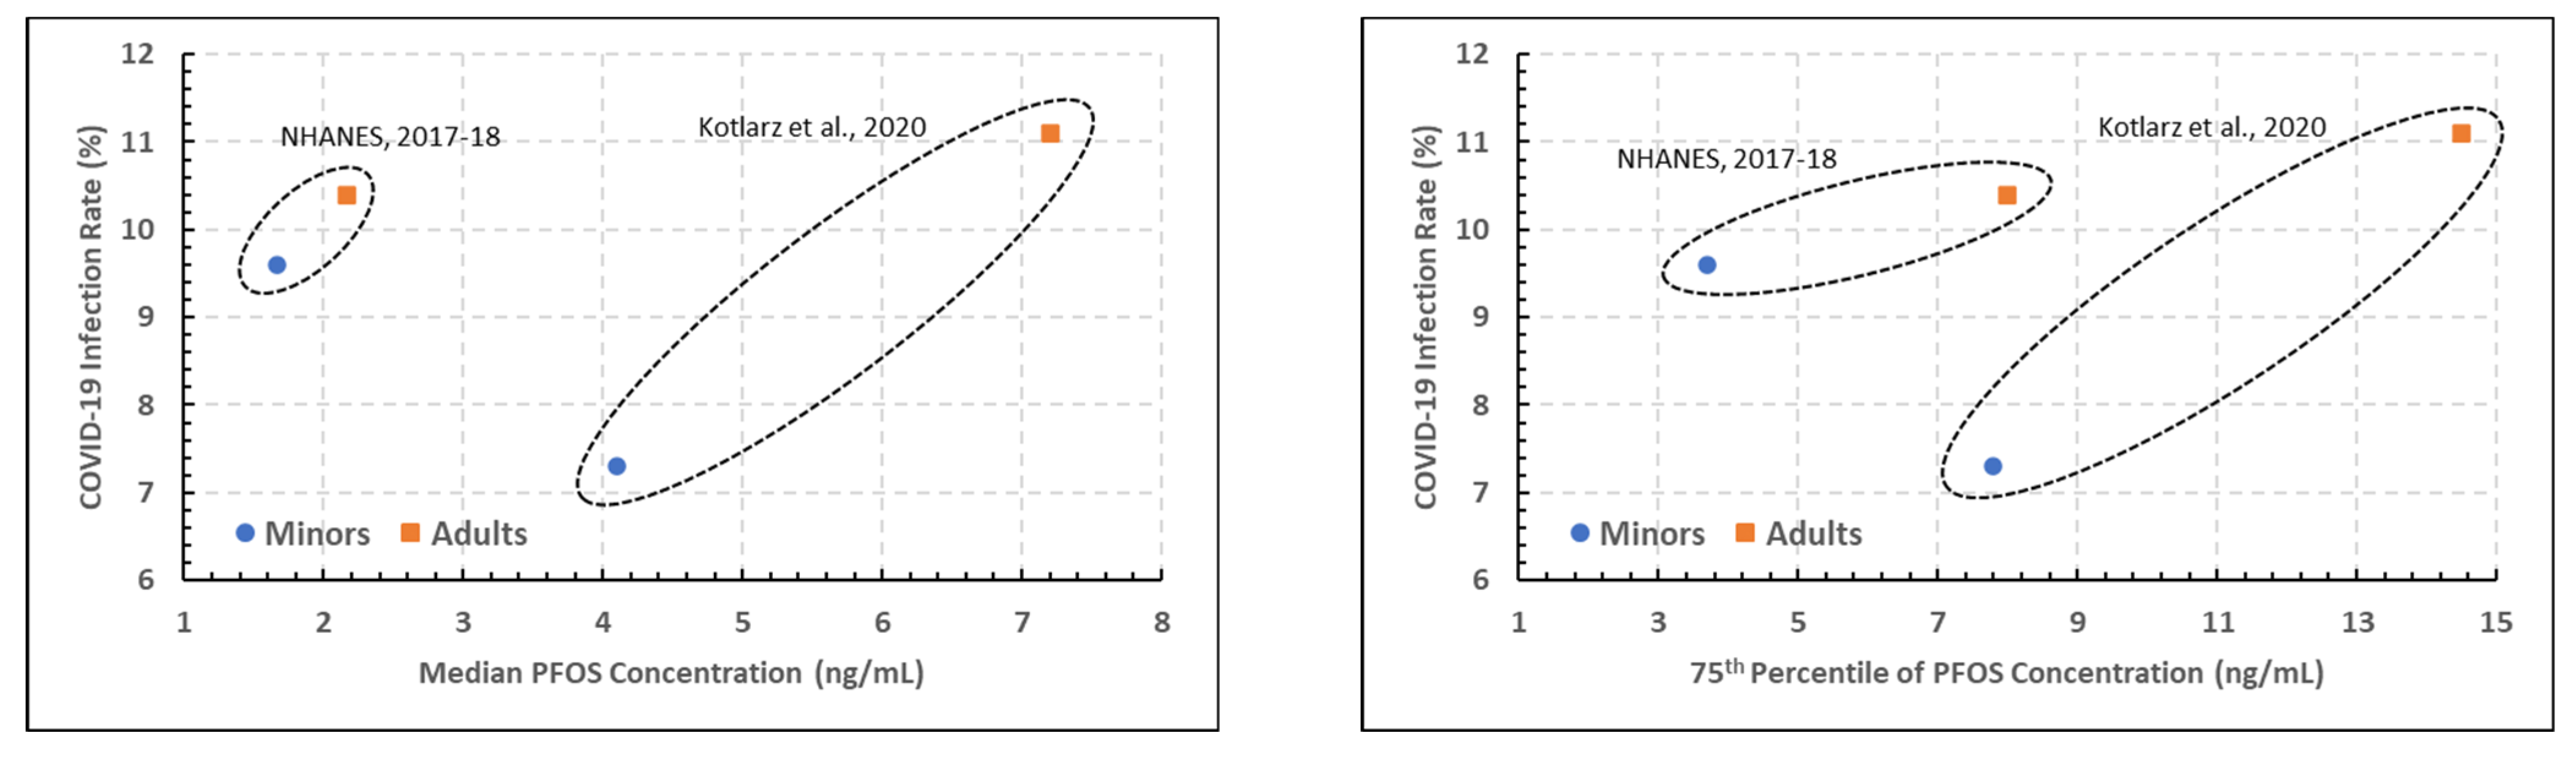
| Study (Reference #) | Age Group | Age Category or Median Age (years) | COVID-19 Incidence Rate | PFOA Concentration Percentiles (ng/mL) | PFOS Concentration Percentiles (ng/mL) | |||
|---|---|---|---|---|---|---|---|---|
| 50th | 75th | 50th | 75th | |||||
| [12] | NC | 06–17 years. | Youths | 7.3% | 3.00 | 5.10 | 4.10 | 7.8 |
| [12] | NC | 18+ years. | Adults | 11.1% | 4.80 | 9.40 | 7.20 | 14.5 |
| [5] | Nation | 12–19 years. | Youths | 9.6% | 1.17 | 2.60 | 1.67 | 3.7 |
| [5] | Nation | 20+ years. | Adults | 10.4% | 1.47 | 4.70 | 2.17 | 8.0 |
| [7] | OH | 18–24 years | 21 years | 14.0% | 6.10 | 7.80 | -- | -- |
| [7] | OH | 25–34 years | 29.5 years | 15.3% | 5.20 | 7.50 | -- | -- |
| [7] | OH | 35–49 years. | 42 years | 13.9% | 5.70 | 9.00 | -- | -- |
| [14] | NJ | 20–39 years. | 29.5 years | 13.7% | 1.89 | 2.35 | 2.67 | 3.70 |
| [14] | NJ | 40–59 years. | 49.5 years | 12.2% | 2.06 | 2.48 | 2.98 | 4.19 |
| [14] | NJ | 60–74 years. | 67 years | 9.9% | 2.50 | 3.29 | 4.46 | 6.12 |
Publisher’s Note: MDPI stays neutral with regard to jurisdictional claims in published maps and institutional affiliations. |
© 2022 by the authors. Licensee MDPI, Basel, Switzerland. This article is an open access article distributed under the terms and conditions of the Creative Commons Attribution (CC BY) license (https://creativecommons.org/licenses/by/4.0/).
Share and Cite
Dembek, Z.F.; Lordo, R.A. Influence of Perfluoroalkyl Substances on Occurrence of Coronavirus Disease 2019. Int. J. Environ. Res. Public Health 2022, 19, 5375. https://doi.org/10.3390/ijerph19095375
Dembek ZF, Lordo RA. Influence of Perfluoroalkyl Substances on Occurrence of Coronavirus Disease 2019. International Journal of Environmental Research and Public Health. 2022; 19(9):5375. https://doi.org/10.3390/ijerph19095375
Chicago/Turabian StyleDembek, Zygmunt F., and Robert A. Lordo. 2022. "Influence of Perfluoroalkyl Substances on Occurrence of Coronavirus Disease 2019" International Journal of Environmental Research and Public Health 19, no. 9: 5375. https://doi.org/10.3390/ijerph19095375
APA StyleDembek, Z. F., & Lordo, R. A. (2022). Influence of Perfluoroalkyl Substances on Occurrence of Coronavirus Disease 2019. International Journal of Environmental Research and Public Health, 19(9), 5375. https://doi.org/10.3390/ijerph19095375