
Gender Differences in the Factors Associated with Alcohol Binge Drinking: A Population-Based Analysis in a Latin American Country

 ,
,
Abstract
:1. Introduction
2. Materials and Methods
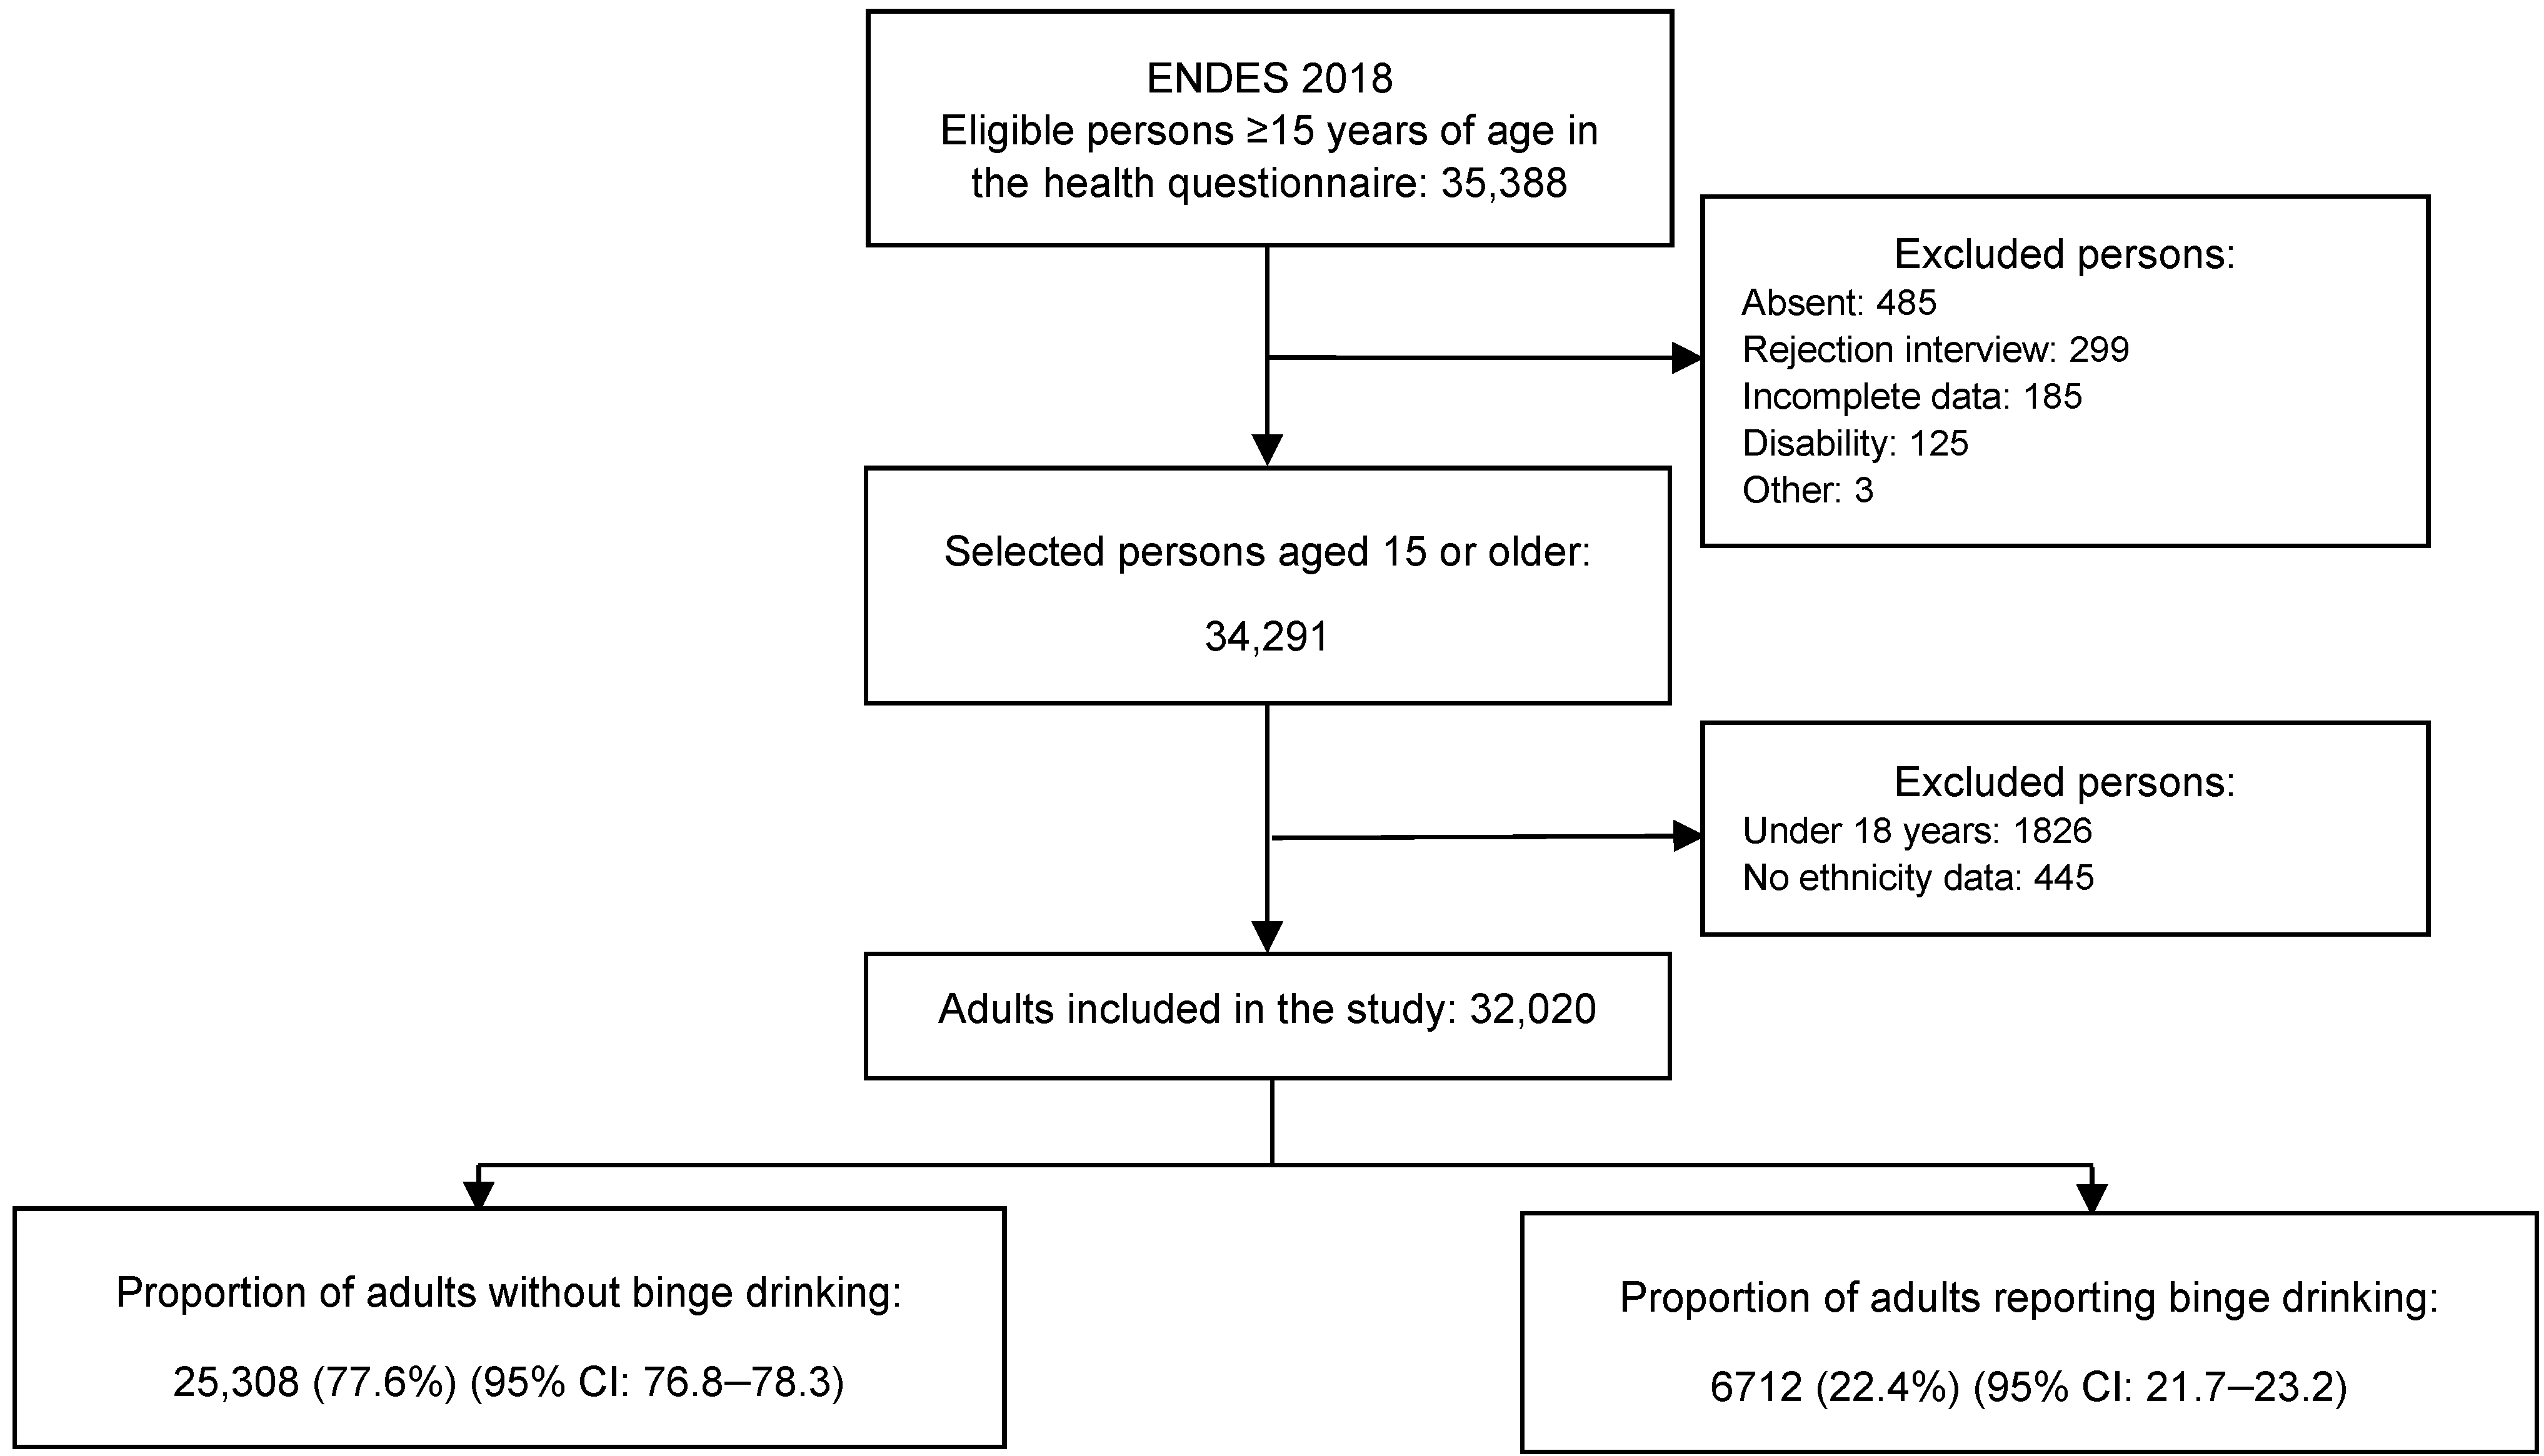
2.1. Design and Study Population
2.2. Variables and Measurements
2.3. Statistical Analysis
2.4. Ethical Considerations
3. Results
3.1. General Characteristics of the Study Sample
3.2. Binge Drinking Prevalence
3.3. Sociodemographic Characteristics and Binge Drinking
3.4. Health-Related Characteristics and Binge Drinking
4. Discussion
5. Conclusions
Author Contributions
Funding
Institutional Review Board Statement
Informed Consent Statement
Data Availability Statement
Acknowledgments
Conflicts of Interest
References
- World Health Organization. Global Status Report on Alcohol and Health 2018; World Health Organization: Geneva, Switzerland, 2018; Available online: https://www.who.int/publications/i/item/9789241565639 (accessed on 11 March 2022).
- Rehm, J.; Mathers, C.; Popova, S.; Thavorncharoensap, M.; Teerawattananon, Y.; Patra, J. Global burden of disease and injury and economic cost attributable to alcohol use and alcohol-use disorders. Lancet 2009, 373, 2223–2233. [Google Scholar] [CrossRef]
- Rehm, J.; Room, R.; Graham, K.; Monteiro, M.; Gmel, G.; Sempos, C.T. The relationship of average volume of alcohol consumption and patterns of drinking to burden of disease: An overview. Addiction 2003, 98, 1209–1228. [Google Scholar] [CrossRef]
- Popovici, I.; French, M.T. Binge drinking and sleep problems among young adults. Drug Alcohol Depend. 2013, 132, 207–215. [Google Scholar] [CrossRef] [PubMed] [Green Version]
- Miller, J.W.; Naimi, T.S.; Brewer, R.D.; Jones, S.E. Binge Drinking and Associated Health Risk Behaviors Among High School Students. Pediatrics 2007, 119, 76–85. [Google Scholar] [CrossRef] [PubMed]
- Siqueira, L.; Smith, V.C.; Levy, S.; Ammerman, S.D.; Gonzalez, P.K.; Ryan, S.A.; Committee on Substance Abuse. Binge drinking. Pediatrics 2015, 136, e718–e726. [Google Scholar] [CrossRef] [PubMed] [Green Version]
- Organización Panamericana de la Salud. Informe de Situación Regional Sobre el Alcohol y la Salud en las Américas. 2015. Available online: https://iris.paho.org/bitstream/handle/10665.2/7708/9789275318553_esp.pdf?sequence=1&isAllowed=y (accessed on 19 August 2020).
- Medina-Lezama, J.; Morey-Vargas, O.L.; Zea-Díaz, H.; Bolaños-Salazar, J.F.; Corrales-Medina, F.; Cuba-Bustinza, C.; Chirinos-Medina, D.A.; Chirinos, J.A. Prevalence of lifestyle-related cardiovascular risk factors in Peru: The prevencion study. Rev. Panam. Salud. Publica 2008, 24, 169–179. [Google Scholar] [CrossRef] [PubMed] [Green Version]
- Wolniczak, I.; Cáceres-DelAguila, J.A.; Maguiña, J.L.; Bernabe-Ortiz, A. Fruits and vegetables consumption and depressive symptoms: A population-based study in Peru. PLoS ONE 2017, 12, e0186379. [Google Scholar] [CrossRef] [Green Version]
- Ministerio de Salud. Advierten que Alcohol de Bajo Costo Podría Estar Adulterado con Metanol. 2010. Available online: https://www.gob.pe/institucion/minsa/noticias/37405-advierten-que-alcohol-de-bajo-costo-podria-estar-adulterado-con-metanol (accessed on 20 July 2020).
- Organización Panamericana de la Salud. Alcohol y Salud Pública en las Américas: Un Caso para la Acción. 2007. Available online: https://www.who.int/substance_abuse/publications/alcohol_public_health_americas_spanish.pdf?ua=1 (accessed on 13 September 2020).
- Ministerio de Salud. Carga de Enfermedad en el Perú: Estimación de los Años de Vida Saludables Perdidos 2016. 2018. Available online: https://www.dge.gob.pe/portal/docs/tools/Cargaenfermedad2016.pdf (accessed on 17 August 2020).
- Ramírez-Ubillus, J.M.; Vilela-Estrada, M.A.; Herrera-Arce, S.A.; Mejia-Morales, E.; Mejia, C.R. Consumption of traditional alcoholic beverages in children from a rural village in Northern Peru, 2017. F1000Res 2017, 6, 1270. [Google Scholar] [CrossRef] [Green Version]
- Esser, M.B.; Clayton, H.; Demissie, Z.; Kanny, D.; Brewer, R.D. Current and Binge Drinking Among High School Students—United States, 1991–2015. MMWR Morb. Mortal. Wkly. Rep. 2017, 66, 474–478. [Google Scholar] [CrossRef] [Green Version]
- Foster, K.T.; Hicks, B.M.; Iacono, W.G.; McGue, M. Alcohol use disorder in women: Risks and consequences of an adolescent onset and persistent course. Psychol. Addict. Behav. 2014, 28, 322–335. [Google Scholar] [CrossRef] [Green Version]
- Wang, C.; Xue, H.; Wang, Q.; Hao, Y.; Li, D.; Gu, D.; Huang, J. Effect of Drinking on All-Cause Mortality in Women Compared with Men: A Meta-Analysis. J. Women’s Health 2014, 23, 373–381. [Google Scholar] [CrossRef] [PubMed] [Green Version]
- Lee, J.-Y.; Ko, Y.-J.; Park, S. Factors associated with current smoking and heavy alcohol consumption among women of reproductive age: The Fourth Korean National Health and Nutrition Examination Survey 2007–2009. Public Health 2013, 127, 473–481. [Google Scholar] [CrossRef]
- Addila, A.E.; Bisetegn, T.A.; Gete, Y.K.; Mengistu, M.Y.; Beyene, G.M. Alcohol consumption and its associated factors among pregnant women in Sub-Saharan Africa: A systematic review and meta-analysis’ as given in the submission system. Subst. Abuse Treat. Prev. Policy 2020, 15, 29. [Google Scholar] [CrossRef] [PubMed] [Green Version]
- Erol, A.; Karpyak, V.M. Sex and gender-related differences in alcohol use and its consequences: Contemporary knowledge and future research considerations. Drug Alcohol Depend. 2015, 156, 1–13. [Google Scholar] [CrossRef] [PubMed]
- Míguez-Burbano, M.J.; Jackson, J., Jr. Alcohol and public health. Lancet 2005, 365, 1386–1387. [Google Scholar] [CrossRef]
- Almeida-Filho, N.; Lessa, I.; Magalhães, L.; Araújo, M.J.; Aquino, E.; Kawachi, I.; James, S.A. Alcohol drinking patterns by gender, ethnicity, and social class in Bahia, Brazil. Rev. Saúde Pública 2004, 38, 45–54. [Google Scholar] [CrossRef]
- Das, S.K.; Balakrishnan, V.; Vasudevan, D.M. Alcohol: Its health and social impact in India. Natl. Med. J. India 2006, 19, 94–99. [Google Scholar]
- Manthey, J.; Shield, K.D.; Rylett, M.; Hasan, O.S.M.; Probst, C.; Rehm, J. Global alcohol exposure between 1990 and 2017 and forecasts until 2030: A modelling study. Lancet 2019, 393, 2493–2502. [Google Scholar] [CrossRef]
- Instituto Nacional de Estadística e Informática. Ficha Técnica. 2019. Available online: https://proyectos.inei.gob.pe/endes/2018/documentos_2018/FICHA_TECNICA_ENDES_2018.pdf (accessed on 20 July 2020).
- The DHS Program. Measure DHS. 2020. Available online: https://dhsprogram.com/ (accessed on 19 August 2020).
- Hernández-Vásquez, A.; Chacón-Torrico, H. Manipulación, análisis y visualización de datos de la Encuesta Demográfica y de Salud Familiar con el programa R. Rev. Per. Med. Exp. Salud Publica 2019, 36, 128–133. [Google Scholar] [CrossRef] [Green Version]
- National Institute on Alcohol Abuse and Alcoholism. Alcohol Facts and Statistics. 2020. Available online: https://www.niaaa.nih.gov/publications/brochures-and-fact-sheets/alcohol-facts-and-statistics (accessed on 19 September 2020).
- Abel, W.D.; Weaver, S.; Ricketts-Roomes, T.; Agu, C.F.; Whitehorne-Smith, P.; Oshi, D.C.; Harrison, J.; Smith, K.; Mitchell, G.; Belinfante, A.; et al. Risk Factors Associated with Frequent Alcohol Binge Drinking among Jamaicans: Does Gender Matter? Asian Pac. J. Cancer Prev. 2018, 19, 39–44. [Google Scholar] [CrossRef]
- Vellios, N.G.; Van Walbeek, C.P. Self-reported alcohol use and binge drinking in South Africa: Evidence from the National Income Dynamics Study, 2014–2015. S. Afr. Med. J. 2017, 108, 33–39. [Google Scholar] [CrossRef] [PubMed] [Green Version]
- Parry, C.D.H.; Plüddemann, A.; Steyn, K.; Bradshaw, D.; Norman, R.; Laubscher, R. Alcohol use in South Africa: Findings from the first Demographic and Health Survey (1998). J. Stud. Alcohol 2005, 66, 91–97. [Google Scholar] [CrossRef] [PubMed]
- Shimotsu, S.T.; Jones-Webb, R.J.; Lytle, L.A.; MacLehose, R.F.; Nelson, T.; Forster, J.L. The Relationships among Socioeconomic Status, Fruit and Vegetable Intake, and Alcohol Consumption. Am. J. Health Promot. 2012, 27, 21–28. [Google Scholar] [CrossRef]
- Sunmola, A.M.; Sambo, M.N.; Afolabi, N.B.; Mayungbo, O.A.; Morakinyo, L.A. Association between Husband’s Alcohol Consumption and Women’s Physical Violence Experience in Nigeria: Moderating Role of Husband’s Controlling Attitudes. J. Fam. Violence 2020, 36, 371–381. [Google Scholar] [CrossRef]
- Nketiah-Amponsah, E.; Afful-Mensah, G.; Ampaw, S.; Codjoe, E. Alcohol Consumption Among Ghanaian Women of Child Bearing Age—What are the Correlates? Gend. Stud. 2017, 16, 134–148. [Google Scholar] [CrossRef] [Green Version]
- Kroenke, K.; Spitzer, R.L.; Williams, J.B. The PHQ-9: Validity of a brief depression severity measure. J. Gen. Intern. Med. 2001, 16, 606–613. [Google Scholar] [CrossRef]
- Instituto Nacional de Estadística e Informática. Población afiliada a algún seguro de salud. 2018. Available online: https://www.inei.gob.pe/media/MenuRecursivo/publicaciones_digitales/Est/Lib1587/libro01.pdf (accessed on 23 August 2020).
- Wilsnack, R.W.; Vogeltanz, N.D.; Wilsnack, S.C.; Harris, T.R. Gender differences in alcohol consumption and adverse drinking consequences: Cross-cultural patterns. Addiction 2000, 95, 251–265. [Google Scholar] [CrossRef]
- Chaiyasong, S.; Huckle, T.; Mackintosh, A.-M.; Meier, P.; Parry, C.D.H.; Callinan, S.; Cuong, P.V.; Kazantseva, E.; Gray-Phillip, G.; Parker, K.; et al. Drinking patterns vary by gender, age and country-level income: Cross-country analysis of the International Alcohol Control Study. Drug Alcohol Rev. 2018, 37, S53–S62. [Google Scholar] [CrossRef]
- Nutt, D.J.; King, L.A.; Phillips, L.D. Drug harms in the UK: A multicriteria decision analysis. Lancet 2010, 376, 1558–1565. [Google Scholar] [CrossRef]
- Bonomo, Y.; Norman, A.; Biondo, S.; Bruno, R.; Daglish, M.; Dawe, S.; Egerton-Warburton, D.; Karro, J.; Kim, C.; Lenton, S.; et al. The Australian drug harms ranking study. J. Psychopharmacol. 2019, 33, 759–768. [Google Scholar] [CrossRef]
- Van Amsterdam, J.; Nutt, D.; Phillips, L.; van den Brink, W. European rating of drug harms. J. Psychopharmacol. 2015, 29, 655–660. [Google Scholar] [CrossRef]
- Rehm, J.; Gmel, G.E.; Gmel, G.; Hasan, O.S.M.; Imtiaz, S.; Popova, S.; Probst, C.; Roerecke, M.; Room, R.; Samokhvalov, A.V.; et al. The relationship between different dimensions of alcohol use and the burden of disease—An update. Addiction 2017, 112, 968–1001. [Google Scholar] [CrossRef] [PubMed] [Green Version]
- Ministerio de Salud (2017) Documento Técnico: Situación de Salud de los Adolescentes y Jóvenes en el Perú. 2017. Available online: http://bvs.minsa.gob.pe/local/MINSA/4143.pdf (accessed on 11 March 2022).
- Taype-Rondan, A.; Bernabe-Ortiz, A.; Alvarado, G.F.; Gilman, R.H.; Smeeth, L.; Miranda, J.J. Smoking and heavy drinking patterns in rural, urban and rural-to-urban migrants: The PERU MIGRANT Study. BMC Public Health 2017, 17, 165. [Google Scholar] [CrossRef] [PubMed] [Green Version]
- Jefferis, B.J.M.H.; Manor, O.; Power, C. Social gradients in binge drinking and abstaining: Trends in a cohort of British adults. J. Epidemiol. Commun. Health 2007, 61, 150–153. [Google Scholar] [CrossRef] [Green Version]
- Castro, D.S.; Sanchez, Z.M.; Zaleski, M.; Alves, H.N.P.; Pinsky, I.; Caetano, R.; Laranjeira, R.R. Sociodemographic characteristics associated with binge drinking among Brazilians. Drug Alcohol Depend. 2012, 126, 272–276. [Google Scholar] [CrossRef]
- Lim, W.-Y.; Subramaniam, M.; Abdin, E.; He, V.Y.; Vaingankar, J.; Chong, S.A. Lifetime and twelve-month prevalence of heavy-drinking in Singapore: Results from a representative cross-sectional study. BMC Public Health 2013, 13, 1–11. [Google Scholar] [CrossRef] [Green Version]
- Probst, C.; Manthey, J.; Rehm, J. Understanding the prevalence of lifetime abstinence from alcohol: An ecological study. Drug Alcohol Depend. 2017, 178, 126–129. [Google Scholar] [CrossRef] [PubMed]
- Heckley, G.; Jarl, J.; Gerdtham, U.-G. Frequency and intensity of alcohol consumption: New evidence from Sweden. Eur. J. Health Econ. 2017, 18, 495–517. [Google Scholar] [CrossRef] [Green Version]
- Lewer, D.; Meier, P.; Beard, E.; Boniface, S.; Kaner, E. Unravelling the alcohol harm paradox: A population-based study of social gradients across very heavy drinking thresholds. BMC Public Health 2016, 16, 599. [Google Scholar] [CrossRef] [Green Version]
- Collins, S.E. Associations Between Socioeconomic Factors and Alcohol Outcomes. Alcohol Res. 2016, 38, 83–94. [Google Scholar]
- Pham, C.V.; Tran, H.T.D.; Tran, N.T. Alcohol Consumption and Binge Drinking Among Adult Population: Evidence from the CHILILAB Health and Demographic Surveillance System in Vietnam. J. Public Health Manag. Pr. 2018, 24 (Suppl. 2), S67–S73. [Google Scholar] [CrossRef]
- Noronha, B.P.; Nascimento-Souza, M.A.; Lima-Costa, M.F.; Peixoto, S.V. Alcohol consumption patterns and associated factors among elderly Brazilians: National Health Survey (2013). Cien. Saude Colet. 2019, 24, 4171–4180. [Google Scholar] [CrossRef] [Green Version]
- Murakami, K.; Murakami, K.; Hashimoto, H.; Hashimoto, H.; Murakami, K.; Murakami, K.; Hashimoto, H.; Hashimoto, H. Associations of education and income with heavy drinking and problem drinking among men: Evidence from a population-based study in Japan. BMC Public Health 2019, 19, 420. [Google Scholar] [CrossRef] [PubMed]
- Platt, A.; Sloan, F.A.; Costanzo, P. Alcohol-Consumption Trajectories and Associated Characteristics Among Adults Older Than Age 50. J. Stud. Alcohol Drugs 2010, 71, 169–179. [Google Scholar] [CrossRef] [PubMed] [Green Version]
- Centers for Disease Control and Prevention. Sociodemographic differences in binge drinking among adults—14 States, 2004. MMWR Morb. Mortal. Wkly. Rep. 2009, 58, 301–304. [Google Scholar]
- Witbrodt, J.; Mulia, N.; Zemore, S.E.; Kerr, W.C. Racial/Ethnic Disparities in Alcohol-Related Problems: Differences by Gender and Level of Heavy Drinking. Alcohol. Clin. Exp. Res. 2014, 38, 1662–1670. [Google Scholar] [CrossRef] [Green Version]
- Chung, W.; Lim, S.; Lee, S. Why is high-risk drinking more prevalent among men than women? Evidence from South Korea. BMC Public Health 2012, 12, 1–11. [Google Scholar] [CrossRef] [Green Version]
- Uecker, J.E. Marriage and Mental Health among Young Adults. J. Health Soc. Behav. 2012, 53, 67–83. [Google Scholar] [CrossRef]
- Peltzer, K.; Pengpid, S. Concurrent Tobacco Use and Binge Drinking Among University Students in 30 Countries in Africa, Asia, Latin America, and the Caribbean. Int. J. Ment. Health Addict. 2018, 16, 164–174. [Google Scholar] [CrossRef]
- Yi, S.; Ngin, C.; Peltzer, K.; Pengpid, S. Health and behavioral factors associated with binge drinking among university students in nine ASEAN countries. Subst. Abuse Treat. Prev. Policy 2017, 12, 32. [Google Scholar] [CrossRef] [Green Version]
- Prabhu, P.; Raavi, A.; Srinivas, R.; Vishwanathan, K. Factors influencing alcohol and tobacco addiction among patients attending a de-addiction Centre, South India. J. Int. Soc. Prev. Community Dent. 2014, 4, 103–107. [Google Scholar] [CrossRef] [PubMed] [Green Version]
- Fazzino, T.L.; Fleming, K.; Sher, K.J.; Sullivan, D.K.; Befort, C. Heavy Drinking in Young Adulthood Increases Risk of Transitioning to Obesity. Am. J. Prev. Med. 2017, 53, 169–175. [Google Scholar] [CrossRef] [PubMed]


| Characteristics | Total (n = 32,020) | Men | Women | |||
|---|---|---|---|---|---|---|
| n | Weighted Proportion * | n | Weighted Proportion * | n | Weighted Proportion * | |
| Sample size: | 32,020 | 100 | 13,712 | 100 | 18,308 | 100 |
| Age groups, years: | ||||||
| 18–24 | 4613 | 16.5 (15.8–17.2) | 1729 | 16.8 (15.7–17.8) | 2884 | 16.2 (15.3–17.0) |
| 25–44 | 16,776 | 42.6 (41.7–43.5) | 7063 | 42.8 (41.5–44.1) | 9713 | 42.4 (41.4–43.5) |
| 45–59 | 5757 | 22.6 (21.8–23.4) | 2717 | 22.6 (21.4–23.7) | 3040 | 22.6 (21.5–23.7) |
| 60 or more | 4874 | 18.4 (17.7–19.1) | 2203 | 17.9 (16.9–19.0) | 2671 | 18.8 (17.9–19.8) |
| Natural regions: | ||||||
| Amazon | 7321 | 11.9 (11.3–12.5) | 3210 | 12.3 (11.6–13.1) | 4111 | 11.5 (10.9–12.2) |
| Andean | 11,660 | 24.8 (23.9–25.8) | 4874 | 24.3 (23.2–25.5) | 6786 | 25.2 (24.1–26.3) |
| Coast | 13,039 | 63.3 (62.4–64.2) | 5628 | 63.3 (62.1–64.5) | 7411 | 63.3 (62.2–64.3) |
| Area: | ||||||
| Urban | 21,043 | 80.8 (80.3–81.3) | 8833 | 80.4 (79.6–81.2) | 12,210 | 81.1 (80.5–81.8) |
| Rural | 10,977 | 19.2 (18.7–19.7) | 4879 | 19.6 (18.8–20.4) | 6098 | 18.9 (18.2–19.5) |
| Ethnicity: | ||||||
| Non-native | 17,477 | 64.0 (63.1–64.8) | 7468 | 63.4 (62.2–64.6) | 10,009 | 64.6 (63.5–65.5) |
| Native | 11,742 | 26.7 (26.0–27.5) | 4993 | 26.8 (25.7–28.0) | 6749 | 27.7 (25.8–27.7) |
| Afro-Peruvian | 2801 | 9.3 (8.7–9.8) | 1251 | 9.8 (9.1–10.5) | 1550 | 8.8 (8.1–9.4) |
| Marital status: | ||||||
| Never married | 4345 | 17.3 (16.6–18.1) | 2197 | 19.9 (18.8–21.0) | 2148 | 14.9 (14.0–15.8) |
| Married/Cohabiting | 22,597 | 66.0 (65.1–66.8) | 10,214 | 69.6 (68.3–70.8) | 12,383 | 62.6 (61.4–63.7) |
| Separated/Divorced/Widowed | 5078 | 16.7 (16.1–17.4) | 1301 | 10.5 (9.7–11.4) | 3777 | 22.6 (21.5–23.6) |
| Education level: | ||||||
| No formal school | 1717 | 4.2 (3.9–4.5) | 278 | 1.6 (1.4–2.0) | 1439 | 6.6 (6.1–7.1) |
| Primary | 8036 | 20.6 (10.0–21.3) | 3243 | 18.2 (17.3–19.1) | 4793 | 22.9 (22.1–23.8) |
| Secondary | 12,842 | 40.6 (39.7–41.4) | 6009 | 44.0 (42.6–45.3) | 6833 | 37.4 (36.3–38.5) |
| Higher | 9425 | 34.6 (33.7–35.5) | 4182 | 36.2 (34.8–37.5) | 5243 | 33.1 (32.0–34.2) |
| Wealth Index: | ||||||
| Poorest | 10,121 | 18.2 (17.7–18.8) | 4412 | 18.3 (17.5–19.1) | 5709 | 18.2 (17.5–18.9) |
| Poorer | 7903 | 20.4 (19.7–21.2) | 3388 | 21.1 (20.0–22.2) | 4515 | 19.8 (18.9–20.7) |
| Middle | 5938 | 20.8 (20.1–21.6) | 2469 | 20.3 (19.3–21.4) | 3469 | 21.3 (20.3–22.4) |
| Richer | 4615 | 20.6 (19.8–21.4) | 1992 | 21.0 (19.9–22.3) | 2623 | 20.2 (19.2–21.2) |
| Richest | 3443 | 19.9 (19.0–20.8) | 1451 | 19.3 (18.0–20.6) | 1992 | 20.5 (19.5–21.6) |
| Health insurance: | ||||||
| Yes | 24,367 | 72.7 (71.8–73.5) | 9675 | 68.2 (67.0–69.5) | 14,692 | 76.9 (75.8–77.9) |
| No | 7653 | 27.3 (26.5–28.2) | 4037 | 31.8 (30.5–33.0) | 3616 | 23.1 (22.1–24.2) |
| Smoked cigarettes in the last 30 days: | ||||||
| No | 28,724 | 88.3 (87.6–88.9) | 10,995 | 80.9 (79.8–82.0) | 17,729 | 95.2 (94.6–95.7) |
| Yes | 3296 | 11.7 (11.1–12.4) | 2717 | 19.1 (18.0–20.2) | 579 | 4.8 (4.3–5.4) |
| Fruits and vegetables 5 or more: | ||||||
| No | 29,036 | 88.9 (88.3–89.5) | 12,573 | 89.9 (89.1–90.7) | 16,463 | 87.9 (87.1–88.7) |
| Yes | 2984 | 11.1 (10.5–11.7) | 1139 | 10.1 (9.3–10.9) | 1845 | 12.1 (11.3–12.9) |
| PHQ-9 5 or more: | ||||||
| No | 25,150 | 79.6 (78.9–80.3) | 11,599 | 85.6 (84.7–86.5) | 13,551 | 73.9 (72.9–75.0) |
| Yes | 6870 | 20.4 (19.7–21.1) | 2113 | 14.4 (13.5–15.3) | 4757 | 26.1 (25.0–27.1) |
| Body mass index: | ||||||
| Thinness to Normal | 12,157 | 36.1 (35.3–37.0) | 5902 | 39.1 (37.8–40.4) | 6255 | 33.4 (32.3–34.5) |
| Overweight | 12,586 | 39.3 (38.4–40.2) | 5366 | 39.8 (38.5–41.1) | 7220 | 38.8 (37.7–39.9) |
| Obesity | 7277 | 24.6 (23.8–25.4) | 2444 | 21.1 (20.1–22.2) | 4833 | 27.8 (26.8–28.9) |
| Hypertension: ** | ||||||
| No | 26,310 | 78.7 (78.0–79.5) | 10,805 | 76.5 (75.3–77.6) | 15,505 | 80.9 (79.9–81.8) |
| Yes | 5710 | 21.3 (20.5–22.0) | 2907 | 23.5 (22.4–24.7) | 2803 | 19.1 (18.2–20.1) |
| Diabetes history: | ||||||
| No | 31,097 | 96.2 (95.8–96.5) | 13,333 | 96.5 (95.9–97.0) | 17,769 | 95.9 (95.4–96.4) |
| Yes | 923 | 3.8 (3.5–4.2) | 379 | 3.5 (3.0–4.1) | 544 | 4.1 (3.6–4.6) |
| Characteristics | Men | p Value | Women | |||
|---|---|---|---|---|---|---|
| No (Weighted Proportion *) | Yes (Weighted Proportion *) | No (Weighted Proportion *) | Yes (Weighted Proportion *) | p Value ** | ||
| Overall | 67.4 (66.2–68.6) | 32.6 (31.4–33.8) | 87.2 (86.4–88.0) | 12.8 (12.0–13.6) | ||
| Age groups, years: | ||||||
| 18–24 | 69.7 (66.5–72.7) | 30.3 (27.3–33.5) | <0.001 | 84.4 (82.1–86.5) | 15.6 (13.5–17.9) | <0.001 |
| 25–44 | 59.3 (57.6–61.0) | 40.7 (39.0–42.4) | 84.3 (83.2–85.5) | 15.7 (14.5–16.8) | ||
| 45–59 | 69.1 (66.5–71.7) | 30.9 (28.3–33.5) | 86.8 (84.7–88.6) | 13.2 (11.4–15.3) | ||
| 60 or more | 82.4 (79.9–84.6) | 17.6 (15.4–20.1) | 96.8 (95.6–97.6) | 3.2 (2.4–4.4) | ||
| Natural regions: | ||||||
| Amazon | 67.2 (65.0–69.3) | 32.8 (30.7–35.0) | <0.001 | 90.4 (89.2–91.5) | 9.6 (8.5–10.8) | <0.001 |
| Andean | 69.3 (67.4–71.2) | 30.7 (28.8–32.6) | 89.6 (88.5–90.7) | 10.4 (9.3–11.5) | ||
| Coast | 66.7 (64.9–68.3) | 33.3 (31.7–35.1) | 85.7 (84.5–86.9) | 14.3 (13.1–15.5) | ||
| Area: | ||||||
| Urban | 66.0 (64.5–67.4) | 34.0 (32.6–35.5) | <0.001 | 85.7 (84.7–86.6) | 14.3 (13.4–15.3) | <0.001 |
| Rural | 73.3 (71.4–75.0) | 26.7 (25.0–28.6) | 93.9 (93.0–94.7) | 6.1 (5.3–7.0) | ||
| Ethnicity: | ||||||
| Non-native | 66.0 (64.3–67.6) | 34.0 (32.4–35.7) | <0.001 | 86.7 (85.7–87.7) | 13.3 (12.3–14.3) | 0.021 |
| Native | 70.6 (68.5–72.5) | 29.4 (27.5–31.5) | 88.9 (87.6–90.1) | 11.1 (9.9–12.4) | ||
| Afro-Peruvian | 67.6 (63.8–71.1) | 32.4 (28.9–36.2) | 86.1 (83.4–88.5) | 13.9 (11.5–16.6) | ||
| Marital status: | ||||||
| Never married | 66.8 (63.8–69.5) | 33.2 (30.5–36.2) | 0.002 | 82.2 (79.5–84.7) | 17.8 (15.3–20.5) | <0.001 |
| Married/Cohabiting | 66.6 (65.2–67.9) | 33.4 (32.1–34.8) | 88.1 (87.1–89.0) | 11.9 (11.0–12.9) | ||
| Separated/Divorced/Widowed | 73.9 (70.2–77.3) | 26.1 (22.7–29.8) | 88.3 (86.4–89.9) | 11.7 (10.1–13.6) | ||
| Education level: | ||||||
| No formal school | 90.0 (85.1–93.4) | 10.0 (6.6–14.9) | <0.001 | 96.9 (95.4–97.9) | 3.1 (2.1–4.6) | <0.001 |
| Primary | 77.1 (74.8–79.2) | 22.9 (20.8–25.2) | 92.8 (91.5–93.9) | 7.2 (6.1–8.5) | ||
| Secondary | 66.0 (64.2–67.8) | 34.0 (32.2–35.8) | 85.8 (84.4–87.2) | 14.2 (12.8–15.6) | ||
| Higher | 63.2 (61.0–65.3) | 36.8 (34.7–39.0) | 83.1 (81.5–84.6) | 16.9 (15.4–18.5) | ||
| Wealth Index: | ||||||
| Poorest | 75.2 (73.3–77.0) | 24.8 (23.0–26.7) | <0.001 | 95.0 (94.1–95.7) | 5.0 (4.3–5.9) | <0.001 |
| Poorer | 67.5 (65.0–69.8) | 32.5 (30.2–35.0) | 90.1 (88.8–91.3) | 9.9 (8.7–11.2) | ||
| Middle | 68.3 (65.6–70.9) | 31.7 (29.1–34.4) | 87.3 (85.6–88.8) | 12.7 (11.2–14.4) | ||
| Richer | 64.1 (61.2–66.8) | 35.9 (33.2–38.8) | 82.3 (80.1–84.3) | 17.7 (15.7–19.9) | ||
| Richest | 62.5 (58.8–66.0) | 37.5 (34.0–41.2) | 82.5 (80.2–84.6) | 17.5 (15.4–19.8) | ||
| Health insurance: | ||||||
| Yes | 69.3 (67.8–70.7) | 30.7 (29.3–32.2) | <0.001 | 88.3 (87.5–89.1) | 11.7 (10.9–12.5) | <0.001 |
| No | 63.4 (61.2–65.5) | 36.6 (34.5–38.8) | 83.7 (81.7–85.5) | 16.3 (14.5–18.3) | ||
| Smoked cigarettes in the last 30 days: | ||||||
| No | 73.2 (71.9–74.4) | 26.8 (25.6–28.1) | <0.001 | 88.8 (88.0–89.5) | 11.2 (10.5–12.0) | <0.001 |
| Yes | 42.9 (40.0–45.9) | 57.1 (54.1–60.0) | 56.5 (50.4–62.4) | 43.5 (37.6–49.6) | ||
| Fruits and vegetables 5 or more: | ||||||
| No | 67.4 (66.1–68.6) | 32.6 (31.4–33.9) | 0.969 | 87.3 (86.4–88.1) | 12.7 (11.9–13.6) | 0.874 |
| Yes | 67.5 (63.4–71.3) | 32.5 (28.7–36.6) | 87.1 (84.7–89.1) | 12.9 (10.9–15.3) | ||
| PHQ-9 5 or more: | ||||||
| No | 67.1 (65.8–68.4) | 32.9 (31.6–34.2) | 0.332 | 87.3 (86.4–88.2) | 12.7 (11.8–13.6) | 0.687 |
| Yes | 68.8 (65.7–71.8) | 31.2 (28.2–34.3) | 87.0 (85.3–88.5) | 13.0 (11.5–14.7) | ||
| BMI: | ||||||
| Thinness to Normal | 73.3 (71.7–75.0) | 26.7 (25.0–28.3) | <0.001 | 90.4 (89.3–91.5) | 9.6 (8.5–10.7) | <0.001 |
| Overweight | 65.6 (63.6–67.5) | 34.4 (32.5–36.4) | 86.5 (85.2–87.8) | 13.5 (12.2–14.8) | ||
| Obesity | 59.7 (56.8–62.5) | 40.3 (37.5–43.2) | 84.4 (82.7–86.0) | 15.6 (14.0–17.3) | ||
| Hypertension: *** | ||||||
| No | 67.0 (65.6–68.3) | 33.0 (31.7–34.4) | 0.235 | 86.1 (85.2–87.0) | 13.9 (13.0–14.8) | <0.001 |
| Yes | 68.7 (66.2–71.1) | 31.3 (28.9–33.8) | 91.9 (90.3–93.3) | 8.1 (6.7–9.7) | ||
| Diabetes history: | ||||||
| No | 67.2 (65.9–68.4) | 32.8 (31.6–34.1) | 0.068 | 87.2 (86.3–87.9) | 12.8 (12.1–13.7) | 0.315 |
| Yes | 73.8 (66.7–79.9) | 26.2 (20.1–33.3) | 89.5 (84.7–92.9) | 10.5 (7.1–15.3) | ||
| Characteristics | Men | Women | ||||||
|---|---|---|---|---|---|---|---|---|
| Crude Model * | Adjusted Model * | Crude Model * | Adjusted Model * | |||||
| PR (95% CI) | p-Value | aPR (95% CI) | p-Value | PR (95% CI) | p-Value | aPR (95% CI) | p-Value | |
| Age groups, years: | ||||||||
| 18–24 | Ref. | Ref. | Ref. | Ref. | ||||
| 25–44 | 1.34 (1.20–1.50) | <0.001 | 1.28 (1.14–1.45) | <0.001 | 1.01 (0.86–1.18) | 0.936 | 1.03 (0.88–1.22) | 0.699 |
| 45–59 | 1.02 (0.89–1.16) | 0.797 | 1.03 (0.89–1.19) | 0.686 | 0.85 (0.70–1.04) | 0.105 | 0.84 (0.68–1.02) | 0.085 |
| 60 or more | 0.58 (0.49–0.69) | <0.001 | 0.70 (0.58–0.84) | <0.001 | 0.21 (0.15–0.29) | <0.001 | 0.24 (0.17–0.34) | <0.001 |
| Natural regions: | ||||||||
| Amazon | Ref. | No include | Ref. | Ref. | ||||
| Andean | 0.93 (0.85–1.02) | 0.145 | 1.09 (0.92–1.28) | 0.32 | 1.05 (0.89–1.23) | 0.564 | ||
| Coast | 1.02 (0.94–1.10) | 0.696 | 1.49 (1.29–1.72) | <0.001 | 0.88 (0.76–1.02) | 0.09 | ||
| Area: | ||||||||
| Urban | Ref. | Ref. | Ref. | Ref. | ||||
| Rural | 0.79 (0.72–0.85) | <0.001 | 1.06 (0.95–1.17) | 0.302 | 0.43 (0.37–0.50) | <0.001 | 0.95 (0.78–1.16) | 0.613 |
| Ethnicity: | ||||||||
| Non-native | Ref. | Ref. | Ref. | Ref. | ||||
| Native | 0.87 (0.79–0.94) | 0.001 | 0.96 (0.89–1.05) | 0.392 | 0.83 (0.73–0.95) | 0.008 | 1.08 (0.94–1.24) | 0.26 |
| Afro-Peruvian | 0.95 (0.84–1.08) | 0.455 | 1.03 (0.92–1.16) | 0.563 | 1.04 (0.86–1.27) | 0.675 | 1.26 (1.04–1.53) | 0.018 |
| Marital status: | ||||||||
| Never married | Ref. | Ref. | Ref. | Ref. | ||||
| Married/Cohabiting | 1.01 (0.91–1.11) | 0.911 | 1.05 (0.94–1.16) | 0.399 | 0.67 (0.57–0.79) | <0.001 | 0.81 (0.69–0.96) | 0.014 |
| Separated/Divorced/Widowed | 0.78 (0.67–0.92) | 0.002 | 1.03 (0.88–1.21) | 0.686 | 0.66 (0.54–0.81) | <0.001 | 1.03 (0.85–1.25) | 0.77 |
| Education level: | ||||||||
| No formal school | Ref. | Ref. | Ref. | Ref. | ||||
| Primary | 2.30 (1.52–3.47) | <0.001 | 1.76 (1.17–2.63) | 0.006 | 2.33 (1.52–3.57) | <0.001 | 1.22 (0.79–1.88) | 0.378 |
| Secondary | 3.41 (2.26–5.14) | <0.001 | 2.01 (1.34–3.02) | 0.001 | 4.57 (3.03–6.89) | <0.001 | 1.47 (0.95–2.27) | 0.084 |
| Higher | 3.69 (2.44–5.57) | <0.001 | 2.04 (1.35–3.08) | 0.001 | 5.45 (3.61–8.24) | <0.001 | 1.41 (0.90–2.22) | 0.132 |
| Wealth Index: | ||||||||
| Poorest | Ref. | Ref. | Ref. | Ref. | ||||
| Poorer | 1.31 (1.19–1.45) | <0.001 | 1.16 (1.04–1.31) | 0.009 | 1.96 (1.61–2.38) | <0.001 | 1.57 (1.27–1.94) | <0.001 |
| Middle | 1.28 (1.14–1.43) | <0.001 | 1.08 (0.94–1.25) | 0.293 | 2.52 (2.07–3.07) | <0.001 | 1.99 (1.55–2.55) | <0.001 |
| Richer | 1.45 (1.30–1.61) | <0.001 | 1.23 (1.06–1.42) | 0.007 | 3.51 (2.82–4.26) | <0.001 | 2.82 (2.17–3.66) | <0.001 |
| Richest | 1.51 (1.34–1.71) | <0.001 | 1.30 (1.11–1.53) | 0.001 | 3.47 (2.84–4.22) | <0.001 | 2.74 (2.08–3.61) | <0.001 |
| Health insurance: | ||||||||
| Yes | Ref. | Ref. | Ref. | Ref. | ||||
| No | 1.19 (1.10–1.29) | <0.001 | 1.12 (1.04–1.21) | 0.002 | 1.40 (1.22–1.60) | <0.001 | 1.14 (1.00–1.30) | 0.047 |
| Smoked cigarettes in the last 30 days: | ||||||||
| No | Ref. | Ref. | Ref. | Ref. | ||||
| Yes | 2.13 (1.98–2.28) | <0.001 | 1.96 (1.83–2.10) | <0.001 | 3.88 (3.33–4.52) | <0.001 | 2.87 (2.46–3.35) | <0.001 |
| Fruits and vegetables 5 or more: | ||||||||
| No | Ref. | No include | Ref. | No include | ||||
| Yes | 1.00 (0.88–1.13) | 0.969 | 1.01 (0.85–1.22) | 0.874 | ||||
| PHQ-9 5 or more: | ||||||||
| No | Ref. | No include | Ref. | No include | ||||
| Yes | 0.95 (0.85–1.06) | 0.336 | 1.03 (0.89–1.19) | 0.686 | ||||
| BMI: | ||||||||
| Thinness to Normal | Ref. | Ref. | Ref. | Ref. | ||||
| Overweight | 1.29 (1.18–1.41) | <0.001 | 1.12 (1.03–1.22) | 0.006 | 1.41 (1.21–1.64) | <0.001 | 1.30 (1.12–1.50) | <0.001 |
| Obesity | 1.51 (1.38–1.66) | <0.001 | 1.22 (1.11–1.34) | <0.001 | 1.63 (1.40–1.90) | <0.001 | 1.50 (1.28–1.76) | <0.001 |
| Hypertension: ** | ||||||||
| No | Ref. | No include | Ref. | Ref. | ||||
| Yes | 0.95 (0.87–1.04) | 0.238 | 0.58 (0.48–0.71) | <0.001 | 0.91 (0.75–1.11) | 0.349 | ||
| Diabetes history: | ||||||||
| No | Ref. | No include | Ref. | No include | ||||
| Yes | 0.80 (0.62–1.03) | 0.082 | 0.82 (0.55–1.21) | 0.321 | ||||
Publisher’s Note: MDPI stays neutral with regard to jurisdictional claims in published maps and institutional affiliations. |
© 2022 by the authors. Licensee MDPI, Basel, Switzerland. This article is an open access article distributed under the terms and conditions of the Creative Commons Attribution (CC BY) license (https://creativecommons.org/licenses/by/4.0/).
Share and Cite
Hernández-Vásquez, A.; Chacón-Torrico, H.; Vargas-Fernández, R.; Grendas, L.N.; Bendezu-Quispe, G. Gender Differences in the Factors Associated with Alcohol Binge Drinking: A Population-Based Analysis in a Latin American Country. Int. J. Environ. Res. Public Health 2022, 19, 4931. https://doi.org/10.3390/ijerph19094931
Hernández-Vásquez A, Chacón-Torrico H, Vargas-Fernández R, Grendas LN, Bendezu-Quispe G. Gender Differences in the Factors Associated with Alcohol Binge Drinking: A Population-Based Analysis in a Latin American Country. International Journal of Environmental Research and Public Health. 2022; 19(9):4931. https://doi.org/10.3390/ijerph19094931
Chicago/Turabian StyleHernández-Vásquez, Akram, Horacio Chacón-Torrico, Rodrigo Vargas-Fernández, Leandro Nicolás Grendas, and Guido Bendezu-Quispe. 2022. "Gender Differences in the Factors Associated with Alcohol Binge Drinking: A Population-Based Analysis in a Latin American Country" International Journal of Environmental Research and Public Health 19, no. 9: 4931. https://doi.org/10.3390/ijerph19094931
APA StyleHernández-Vásquez, A., Chacón-Torrico, H., Vargas-Fernández, R., Grendas, L. N., & Bendezu-Quispe, G. (2022). Gender Differences in the Factors Associated with Alcohol Binge Drinking: A Population-Based Analysis in a Latin American Country. International Journal of Environmental Research and Public Health, 19(9), 4931. https://doi.org/10.3390/ijerph19094931