
Electrochemical Oxidation of Methyl Orange in an Active Carbon Packed Electrode Reactor (ACPER): Degradation Performance and Kinetic Simulation


Abstract
:1. Introduction
2. Materials and Methods
2.1. Reagents and Materials
2.2. Electrochemical Properties Test
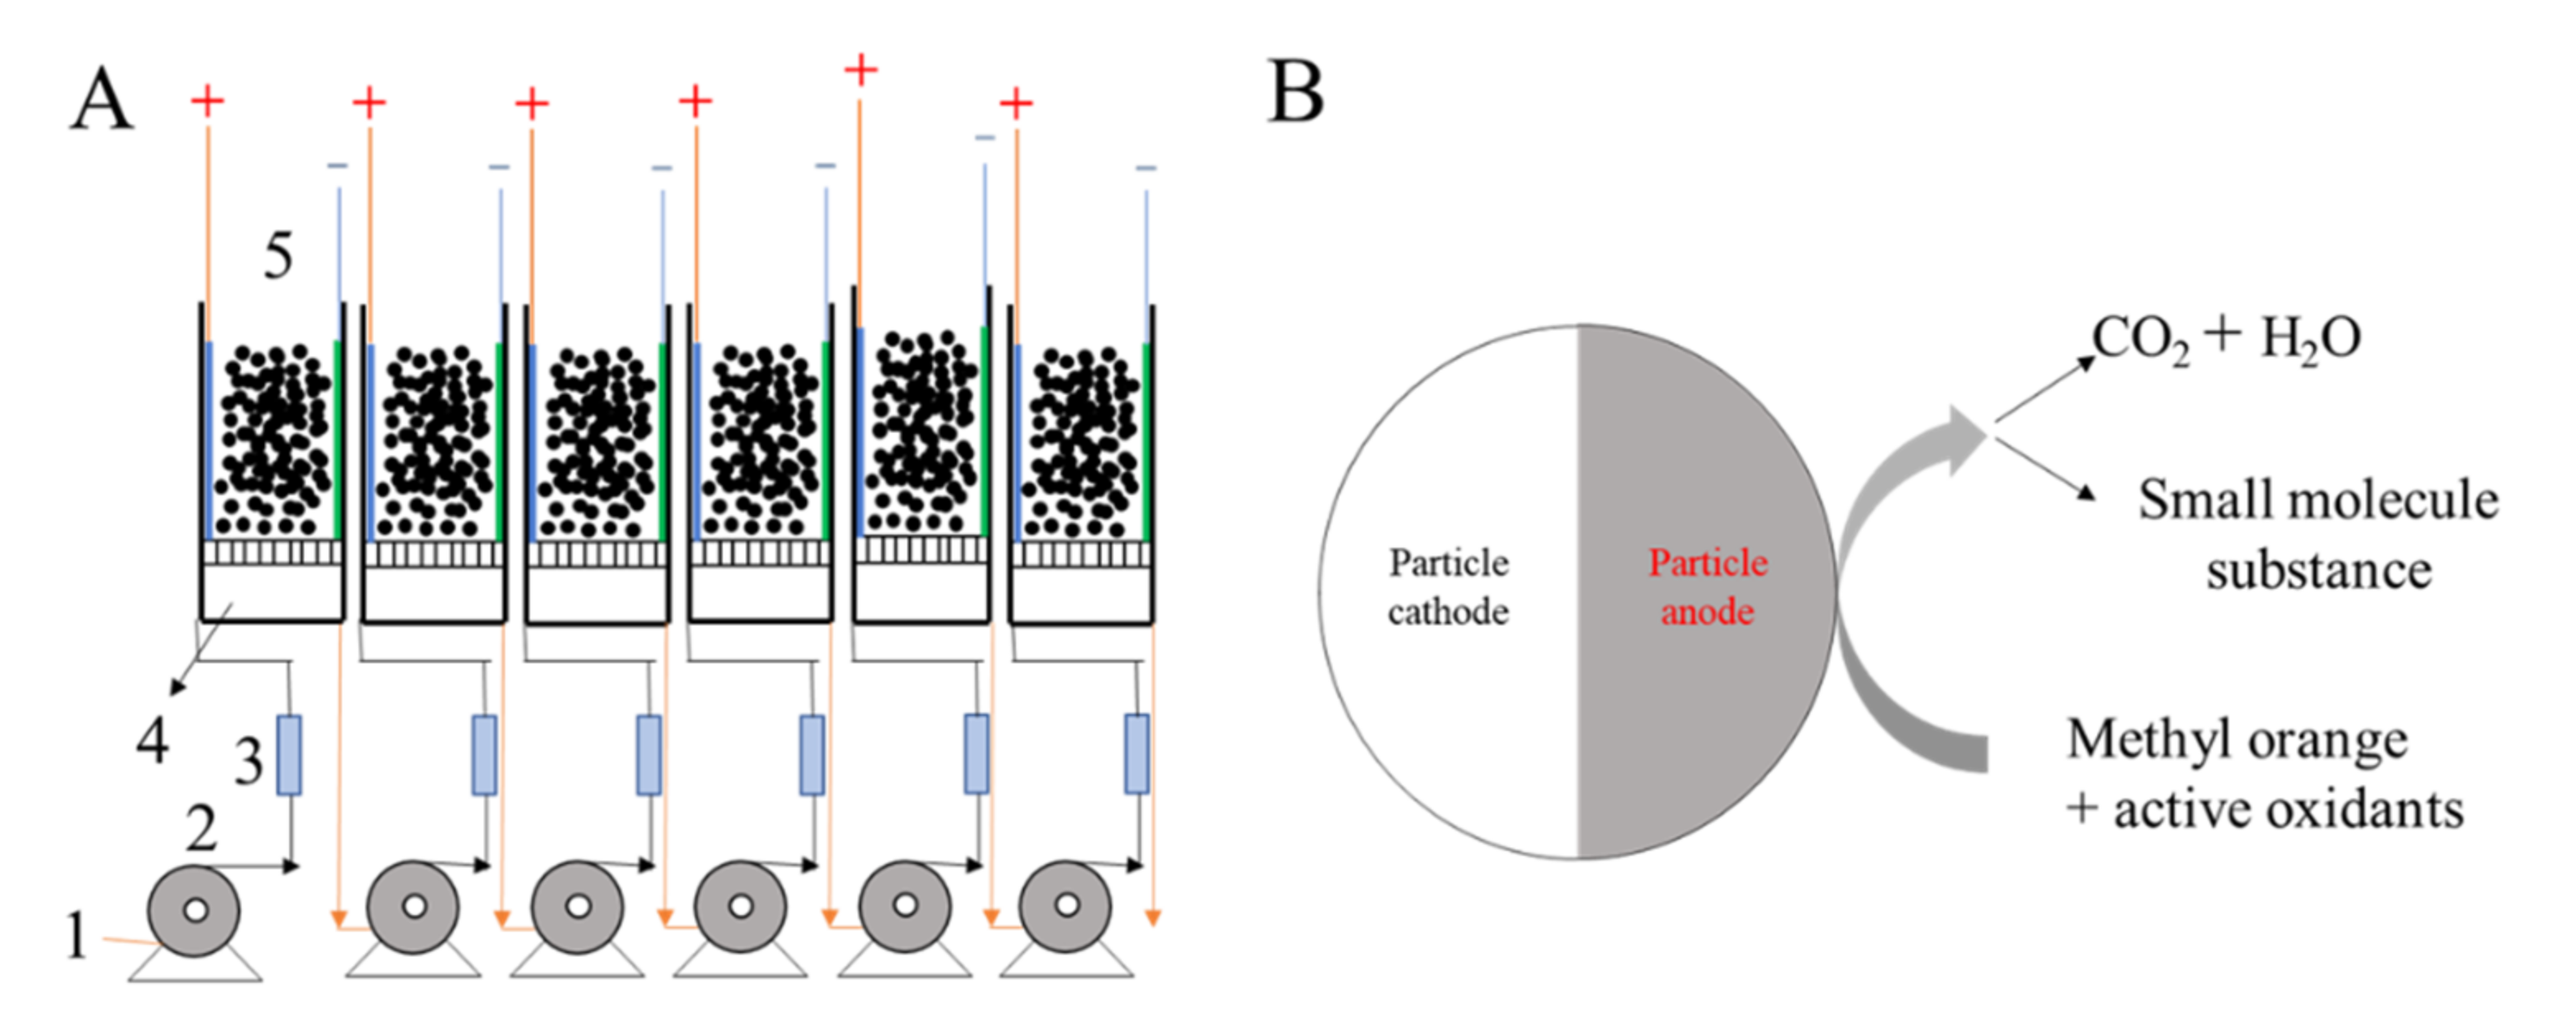
2.3. Bulk MO Simulated Wastewater Degradation Experiment
2.4. Analytical Method
3. Results and Discussion
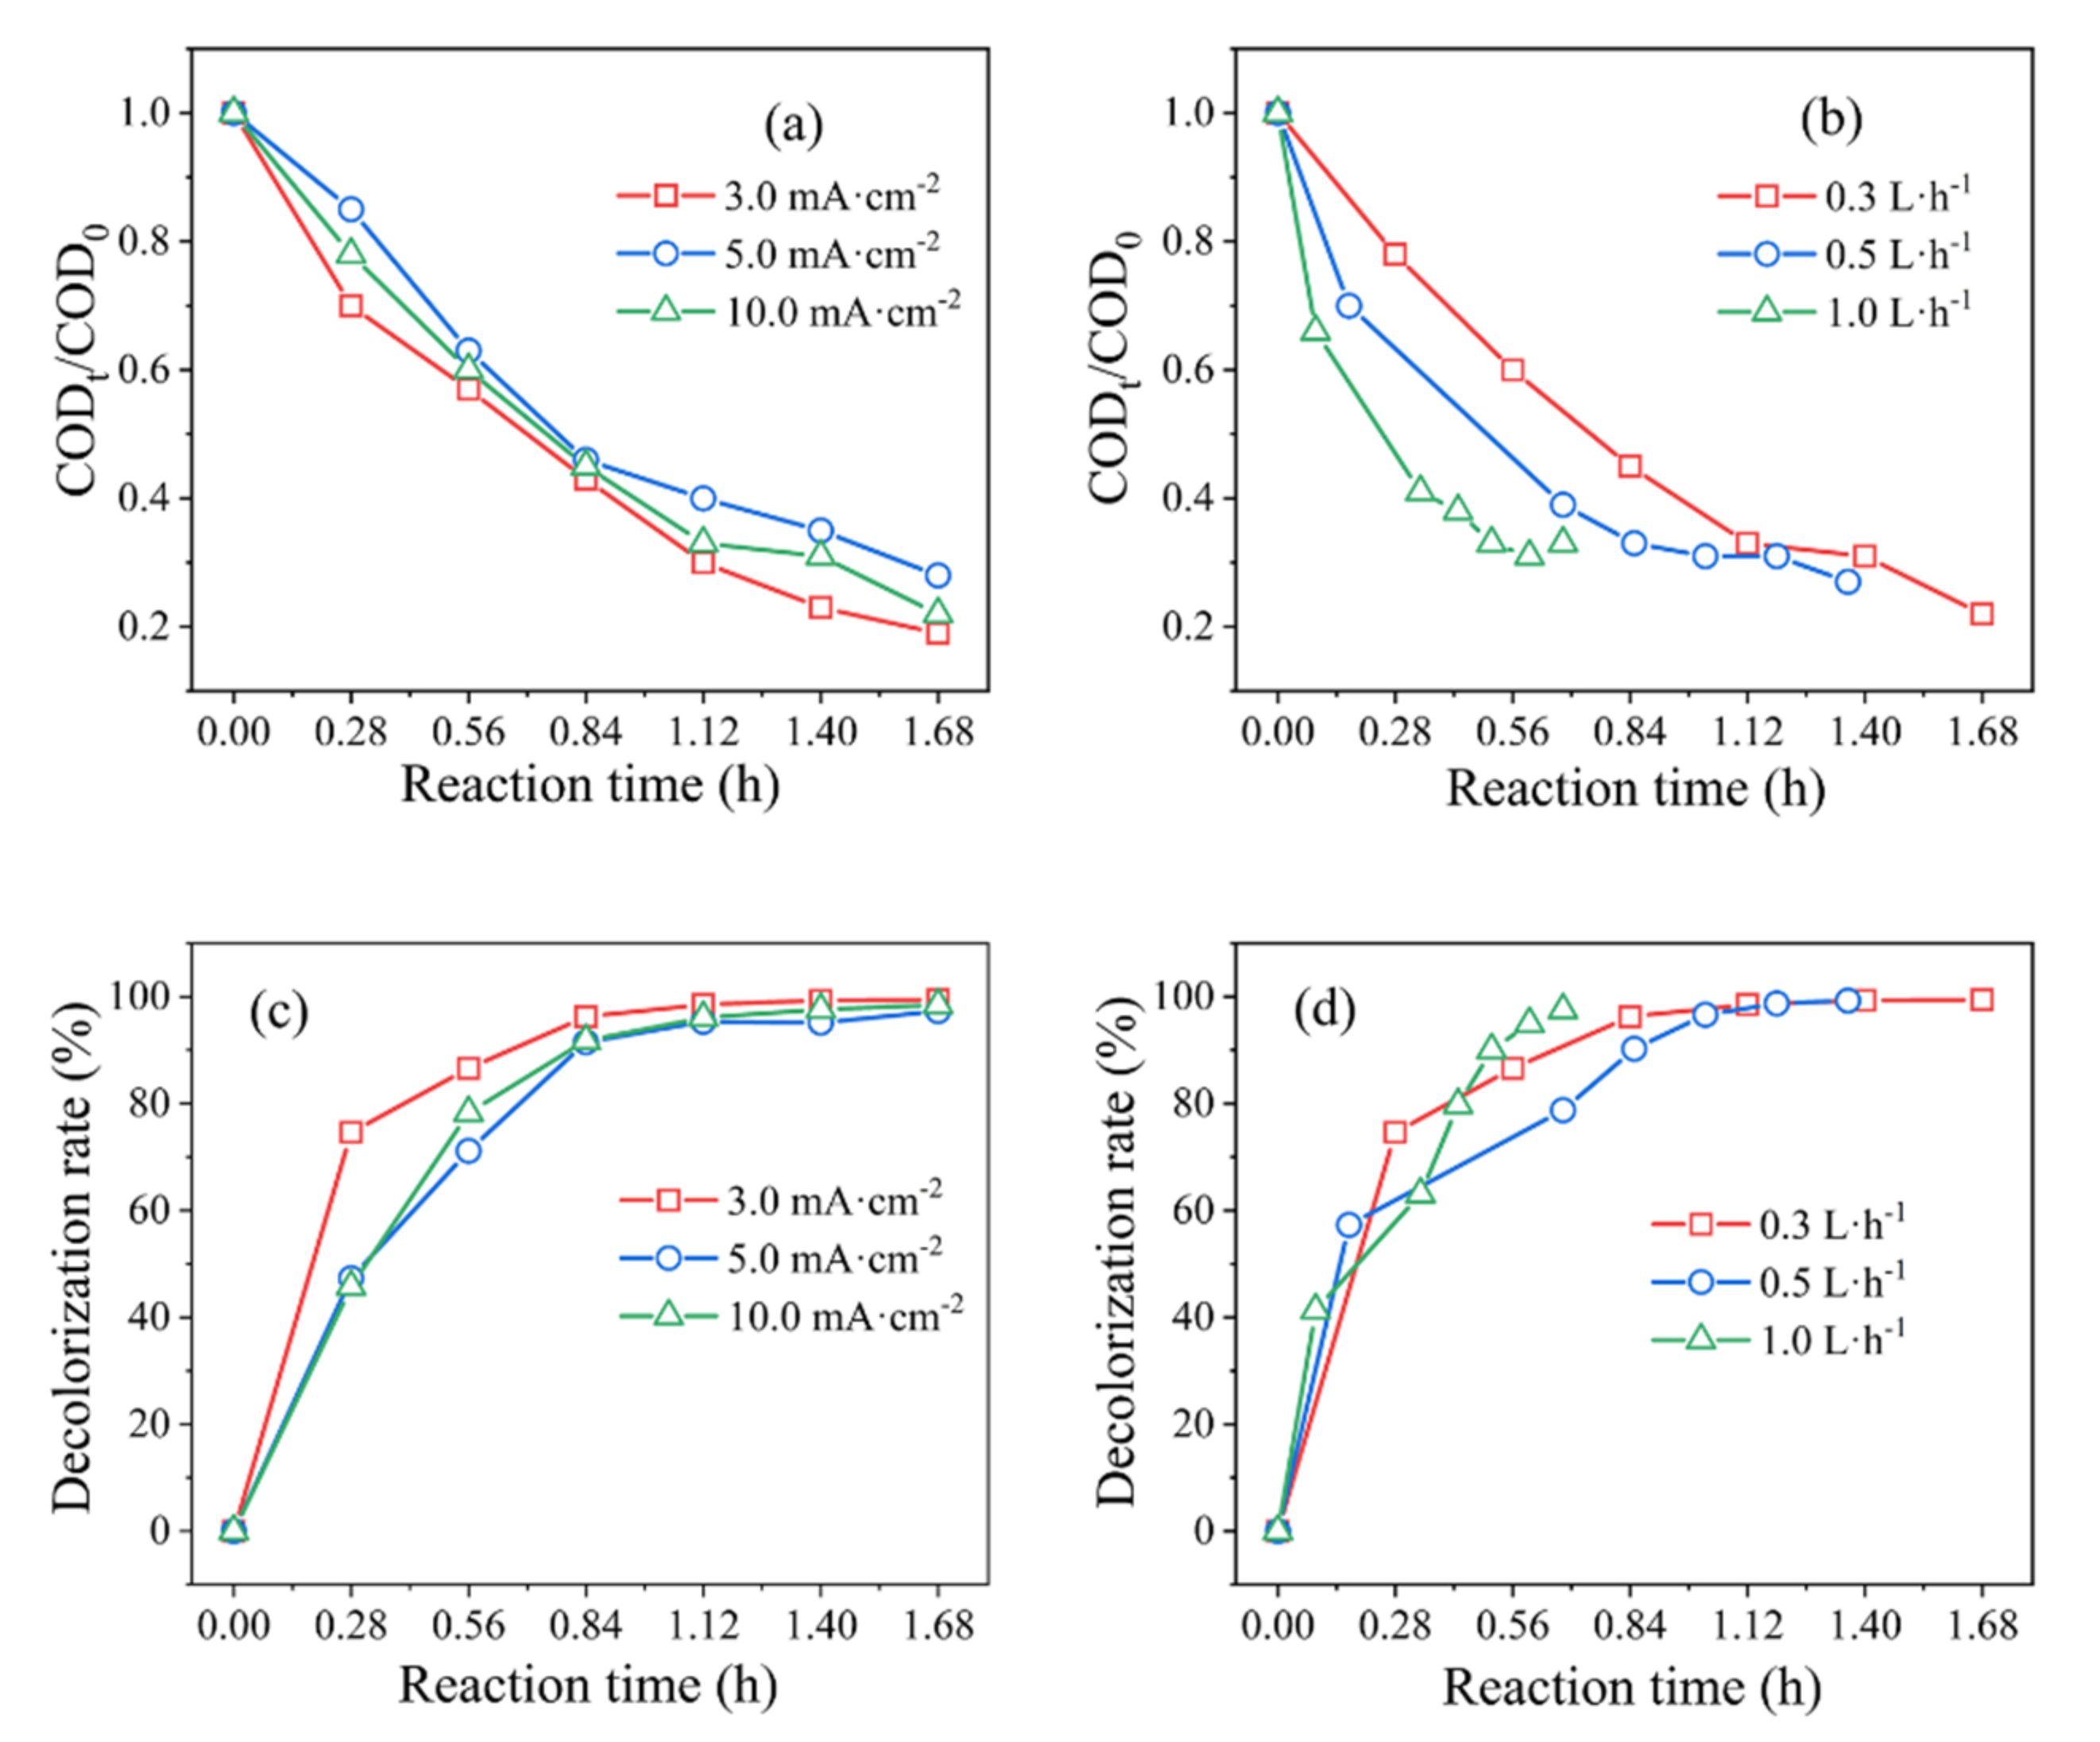
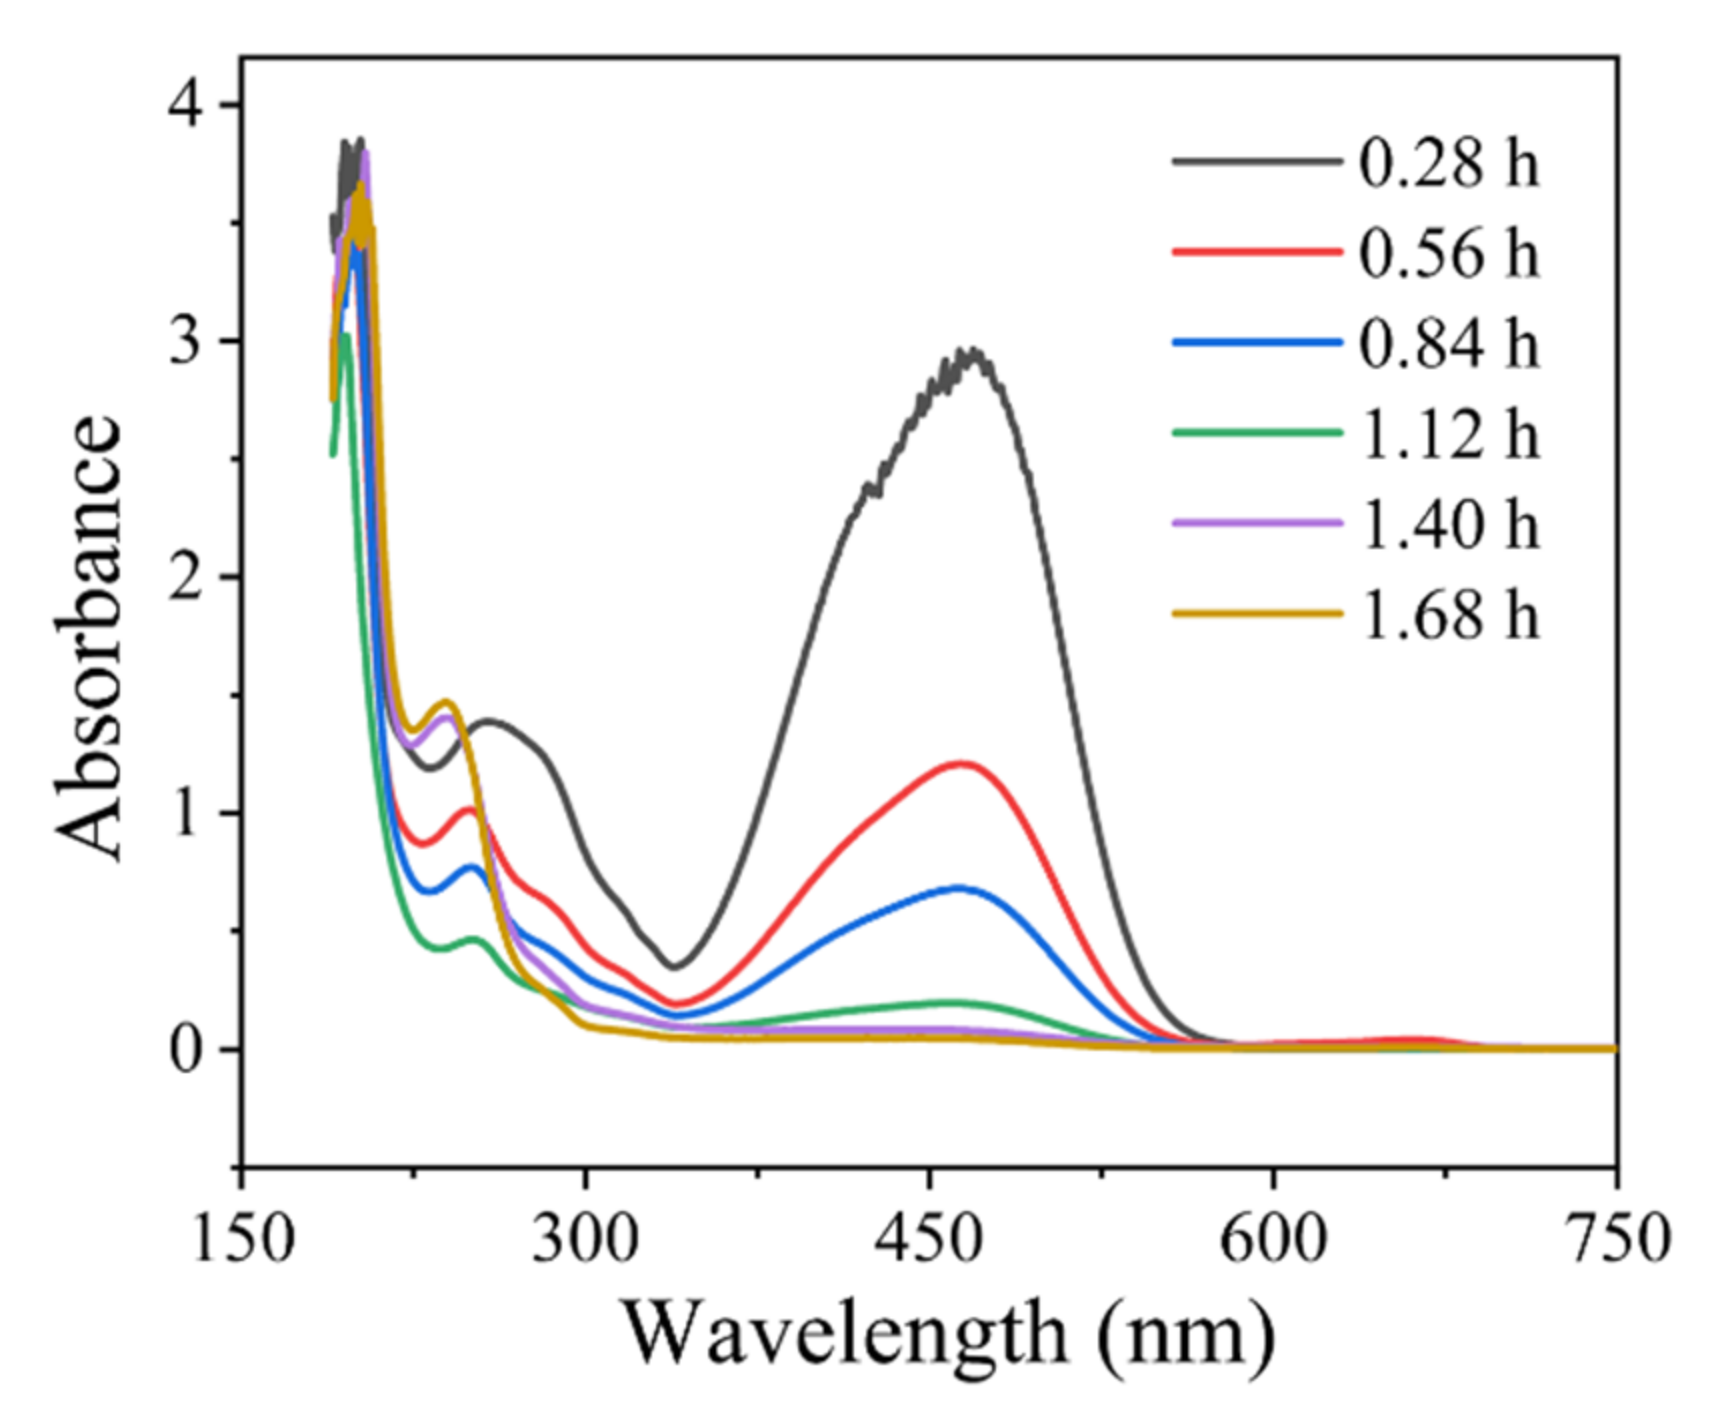
3.1. Degradation Performance Evaluation of Bulk MO Simulated Wastewater
3.2. Electrochemical Properties Test of Anode and AC Particle Electrode
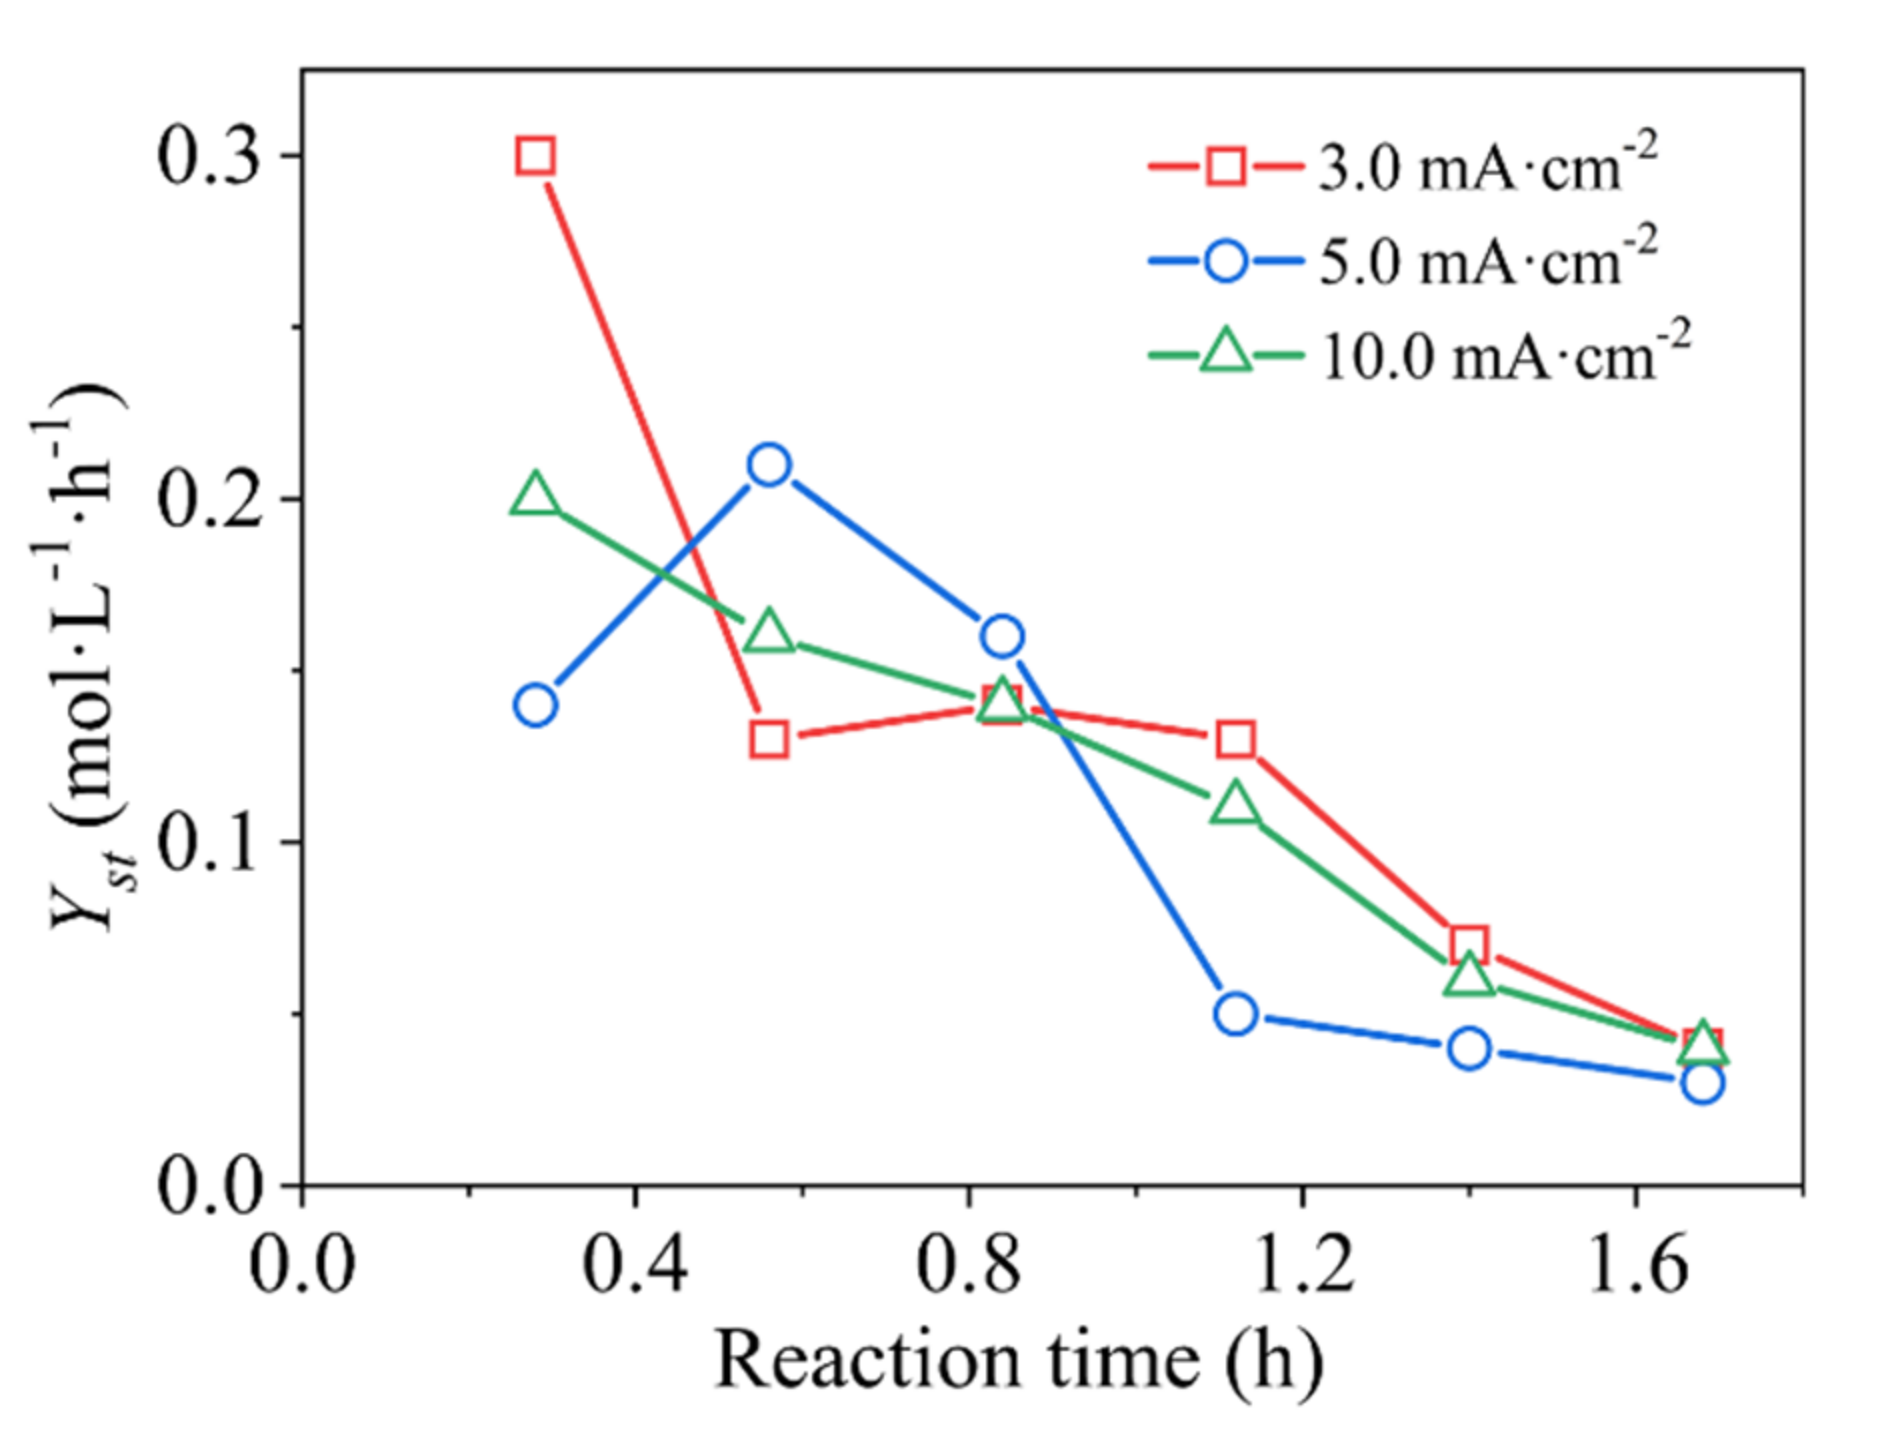
3.3. Phase-Reaction Kinetics Model Simulation of Energy Efficiency
4. Conclusions
Supplementary Materials
Author Contributions
Funding
Institutional Review Board Statement
Informed Consent Statement
Data Availability Statement
Conflicts of Interest
References
- Sham, A.Y.W.; Notley, S.M. Adsorption of organic dyes from aqueous solutions using surfactant exfoliated graphene. J. Environ. Chem. Eng. 2018, 6, 495–504. [Google Scholar] [CrossRef] [Green Version]
- Abid, M.F.; Zablouk, M.A.; Abid-Alameer, A.M. Experimental study of dye removal from industrial wastewater by membrane technologies of reverse osmosis and nanofiltration. Iran. J. Environ. Health Sci. Eng. 2012, 9, 17. [Google Scholar] [CrossRef] [PubMed] [Green Version]
- Rodrigo, M.A.; Oturan, N.; Oturan, M.A. Electrochemically assisted remediation of pesticides in soils and water: A review. Chem. Rev. 2014, 114, 8720–8745. [Google Scholar] [CrossRef] [PubMed]
- Duhan, M.; Kaur, R. Adsorptive removal of methyl orange with polyaniline nanofibers: An unconventional adsorbent for water treatment. Environ. Technol. 2020, 41, 2977–2990. [Google Scholar] [CrossRef] [PubMed]
- Rajkumar, D.; Palanivelu, K. Electrochemical treatment of industrial wastewater. J. Hazard. Mater. 2004, 113, 123–129. [Google Scholar] [CrossRef]
- Chung, K.-T. Azo dyes and human health: A review. Environ. Sci. Health Care 2016, 34, 233–261. [Google Scholar] [CrossRef]
- Jia, Y.; Ding, L.; Ren, P.; Zhong, M.; Ma, J.; Fan, X. Performances and Mechanism of Methyl Orange and Congo Red Adsorbed on the Magnetic Ion-Exchange Resin. J. Chem. Eng. 2020, 65, 725–736. [Google Scholar] [CrossRef]
- Puspasari, T.; Peinemann, K.V. Application of thin film cellulose composite membrane for dye wastewater reuse. J. Water Process Eng. 2016, 13, 176–182. [Google Scholar] [CrossRef]
- Kıpçak, İ.; Ersal, E.K. Catalytic wet peroxide oxidation of a real textile azo dye Cibacron Red P-4B over Al/Fe pillared bentonite catalysts: Kinetic and thermodynamic studies. React. Kinet. Mech. Catal. 2021, 132, 1003–1023. [Google Scholar] [CrossRef]
- Wohlmuth da Silva, S.; Venzke, C.D.; Bitencourt Welter, J.; Schneider, D.E.; Zoppas Ferreira, J.; Siqueira Rodrigues, M.A.; Moura Bernardes, A. Electrooxidation Using Nb/BDD as Post-Treatment of a Reverse Osmosis Concentrate in the Petrochemical Industry. Int. J. Environ. Res. Public Health 2019, 16, 816. [Google Scholar] [CrossRef] [Green Version]
- Moreira, F.C.; Soler, J.; Fonseca, A.; Saraiva, I.; Boaventura, R.A.; Brillas, E.; Vilar, V.J. Electrochemical advanced oxidation processes for sanitary landfill leachate remediation: Evaluation of operational variables. Appl. Catal. B Environ. 2016, 182, 161–171. [Google Scholar] [CrossRef]
- Moreira, F.C.; Boaventura, R.A.; Brillas, E.; Vilar, V.J. Electrochemical advanced oxidation processes: A review on their application to synthetic and real wastewaters. Appl. Catal. B Environ. 2017, 202, 217–261. [Google Scholar] [CrossRef]
- Zeng, Q.; Dong, H.; Wang, X.; Yu, T.; Cui, W. Degradation of 1, 4-dioxane by hydroxyl radicals produced from clay minerals. J. Hazard. Mater. 2017, 331, 88–98. [Google Scholar] [CrossRef] [PubMed]
- Baddouh, A.; Bessegato, G.G.; Rguiti, M.M.; El Ibrahimi, B.; Bazzi, L.; Hilali, M.; Zanoni, M.V.B. Electrochemical decolorization of Rhodamine B dye: Influence of anode material, chloride concentration and current density. J. Environ. Chem. Eng. 2018, 6, 2041–2047. [Google Scholar] [CrossRef] [Green Version]
- Li, W.; Liu, G.; Miao, D.; Li, Z.; Chen, Y.; Gao, X.; Liu, T.; Wei, Q.; Ma, L.; Zhou, K.; et al. Electrochemical oxidation of Reactive Blue 19 on boron-doped diamond anode with different supporting electrolyte. J. Environ. Chem. Eng. 2020, 8, 103997. [Google Scholar] [CrossRef]
- Zhang, C.; Jiang, Y.; Li, Y.; Hu, Z.; Zhou, L.; Zhou, M. Three-dimensional electrochemical process for wastewater treatment: A general review. Chem. Eng. J. 2013, 228, 455–467. [Google Scholar] [CrossRef]
- Yasri, N.G.; Yaghmour, A.; Gunasekaran, S. Effective removal of organics from corn wet milling steepwater effluent by electrochemical oxidation and adsorption on 3-D granulated graphite electrode. J. Environ. Chem. Eng. 2015, 3, 930–937. [Google Scholar] [CrossRef]
- Shokoohi, R.; Nematollahi, D.; Samarghandi, M.R.; Azarian, G.; Latifi, Z. Optimization of three-dimensional electrochemical process for degradation of methylene blue from aqueous environments using central composite design. Environ. Technol. Innov. 2020, 18, 100711. [Google Scholar] [CrossRef]
- Li, X.; Zhu, W.; Wang, C.; Zhang, L.; Qian, Y.; Xue, F.; Wu, Y. The electrochemical oxidation of biologically treated citric acid wastewater in a continuous-flow three-dimensional electrode reactor (CTDER). Chem. Eng. J. 2013, 232, 495–502. [Google Scholar] [CrossRef]
- Yousefi, Z.; Zafarzadeh, A.; Mohammadpour, R.A.; Zarei, E.; Mengelizadeh, N.; Ghezel, A. Electrochemical removal of acid red 18 dye from synthetic wastewater using a three-dimensional electrochemical reactor. Desalin. Water Treat. 2019, 165, 352–361. [Google Scholar] [CrossRef]
- Sun, Y.; Li, P.; Zheng, H.; Zhao, C.; Xiao, X.; Xu, Y.; Sun, W.; Wu, H.; Ren, M. Electrochemical treatment of chloramphenicol using Ti-Sn/γ-Al2O3 particle electrodes with a three-dimensional reactor. Chem. Eng. J. 2017, 308, 1233–1242. [Google Scholar] [CrossRef]
- Farinos, R.M.; Ruotolo, L.A.M. Comparison of the electrooxidation performance of three-dimensional RVC/PbO2 and boron-doped diamond electrodes. Electrochim. Acta 2017, 224, 32–39. [Google Scholar] [CrossRef]
- Shen, B.; Wen, X.H.; Huang, X. Enhanced removal performance of estriol by a three-dimensional electrode reactor. Chem. Eng. J. 2017, 327, 597–607. [Google Scholar] [CrossRef]
- Wang, L.; Wu, B.; Li, P.; Zhang, B.; Balasubramanian, N.; Zhao, Y. Kinetics for electro-oxidation of organic pollutants by using a packed-bed electrode reactor (PBER). Chem. Eng. J. 2016, 284, 240–246. [Google Scholar] [CrossRef]
- Wang, L.; Kong, Y.; Jiang, J.; Wei, D.; Li, P.; Yang, S.; Ting, Y.-P. Optimal wastewater treatment using a packed-bed electrode reactor (PBER): From laboratory experiments to industrial-scale approaches. Chem. Eng. J. 2018, 334, 707–713. [Google Scholar] [CrossRef]
- Yao, Y.; Chen, X.; Yu, N.; Dong, H.; Wang, H. Preparation and Electrocatalytic Performance of Three-Dimensional Porous Structure PbO2 Electrodes Using Oxygen Bubble as Dynamic Templates. J. Electrochem. Soc. 2017, 164, E48–E52. [Google Scholar] [CrossRef]
- Oliveira, K.S.G.C.; Veroli, A.B.; Ruotolo, L.A.M. Using modulated current for energy minimization in the electrochemical treatment of effluents containing organic pollutants. J. Hazard. Mater. 2020, 399, 123053. [Google Scholar] [CrossRef] [PubMed]
- Kothari, M.S.; Shah, K.A. Electrochemical oxidation for decolorization of Rhodamine-B dye using mixed metal oxide electrode: Modeling and optimization. Water Sci. Technol. 2020, 81, 720–731. [Google Scholar] [CrossRef] [PubMed]
- Susree, M.; Asaithambi, P.; Saravanathamizhan, R.; Matheswaran, M. Studies on various mode of electrochemical reactor operation for the treatment of distillery effluent. J. Environ. Chem. Eng. 2013, 1, 552–558. [Google Scholar] [CrossRef]
- Candia-Onfray, C.; Thiam, A.; Salazar, C.; Martinez-Huitle, C.A.; Salazar, R. Enhanced Degradation of the Industrial Textile Dye Disperse Red BG by Electrochemical Process with Different Anodes. J. Electrochem. Soc. 2017, 164, E440–E447. [Google Scholar] [CrossRef]
- Can, W.; Yao-Kun, H.; Qing, Z.; Min, J. Treatment of secondary effluent using a three-dimensional electrode system: COD removal, biotoxicity assessment, and disinfection effects. Chem. Eng. J. 2014, 243, 1–6. [Google Scholar] [CrossRef]
- Bhatnagar, R.; Joshi, H.; Mall, I.D.; Srivastava, V.C. Electrochemical treatment of acrylic dye-bearing textile wastewater: Optimization of operating parameters. Desalin. Water Treat. 2014, 52, 111–122. [Google Scholar] [CrossRef]
- Xu, M.; Wang, Z.; Wang, F.; Hong, P.; Wang, C.; Ouyang, X.; Zhu, C.; Wei, Y.; Hun, Y.; Fang, W. Fabrication of cerium doped Ti/nanoTiO2/PbO2 electrode with improved electrocatalytic activity and its application in organic degradation. Electrochim. Acta 2016, 201, 240–250. [Google Scholar] [CrossRef]
- Duan, X.; Zhao, C.; Liu, W.; Zhao, X.; Chang, L. Fabrication of a novel PbO2 electrode with a graphene nanosheet interlayer for electrochemical oxidation of 2-chlorophenol. Electrochim. Acta 2017, 240, 424–436. [Google Scholar] [CrossRef]
- Abbar, A.H.; Salman, R.H.; Abbas, A.S. Electrochemical Incineration of Oxalic Acid at Manganese Dioxide Rotating Cylinder Anode: Role of Operative Parameters in the Presence of NaCl. J. Electrochem. Soc. 2016, 163, E333–E340. [Google Scholar] [CrossRef]
- Wang, C.; Yin, L.; Xu, Z.; Niu, J.; Hou, L.A. Electrochemical degradation of enrofloxacin by lead dioxide anode: Kinetics, mechanism and toxicity evaluation. Chem. Eng. J. 2017, 326, 911–920. [Google Scholar] [CrossRef]
- Yang, K.; Liu, Y.; Qiao, J. Electrodeposition preparation of Ce-doped Ti/SnO2-Sb electrodes by using selected addition agents for efficient electrocatalytic oxidation of methylene blue in water. Sep. Purif. Technol. 2017, 189, 459–466. [Google Scholar] [CrossRef]
- Wang, L.; Kong, Y.; Wei, D.; Yang, S.; Chen, Q.; Kong, Y.; Li, P.; Ting, Y.-P.; Ong, C.N. Toward the Quantitative Evaluation of an Activated Carbon Particle Electrode Performance in a Packed-Bed System. ChemElectroChem 2017, 4, 2464–2468. [Google Scholar] [CrossRef]
- Ardizzone, S.; Fregonara, G.; Trasatti, S. “Inner” and “outer” active surface of RuO2 electrodes. Electrochim. Acta 1990, 35, 263–267. [Google Scholar] [CrossRef]
- Martínez-Huitle, C.A.; Ferro, S. Electrochemical oxidation of organic pollutants for the wastewater treatment: Direct and indirect processes. Chem. Soc. Rev. 2006, 35, 1324–1340. [Google Scholar] [CrossRef]
- Kapałka, A.; Fóti, G.; Comninellis, C. Kinetic modelling of the electrochemical mineralization of organic pollutants for wastewater treatment. J. Appl. Electrochem. 2008, 38, 7–16. [Google Scholar] [CrossRef] [Green Version]
- Pang, T.; Wang, Y.; Yang, H.; Wang, T.; Cai, W. Dynamic model of organic pollutant degradation in three dimensional packed bed electrode reactor. Chemosphere 2018, 206, 107–114. [Google Scholar] [CrossRef] [PubMed]

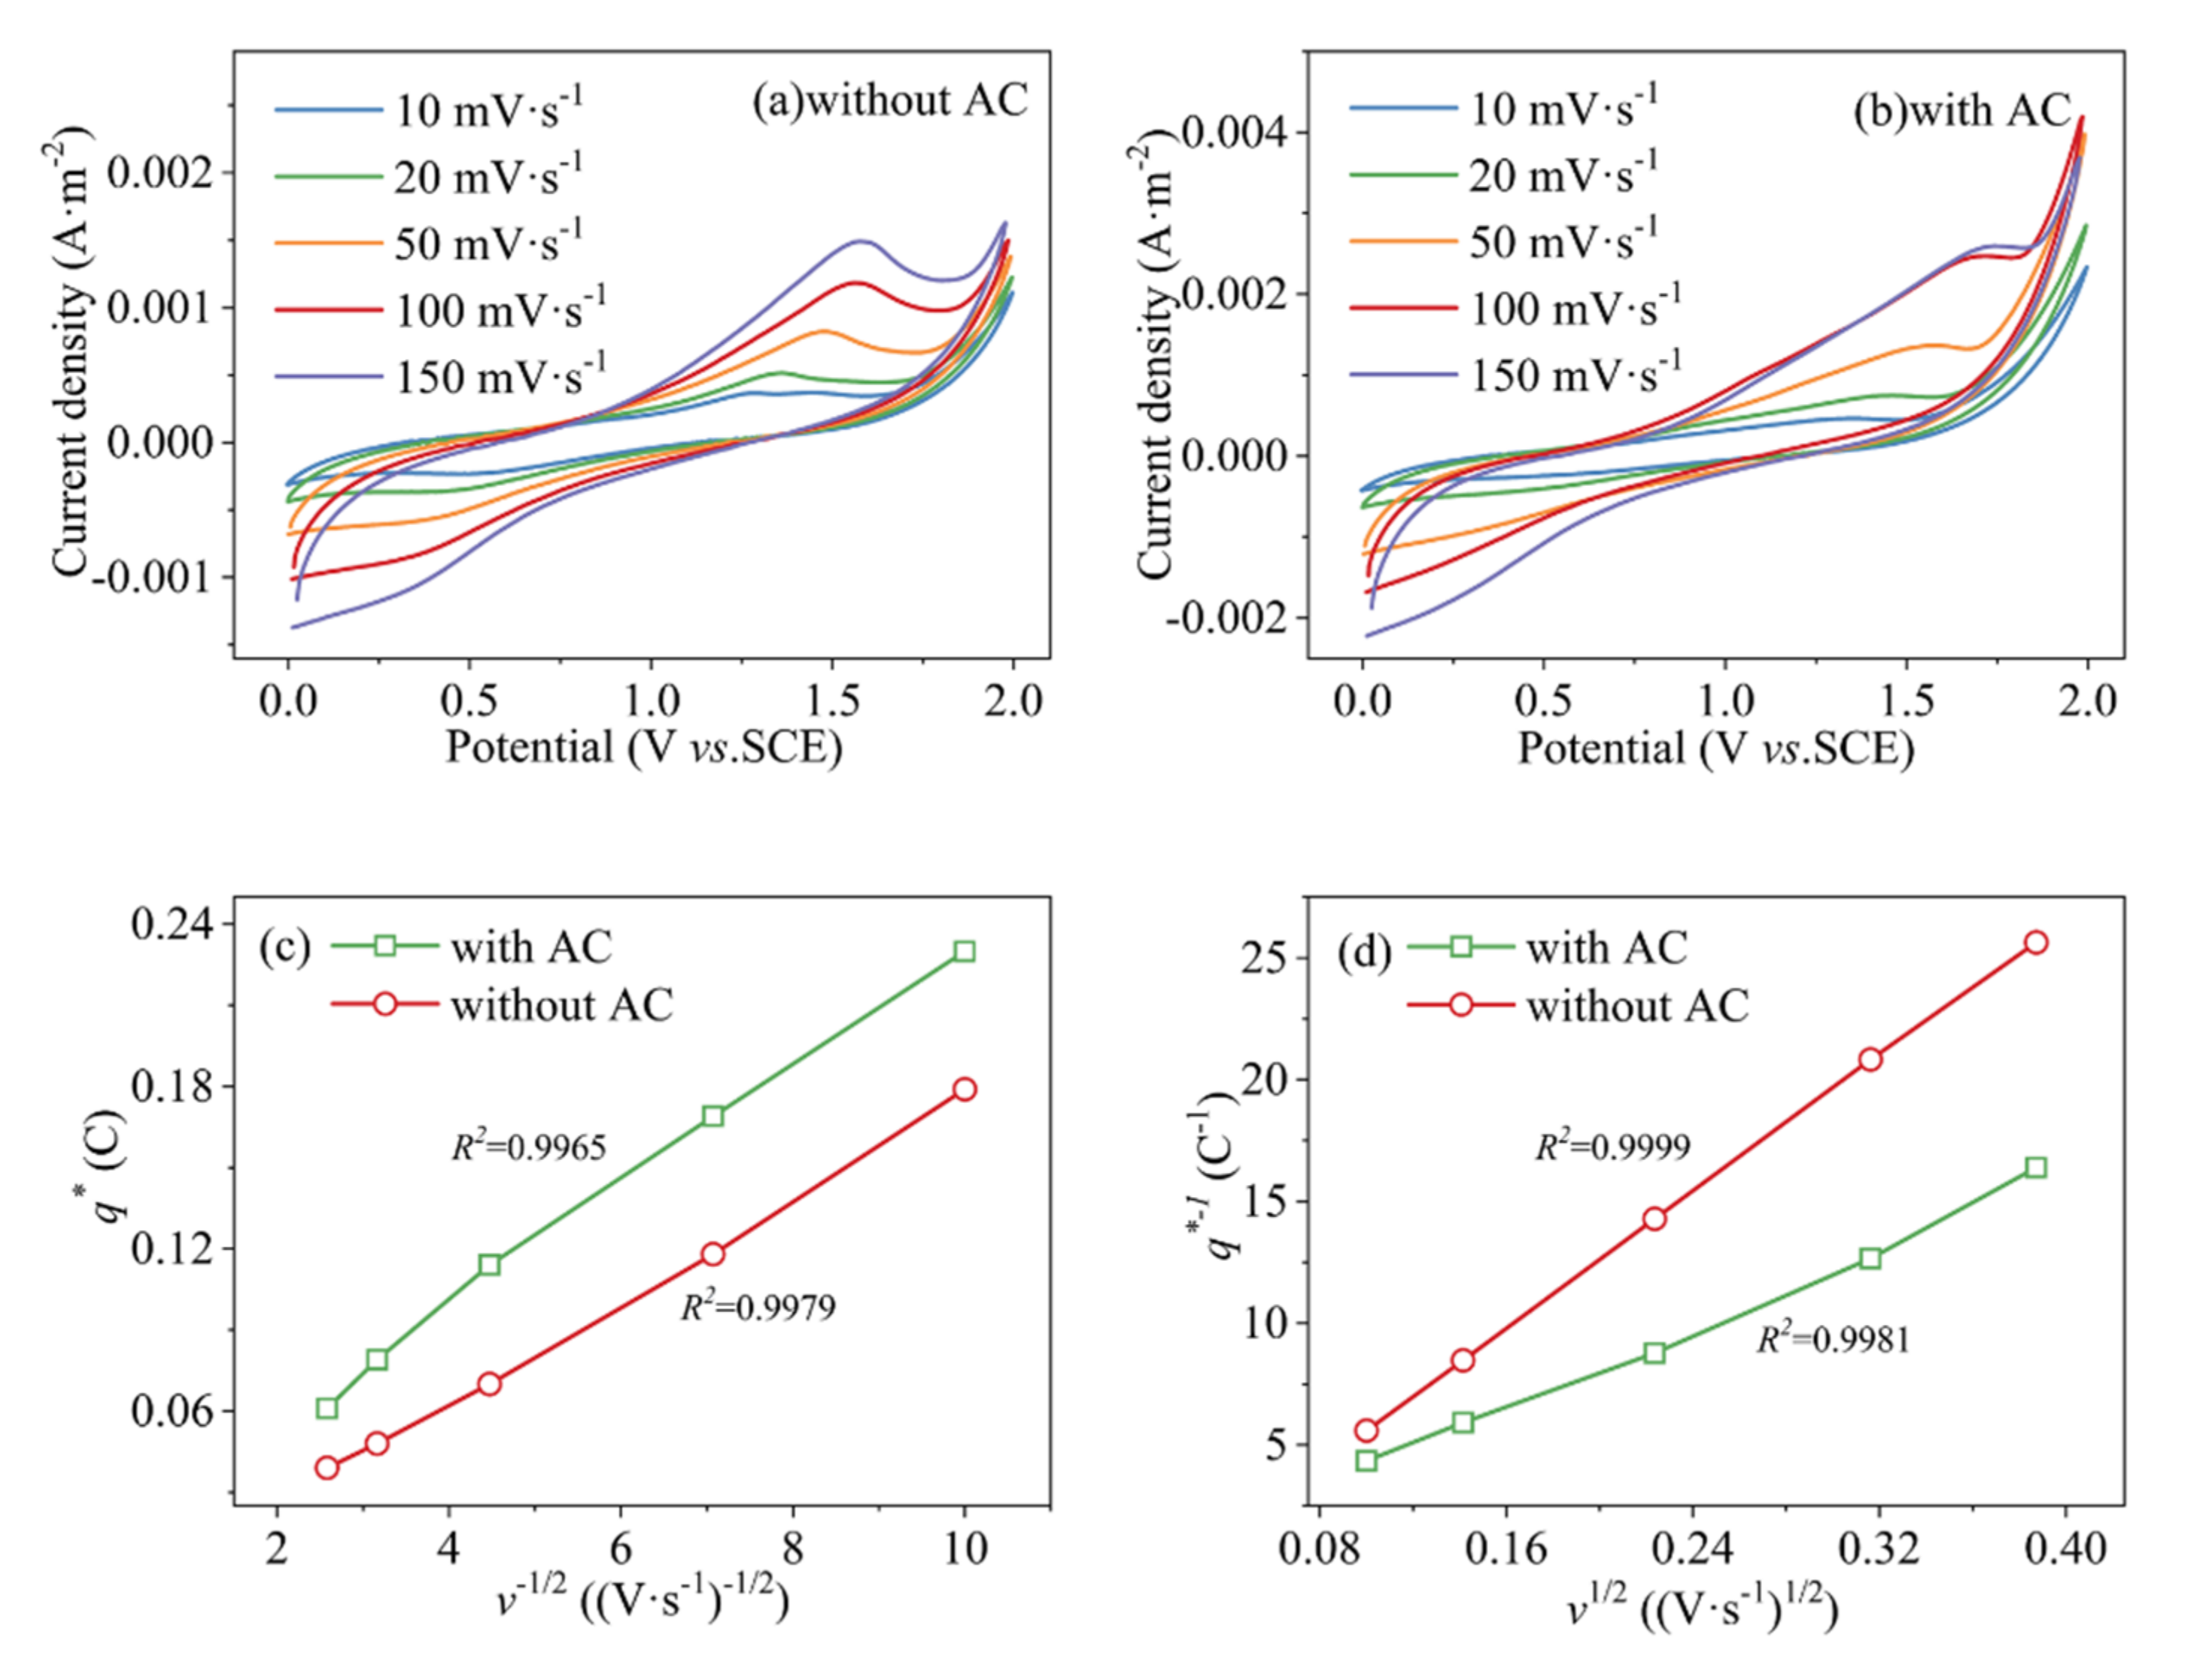
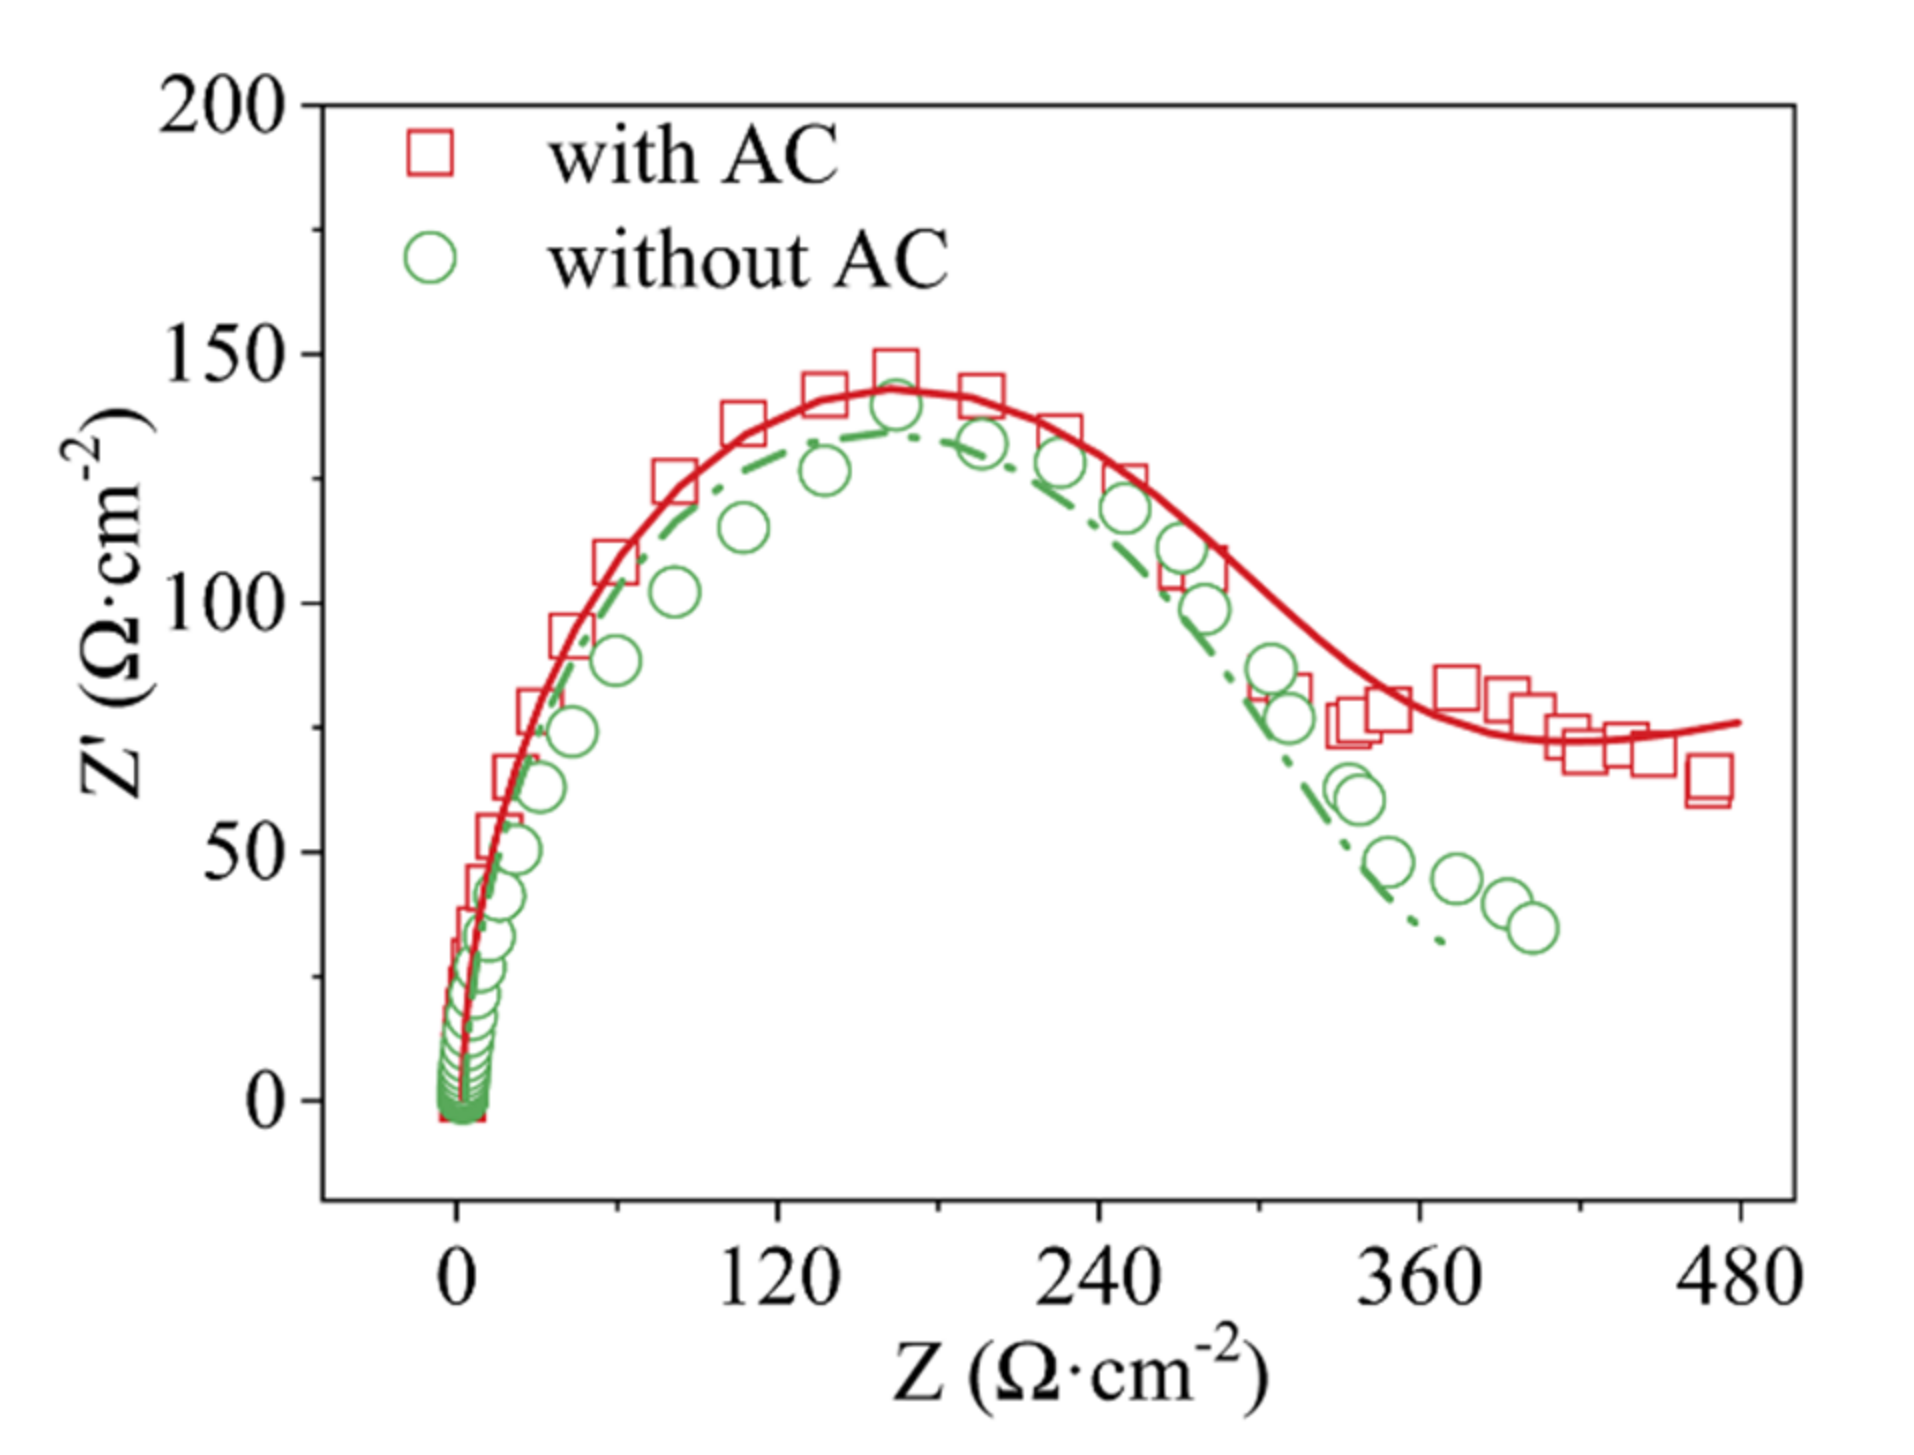
| Roe (Ω) | Rct (Ω) | γ | β | |
|---|---|---|---|---|
| with AC | 1.34·104 | 0.05308 | 0.80 | 0.20 |
| without AC | 409.2 | 100 | 0.80 | - |
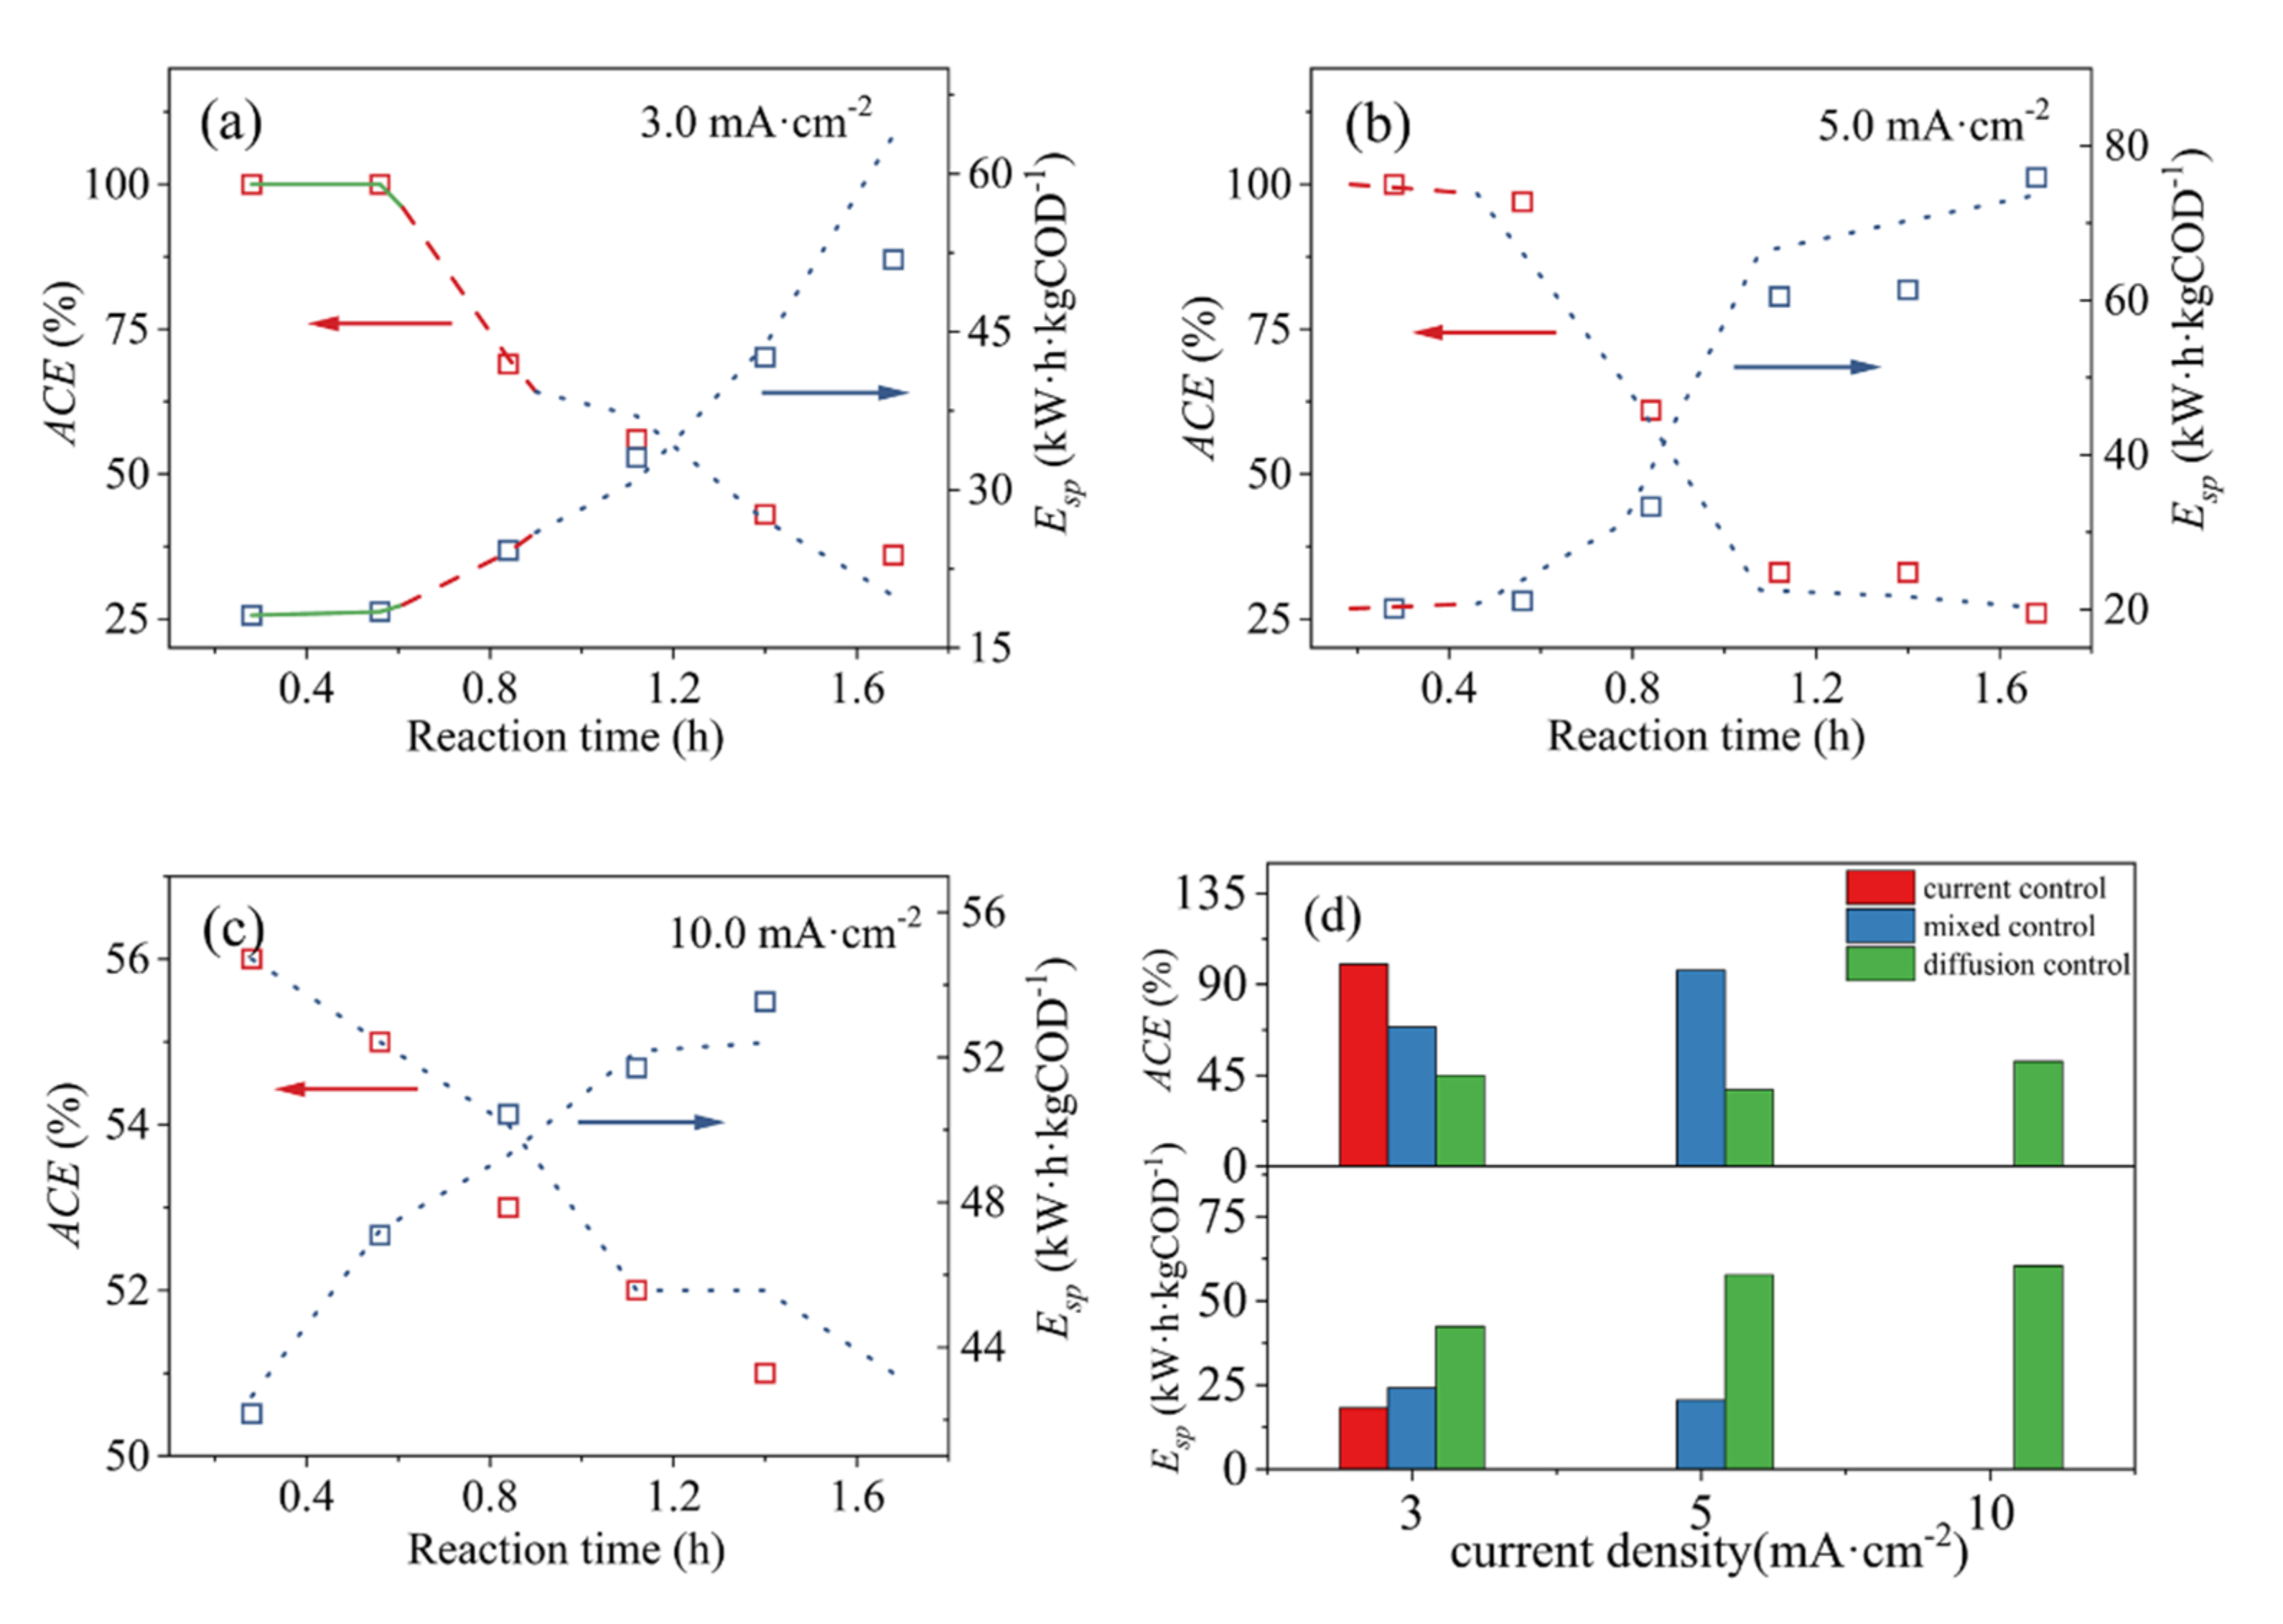
| J (mA·cm−2) | 3.0 | 5.0 | 10.0 |
|---|---|---|---|
| ACE | 0.90 | 0.95 | 1.30 |
| Esp | 0.60 | 0.86 | 2.61 |
Publisher’s Note: MDPI stays neutral with regard to jurisdictional claims in published maps and institutional affiliations. |
© 2022 by the authors. Licensee MDPI, Basel, Switzerland. This article is an open access article distributed under the terms and conditions of the Creative Commons Attribution (CC BY) license (https://creativecommons.org/licenses/by/4.0/).
Share and Cite
Hou, J.; Li, X.; Yan, Y.; Wang, L. Electrochemical Oxidation of Methyl Orange in an Active Carbon Packed Electrode Reactor (ACPER): Degradation Performance and Kinetic Simulation. Int. J. Environ. Res. Public Health 2022, 19, 4775. https://doi.org/10.3390/ijerph19084775
Hou J, Li X, Yan Y, Wang L. Electrochemical Oxidation of Methyl Orange in an Active Carbon Packed Electrode Reactor (ACPER): Degradation Performance and Kinetic Simulation. International Journal of Environmental Research and Public Health. 2022; 19(8):4775. https://doi.org/10.3390/ijerph19084775
Chicago/Turabian StyleHou, Jing, Xue Li, Yuting Yan, and Lizhang Wang. 2022. "Electrochemical Oxidation of Methyl Orange in an Active Carbon Packed Electrode Reactor (ACPER): Degradation Performance and Kinetic Simulation" International Journal of Environmental Research and Public Health 19, no. 8: 4775. https://doi.org/10.3390/ijerph19084775
APA StyleHou, J., Li, X., Yan, Y., & Wang, L. (2022). Electrochemical Oxidation of Methyl Orange in an Active Carbon Packed Electrode Reactor (ACPER): Degradation Performance and Kinetic Simulation. International Journal of Environmental Research and Public Health, 19(8), 4775. https://doi.org/10.3390/ijerph19084775