Article

Risk Assessment of Early Lung Cancer with LDCT and Health Examinations

1
Department of Critical Care Medicine, Far Eastern Memorial Hospital, New Taipei 22000, Taiwan
2
Department of Industrial Engineering and Management, Yuan Ze University, Taoyuan 32003, Taiwan
3
Division of Thoracic Medicine, Department of Internal Medicine, Far Eastern Memorial Hospital, New Taipei 22000, Taiwan
*
Author to whom correspondence should be addressed.
Int. J. Environ. Res. Public Health 2022, 19(8), 4633; https://doi.org/10.3390/ijerph19084633
Submission received: 28 February 2022 / Revised: 5 April 2022 / Accepted: 10 April 2022 / Published: 12 April 2022
(This article belongs to the Special Issue 2nd Edition of Big Data, Decision Models, and Public Health)

Abstract

:
Early detection of lung cancer has a higher likelihood of curative treatment and thus improves survival rate. Low-dose computed tomography (LDCT) screening has been shown to be effective for high-risk individuals in several clinical trials, but has high false positive rates. To evaluate the risk of stage I lung cancer in the general population not limited to smokers, a retrospective study of 133 subjects was conducted in a medical center in Taiwan. Regularized regression was used to build the risk prediction model by using LDCT and health examinations. The proposed model selected seven variables related to nodule morphology, counts and location, and ten variables related to blood tests and medical history, achieving an area under the curve (AUC) value of 0.93. The higher the age, white blood cell count (WBC), blood urea nitrogen (BUN), diabetes, gout, chronic obstructive pulmonary disease (COPD), other cancers, and the presence of spiculation, ground-glass opacity (GGO), and part solid nodules, the higher the risk of lung cancer. Subjects with calcification, solid nodules, nodules in the middle lobes, more nodules, and diseases related to thyroid, liver, and digestive systems were at a lower risk. The selected variables did not indicate causation.

1. Introduction

The early symptoms of lung cancer are not obvious, and are easily confused with a cold. Patients are usually diagnosed at an advanced stage when lung cancer is found. According to GLOBOCAN 2020, an online database from the Global Cancer Observatory (GCO) of the World Health Organization’s International Agency for Research on Cancer (IARC), the mortality rate of lung cancer ranked first when both sexes were combined [1]. In 2020, lung cancer accounted for 18% of all cancer deaths worldwide [1]. It was the leading cause of cancer death in men (mortality = 21.5%), second only to breast cancer in women (mortality = 13.7%). In the same year, lung cancer was the most commonly diagnosed cancer in men (incidence = 14.3%), and the third in women (incidence = 8.4%) [1]. The prognosis of lung cancer is poor. Based on the Surveillance, Epidemiology, and End Results (SEER) Program’s Cancer Statistics Review, the 5-year relative survival rate of lung cancer from 2011 through 2017 is 21.7% [2]. Early detection of lung cancer is a topic worthy of further research.
Chest X-ray, computed tomography (CT), and low-dose CT (LDCT) are the most common methods for screening lung cancer. However, these methods may overlook lung cancer due to lesion size, conspicuity, and location [3]. For example, an observational cohort study analyzed 40 instances collected between 1993 and 2001 by six thoracic radiologists at three institutions in the United States [4]. The median diameter of non-small cell lung cancer undetected on a chest X-ray was 1.9 cm. A side-by-side comparison between the chest X-ray and CT scans of missed lung lesions can provide radiologists with causal information on failure detection to improve the interpretation of the plain X-ray [5]. On the other hand, CT and LDCT were reported to be more sensitive to small nodules; the LDCT was able to detect non-calcified lung nodules 10 times more often than the chest X-ray, as studied in [6]. The National Lung Screening Trial (NLST) Research Team found that high-risk participants who underwent LDCT had a 20% reduction in lung cancer mortality compared to those who underwent a chest X-ray in [7]. The Dutch–Belgian NELSON trial [8], the German Lung Cancer Screening Intervention (LUSI) trial [9], and the UK lung cancer screening trial (UKLS) [10] also provided evidence of a mortality reduction by LDCT screening in patients who smoked.
Despite the benefits of LDCT for the early detection of lung cancer pointed out in [11,12], the issues of false positive, overdiagnosis, cost-effectiveness, and radiation exposure of LDCT screening are still of concern [13,14,15,16,17]. The overdiagnosis problem from LDCT may even cause stress and unnecessary treatments to patients [18]. Laboratory tests are potentially to improve the risk assessment of CT screening [19]. This research conducted a retrospective study that used LDCT and health examinations to evaluate the risk of lung cancer.
Early detection and treatment are important to improve the survival rate of lung cancer. This research aimed to construct a risk model of stage I lung cancer for the general population, not limited to high-risk groups who smoke. Clinicians can assess the potential malignancy of lung nodules based on their size, morphology, texture, shape, and distribution by reading LDCT images in practice. However, LDCT images alone may not be sufficient to identify lung cancer in certain circumstances. Considering that LDCT screening is sensitive to detect small nodules but has a high false positive rate, this research used LDCT and health examinations to contribute to the evidence base around overdiagnosis that LDCT may cause. This retrospective study used smoking, the variables from physical examination, personal and family history, routine blood testing, and the variables related to nodule characteristics listed in LDCT reports to develop the risk model.

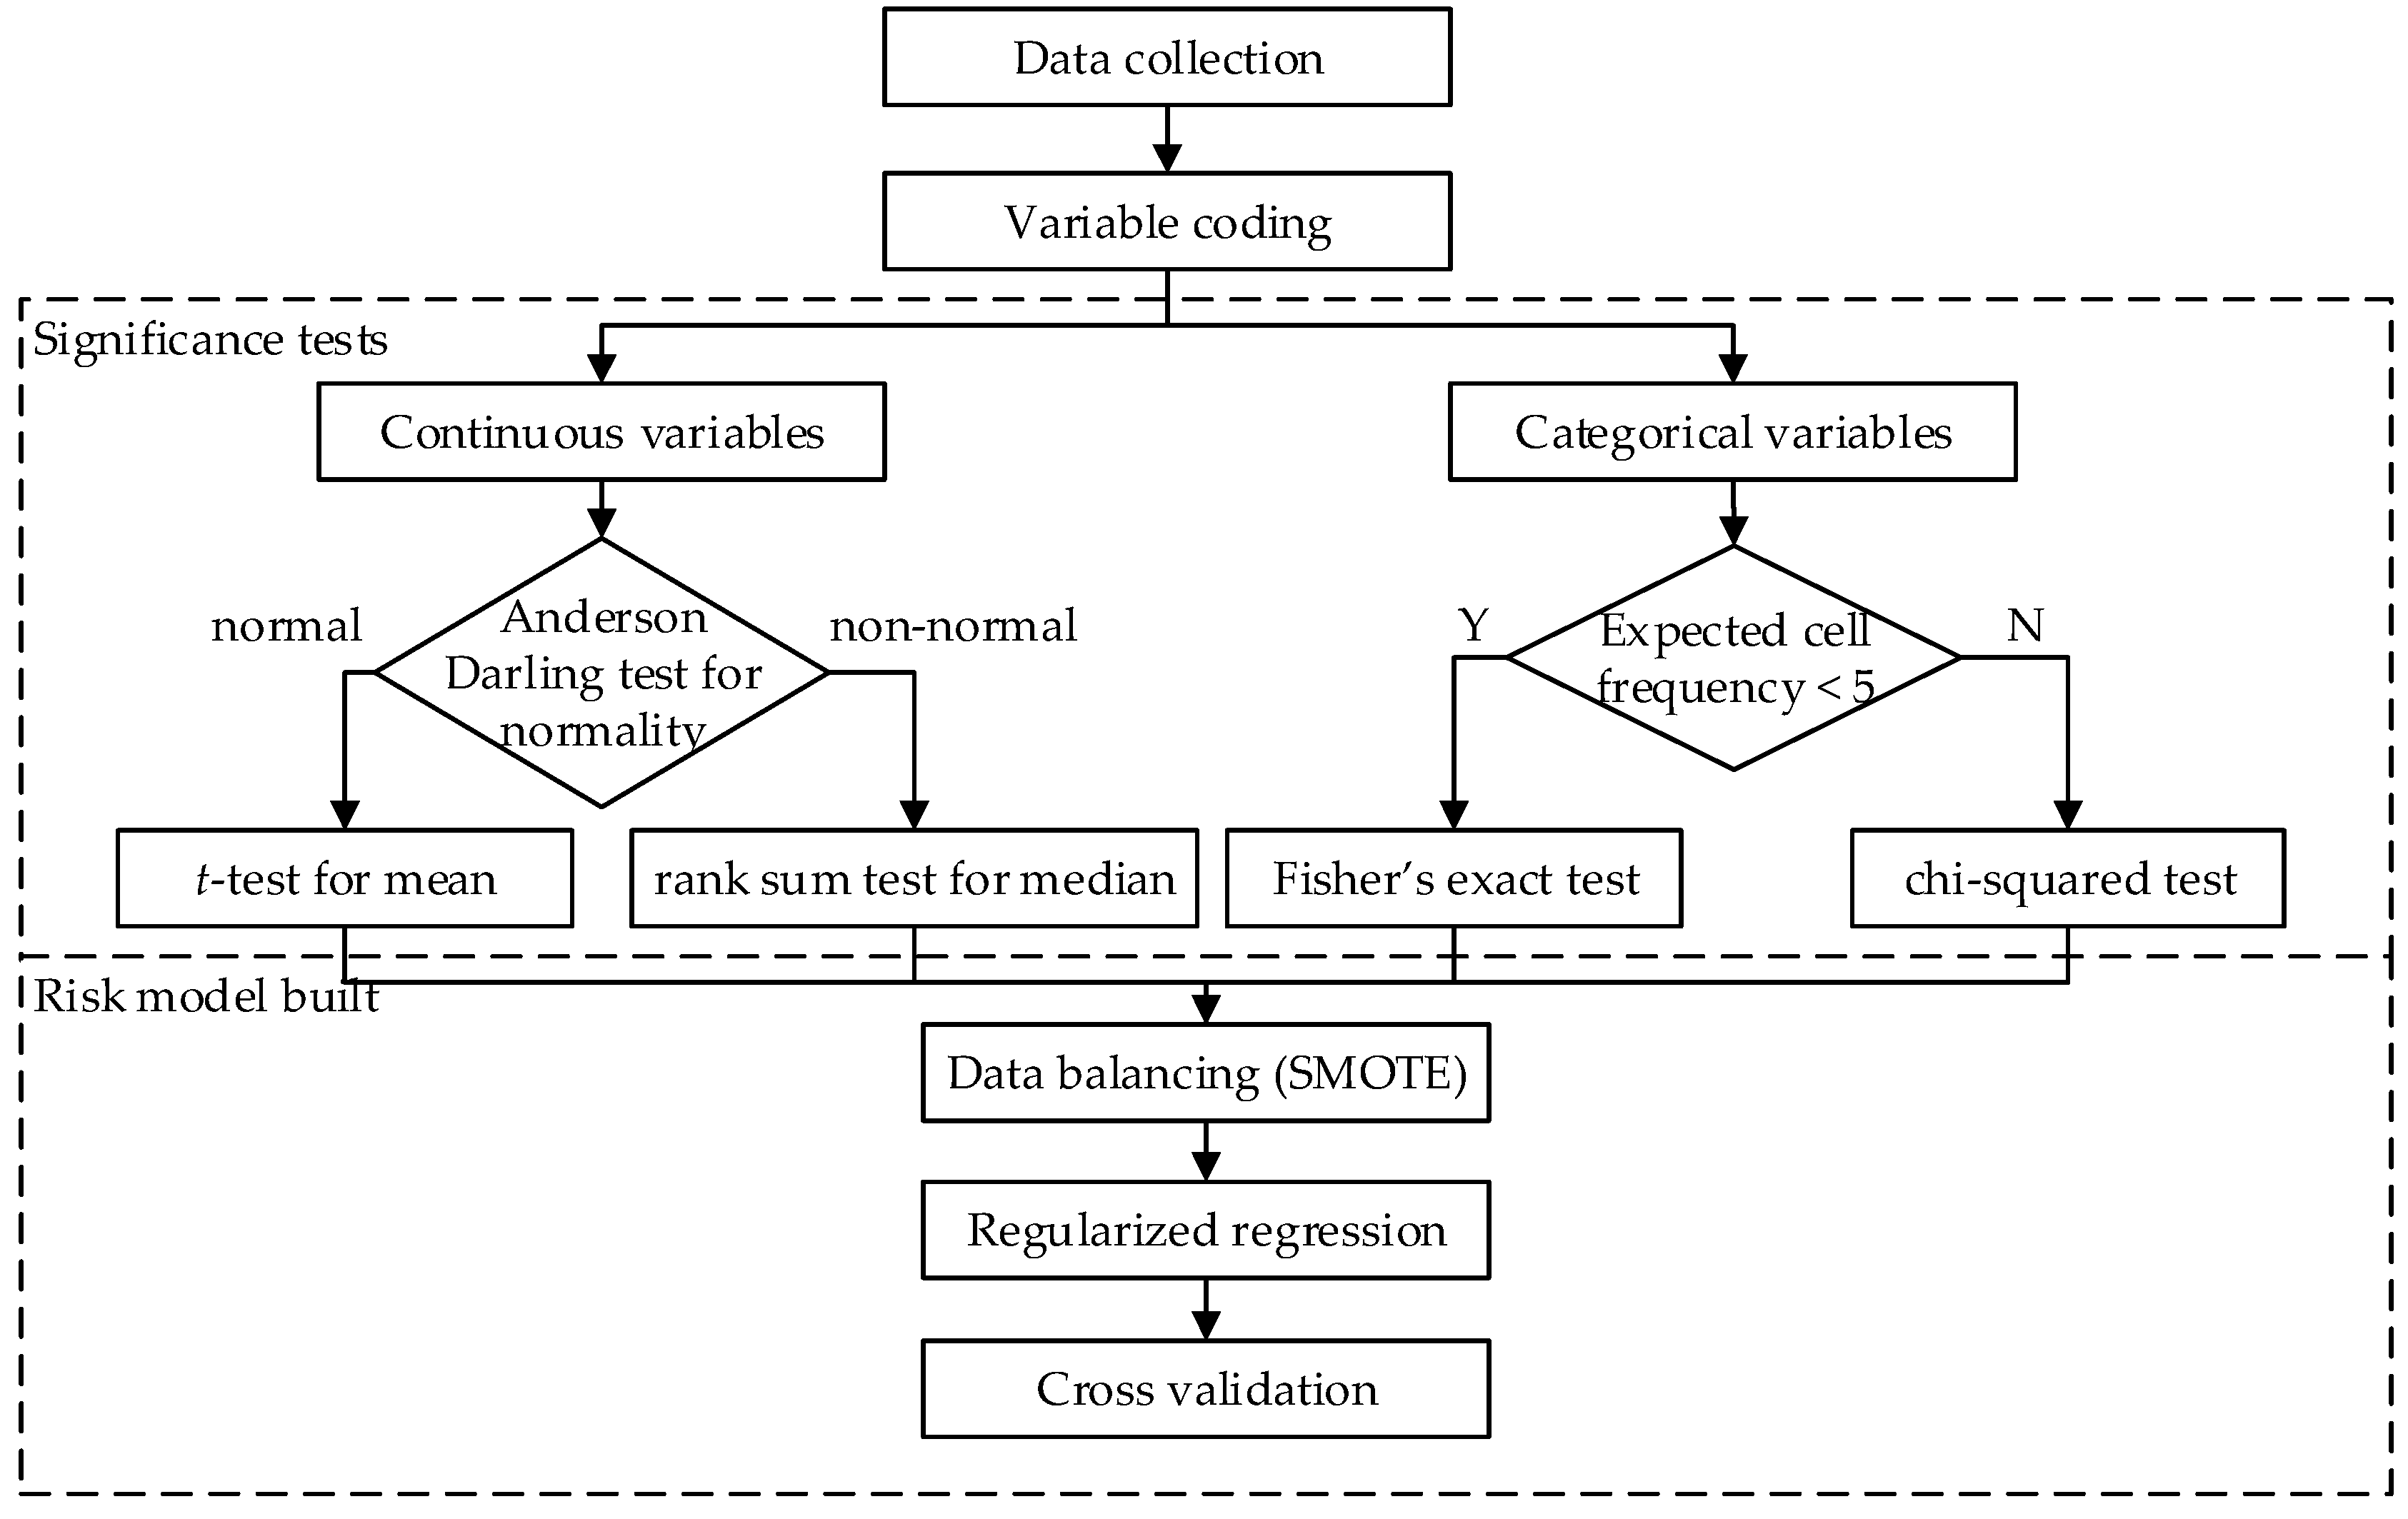
2. Materials and Methods

This research conducted a retrospective study on the medical records collected from a medical center in Taiwan under the Institutional Review Board (IRB) regulation (No. FEMH No: 107065-E). The IRB waived the requirement for informed consent. The research design and methods combined clinical knowledge and statistical analysis. This research used the LDCT and health examinations to predict the risk of stage I lung cancer. The health examinations included physical examinations, smoking record, personal medical history, family history, and routine blood tests. The analysis process contained four parts: data collection, variable coding, significance tests, and risk model built (Figure 1). LDCT can be used for lung cancer screening but not diagnosis. This retrospective study used surgery results as the gold-standard for the diagnosis of stage I lung cancer.
In data collection, the inclusion criteria were to select subjects who had LDCT screening, health examinations, and pathological examination of lung cancer between 2007 and 2017 in the investigated medical center. The exclusion criterion was to exclude the minors under 20 years of age. The data were collected by the first two authors (H.-T.C. and P.-H.W), as the doctors specializing in thoracic medicine at the medical center. The patients who met the selection criteria in the electronic medical record system were selected. The data were de-identified before being passed to the research team for statistical analysis and risk model built. All of the team members received IRB training. The study comprised 133 subjects, 97 in the cancer group and 36 in the non-cancer group. The numbers of the subjects in the two groups were unequal, resulting in imbalanced data. The imbalance ratio of the cancer group to the non-cancer group was 2.69:1. In practice, using LDCT images alone may not be sufficient to determine whether a lung nodule is malignant or benign, especially when the nodule size is small. This study focused on the patients who needed surgery results to confirm tumor malignancy following LDCT detection of lung nodules. Therefore, there were more subjects in the cancer group than in the non-cancer group. Analyzing LDCT images of patients diagnosed with lung cancer can provide clinicians with information on lung cancer identification, thereby reducing unnecessary surgery.
We investigated 40 variables from health examinations and LDCT reports as listed in Table 1 and Table 2. The binary variables with No/Yes were coded as 0/1; female/male as 0/1. The history of several diseases was investigated to study their potential relationship with lung cancer. For example, the variable “COPD” was coded as 1 if any of the following keywords were found in examination reports: chronic obstructive pulmonary disease (COPD), chronic bronchitis, and emphysema. As for LDCT examination, this study used important variables related to nodule counts, size, pattern, and location from the text report provided by radiologists for analysis.
This study performed statistical tests on the significance and independence of variables. Before testing the difference of a continuous variable between the cancer and the non-cancer groups, the Anderson–Darling (AD) test for normality was firstly applied. If data were normally distributed, the t-test was applied to test the difference in mean. Otherwise, the non-parametric rank sum test was applied to test the difference in median. As for assessing the independence of a categorical variable on the variable of groups, the chi-squared test was applied if the expected frequency of the cell in the contingency table was at least five. Otherwise, since the approximation method of the chi-squared test was inappropriate, the Fisher’s exact test was applied to test independence.
The risk model–built phase contained three steps: (1) data balancing, (2) regularized regression, and (3) cross validation. In order to have a better overall prediction performance in the two groups, this study used the synthetic minority over-sampling technique (SMOTE) [20] to balance the sample size of the two groups before applying classifiers. The SMOTE method firstly selects an instance in the minority class, and finds its k nearest neighbors of the same class. Then, a synthetic instance is generated between the selected instance and one of its k neighbors. To overcome the issues of multicollinearity among predictor variables and model over-fitting, this research used the regularized regression analysis to consider both model predictability and interpretability. To avoid obtaining complex models, regularized regression shrinks the coefficient of insignificant variables towards zero by assigning penalty to the magnitude of regression coefficients, as well as the magnitude of error terms. This study compared three classical regularized regression models, ridge regression [21], least absolute shrinkage and selection operator (Lasso) [22], and elastic net [23] to build the prediction model of stage I lung cancer.
Lasso regression imposes an L1-penalty on the regression coefficient, which produces a sparse model by forcing the coefficient of the insignificant variable to zero. The method tends to select one significant variable from a group but skip the other correlated variables. On the other hand, ridge regression imposes an L2-penalty, which makes the coefficients of insignificant variables close to zero. Elastic net can be considered as the combination of Lasso and ridge regression, which imposes both L1 and L2 penalties on the regression coefficients. The objective function is
min β 0 ,   β [ 1 n i = 1 n y i ( β 0 + x i T β ) log ( 1 + e ( β 0 + x i T β ) ) ] + λ [ ( 1 α ) β 2 2 / 2 + α β 1 ]
where the parameter λ adjusts the intensity of the penalty term; parameter α assigns different weights to L1 and L2 penalties. Elastic net can simultaneously perform variable selection and regularization. Correlated variables are selected in groups if significant by using the method. The elastic net model reduces to Lasso when α = 1, and reduces to ridge regression when α = 0.

3. Results

3.1. Summary Statistics

In this retrospective study, 133 subjects were selected according to the inclusion and exclusion criteria from a medical center between 2007 and 2017 in Taiwan. During the time period investigated, only two patients underwent two LDCT examinations. This study selected their first examination results for analysis. One-time records were to avoid having correlated data from multiple visits by the same subject. The count ratio of the cancer group to the non-cancer groups was 2.7:1. The descriptive statistics and the statistical test results are summarized in Table 3 and Table 4.
Among the continuous variables, “Age”, “BMI”, “HGB”, “WBC”, and “Platelet” were normally distributed by the AD test with p-values greater than 0.05. The t-test was then used to compare the difference of the two groups in mean for these five variables. On the other hand, “Count”, “Diameter”, “BUN“, ”Creatinine”, and “ALT” were not normally distributed by the AD test with p-values less than 0.05. The rank sum test was used to test the difference in median. Among these ten continuous variables, only age (p-value = 0.026), nodule counts (p-value = 0.000+) and diameter (p-value = 0.003) are significant variables to lung cancer. The average age (61.33 vs. 56.58) and the median diameter of the maximum nodule (1.67 vs. 1.48) of the cancer group were higher than that of the non-cancer group. The results support that increasing age is a risk factor for lung cancer, and larger nodules are more likely to be cancerous. The median nodule count of the cancer group was lower than that of the non-cancer group (1.57 vs. 3.08). In the result of the routine blood tests, the mean values of blood urea nitrogen, creatinine, alanine aminotransferase, and white blood cell count of the cancer groups were slightly higher than those of the non-cancer group. However, the differences were insignificant.
To test the independence of the variables on groups, the chi-square tests were performed on the variables “Gender”, “Smoke”, “Hypertension”, “Cardiovascular Disease”, “GGO”, “Upper”, “Middle”, and “Lower”; the Fisher’s exact tests were performed on the rest of the 22 categorical variables. Among these categorical variables, only “Spiculated” (p-value = 0.000+), “Middle” (p-value = 0.002), “Digestive System” (p-value = 0.019), and “Solid” (p-value = 0.052) were dependent on the group with p-values below or around 0.05. The results demonstrated that the LDCT report is informative to determining lung cancer, especially the description of nodule counts, size, and morphology. The non-cancer group had a higher percentage of solid nodules (91.67% vs. 76.29%) or nodules in the middle lobe (30.56% vs. 9.28%) than in the cancer group. On the contrary, spiculated nodules occurred only in the cancer group but not the non-cancer group (0% vs. 29.90%). There were no significant differences between the two groups in the percentages of having a family history of lung cancer and personal medical history. Notably, the non-cancer group had a higher percentage of digested-related diseases, such as colorectal polyp, gastric ulcer (GU), gastroesophageal reflux disease (GERD), and anus polyp, than the cancer group (11.11% vs. 1.03%).

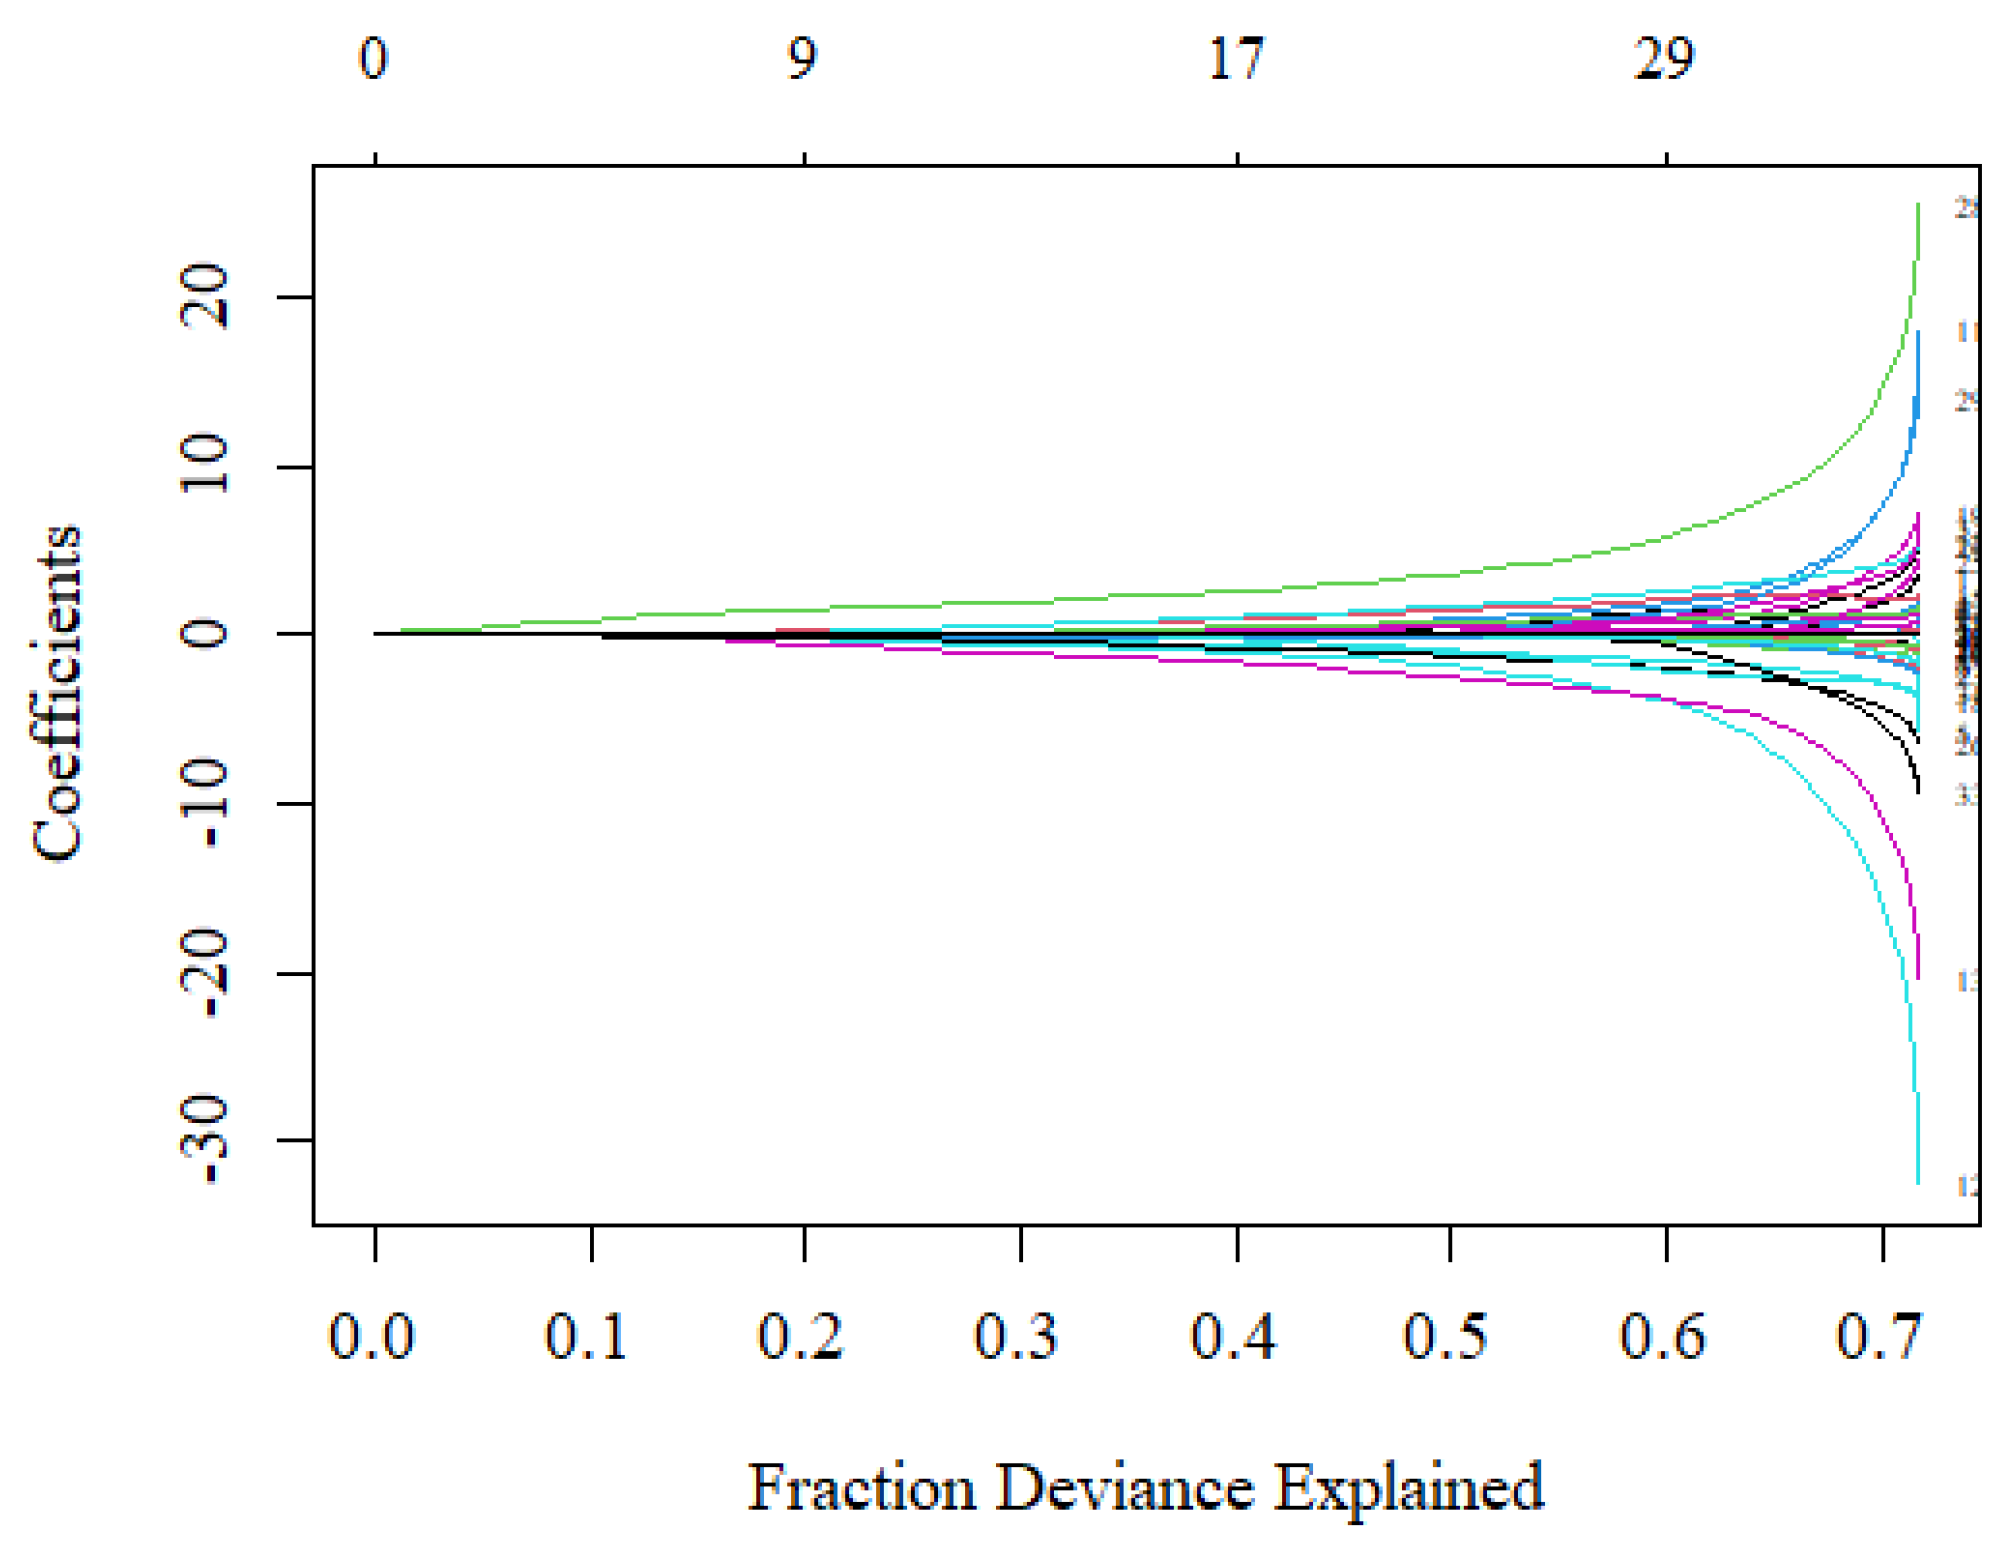
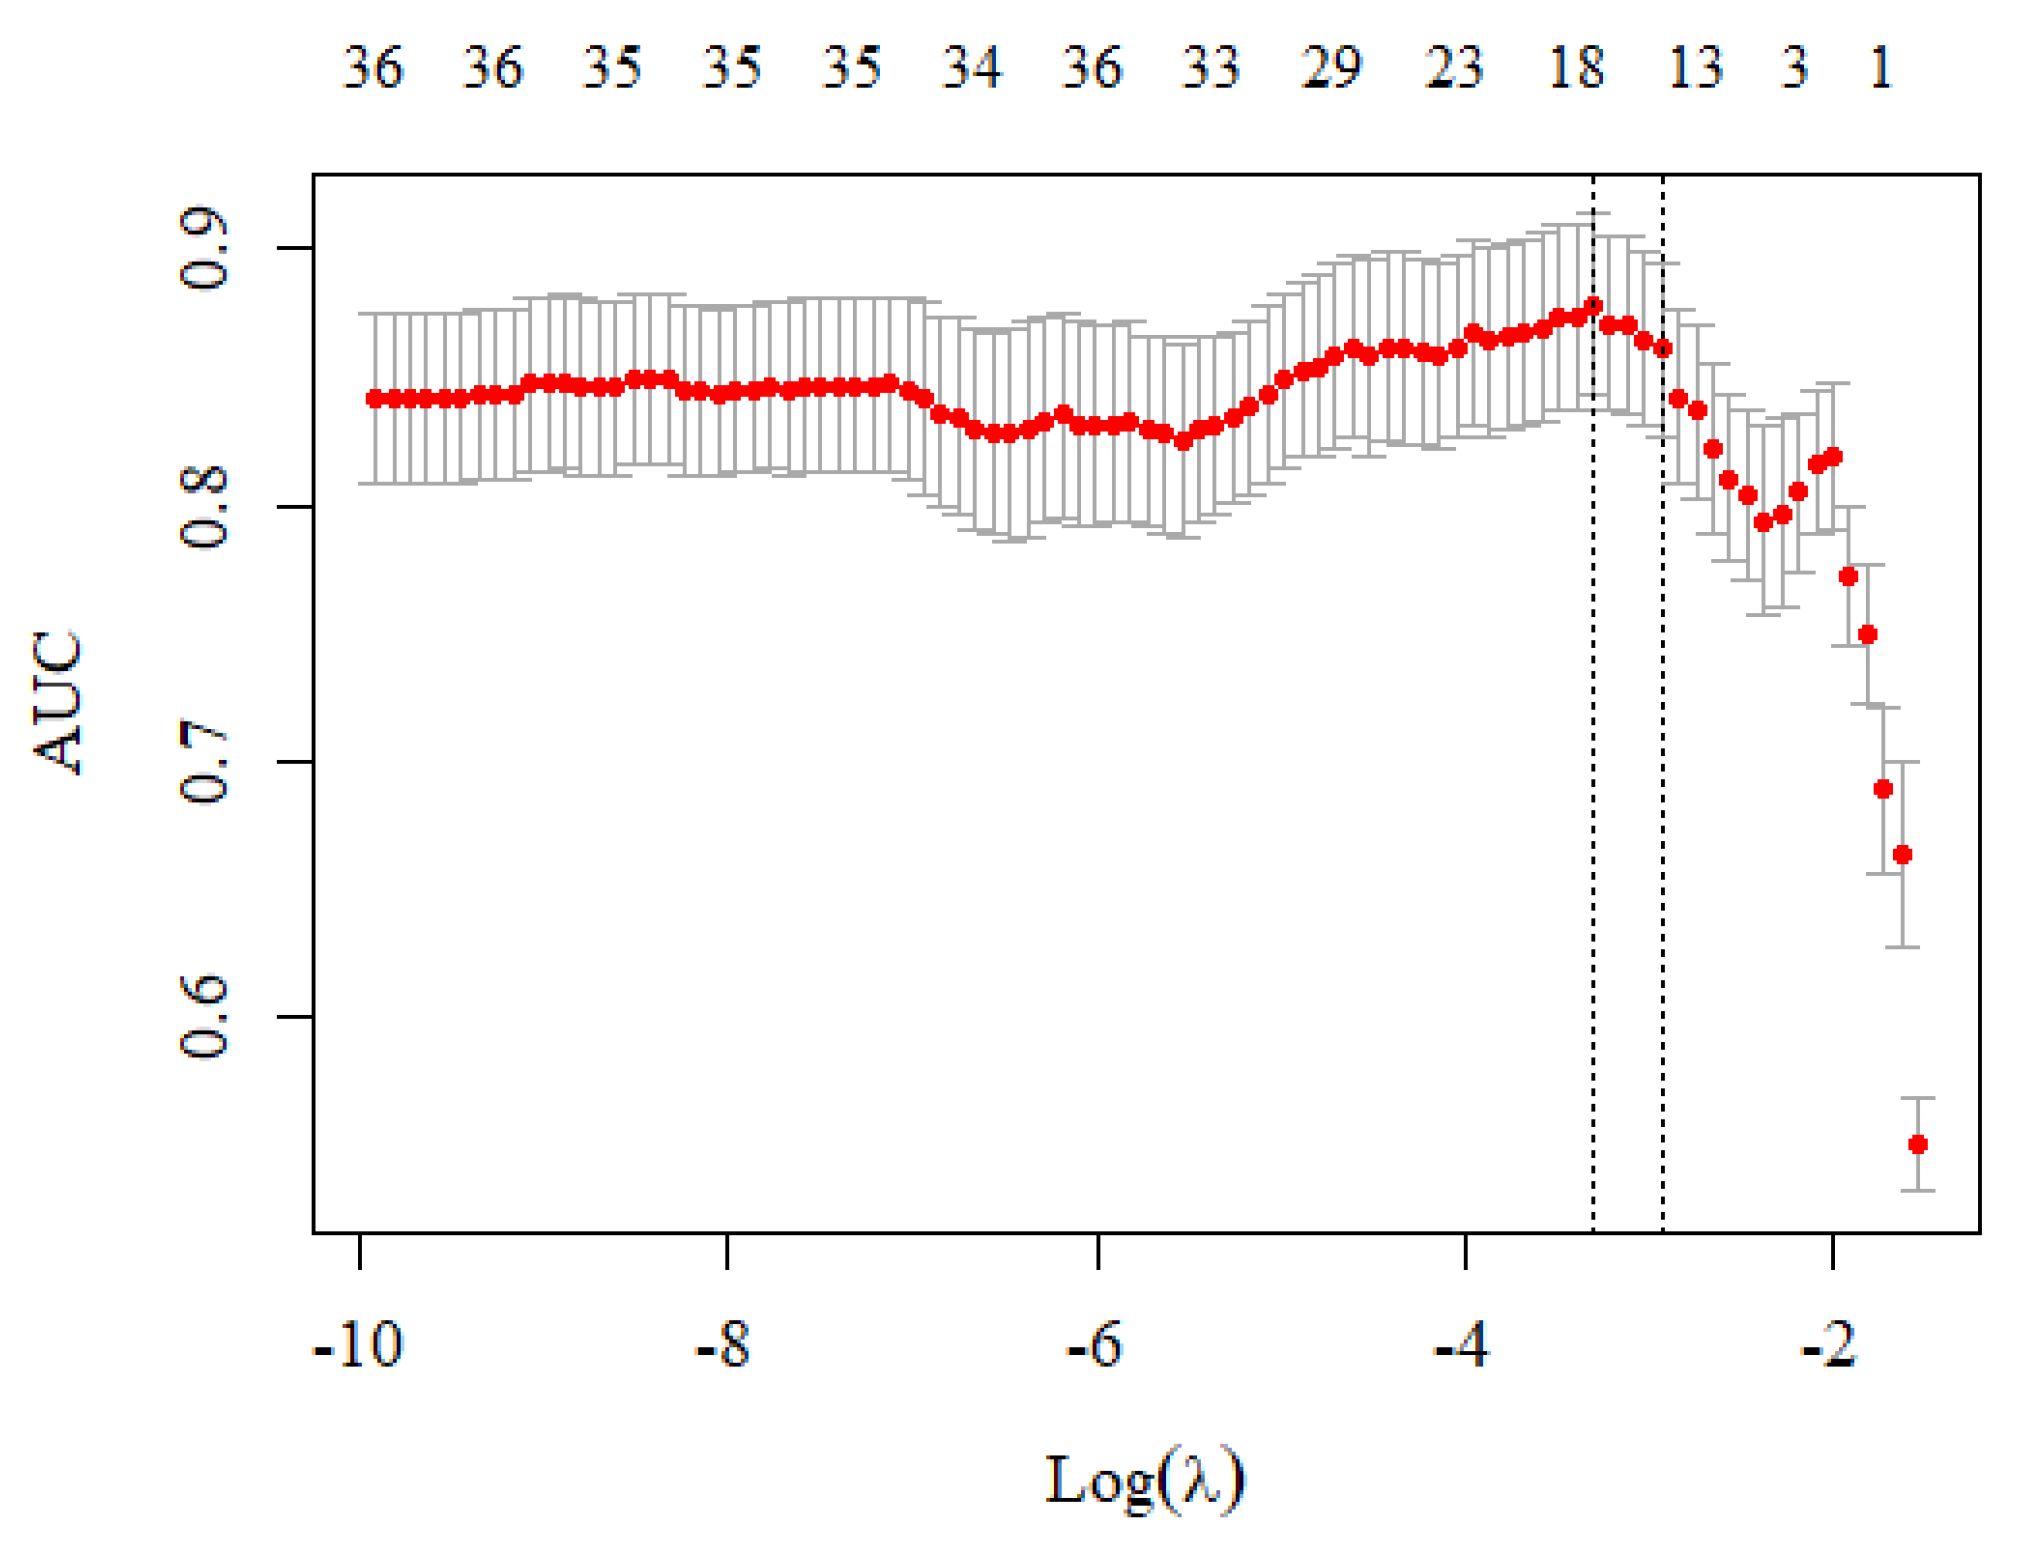
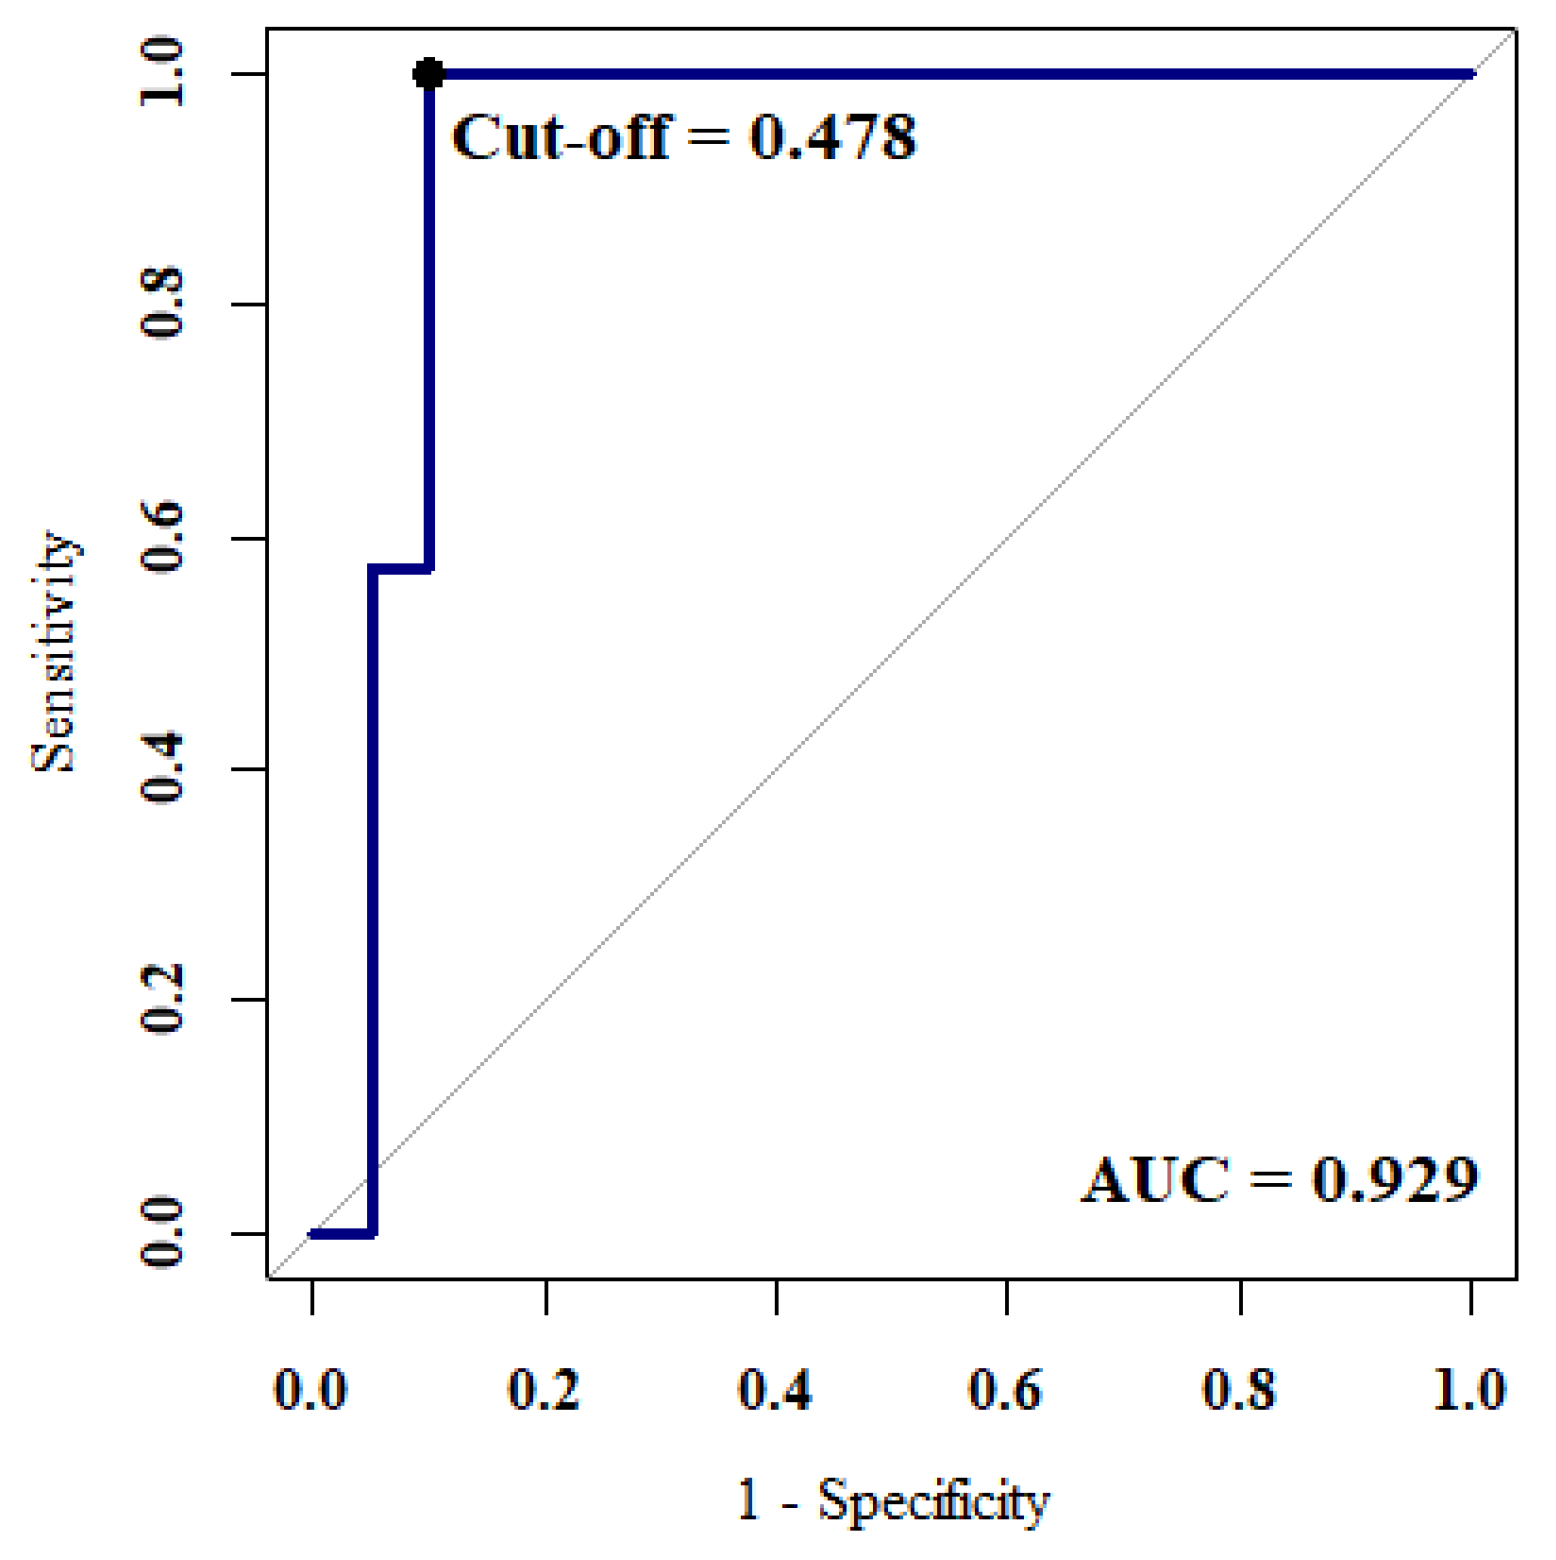
3.2. Model Evaluation

The analysis used the smotefamily and glmnet packages in the R language to perform SMOTE and regularized regression. A total of 133 de-identified samples were split at a ratio of 8:2, 106 training data and 27 test data. The analysis applied the SMOTE method to balance the data counts between the cancer and non-cancer groups before constructing the classification models. The cv.glmnet function was used to search for the optimal value of λ in each fold based on the AUC criterion. The suggested model used 17 variables where the AUC was maximized at λ = 0.037, that was ln λ = −3.306 (the left vertical-dotted line in Figure 2). Although using more than 17 variables would increase the fraction of deviance explained, the model would be over-fitting, which can be observed from the large difference in coefficient values (Figure 3). Therefore, the proposed risk model selected 17 out of 40 variables.
The average prediction performance by using the three regularized regression models were similar (Table 5). The best risk prediction model used seven variables from LDCT and ten variables from health examinations to predict the probability of having stage I lung cancer. The regression model is
ln odds = 2.685 × Spiculated + 1.122 × Part Solid + 0.476 × GGO − 0.114 × Count
− 0.153 × Solid − 0.324 × Calcified − 0.802 × Middle + 0.997 × Diabetes
+ 0.383 × Gout + 0.321 × COPD + 0.249 × Other Cancer + 0.100 × WBC
+ 0.016 × BUN + 0.002 × Age − 0.717 × Thyroid − 1.118 × Liver
− 1.733 × Digestive System
The AUC reached 0.93. The optimal parameter settings were λ = 0.037 and α = 1, which was a Lasso model. Adding L1 penalty on the regression coefficients shrank the coefficients of the insignificant variables to zero. The best cut-off point was 0.478 where the maximum value of Youden’s index was 0.9 (Figure 4).

4. Discussion and Conclusions

Early detection is important to decrease the mortality rate of lung cancer. Although LDCT is known to be sensitive to small nodules in the high-risk group, its false positive rate is high. To effectively detect lung cancer in the early stage, this research used LDCT and health examination data to predict stage I lung cancer. We used and compared the prediction performance of three regularized regression models, Lasso, ridge regression, and elastic net. The best model was the Lasso regression using 17 variables, which had an AUC of 0.93, a sensitivity of 0.85, and an F1-measure of 0.92. Lasso regression can handle multicollinearity and perform variable selection by shrinking insignificant coefficients to zero, thereby improving model interpretability.
The result demonstrated that nodule features obtained from LDCT, blood test results, age and disease history were informative to assessing the risk of lung cancer. In the proposed risk model, ten variables had positive coefficients (“Spiculated”, “Part Solid”, “GGO”, “Diabetes”, “Gout”, “COPD”, “Other Cancers”, “WBC”, “BUN”, and “Age”) and seven variables had negative coefficients (“Count”, “Solid”, “Calcified”, “Middle”, “Thyroid”, “Liver”, and “Digestive System”). The model exhibited that the morphology, texture, appearance, and location of nodules were important to evaluate the risk of lung cancer. The coefficient of the variable, “Spiculated“, was the largest in the model (2.685), suggesting that nodules with spiculated borders were highly suspected of malignancy. The finding was consistent with the results in [24]. In addition, the odds of stage I lung cancer were higher in the presence of partial solid nodules or GGO, but lower in the presence of solid nodules or calcification patterns. Similar findings were found in literature [25,26]. Nevertheless, the benign and malignant patterns of calcification should be carefully differentiated, as discussed in [27].
As for the selected variables collected from health examinations, age was known to be the risk factor of lung cancer. In the proposed risk model, a positive coefficient (0.321) for the variable “COPD” indicated a higher risk of lung cancer in the presence of COPD, chronic bronchitis, or emphysema. The phenomenon may be due to smoking being one of the major risk factors for COPD, thereby putting COPD patients at a higher risk of lung cancer. In the study [28], the relative risk of lung cancer for subjects with a previous history of COPD, chronic bronchitis, or emphysema was 2.22, compared with 1.22 for nonsmokers with these lung diseases. Diabetes (coefficient = 0.997) and gout (coefficient = 0.383) are suspected risk factors of lung cancer as mentioned in [29,30,31], although their relationship is not fully understood. This may be due to the fact that patients with diabetes or gout are often associated with obesity and smoking, which are common factors of many cancers. Notably, smoking was not selected in the prediction model. This may be due to the low smoking prevalence in East Asia, especially in females. In the study [32], about one-third of lung cancer patients in East Asia have never smoked. The characteristics of lung cancer in smokers and nonsmokers are different. Frequent epidermal growth factor receptor (EGFR) mutations were observed in the specimens of Asian patients with non-small-cell lung cancer and nonsmokers [33,34].
This study investigated suspicious patients who required surgical confirmation after undergoing LDCT. This was the group of patients whose lung cancers were difficult to distinguish based on LDCT images alone. The findings of this study provided information for evaluating the risk of stage I lung cancer. However, the limitations were the small sample size and potential bias in the selection of subjects. In this study, several diseases were selected as the predictors of lung cancer. However, the selected variables do not necessarily have a causation with lung cancer. The association between these diseases and lung cancer is worthy of further clinical study.

Author Contributions

Conceptualization, H.-T.C. and C.-J.L.; methodology, C.-J.L.; validation, C.-J.L. and P.-H.W.; formal analysis, W.-F.C.; investigation, C.-J.L. and P.-H.W.; data curation, H.-T.C. and P.-H.W.; writing—original draft preparation, C.-J.L.; writing—review and editing, C.-J.L. and H.-T.C. All authors have read and agreed to the published version of the manuscript.

Funding

This research was funded by the Academic Cooperation Program between Yuan Ze University and Far Eastern Memorial Hospital (grant number FEMH-YZU-2018-017) and the Ministry of Science and Technology of Taiwan, R.O.C. (grant number MOST 108-2221-E-155-020).

Institutional Review Board Statement

The study was conducted in accordance with the Declaration of Helsinki, and approved by the Institutional Review Board of Far Eastern Memorial Hospital (protocol code FEMH No: 107065-E).

Informed Consent Statement

The Institutional Review Board of Far Eastern Memorial Hospital approved this study (IRB No: 107065-E) and waived the requirement for patient consent due to the retrospective nature of the study, and the analysis used anonymous data.

Data Availability Statement

Data are available from the Institutional Review Board of the Far Eastern Memorial Hospital for researchers who meet the criteria for the access of confidential data. Requests for the data may be sent to the Institutional Review Board of the Far Eastern Memorial Hospital, New Taipei City, Taiwan ([email protected]).

Acknowledgments

The authors would like to thank Florence Leony for preparing the figures.

Conflicts of Interest

The authors declare no conflict of interest.

References

  1. Sung, H.; Ferlay, J.; Siegel, R.L.; Laversanne, M.; Soerjomataram, I.; Jemal, A.; Bray, F. Global cancer statistics 2020: GLOBOCAN estimates of incidence and mortality worldwide for 36 cancers in 185 countries. CA Cancer J. Clin. 2021, 71, 209–249. [Google Scholar] [CrossRef] [PubMed]
  2. National Cancer Institute. SEER Cancer Statistics Review, 1975–2018. Available online: https://seer.cancer.gov/csr/1975_2018/results_merged/sect_01_overview.pdf (accessed on 2 April 2022).
  3. Del Ciello, A.; Franchi, P.; Contegiacomo, A.; Cicchetti, G.; Bonomo, L.; Larici, A.R. Missed lung cancer: When, where, and why? Diagn. Interv. Radiol. 2017, 23, 118–126. [Google Scholar] [CrossRef] [PubMed] [Green Version]
  4. Shah, P.K.; Austin, J.H.; White, C.S.; Patel, P.; Haramati, L.B.; Pearson, G.D.; Shiau, M.C.; Berkmen, Y.M. Missed non–small cell lung cancer: Radiographic findings of potentially resectable lesions evident only in Retrospect. Radiology 2003, 226, 235–241. [Google Scholar] [CrossRef] [PubMed]
  5. Tack, D.; Howarth, N. Missed lung lesions: Side by side comparison of chest radiography with MDCT. In Diseases of the Chest and Heart 2015–2018: Diagnostic Imaging and Interventional Techniques; Hodler, J., von Schulthess, G.K., Kubik-Huch, R.A., Zollikofer, C.L., Eds.; Springer: Milan, Italy, 2015; pp. 80–87. [Google Scholar]
  6. Blanchon, T.; Bréchot, J.M.; Grenier, P.A.; Ferretti, G.R.; Lemarié, E.; Milleron, B.; Chagué, D.; Laurent, F.; Martinet, Y.; Beigelman-Aubry, C.; et al. Baseline results of the Depiscan study: A French randomized pilot trial of lung cancer screening comparing low dose CT scan (LDCT) and chest X-ray (CXR). Lung Cancer 2007, 58, 50–58. [Google Scholar] [CrossRef] [PubMed]
  7. The National Lung Screening Trial Research Team. Reduced lung-cancer mortality with low-dose computed tomographic screening. N. Engl. J. Med. 2011, 365, 395–409. [Google Scholar] [CrossRef] [PubMed] [Green Version]
  8. de Koning, H.J.; van der Aalst, C.M.; de Jong, P.A.; Scholten, E.T.; Nackaerts, K.; Heuvelmans, M.A.; Lammers, J.W.J.; Weenink, C.; Yousaf-Khan, U.; Horeweg, N.; et al. Reduced lung-cancer mortality with volume CT screening in a randomized trial. N. Engl. J. Med. 2020, 382, 503–513. [Google Scholar] [CrossRef]
  9. Becker, N.; Motsch, E.; Trotter, A.; Heussel, C.P.; Dienemann, H.; Schnabel, P.A.; Kauczor, H.U.; Maldonado, S.G.; Miller, A.B.; Kaaks, R.; et al. Lung cancer mortality reduction by LDCT screening–Results from the randomized German LUSI trial. Int. J. Cancer 2020, 146, 1503–1513. [Google Scholar] [CrossRef]
  10. Field, J.K.; Vulkan, D.; Davies, M.P.; Baldwin, D.R.; Brain, K.E.; Devaraj, A.; Eisen, T.; Gosney, J.; Green, B.A.; Holemans, J.A.; et al. Lung cancer mortality reduction by LDCT screening: UKLS randomised trial results and international meta-analysis. Lancet Reg. Health Eur. 2021, 10, 100179. [Google Scholar] [CrossRef]
  11. Saltybaeva, N.; Martini, K.; Frauenfelder, T.; Alkadhi, H. Organ dose and attributable cancer risk in lung cancer screening with low-dose computed tomography. PLoS ONE 2016, 11, e0155722. [Google Scholar] [CrossRef] [Green Version]
  12. Fu, C.; Liu, Z.; Zhu, F.; Li, S.; Jiang, L. A meta-analysis: Is low-dose computed tomography a superior method for risky lung cancers screening population? Clin. Respir. J. 2016, 10, 333–341. [Google Scholar] [CrossRef]
  13. Tammemagi, M.C.; Lam, S. Screening for lung cancer using low dose computed tomography. BMJ 2014, 348, 2253. [Google Scholar] [CrossRef] [PubMed] [Green Version]
  14. Patz, E.F.; Pinsky, P.; Gatsonis, C.; Sicks, J.D.; Kramer, B.S.; Tammemagi, M.C.; Chiles, C.; Black, W.C.; Aberle, D.R. Overdiagnosis in low-dose computed tomography screening for lung cancer. JAMA Intern. Med. 2014, 174, 269–274. [Google Scholar] [CrossRef] [PubMed]
  15. Cui, J.W.; Li, W.; Han, F.J.; Liu, Y.D. Screening for lung cancer using low-dose computed tomography: Concerns about the application in low-risk individuals. Transl. Lung Cancer Res. 2015, 4, 275–286. [Google Scholar] [PubMed]
  16. Jonas, D.E.; Reuland, D.S.; Reddy, S.M.; Nagle, M.; Clark, S.D.; Weber, R.P.; Enyioha, C.; Malo, T.L.; Brenner, A.T.; Armstrong, C.; et al. Screening for lung cancer with low-dose computed tomography: Updated evidence report and systematic review for the US Preventive Services Task Force. JAMA 2021, 325, 971–987. [Google Scholar] [CrossRef] [PubMed]
  17. Lam, S.; Tammemagi, M. Contemporary issues in the implementation of lung cancer screening. Eur. Resp. Rev. 2021, 30, 200288. [Google Scholar] [CrossRef] [PubMed]
  18. Kaaks, R.; Delorme, S. Lung cancer screening by low-dose computed tomography–Part 1: Expected benefits, possible harms, and criteria for eligibility and population targeting. RoFo 2021, 193, 527–536. [Google Scholar] [CrossRef] [PubMed]
  19. Oudkerk, M.; Liu, S.Y.; Heuvelmans, M.A.; Walter, J.E.; Field, J.K. Lung cancer LDCT screening and mortality reduction-evidence, pitfalls and future perspectives. Nat. Rev. Clin. Oncol. 2021, 18, 135–151. [Google Scholar] [CrossRef]
  20. Chawla, N.V.; Bowyer, K.W.; Hall, L.O.; Kegelmeyer, W.P. SMOTE: Synthetic minority oversampling technique. J. Artif. Intellig. Res. 2002, 16, 321–357. [Google Scholar] [CrossRef]
  21. Hoerl, A.E.; Kennard, R.W. Ridge regression: Biased estimation for nonorthogonal problems. Technometrics 1970, 12, 55–67. [Google Scholar] [CrossRef]
  22. Tibshirani, R. Regression shrinkage and selection via the lasso. J. Roy. Stat. Soc. B Met. 1996, 58, 267–288. [Google Scholar] [CrossRef]
  23. Zou, H.; Hastie, T. Regularization and variable selection via the elastic net. J. R. Stat. Soc. B 2005, 67, 301–320. [Google Scholar] [CrossRef] [Green Version]
  24. Lee, G.; Lee, H.Y.; Park, H.; Schiebler, M.L.; van Beek, E.J.R.; Ohno, Y.; Seo, J.B.; Leung, A. Radiomics and its emerging role in lung cancer research, imaging biomarkers and clinical management: State of the art. Eur. J. Radiol. 2017, 86, 297–307. [Google Scholar] [CrossRef] [PubMed]
  25. Naidich, D.P.; Bankier, A.A.; MacMahon, H.; Schaefer-Prokop, C.M.; Pistolesi, M.; Goo, J.M.; Macchiarini, P.; Crapo, J.D.; Herold, C.J.; Austin, J.H.; et al. Recommendations for the management of subsolid pulmonary nodules detected at CT: A statement from the Fleischner Society. Radiology 2013, 266, 304–317. [Google Scholar] [CrossRef] [PubMed]
  26. Firmino, M.; Angelo, G.; Morais, H.; Dantas, M.R.; Valentim, R. Computer-aided detection (CADe) and diagnosis (CADx) system for lung cancer with likelihood of malignancy. BioMed. Eng. OnLine 2016, 15, 2. [Google Scholar] [CrossRef] [Green Version]
  27. Erasmus, J.J.; Connolly, J.E.; McAdams, H.P.; Roggli, V.L. Solitary pulmonary nodules: Part I. Morphologic evaluation for differentiation of benign and malignant lesions. Radiographics 2000, 20, 43–58. [Google Scholar] [CrossRef]
  28. Brenner, D.R.; McLaughlin, J.R.; Hung, R.J. Previous lung diseases and lung cancer risk: A systematic review and meta-analysis. PLoS ONE 2011, 6, e17479. [Google Scholar] [CrossRef]
  29. Lee, J.Y.; Jeon, I.; Lee, J.M.; Yoon, J.M.; Park, S.M. Diabetes mellitus as an independent risk factor for lung cancer: A meta-analysis of observational studies. Eur. J. Cancer 2013, 49, 2411–2423. [Google Scholar] [CrossRef]
  30. Wang, W.; Xu, D.; Wang, B.; Yan, S.; Wang, X.; Yin, Y.; Wang, X.; Sun, B.; Sun, X. Increased risk of cancer in relation to gout: A Review of three prospective cohort studies with 50,358 subjects. Mediat. Inflamm. 2015, 2015, 680853. [Google Scholar] [CrossRef] [Green Version]
  31. Lee, J.S.; Myung, J.; Lee, H.A.; Hong, S.; Lee, C.K.; Yoo, B.; Oh, J.S.; Kim, Y.G. Risk of cancer in middle-aged patients with gout: A nationwide population-based study in Korea. J. Rheumatol. 2021, 48, 1465–1471. [Google Scholar] [CrossRef]
  32. Zhou, F.; Zhou, C. Lung cancer in never smokers—The East Asian experience. Transl. Lung Cancer Res. 2018, 7, 450. [Google Scholar] [CrossRef]
  33. Shi, Y.; Au, J.S.K.; Thongprasert, S.; Srinivasan, S.; Tsai, C.M.; Khoa, M.T.; Heeroma, K.; Itoh, Y.; Cornelio, G.; Yang, P.C. A prospective, molecular epidemiology study of EGFR mutations in Asian patients with advanced non–small-cell lung cancer of adenocarcinoma histology (PIONEER). J. Thorac. Oncol. 2014, 9, 154–162. [Google Scholar] [CrossRef] [PubMed] [Green Version]
  34. Mitsudomi, T. Molecular epidemiology of lung cancer and geographic variations with special reference to EGFR mutations. Transl. Lung Cancer Res. 2014, 3, 205. [Google Scholar] [PubMed]
Figure 1. The flowchart of the proposed method.
Ijerph 19 04633 g001
Figure 2. The cross-validation curve at different λ values. The left vertical-dotted line with ln λ = −3.306 (or λ = 0.037) had the highest AUC value, indicating that the model used 17 variables that had the best prediction performance.
Ijerph 19 04633 g002
Figure 3. The fraction of deviance explained on the training data when using different numbers of variables. The coefficients of the variables did not differ a lot when selecting 17 variables in the regression model.
Ijerph 19 04633 g003
Figure 4. The ROC curve of the best model reached an AUC value of 0.929. The best cut-off value of the proposed regression model was 0.478.
Ijerph 19 04633 g004
Table 1. The 26 investigated variables from health examinations, including physical examinations, medical history, family history of lung cancer, and blood tests. Of these, 18 binary variables were coded as 0/1 for No/Yes or female/male. The other eight continuous variables were from blood test results.
VariableCodingDescription
Gender0/1Female/male
Smoke0/1Non-smoking/smoking
PTB0/1Tuberculosis (TB), old TB, or tuberculous pleurisy
Lung radiation0/1Radiation exposure to lung
Asthma0/1Asthma record
COPD0/1Chronic obstructive pulmonary disease, chronic bronchitis, or emphysema
Myoma0/1Myoma record
Diabetes0/1Diabetes record
Hypertension0/1Hypertension record
CVA0/1Cerebrovascular accident
Gout0/1Gout, hyperuricemia
Liver0/1Diseases related to liver
Cardiovascular disease0/1Diseases related to heart or blood vessels, such as arrhythmia, atrial fibrillation (AF), valvular cardiac valve disease, peripheral arterial occlusive disease (PAOD), and dyslipidemia, and hyperlipidemia.
Digestive system0/1Diseases related to digestive system, such as colorectal polyp, gastric ulcer (GU), gastroesophageal reflux disease (GERD), and anus polyp.
Urinary system0/1Diseases related to urinary system, such as penile tumors, benign prostatic hyperplasia (BPH), ureteral stone, renal stone, and nephrectomy.
Thyroid0/1Diseases related to thyroid, such as thyroid tumor, hypothyroidism, thyroid nodule, thyroidectomy, and goiter.
Other cancer0/1Cancer record other than lung cancer
Family lung cancer0/1Family history of lung cancer
Age age at visit (years)
BMI Body mass index (BMI) (kg/m2)
BUN Blood urea nitrogen (BUN) (mg/dL)
Creatinine Creatinine (mg/dL)
ALT Alanine aminotransferase (ALT) (IU/L)
HGB Hemoglobin (HGB) (g/dL)
WBC White blood cell count (SBC) (103/μL)
Platelet Platelet (103/μL)
Table 2. The 14 investigated variables from LDCT text reports. Of these, 12 binary variables were coded as 0/1 for No/Yes to describe the presence of nodule pattern, location, and lung condition. The other two continuous variables were nodule count and size.
VariableCodingDescription
Count Total nodule counts
Diameter The diameter of the maximum nodule (cm)
GGO0/1Presence of ground-glass opacity (GGO)
Solid0/1Presence of solid nodule
Part Solid0/1Presence of partial solid nodule
Upper0/1Presence of nodule at middle lobe
Middle0/1Presence of nodule at upper lobe
Lower0/1Presence of nodule at lower lobe
Spiculated0/1Presence of spiculation feature
Fibrotic0/1Presence of fibrotic pattern
Mosaic0/1Presence of mosaic pattern
Calcified0/1Presence of calcification pattern
Pneumothorax0/1Presence of pneumothorax
Pleural Effusion0/1Presence of pleural effusion
Table 3. The mean (standard deviation) of the continuous variables in the cancer and non-cancer groups, and the p-values of testing the significance of the variables. Age, nodule count, and diameter were found to be significant to lung cancer with p-values less than 0.05.
VariableNon-CancerCancerp-Value
Count3.08 (2.50)1.57 (1.39)0.000
Diameter1.48 (1.64)1.67 (0.83)0.003
Age a56.58 (9.86)61.33 (11.11)0.026
BMI a24.29 (3.28)24.19 (3.24)0.877
BUN15.41 (4.85)18.35 (10.36)0.094
Creatinine0.93 (0.79)1.08 (1.50)0.484
ALT22.08 (8.92)23.61 (18.11)0.639
HGB a13.32 (1.27)13.29 (1.66)0.926
WBC a6.29 (1.50)6.61 (1.90)0.372
Platelet a221.58 (47.05)219.8 (50.95)0.855
a Normally distributed variables by the AD test with p-value > 0.05.
Table 4. The proportion of the binary variables coded as 1 in the cancer and non-cancer groups, and the p-values of the tests for independence. Among these binary variables, having diseases related to the digestive system, nodules in the middle lobe, and spiculated nodules were significant to lung cancer.
VariableNon-CancerCancerp-Value
Gender a 0.554
  Female58.3352.58
  Male41.6747.42
Smoke a33.3331.960.880
PTB0.006.190.190
Lung radiation0.001.031.000
Asthma2.782.061.000
COPD8.3316.490.278
Myoma0.001.031.000
Diabetes8.3316.490.278
Hypertension a27.7838.140.266
CVA0.003.090.563
Gout0.003.090.563
Liver5.561.030.178
Cardiovascular disease a22.2217.530.538
Digestive System11.111.030.019
Urinary System8.3312.370.759
Thyroid11.114.120.211
Other Cancer5.5614.430.233
Family lung cancer2.782.061.000
GGO a27.7832.990.566
Solid91.6776.290.052
Part Solid2.7811.340.179
Upper a80.5669.070.189
Middle a30.569.280.002
Lower a63.8952.580.243
Spiculated0.0029.900.000
Fibrotic11.1115.460.781
Mosaic2.781.030.470
Calcified11.119.280.748
Pneumothorax0.001.031.000
Pleural Effusion2.786.190.674
a Chi-squared test was applied. Otherwise, Fisher’s exact test was applied.
Table 5. The prediction performance of the three regularized regression models. The best model that had the highest AUC value was a Lasso model by using λ = 0.037 and α = 1.
Average of 5-Fold Cross Validation
LassoRidgeElastic NetBest Model
(α = 1, λ = 0.037)
Accuracy0.720.730.730.89
Sensitivity0.750.780.750.85
Specificity0.640.580.671.00
Precision0.840.830.861.00
F1-measure0.790.800.800.92
G-mean0.680.670.700.92
AUC0.780.770.770.93
Publisher’s Note: MDPI stays neutral with regard to jurisdictional claims in published maps and institutional affiliations.

