
Remote Sensing Approaches for Meteorological Disaster Monitoring: Recent Achievements and New Challenges


Abstract
1. Introduction
- (1)
- What are the objectives of meteorological disaster process monitoring?
- (2)
- How are remote sensing approaches being used for meteorological disaster process monitoring?
- (3)
- What are the current gaps in remote sensing-based meteorological disaster process monitoring?
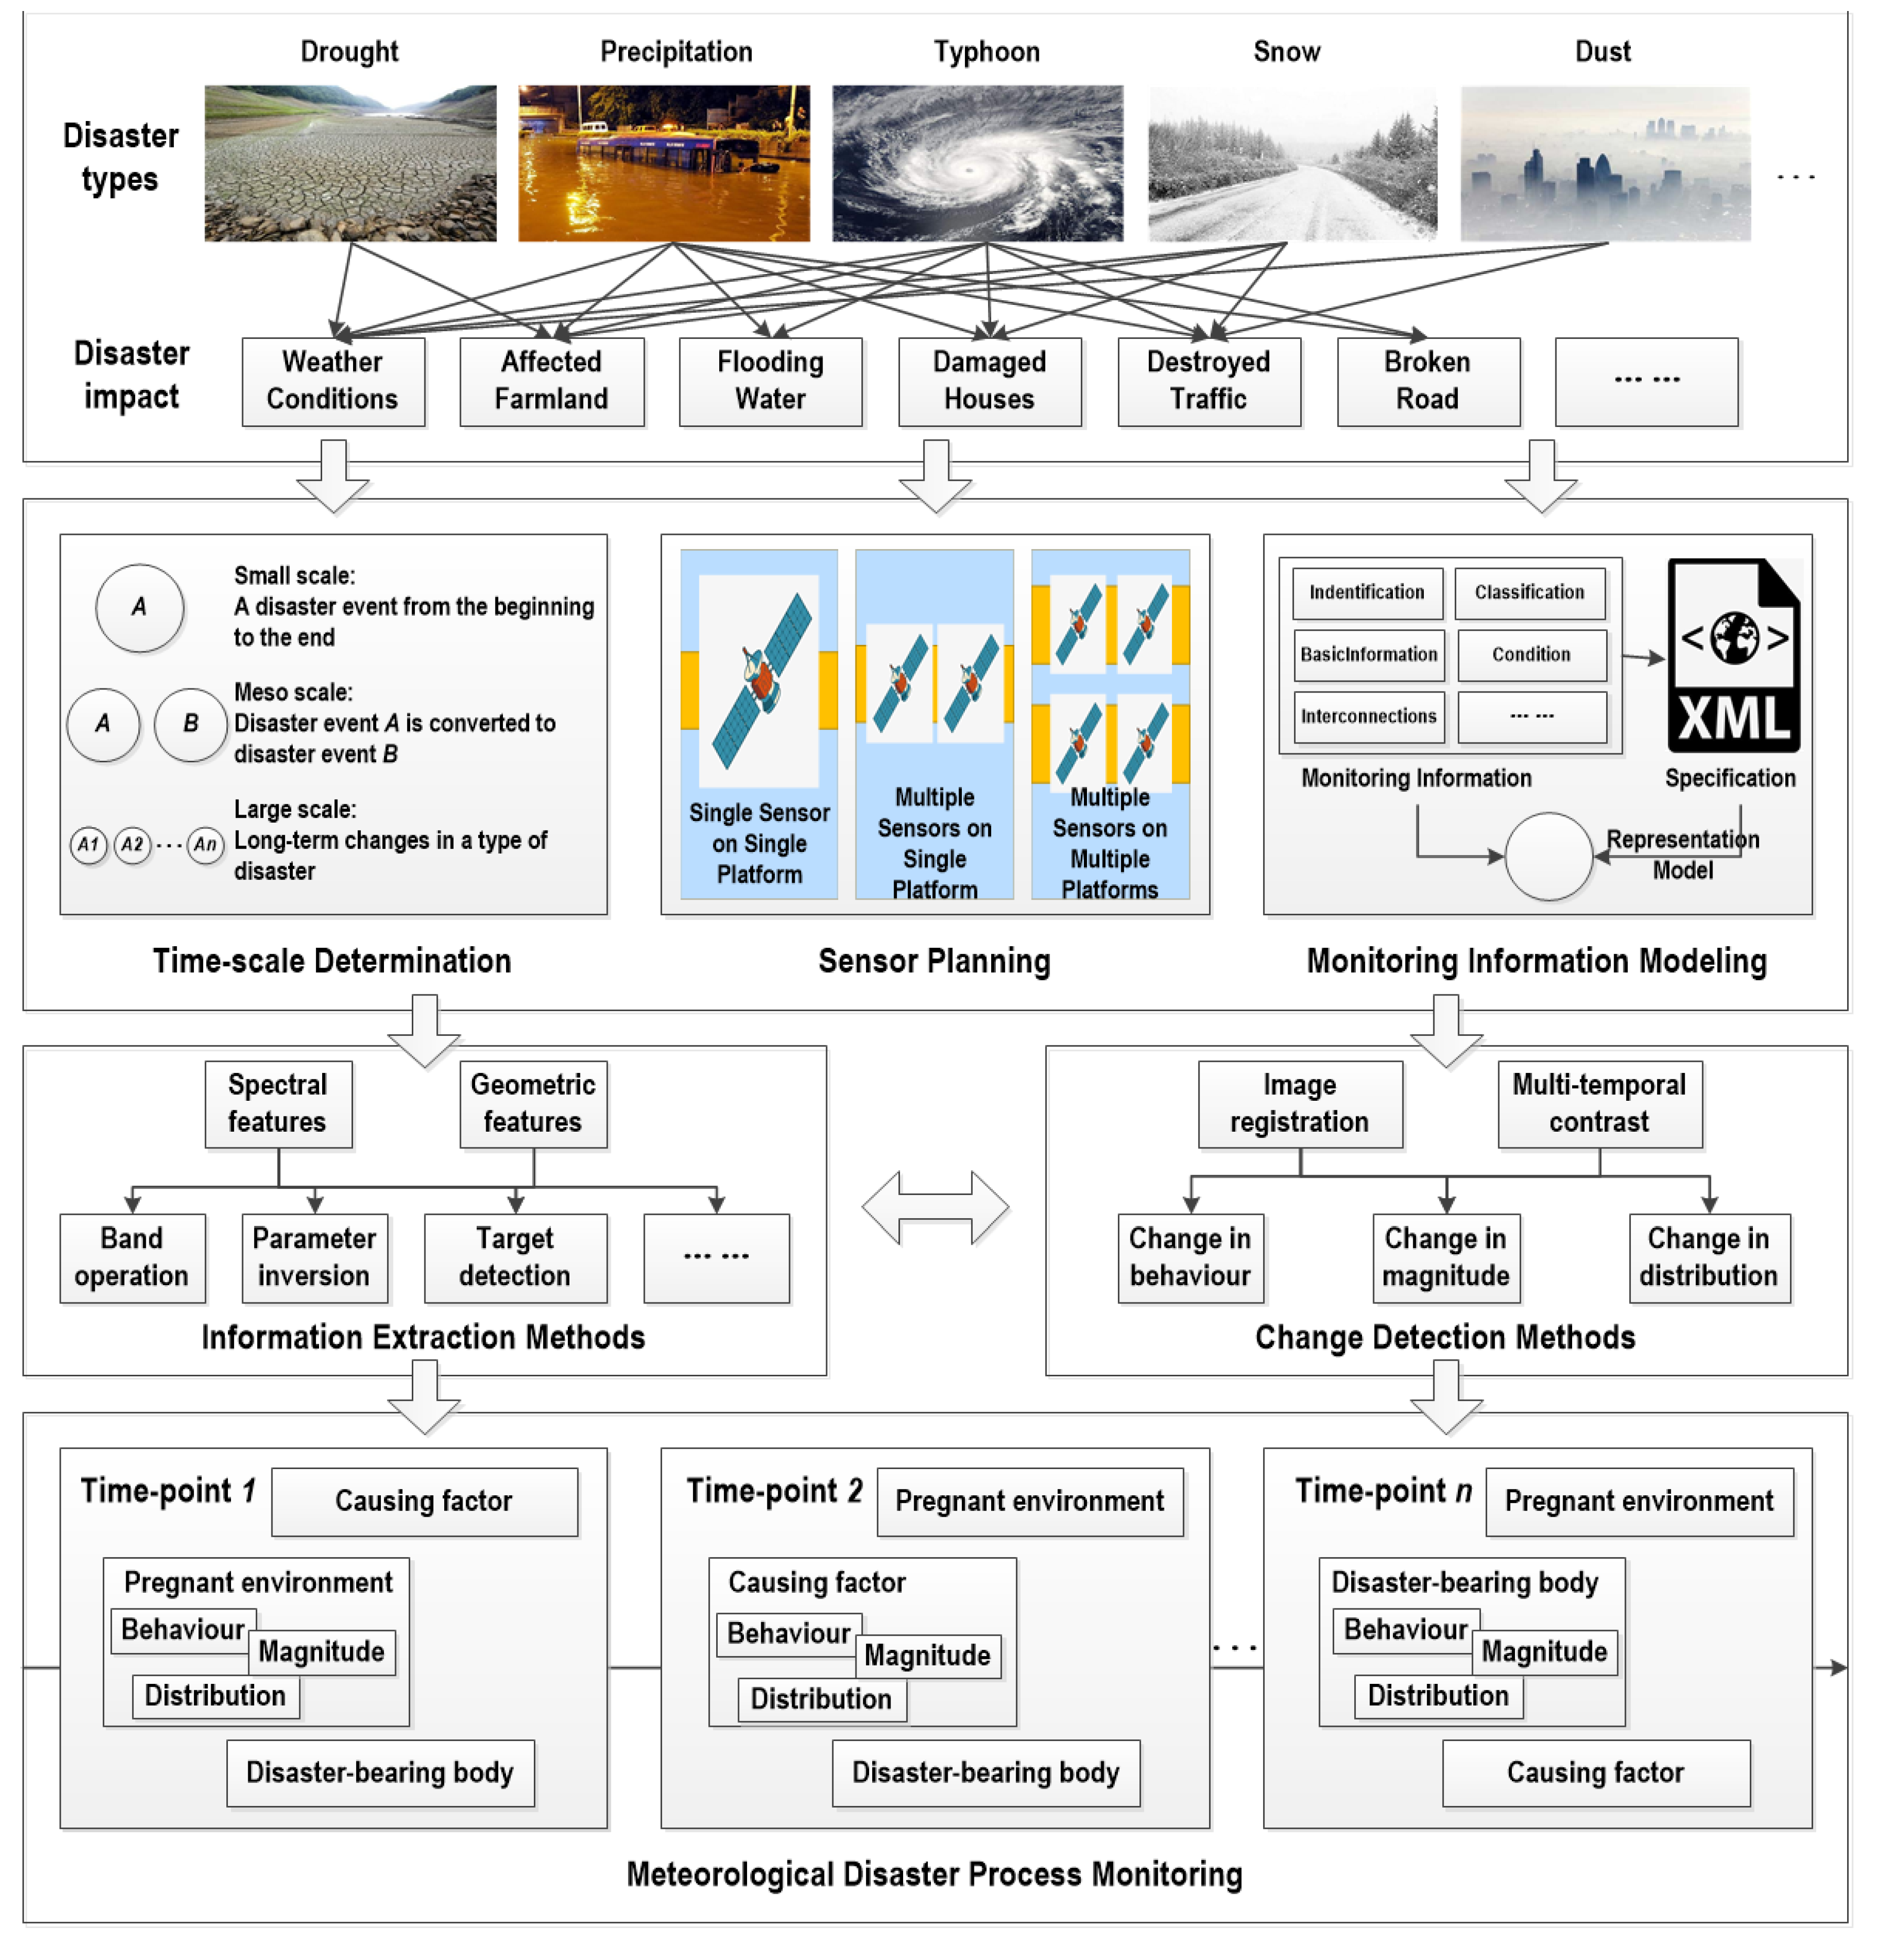
2. Basic Ideas of Meteorological Disaster Process Monitoring
3. Remote Sensing Monitoring Approaches
3.1. Monitoring Task Arrangement and Organization
3.1.1. Timescale Determination in Monitoring
3.1.2. Sensor Planning in Monitoring
3.1.3. Monitoring Information Modeling
3.2. Meteorological Disaster Information Extraction
3.2.1. Information Extraction of Pregnant Environment
Extraction of Surface Parameters
Extraction of Land Cover Information
3.2.2. Information Extraction of Causing Factor
Drought

| Type | Index/Method | Description |
|---|---|---|
| Soil thermal inertia | Apparent thermal inertia (ATI) [82] | The higher the soil moisture content, the greater the soil thermal inertia, resulting in a small temperature difference between day and night. |
| Soil moisture | Microwave-based soil moisture retrieval [83] | The dielectric properties of liquid water are obviously different from those of dry soil. |
| Vegetation index | Vegetation condition index (VCI) [84] | Drought reduced the absorption of soil nutrients by vegetation and limited the growth of vegetation, resulting in changes in vegetation index. |
| Anomaly vegetation index (AVI) [85] | ||
| Vegetation health index (VHI) [86] | ||
| Surface temperature | Temperature condition index (TCI) [87] | Drought means that the soil water supply decreases, the surface temperature increases, the vegetation cover area will appear and the vegetation canopy temperature increases. |
| Normalized difference temperature index (NDTI) [88] | ||
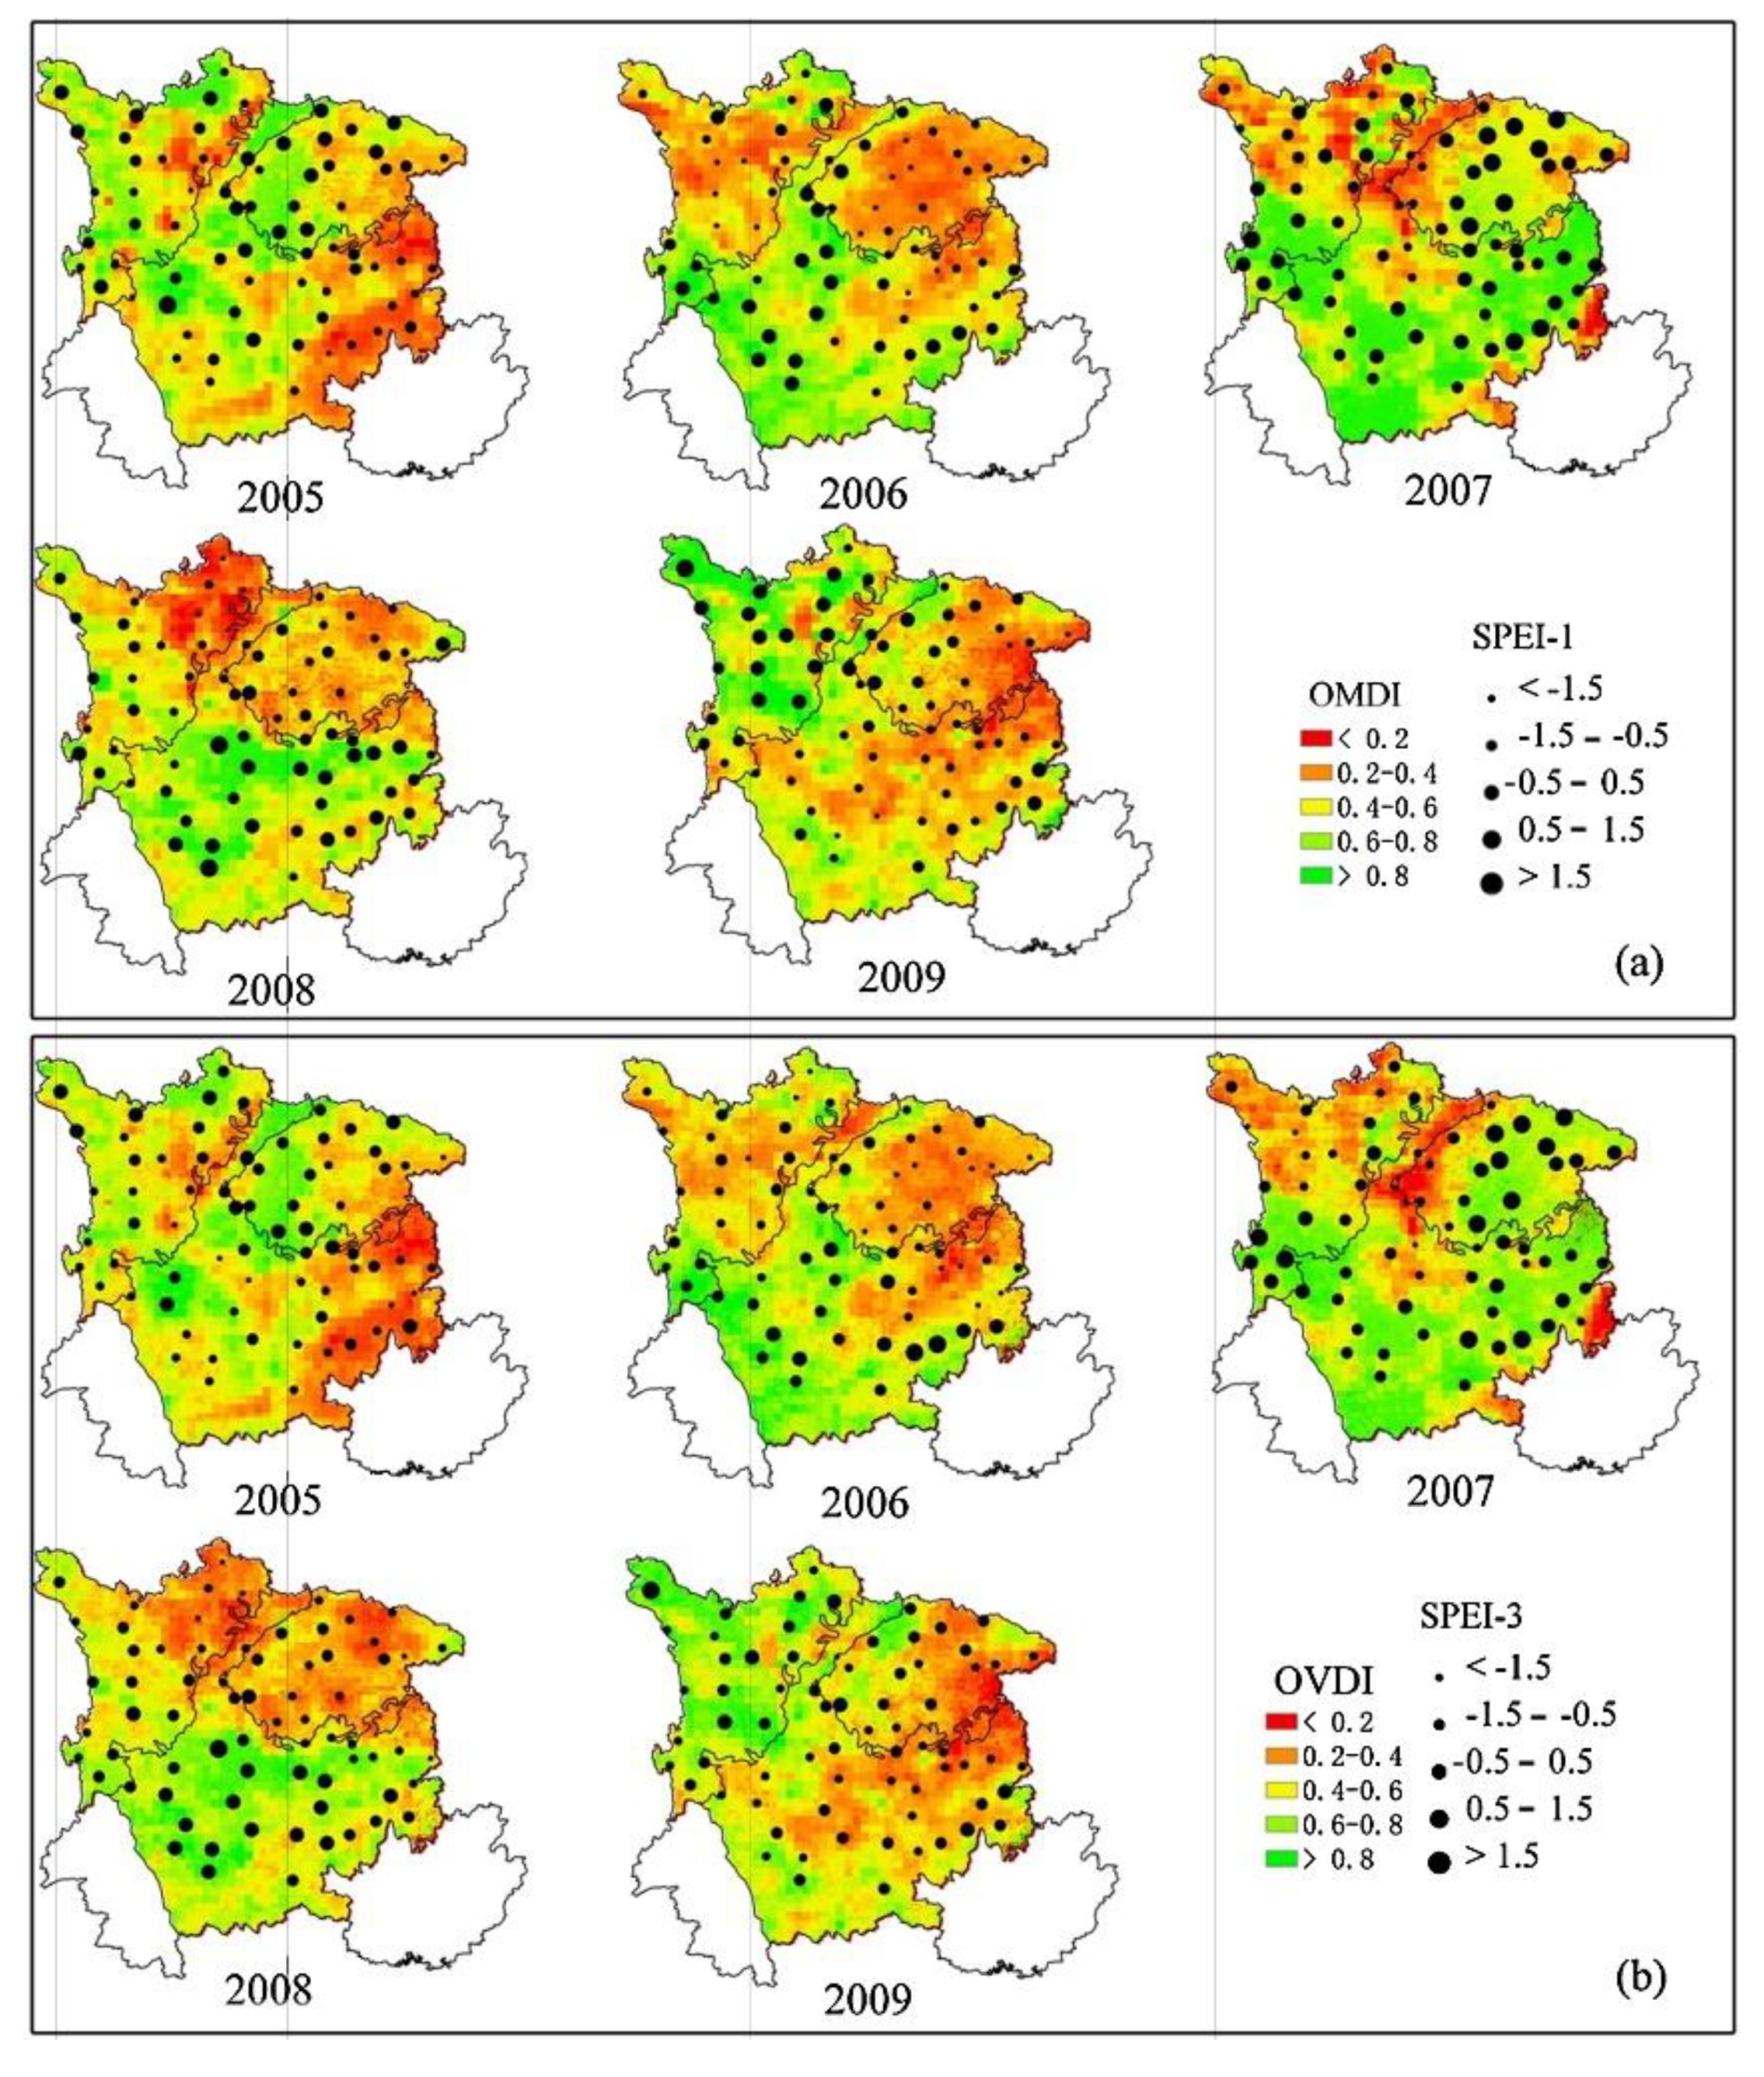
| Composite index | Temperature vegetation drought index (TVDI) [89] | Considering the relationship between “vegetation index + land surface temperature” and drought. Due to the diversity of indexes, the inversion of these indexes usually depends on multi-source remote sensing data (Figure 3). |
| Synthesized drought index (SDI) [90] | ||
| Optimized meteorological drought index (OMDI) and optimized vegetation drought index (OVDI) [91] |
Precipitation
Snow
Haze
Typhoon
Dust
3.2.3. Information Extraction of Disaster-Bearing Body
Target Detection
Scene Classification
3.3. Multi-Temporal Disaster Information Change Detection
3.3.1. Remote Sensing Image Registration
3.3.2. Remote Sensing Change Detection
3.3.3. Change Detection Applications
4. Open Problems and Challenges
4.1. Theoretical Basis: Process-Oriented Monitoring Perspective
4.2. Data Source: Reasonable Sensor Planning Scheme
4.3. Information Management: Spatio-Temporal Dynamic Information Modeling
4.4. Application Service: Diversified Visualization Solutions
5. Conclusions
Funding
Institutional Review Board Statement
Informed Consent Statement
Data Availability Statement
Acknowledgments
Conflicts of Interest
References
- Climate and Natural Catastrophe Risk. Available online: https://www.swissre.com/institute/research/topics-and-risk-dialogues/natcat-and-climate.html (accessed on 10 January 2022).
- Weather, Climate and the Air We Breathe. Available online: https://www.preventionweb.net/publications/view/8457 (accessed on 10 January 2022).
- Roiz, D.; Boussès, P.; Simard, F.; Paupy, C.; Fontenille, D. Autochthonous Chikungunya Transmission and Extreme Climate Events in Southern France. PLoS Negl. Trop. Dis. 2015, 9, e0003854. [Google Scholar] [CrossRef] [PubMed]
- Woodward, A.J.; Samet, J.M. Climate Change, Hurricanes, and Health. Am. J. Public Health 2018, 108, 33–35. [Google Scholar] [CrossRef] [PubMed]
- Kreft, S.; Eckstein, D.; Melchior, I. Global Climate Risk Index 2017: Who Suffers Most from Extreme Weather Events? Weather-related Loss Events in 2015 and 1996 to 2015. Available online: https://www.preventionweb.net/publication/global-climate-risk-index-2017-who-suffers-most-extreme-weather-events-weather-related (accessed on 10 January 2022).
- Hu, C.; Li, J.; Lin, X.; Chen, N.; Yang, C. An Observation Capability Semantic-Associated Approach to the Selection of Remote Sensing Satellite Sensors: A Case Study of Flood Observations in the Jinsha River Basin. Sensors 2018, 18, 1649. [Google Scholar] [CrossRef] [PubMed]
- Li, D.; Wang, M.; Dong, Z.; Shen, X.; Shi, L. Earth observation brain (EOB): An intelligent earth observation system. Geo-spat. Inf. Sci. 2017, 20, 134–140. [Google Scholar] [CrossRef]
- Gamba, P.; Dell’Acqua, F.; Trianni, G.; Stasolla, M. GIS and Remote Sensing for Disaster Assessment in Urban Areas. In Proceedings of the 2007 Urban Remote Sensing Joint Event, Paris, France, 11–13 April 2007; pp. 1–5. [Google Scholar]
- Huang, W.; Bu, M. Detecting shadows in high-resolution remote-sensing images of urban areas using spectral and spatial features. Int. J. Remote Sens. 2015, 36, 6224–6244. [Google Scholar] [CrossRef]
- Giordan, D.; Hayakawa, Y.; Nex, F.; Remondino, F.; Tarolli, P. Review article: The use of remotely piloted aircraft systems (RPAS) for natural hazards monitoring and management. Nat. Hazards Earth Syst. Sci. Discuss. 2018, 18, 1079–1096. [Google Scholar] [CrossRef]
- Im, J.; Park, H.; Takeuchi, W. Advances in Remote Sensing-Based Disaster Monitoring and Assessment. Remote Sens. 2019, 11, 2181. [Google Scholar] [CrossRef]
- Macdonald, G.M. Some Holocene palaeoclimatic and palaeoenvironmental perspectives on Arctic/Subarctic climate warming and the IPCC 4th Assessment Report. J. Quat. Sci. 2010, 25, 39–47. [Google Scholar] [CrossRef]
- State of the Global Climate 2021. Available online: https://lib.icimod.org/record/35637 (accessed on 24 February 2022).
- Schumann, G.J.-P.; Brakenridge, G.R.; Kettner, A.J.; Kashif, R.; Niebuhr, E. Assisting Flood Disaster Response with Earth Observation Data and Products: A Critical Assessment. Remote Sens. 2018, 10, 1230. [Google Scholar] [CrossRef]
- Mileti, D.S. Disasters by Design A Reassessment of Natural Hazards in the United States; Joseph Henry Press: Washington, DC, USA, 1999; Available online: http://calmap.gisc.berkeley.edu/resin_docs/DisasterByDesign/Disaster%20by%20Design.pdf (accessed on 10 January 2022).
- Wang, Z.; Qiang, Z.; Yu, C.; Zhao, S.; Zeng, H.; Yong, Z.; Liu, Q. Characters of Meteorological Disasters Caused by the Extreme Synoptic Process in Early 2008 over China. Adv. Clim. Chang. Res. 2008, 4, 63–67. [Google Scholar]
- Xie, N.; Xin, J.; Liu, S. China’s regional meteorological disaster loss analysis and evaluation based on grey cluster model. Nat. Hazards 2014, 71, 1067–1089. [Google Scholar] [CrossRef]
- Burton, I.; Kates, R.W.; White, A.G.F. The Environment as Hazard, 2nd ed.; The Guilford Press: New York, NY, USA, 1993; ISBN 9780898621594. [Google Scholar]
- Rodrigue, R.; Llasat, M.C.; Rojas, E. Evaluation of Climatic Change through Harmonic Analysis. In Recent Studies in Geophysical Hazards. Advances in Natural and Technological Hazards Research; El-Sabh, M.I., Murty, T.S., Venkatesh, S., Siccardi, F., Andah, K., Eds.; Springer: Dordrecht, The Netherlands, 1994. [Google Scholar] [CrossRef]
- Molthan, A.I.; Burks, J.E.; Mcgrath, K.M.; Bell, J.R. Applications of Satellite Remote Sensing for Response to and Recovery from Meteorological Disasters. Available online: https://ntrs.nasa.gov/citations/20140007292 (accessed on 10 January 2022).
- Shi, P.J. Theory and practice of disaster study. J. Nat. Disasters 1996, 5, 6–17. [Google Scholar]
- Ren, Y.; Liu, G.; Zhou, L.; Zhang, C. Risk evaluation of Chengdu’s flood hazard based on evidence theory and variable fuzzy sets theory. Trans. Chin. Soc. Agric. Eng. 2014, 30, 147–156. [Google Scholar]
- Ye, P.; Zhang, X.; Shi, G.; Chen, S.; Huang, Z.; Tang, W. TKRM: A Formal Knowledge Representation Method for Typhoon Events. Sustainability 2020, 12, 2030. [Google Scholar] [CrossRef]
- Xu, L.; Meng, X.; Xu, X. Natural hazard chain research in China: A review. Nat. Hazards 2014, 70, 1631–1659. [Google Scholar] [CrossRef]
- Rustamov, R.B.; Medzhidov, D.B. Prompt system of aerospace monitoring of transborder natural, ecological and natural disaster processes. In Proceedings of the 2nd International Conference on Recent Advances in Space Technologies, Istanbul, Turkey, 9–11 June 2005; pp. 642–644. [Google Scholar]
- Raju, P.; Bhatla, R.; Mohanty, U. The evolution of mean conditions of surface meteorological fields during active/break phases of the Indian summer monsoon. Theor. Appl. Climatol. 2009, 95, 135–149. [Google Scholar] [CrossRef]
- Marin-Perez, R.; García-Pintado, J.; Gómez, A.S. A Real-Time Measurement System for Long-Life Flood Monitoring and Warning Applications. Sensors 2012, 12, 4213–4236. [Google Scholar] [CrossRef] [PubMed]
- Vu, T.T.; Kamthonkiat, D. Monitoring Long-Term Disaster Recovery–Space and Ground Views. In Multitemporal Remote Sensing. Remote Sensing and Digital Image Processing; Ban, Y., Ed.; Springer: Berlin/Heidelberg, Germany, 2016. [Google Scholar]
- Esteban, M.; Yamamoto, L.; Jamero, L.; Mino, T. Time-Scale in Framing Disaster Risk Reduction in Sustainability. In Framing in Sustainability Science. Science for Sustainable Societies; Mino, T., Kudo, S., Eds.; Springer: Singapore, 2020. [Google Scholar]
- Orimoloye, I.R.; Belle, J.; Ololade, O. Leveraging Climate Projections and Remote Sensing Information for Drought Disasters Appraisal. In Proceedings of the American Association of Geographers (AAG) Annual Meeting 2021, Washington, DC, USA, 7–11 April 2021. [Google Scholar]
- Ahammed, K.; Pandey, A.C. Geospatial Application for Coastal Morphology Changes Along the Sand Mining Coast: A Case Study on Alappad, Kerala. In Recent Technologies for Disaster Management and Risk Reduction; Springer: Berlin/Heidelberg, Germany, 2021. [Google Scholar]
- Blaikie, P.; Cannon, T.; Davies, I.; Wisner, B. At Risk: Natural Hazards, People’s Vulnerability, and Disasters; Routledge: London, UK, 1994. [Google Scholar] [CrossRef]
- Kumar, V.; Rachel, A.D. Application of a regional hurricane wind risk forecasting model forwood-frame houses. Risk Anal. 2007, 27, 45–58. [Google Scholar]
- Zhao, N.; Yu, X.; Hou, K.; Liu, X.; Wang, H. Full-time scale resilience enhancement framework for power transmission system under ice disasters. Int. J. Elec. Power 2021, 126, 106609. [Google Scholar] [CrossRef]
- Jain, V.; Davidson, R.; Rosowsky, D. Modeling changes in hurricane risk over time. Nat. Hazards Rev. 2005, 6, 88–96. [Google Scholar] [CrossRef]
- Ghozat, A.; Sharafati, A.; Hosseini, S.A. Long-term spatiotemporal evaluation of CHIRPS satellite precipitation product over different climatic regions of Iran. Theor. Appl. Climatol. 2021, 143, 211–225. [Google Scholar] [CrossRef]
- Kaplan, S.; Garrick, B. On the Quantitative Definition of Risk. Risk Anal. 1981, 1, 11–27. [Google Scholar] [CrossRef]
- Al-Ghamdi, K.; Hermas, E.S. Assessment of dune migration hazards against landuse northwest Al-lith City, Saudi Arabia, using multi-temporal satellite imagery. Arab. J. Geosci. 2015, 8, 11007–11018. [Google Scholar] [CrossRef]
- Sivanpillai, R.; Jacobs, K.M.; Mattilio, C.M.; Piskorski, E.V. Rapid flood inundation mapping by differencing water indices from pre- and post-flood Landsat images. Front. Earth Sci. 2021, 15, 1–11. [Google Scholar] [CrossRef]
- Kumar, R.; Singh, R.; Gautam, H.; Pandey, M. Flood Hazard Assessment of August 20, 2016 Floods in Satna District, Madhya Pradesh, India. Remote Sens. Appl. Soc. Envron. 2018, 11, 104–118. [Google Scholar] [CrossRef]
- Sv, S.S.; Roy, P.S.; Chakravarthi, V.; Srinivasarao, G.; Bhanumurthy, V. Extraction of detailed level flood hazard zones using multi-temporal historical satellite data-sets–a case study of Kopili River Basin, Assam, India. Geomat. Nat. Haz. Risk 2017, 8, 792–802. [Google Scholar] [CrossRef]
- Kyriou, A.; Nikolakopoulos, K. Flood mapping from Sentinel-1 and Landsat-8 data: A case study from river Evros, Greece. In Proceedings of the Earth Resources and Environmental Remote Sensing/GIS Applications, Toulouse, France, 20 October 2015. [Google Scholar] [CrossRef]
- Rochon, G.L.; Niyogi, D.; Chaturvedi, A.; Arangarasan, R.; Madhavan, K.; Biehl, L.; Quansah, J.; Fall, S. Adopting Multisensor Remote Sensing Datasets and Coupled Models for Disaster Management. In Remote Sensing and GIS Technologies for Monitoring and Prediction of Disasters. Environmental Science and Engineering (Environmental Science); Nayak, S., Zlatanova, S., Eds.; Springer: Heidelberg/Berlin, Germany, 2008. [Google Scholar] [CrossRef]
- Kotawadekar, R. Satellite data: Big data extraction and analysis. Artifi. Intell. Data Min. 2021, 177–197. [Google Scholar] [CrossRef]
- Rhee, J.; Im, J.; Carbone, G.J. Monitoring agricultural drought for arid and humid regions using multi-sensor remote sensing data. Remote Sens. Environ. 2010, 114, 2875–2887. [Google Scholar] [CrossRef]
- Faisal1, A.; Khan, H.A.H. Application of GIS and remote sensing in disaster management: A critical review of flood management. Proceedings of International Conference on Disaster Risk Mitigation, Dhaka, Bangladesh, 23–24 September 2017. [Google Scholar]
- Hu, T.; Zhang, R.; Wang, J.; Zhang, Y. Review of Typhoon Monitoring Technology based on Remote Sensing Satellite Data. Remote Sens. Technol. Appl. 2013, 28, 994–999. [Google Scholar]
- Jiang, H.; Qin, Q.; Zhang, N.; Zhao, S.; You, L.; Dong, H. A comparative study on snow cover monitoring of different spatial resolution remote sensing images. In Proceedings of the 2009 IEEE International Geoscience and Remote Sensing Symposium, Cape Town, South Africa, 12–17 July 2009. [Google Scholar] [CrossRef]
- Yuan, S.; Liu, C.; Liu, X.; Zhang, Y. Research advances in remote sensing monitoring of sea ice in the Bohai sea. Earth Sci. Inform. 2021, 14, 1729–1743. [Google Scholar] [CrossRef]
- Liu, R.; Zhou, C.; Liang, Q. Monitoring the Changes of Ice Shelf and Glaciers Around Zhongshan Station Using Multiple-Source Remote Sensing Data. Chin. J. Polar Res. 2017, 29, 446–453. [Google Scholar]
- Clark, N.E. Towards a standard licensing scheme for the access and use of satellite earth observation data for disaster management. Acta Astronaut. 2017, 139, 325–331. [Google Scholar] [CrossRef]
- Iannella, R. Towards a National Emergency Warning Framework. Available online: https://publications.csiro.au/rpr/pub?pid=nicta:2028 (accessed on 10 January 2022).
- Robinson, K.; Iannella, R. Information Standards for Disaster Response and Recovery. Available online: http://xml.coverpages.org/RobinsonIannella-Disaster2006.pdf (accessed on 10 January 2022).
- Corporation, W. System and Method for Flexibly Sending Commercial Mobile Alert System Messages (CMAS) and Earthquake and Tsunami Warning System (EWTS) Alert Messages. Available online: https://www.freepatentsonline.com/y2015/0281928.html (accessed on 10 January 2022).
- Cyclone Warning Markup Language (CWML) (Version 1.0). Available online: http://xml.coverpages.org/NICTA-CWML-v10-2006.pdf (accessed on 10 January 2022).
- Frye, S.; Percivall, G.; Moe, K.; Mandl, D.; Handy, M.; Evans, J. Towards a sensor web architecture for Disaster management: Insights from the Namibia flood pilot. In Proceedings of the 2013 IEEE International Geoscience and Remote Sensing Symposium, Melbourne, VIC, Australia, 21–26 July 2013; pp. 807–810. [Google Scholar]
- Kolas, D.; Hebeler, J.; Dean, M. Geospatial Semantic Web: Architecture of Ontologies. In GeoSpatial Semantics. GeoS 2005. Lecture Notes in Computer Science; Rodríguez, M.A., Cruz, I., Levashkin, S., Egenhofer, M.J., Eds.; Springer: Berlin/Heidelberg, Germany, 2005. [Google Scholar]
- Zhong, S.; Fang, Z.; Zhu, M.; Huang, Q. A geo-ontology-based approach to decision-making in emergency management of meteorological disasters. Nat. Hazards 2017, 89, 531–554. [Google Scholar] [CrossRef]
- Subedi, J.; Houston, J.B.; Sherman-Morris, K. Interdisciplinary Research as an Iterative Process to Build Disaster Systems Knowledge. Risk Anal. 2021, 41, 1072–1077. [Google Scholar] [CrossRef]
- Li, Z.; Xu, S.; Li, B.; Li, J. Information fusion technology of disaster scenario based on knowledge graph. J. North China Inst. Sci. Tech. 2019, 16, 1–5. [Google Scholar]
- Yang, C.; Luo, J.; Hu, C.; Tian, L.; Li, J.; Wang, K. An Observation Task Chain Representation Model for Disaster Process-Oriented Remote Sensing Satellite Sensor Planning: A Flood Water Monitoring Application. Remote Sens. 2018, 10, 375. [Google Scholar] [CrossRef]
- Huang, T.; Sun, H.; Kim, K.J.; Nikovski, D.; Xie, L. A Holistic Framework for Parameter Coordination of Interconnected Microgrids against Disasters. arXiv 2020, arXiv:2006.13840. [Google Scholar]
- Hendrawan, V.; Komori, D. Developing flood vulnerability curve for rice crop using remote sensing and hydrodynamic modeling. Int. J. Disast. Risk Re. 2021, 54, 102058. [Google Scholar] [CrossRef]
- Blackard, J.A.; Finco, M.V.; Helmer, E.H.; Holden, G.R.; Hoppus, M.L.; Jacobs, D.M.; Lister, A.J.; Moisen, G.G.; Nelson, M.D.; Riemann, R.; et al. Mapping U.S. forest biomass using nationwide forest inventory data and moderate resolution information. Remote Sens. Environ. 2008, 112, 1658–1677. [Google Scholar] [CrossRef]
- Yang, G.J.; Pu, R.L.; Zhang, J.X.; Zhao, C.J.; Feng, H.K.; Wang, J.H. Remote sensing of seasonal variability of fractional vegetation cover and its object-based spatial pattern analysis over mountain areas. ISPRS J. Photogramm. 2013, 77, 79–93. [Google Scholar] [CrossRef]
- Salsabila, H.N.; Sahitya, A.F.; Mahyatar, P. Spatio-temporal pattern analysis of forest fire event in South Kalimantan using integration remote sensing data and GIS for forest fire disaster mitigation. IOP Conf. Ser. Earth Environ. Sci. 2020, 540, 012011. [Google Scholar] [CrossRef]
- Zhong, Z.; Chen, N.; Hu, G.; Han, Z.; Ni, H. Aggravation of debris flow disaster by extreme climate and engineering: A case study of the Tongzilin Gully, Southwestern Sichuan Province, China. Nat. Hazards 2021, 109, 237–253. [Google Scholar] [CrossRef]
- Gonsamo, A.; Chen, J.M. Improved LAI algorithm implementation to MODIS data by incorporating background, topography, and foliage clumping information. IEEE T. Geosci. Remote 2014, 52, 1076–1088. [Google Scholar] [CrossRef]
- Pasolli, L.; Asam, S.; Castelli, M.; Bruzzone, L.; Wohlfahrt, G.; Zebisch, M.; Notarnicola, C. Retrieval of Leaf Area Index in mountain grasslands in the Alps from MODIS satellite imagery. Remote Sens. Environ. 2015, 165, 159–174. [Google Scholar] [CrossRef]
- Hidayat, R.; Arymurthy, A.M.; Dewantara, D.S. Disaster Impact Analysis Uses Land Cover Classification, Case study: Petobo Liquefaction. In Proceedings of the 2020 3rd International Conference on Computer and Informatics Engineering (IC2IE), Yogyakarta, Indonesia, 15–16 September 2020; pp. 432–436. [Google Scholar]
- Chinnasamy, P.; Honap, V.U.; Maske, A.B. Impact of 2018 Kerala Floods on Soil Erosion: Need for Post-Disaster Soil Management. J. Indian Soc. Remote Sens. 2020, 48, 1373–1388. [Google Scholar] [CrossRef]
- Zhu, L.J.; Xiao, P.F.; Feng, X.Z.; Zhang, X.L.; Wang, Z.; Jiang, L.Y. Support vector machine-based decision tree for snow cover extraction in mountain areas using high spatial resolution remote sensing image. J. Appl. Remote Sens. 2014, 8, 084698. [Google Scholar] [CrossRef]
- Aurdal, L.; Huseby, R.B.; Eikvil, L.; Solberg, R.; Vikhamar, D.; Solberg, A. Use of hidden Markov models and phenology for multitemporal satellite image classification: Applications to mountain vegetation classification. In Proceedings of the International Workshop on the Analysis of Multi-Temporal Remote Sensing Images, Biloxi, MS, USA, 16–18 May 2005; pp. 220–224. [Google Scholar]
- Jin, B.; Ye, P.; Zhang, X.; Song, W.; Li, S. Object-Oriented Method Combined with Deep Convolutional Neural Networks for Land-Use-Type Classification of Remote Sensing Images. J. Indian Soc. Remote Sens. 2019, 47, 951–965. [Google Scholar] [CrossRef]
- Campos, N.; Lawrence, R.; McGlynn, B.; Gardner, K. Effects of LiDAR-Quickbird fusion on object-oriented classification of mountain resort development. J. Appl. Remote Sens. 2010, 4, 043556. [Google Scholar] [CrossRef]
- Reese, H.; Nordkvist, K.; Nyström, M.; Bohlin, J.; Olsson, H. Combining point clouds from image matching with SPOT 5 multispectral data for mountain vegetation classification. Int. J. Remote Sens. 2015, 36, 403–416. [Google Scholar] [CrossRef]
- Osman, J.; Inglada, J.; Dejoux, J.F.; Hagolle, O.; Dedieu, G. Crop mapping by supervised classification of high resolution optical image time series using prior knowledge about crop rotation and topography. In Proceedings of the 2013 IEEE International Geoscience and Remote Sensing Symposium, Melbourne, VIC, Australia, 21–26 July 2013; pp. 2832–2835. [Google Scholar]
- Soni, P.K.; Rajpal, N.; Mehta, R.; Kumar, V. Urban land cover and land use classification using multispectral sentinal-2 imagery. Multimed. Tools Appl. 2021, 1–15. [Google Scholar] [CrossRef]
- Shakya, A.K.; Ramola, A.; Kashyap, A.; Van Pham, D.; Vidyarthi, A. Susceptibility Assesment of Changes Developed in the Landcover Caused Due to the Landslide Disaster of Nepal from Multispectral LANDSAT Data. In Futuristic Trends in Networks and Computing Technologies; Singh, P., Sood, S., Kumar, Y., Paprzycki, M., Pljonkin, A., Hong, W.C., Eds.; Springer: Singapore, 2020. [Google Scholar]
- He, X.; Zou, A. The Risk Assessment of Urban Flood Disaster Based on Elevation Ladder Data. Adv. Mater. Res. 2012, 446, 3046–3050. [Google Scholar] [CrossRef]
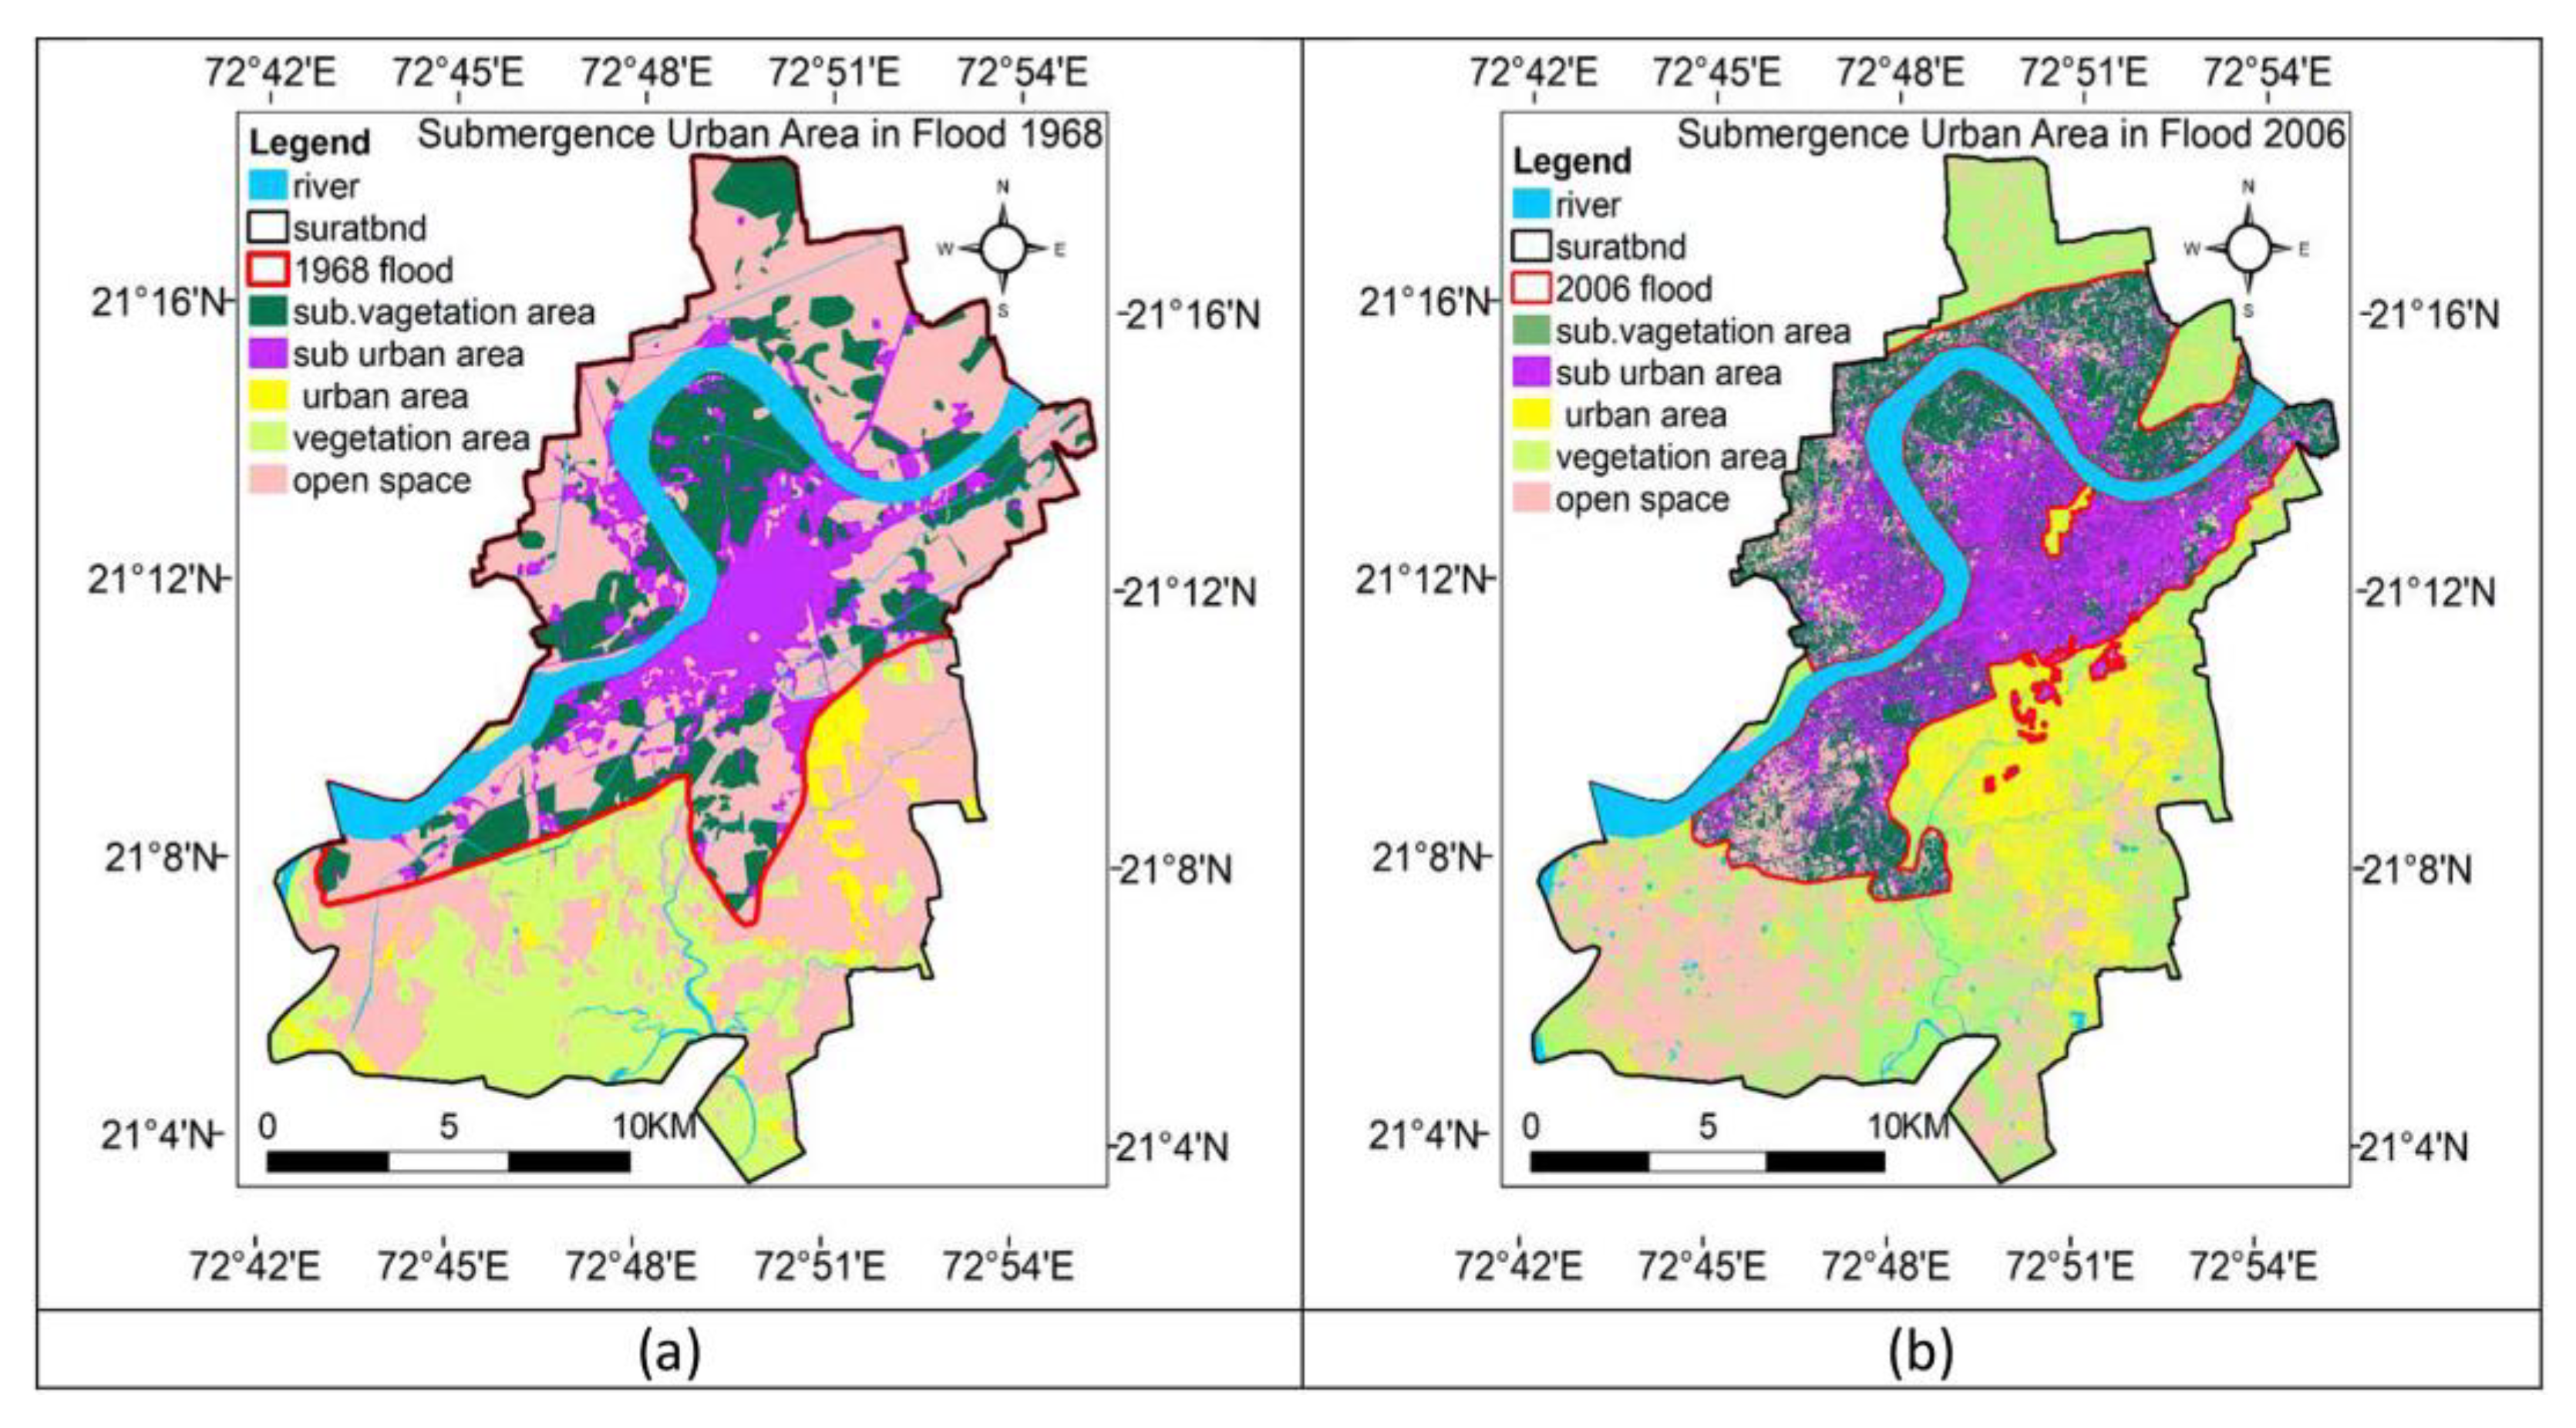
- Waghwala, R.K.; Agnihotri, P.G. Flood risk assessment and resilience strategies for flood risk management: A case study of Surat City. Int. J. Disast. Risk Re. 2019, 40, 101155. [Google Scholar] [CrossRef]
- Price, J.C. On the analysis of thermal infrared imagery: The limited utility of apparent thermal inertia. Remote Sens. Environ. 1985, 18, 59–73. [Google Scholar] [CrossRef]
- Li, X. A study on soil moisture monitoring by using microwave remote sensing. Remote Sens. Technol. Appl. 1995, 10, 1–8. [Google Scholar]
- Kogan, F.N. Remote sensing of weather impacts on vegetation in non-homogeneous areas. Int. J. Remote Sens. 1990, 11, 1405–1419. [Google Scholar] [CrossRef]
- Chen, W.; Xiao, Q.; Sheng, Y. Application of anomaly vegetation index to monitoring heavy drought in 1992. Remote Sens. Environ. China 1994, 9, 106–112. [Google Scholar]
- Kogan, F.N. Operational space technology for global vegetation assessment. B. Am. Meteorol. Soc. 2001, 82, 1949–1964. [Google Scholar] [CrossRef]
- Kogan, F.N. Application of vegetation index and brightness temperature for drought detection. Adv. Space Res. 1995, 15, 91–100. [Google Scholar] [CrossRef]
- Peng, J.; Liu, Y.; Loew, A. Uncertainties in Estimating Normalized Difference Temperature Index from TOA Radiances. IEEE T. Geosci. Remote 2013, 51, 2487–2497. [Google Scholar] [CrossRef]
- Wang, P.; Wan, Z.; Gong, J.; Li, X.; Wang, J. Advances in drought monitoring by using remotely sensed normalized difference vegetation index and land surface temperature products. Adv. Earth Sci. 2003, 18, 527–533. [Google Scholar]
- Du, L.; Tian, Q.; Yu, T.; Meng, Q.; Jancso, T.; Udvardy, P.; Huang, Y. A comprehensive drought monitoring method integrating MODIS and TRMM data. Int. J. Appl. Earth Obs. 2013, 23, 245–253. [Google Scholar] [CrossRef]
- Hao, C.; Zhang, J.; Yao, F. Combination of multi-sensor remote sensing data for drought monitoring over Southwest China. Int. J. Appl. Earth Obs. 2015, 35, 270–283. [Google Scholar] [CrossRef]
- Yang, H. Precipitation Estimation from Remotely Sensed Information Using Artificial Neural Networks. The University of Arizona. 2003. Available online: https://repository.arizona.edu/bitstream/handle/10150/280418/azu_td_3108912_sip1_m.pdf;jsessionid=4FF741338D291BA79902EE8A55980B13?sequence=1 (accessed on 24 February 2022).
- Zhang, M.; Luo, C.; Zou, Y.; Huang, Y. A model for quantitatively estimating short-range precipitation based on GMS digitalized cloud maps-part I: Analysis quantitative cloud-precipitation relations and model design. Acta Meteorol. Sin. 2003, 17, 230–244. [Google Scholar]
- Zhang, R.; Wang, Z.; Zhang, L.; Yun, L. Rainfall retrieval of tropical cyclones using FY-3B microwave radiation imager (MWRI). In Proceedings of the 2017 IEEE International Geoscience and Remote Sensing Symposium (IGARSS), Fort Worth, TX, USA, 23–28 July 2017. [Google Scholar] [CrossRef]
- Moupfouma, F.; Tiffon, J. Raindrop size distribution from microwave scattering measurements in equatorial and tropical climates. Electron. Lett. 1982, 18, 1012–1014. [Google Scholar] [CrossRef]
- Michaelldes, S.; Levizzani, V.; Anagnostou, E.; Bauer, P.; Kasparis, T.; Lane, J. Precipitation: Measurement, remote sensing, climatology and modeling. Atmos. Res. 2009, 94, 512–533. [Google Scholar] [CrossRef]
- Haddad, Z.S.; Smith, E.A.; Kummerow, C.D.; Iguchi, T.; Farrar, M.R.; Durden, S.L.; Alves, M.; Olson, W.S. The TRMM “day-1” radar/radiometer combined rain-profiling algorithm. J. Meteorol. Soc. JPN 1997, 5, 799–809. [Google Scholar] [CrossRef]
- Todd, M.C.; Kidd, C.; Kniveton, D.; Bellerby, T.J. A combined satellite infrared and passive microwave technique for estimation of small-scale rainfall. J. Atmos. Ocean. Tech. 2001, 18, 742–755. [Google Scholar] [CrossRef]
- Dozier, J. Spectral Signature of Alpine Snow Cover from the Landsat Thematic Mapper. Remote Sens. Environ. 1989, 28, 9–22. [Google Scholar] [CrossRef]
- Wang, G.; Jiang, L.; Shi, J.; Liu, X.; Yang, J.; Cui, H. Snow-Covered Area Retrieval from Himawari–8 AHI Imagery of the Tibetan Plateau. Remote Sens. 2019, 11, 2391. [Google Scholar] [CrossRef]
- Wang, G.; Jiang, L.; Shi, J.; Su, X. A Universal Ratio Snow Index for Fractional Snow Cover Estimation. IEEE Geosci. Remote S. 2020, 18, 1–5. [Google Scholar] [CrossRef]
- Painter, T.H.; Rittger, K.; Mckenzie, C.; Slaughter, P.; Davis, R.E.; Dozier, J. Retrieval of Sub-pixel Snow Covered Area, Grain Size, and Albedo from MODIS. Remote Sens. Environ. 2009, 113, 868–879. [Google Scholar] [CrossRef]
- Sirguey, P.; Matieu, R.; Arnaud, Y. Subpixel Monitoring of the Seasonal Snow Cover with MODIS at 250m Spatial Resolution in the Southern Alps of New Zealand: Methodology and Accuracy Assessment. Remote Sens. Environ. 2009, 113, 160–181. [Google Scholar] [CrossRef]
- Hao, S.; Jiang, L.; Shi, J.; Liu, X. Assessment of MODIS-Based Fractional Snow Cover Products Over the Tibetan Plateau. IEEE J. Stars 2018, 12, 533–548. [Google Scholar] [CrossRef]
- Aalstad, K.; Westermann, S.; Bertino, L. Evaluating Satellite Retrieved Fractional Snow-covered Area at A High-Arctic Site Using Terrestrial Photography. Remote Sens. Environ. 2020, 239, 1–19. [Google Scholar] [CrossRef]
- Lan, C.; Zhang, Y. Monitoring and Analysing Smog in the Ground Layer Atmosphere over Xining City during Winter with Remote Sensing Image. Meteorol. Mon. 1998, 6, 27–29. [Google Scholar]
- Gao, D.; Ma, H.; Yu, Z.; Zhang, X.; Yang, X. Monitoring haze events from the MODIS True-Color composite image series: A case study of severe haze pollution event in Zhejiang Province. China Environ. Sci. 2015, 35, 2939–2949. [Google Scholar]
- Feng, H.; Sun, D.; Shen, L.; Shao, H.; Meng, S. The Analysis of Smog Impacted on the Measured Spectral Curve of the Main Ground Object. Spectrosc. Spect. Anal. 2017, 37, 1329–1333. [Google Scholar]
- Zhang, Y.; Guindon, B.; Cihlar, J. An image transform to characterize and compensate for spatial variations in thin cloud contamination of Landsat images. Remote Sens. Environ. 2002, 82, 173–187. [Google Scholar] [CrossRef]
- Crist, E.P. A Spectral Haze Diagnostic Feature for Normalizing Landsat Thematic Mapper Data. In Proceedings of the 18th International Symposium on Remote Sensing of Environment, Paris, France, 1–5 October 1984; pp. 735–744. [Google Scholar]
- Li, Z.; Gu, X.; Wang, L.; Li, D.; Xie, Y.; Li, K.; Dubovik, O.; Schuster, G.; Goloub, P.; Zhang, Y.; et al. Aerosol physical and chemical properties retrieved from ground-based remote sensing measurements during heavy haze days in Beijing winter. Atmos. Chem. Phys. 2013, 13, 10171–10183. [Google Scholar] [CrossRef]
- Tao, M.; Chen, L.; Wang, Z.; Ma, P.; Tao, J.; Jia, S. A study of urban pollution and haze clouds over northern China during the dusty season based on satellite and surface observations. Atmos. Environ. 2014, 82, 183–192. [Google Scholar] [CrossRef]
- Li, Z.; Xu, H.; Zhang, Y.; Zhang, Y.; Chen, C.; Li, D.; Li, L.; Hou, W.; Lv, Y.; Gu, X. Joint of Active and Passive Remote Sensing for Monitoring of Severe Haze Pollution in Beijing 2013. J. Remote Sens. 2013, 17, 919–928. [Google Scholar]
- Guo, J.; Zhang, X.; Cao, C.; Che, H.; Liu, H.; Gupta, P.; Zhang, H.; Xu, M.; Li, X. Monitoring haze episodes over the Yellow Sea by combining multi-sensor measurements. Int. J. Remote Sens 2010, 31, 4743–4755. [Google Scholar] [CrossRef]
- Hoque, A.A.; Phinn, S.; Roelfsema, C. A systematic review of tropical cyclone disaster management research using remote sensing and spatial analysis. Ocean Coast. Manag. 2017, 146, 109–120. [Google Scholar] [CrossRef]
- Woo, H.-J.; Park, K.-A. Estimation of Extreme Significant Wave Height in the Northwest Pacific Using Satellite Altimeter Data Focused on Typhoons (1992–2016). Remote Sens. 2021, 13, 1063. [Google Scholar] [CrossRef]
- Shen, F.; Xu, D.; Li, H.; Min, J.; Liu, R. Assimilation of GPM Microwave Imager Radiance data with the WRF hybrid 3DEnVar system for the prediction of Typhoon Chan-hom (2015). Atmos. Res. 2020, 251, 105422. [Google Scholar] [CrossRef]
- Rau, J.; Jhan, J.; Rau, R. Semiautomatic Object-Oriented Landslide Recognition Scheme from Multi-sensor Optical Imagery and DEM. IEEE T. Geosci. Remote 2013, 52, 1336–1349. [Google Scholar] [CrossRef]
- Chen, S.; Shu, H.; Dai, S.; Huang, J.; Hsu, C. The Suitability of Typhoon Disaster Reconstruction Work Planning-A Case of Meizuolyu Stream in Taitung County. Engineering 2015, 7, 237–247. [Google Scholar] [CrossRef][Green Version]
- Sasaki, Y.; Sato, S. The effect of typhoon storm waves on hydrodynamics and morphology changes around river mouth. J. Japan Soc. Civil Engin. 2015, 71, 625–630. [Google Scholar]
- Xie, W.; He, Q.; Zhang, K.; Guo, L.; Wang, X.; Shen, J.; Cui, Z. Application of terrestrial laser scanner on tidal flat morphology at a typhoon event timescale. Geomorphology 2017, 292, 47–58. [Google Scholar] [CrossRef]
- Kitamoto, A. Evolution Map: Modeling State Transition of Typhoon Image Sequences by Spatio-Temporal Clustering. In Proceedings of the 5th International Conference on Discovery Science, Lübeck, Germany, 24–26 November 2002; pp. 283–290. [Google Scholar]
- Liu, W.; Cui, T.; Hung, C.; Chen, S. An Adaptive Weighted Fuzzy C-means Clustering Algorithm for Remote Sensing Image Classification. J. Inform. Comput. Sci. 2013, 10, 2009–2020. [Google Scholar] [CrossRef]
- Ao, Y.; Pei, H.; Yang, L.; Li, X. Research on monitoring sand-dust storm using satellite remote sensing technique. J. Nat. Disasters 2004, 13, 99–104. [Google Scholar]
- Kaufman, Y.J.; Wald, A.E.; Remer, L.A.; Gao, B.; Li, R.; Flynm, L. The MODIS 2.1-µm channel-correlation with visible reflectance for use in remote sensing of aerosol. IEEE T. Geosci. Remote 1997, 35, 1286–1298. [Google Scholar] [CrossRef]
- Hsu, N.C.; Tsay, S.; King, M.D.; Herman, J.R. Deep Blue Retrievals of Asian Aerosol Properties During ACE-Asia. IEEE T. Geosci. Remote 2006, 44, 3180–3195. [Google Scholar] [CrossRef]
- Legrand, M.; Plana-Fattori, A.; N’doumé, C. Satellite detection of dust using the IR imagery of Meteosat: 1. Infrared difference dust index. J. Geophys. Res. 2001, 106, 18251–18274. [Google Scholar] [CrossRef]
- Wald, A.E.; Kaufman, Y.J.; Tanré, D.; Gao, B. Daytime and nighttime detection of mineral dust over desert using infrared spectral contrast. J. Geophys. Res. Atmos. 1998, 103, 32307–32313. [Google Scholar] [CrossRef]
- Good, P.; Pyle, J. Dust altitude and infrared optical depth from AIRS. Atmos. Chem. Phys. 2004, 4, 1813–1822. [Google Scholar]
- Pavolonis, M.J.; Feltz, W.F.; Heidinger, A.K.; Gallina, G.M. A Daytime Complement to the Reverse Absorption Technique for Improved Automated Detection of Volcanic Ash. J. Atmos. Ocean. Tech. 2006, 23, 1422–1444. [Google Scholar] [CrossRef]
- Han, J.; Zhou, P.; Zhang, D.; Cheng, G.; Guo, L.; Liu, Z.; Bu, S.; Wi, J. Efficient, simultaneous detection of multi-class geospatial targets based on visual saliency modeling and discriminative learning of sparse coding. ISPRS J. Photogramm. 2014, 89, 37–48. [Google Scholar] [CrossRef]
- Bosch, A.; Zisserman, A.; Munoz, X. Scene classification using a hybrid generative/discriminative approach. IEEE T. Pattern Anal. 2008, 30, 712–727. [Google Scholar] [CrossRef]
- Williams, D.P.; Fakiris, E. Exploiting environmental information for improved underwater target classification in Sonar imagery. IEEE T. Geosci. Remote 2014, 52, 6284–6297. [Google Scholar] [CrossRef]
- He, W.; Zhou, W.; Su, P. Research on Classification and Target Recognition of Remote Sensing Image Based on Improved Support Vector Machine. Remote Sens. Inf. 2010, 6, 6–8. [Google Scholar]
- Zhu, L.; Shimamura, H.; Tachibana, K.; Li, Y.; Gong, P. Building change detection based on object extraction in dense urban areas. In Proceedings of the International Archives of the Photogrammetry, Remote Sensing and Spatial Information Sciences, Beijing, China, 3–11 July 2008; pp. 905–908. [Google Scholar]
- Nia, K.R.; Mori, G. Building Damage Assessment Using Deep Learning and Ground-Level Image Data. In Proceedings of the 2017 14th Conference on Computer and Robot Vision (CRV), Edmonton, AB, Canada, 16–19 May 2017. [Google Scholar] [CrossRef]
- Ismail, A.; Awad, M. Towards Cross-Disaster Building Damage Assessment with Graph Convolutional Networks. arXiv 2022, arXiv:2201.10395. [Google Scholar]
- Ma, X.; Cheng, B.; Liu, Y.; Cui, S.; Liang, C. PolSAR remote sensing image method for building extraction based on polarization and texture characteristics. J. Univ. Chinese Acad. Sci. 2019, 36, 682–693. [Google Scholar]
- Hasan, Y.M.Y.; Karam, L.J. Morphological reversible contour representation. IEEE T. Pattern Anal. 2000, 22, 227–240. [Google Scholar] [CrossRef]
- Julian, E.B. Identification of Roads in Satellite Imagery Using Artificial Neural Networks: A Contextual Approach; Mississippi State University: Starkville, MS, USA, 1993. [Google Scholar]
- Nevatia, R.; Babu, K.R. Linear feature extraction and description. Comput. Graph. Image Process. 1980, 13, 257–269. [Google Scholar] [CrossRef]
- Poz, A.D.; Gallis, R.; Silva, J. Three-Dimensional Semiautomatic Road Extraction from a High-Resolution Aerial Image by Dynamic-Programming Optimization in the Object Space. IEEE Geosci. Remote Sens. Lett. 2010, 7, 796–800. [Google Scholar]
- Fischler, M.A.; Tenenbaum, J.M.; Wolf, H.C. Detection of Roads and Linear Structures in Low-Resolution Aerial Imagery Using a Multisource Knowledge Integration Technique. Readings in Computer Vision: Issues, Problems, Principles, and Paradigms; Morgan Kaufmann Publishers Inc.: San Francisco, CA, USA, 1987; pp. 741–752. [Google Scholar]
- Barzohar, M.; Cooper, D.B. Automatic finding of main roads in aerial images by using geometric-stochastic models and estimation. IEEE T. Pattern Anal. 1996, 18, 707–721. [Google Scholar] [CrossRef]
- Liang, Y.; Shen, J.; Lin, X.; Bi, J.; Li, Y. Road tracking by Parallel Angular Texture Signature. In Proceedings of the 2008 International Workshop on Earth Observation and Remote Sensing Applications, Beijing, China, 30 June–2 July 2008; pp. 1–6. [Google Scholar]
- Lai, J.; Li, J.; Yue, M.; Zeng, F. Distribution Characteristics of the Natural Forest’s Damage Information in Western Sichuan Based on QucikBird Data. J. Sichuan Agricultural Univ. Available online: http://kns.cnki.net/kcms/detail/51.1281.s.20220125.2044.006.html (accessed on 24 February 2022).
- Paisitkriangkrai, S.; Shen, C.; Av, H. Pedestrian detection with spatially pooled features and structured ensemble learning. IEEE T. Pattern Anal. 2016, 38, 1243–1257. [Google Scholar] [CrossRef]
- Alkhawlani, M.M.; Elmogy, M.; Elbakry, H.M. Content-based image retrieval using local features descriptors and bag-of-visual words. Int. J. Adv. Comput. Sc. 2015, 6, 212–219. [Google Scholar] [CrossRef]
- Campsvalls, G. New machine-learning paradigm provides advantages for remote sensing. SPIE Newsroom 2008, 46, 1–3. [Google Scholar]
- Tuia, D.; Munozmari, J.; Gomezchova, L.; Malo, J. Graph matching for adaptation in remote sensing. IEEE T. Geosci. Remote Sens. 2013, 51, 329–341. [Google Scholar] [CrossRef]
- Lin, D.; Fu, K.; Wang, Y.; Xu, G.; Sun, X. MARTA GANs: Unsupervised representation learning for remote sensing image classification. IEEE Geosci. Remote Sens. Lett. 2017, 14, 2092–2096. [Google Scholar] [CrossRef]
- Jiang, C.; Zhang, H.; Shen, H.; Zhang, L. Two-step sparse coding for the pan-sharpening of remote sensing images. IEEE J-Stars. 2014, 7, 1792–1805. [Google Scholar] [CrossRef]
- Yuan, H.; Van Der Wiele, C.F.; Khorram, S. An Automated Artificial Neural Network System for Land Use/Land Cover Classification from Landsat TM Imagery. Remote Sens. 2009, 1, 243–265. [Google Scholar] [CrossRef]
- Blanzieri, E.; Melgani, F. An adaptive SVM nearest neighbor classifier for remotely sensed imagery. In Proceedings of the 2006 IEEE International Symposium on Geoscience and Remote Sensing, Denver, CO, USA, 31 July–4 August 2006; pp. 3931–3934. [Google Scholar]
- Dai, C.G.; Huang, X.B.; Dong, G.J. Support vector machine for classification of hyperspectral remote sensing imagery. Fuzzy Syst. Knowl. Disc. 2007, 4, 77–80. [Google Scholar]
- Zhang, L.; Zhang, L.; Du, B. Deep learning for remote sensing data: A technical tutorial on the state of the art. IEEE Geosc. Rem. Sen. M. 2016, 4, 22–40. [Google Scholar] [CrossRef]
- Zhao, W.; Guo, Z.; Yue, J.; Zhang, X.; Luo, L. On combining multiscale deep learning features for the classification of hyperspectral remote sensing imagery. Int. J. Remote Sens. 2015, 36, 3368–3379. [Google Scholar] [CrossRef]
- Li, J.; Cao, L.; Pu, R. Progresses on monitoring and assessment of flood disaster in remote sensing. J. Hydraul. Eng. 2014, 45, 253–260. [Google Scholar]
- Alfieri, L.; Salamon, P.; Bianchi, A.; Neal, J.; Bates, P.; Feyen, L. Advances in pan-European flood hazard mapping. Hydrol. Process. 2014, 28, 4067–4077. [Google Scholar] [CrossRef]
- Henry, Z.; Banda, K.; Anthony, C.; Wilson, P.; Peter, S.; Markus, M.; Imasiku, N. Assessment of trends in inundation extent in the Barotse Floodplain, upper Zambezi River Basin: A remote sensing-based approach. J. Hydrol. Reg. Stud. 2018, 15, 149–170. [Google Scholar]
- Li, H.; Wang, X.; Dai, S.; Tian, G. Flood monitoring in Hainan Island based on HJ-CCD data. Trans. Chinese Soc. Agric. Eng. 2015, 31, 191–198. [Google Scholar]
- Wang, Q.; Sun, P.; Wang, X.; Wang, Q.; Wang, Y.; Yuan, L.; Wang, Y.; Xu, H.; Chen, Z.; Wei, L. Fast assessment model of flood hazards based on flooding process and remote sensing data: A case study in Poyang Lake Region. Resour. Environ. Yangtze Basin 2017, 26, 1831–1842. [Google Scholar]
- Wang, J.; Liu, T.; Yu, Z.; Hu, T.; Zhang, D.; Xun, D.; Wang, D. A research on town flood information rapid extraction based on COSMO-SkyMed and SPOT-5. Remote Sens. Tech. Appl. 2016, 31, 564–571. [Google Scholar]
- Wang, Q.; Zhang, Y.; Wang, Q.; Sun, P.; Chen, L.; Yang, Y. Remote sensing identification method of flood-inundated area based on perceptual visual attention. Trans. Chinese Soc. Agric. Eng. 2019, 35, 296–304. [Google Scholar]
- Wang, Y.; Qin, Y.; Li, Z.; Deng, L. Research on the Strategy of Multi Sensor Information Fusion in Coal Mine Disaster Scene. Appl. Mech. Mater. 2012, 220, 1929–1933. [Google Scholar] [CrossRef]
- Marlen, H.; Hans, B.; Stefan, S. Process-oriented disaster response management: A structured literature review. Bus. Process Manag. J. 2015, 21, 966–987. [Google Scholar]
- Thomas, J.; Kareem, A.; Bowyer, K. Fast robust perspective transform estimation for automatic image registration in disaster response applications. In Proceedings of the 2012 IEEE International Geoscience and Remote Sensing Symposium, Munich, Germany, 22–27 July 2012; pp. 2190–2193. [Google Scholar]
- Zhao, X.; Li, H.; Wang, P.; Jing, L. An Image Registration Method for Multisource High-Resolution Remote Sensing Images for Earthquake Disaster Assessment. Sensors 2020, 20, 2286. [Google Scholar] [CrossRef] [PubMed]
- Uss, M.L.; Vozel, B.; Lukin, V.V.; Chehdi, K. Multimodal Remote Sensing Image Registration With Accuracy Estimation at Local and Global Scales. IEEE T. Geosci. Remote 2016, 54, 6587–6605. [Google Scholar] [CrossRef]
- Koji, I.; Hitoshi, S. Oblique Aerial Image Registration from a Movie and GPS Data. J. Remote Sens. Soc. Jpn. 2015, 35, 155–172. [Google Scholar]
- Liu, Z.; Yang, J.; Zhang, L. Remote sensing image registration algorithm based on elliptic Fourier descriptor. J. Optoelectron. Laser 2015, 26, 352–359. [Google Scholar]
- Hao, M.; Jin, J.; Zhou, M.; Tian, Y.; Shi, W. Robust Multisource Remote Sensing Image Registration Method Based on Scene Shape Similarity. Photogramm. Eng. Remote Sens. 2019, 85, 725–736. [Google Scholar] [CrossRef]
- Michel, U.; Thuning, H.; Ehlers, M.; Reinartz, P. Rapid Change Detection Algorithm for Disaster Management. In Proceedings of the ISPRS Annals of the Photogrammetry, Remote Sensing and Spatial Information Sciences, XXII ISPRS Congress, Melbourne, Australia, 5 August–1 September 2012; pp. 107–111. [Google Scholar]
- Shuai, X.; Xu, Q.; Ma, D. Multi-sensor Satellite Image Sub-pixel Registration. In Proceedings of the Fourth International Conference on Image and Graphics (ICIG 2007), Chengdu, China, 22–24 August 2007; pp. 713–718. [Google Scholar]
- Akansha, S.; Krishna, K. Unsupervised change detection in remote sensing images using fusion of spectral and statistical indices. Egyptian J. Remote Sens. Space Sci. 2018, 21, 345–351. [Google Scholar]
- Cai, Z.; Jiang, Z.; Yuan, Y. Task-related self-supervised learning for remote sensing image change detection. In Proceedings of the 2021 IEEE International Conference on Acoustics, Speech and Signal Processing (ICASSP), Virtual Conference, Toronto, ON, Canada, 6–12 June 2021. [Google Scholar]
- Rueda-Velasquez, C.A. Geospatial Image Stream Processing: Models, techniques, and applications in remote sensing change detection. Ph.D. Dissertation, University of California at Davis, Davis, CA, USA, 2007. [Google Scholar]
- Luo, X.; Li, X.; Wu, Y.; Hou, W.; Wang, M.; Jin, Y.; Xu, W. Research on Change Detection Method of High-Resolution Remote Sensing Images Based on Sub-Pixel Convolution. IEEE J.-Stars. 2021, 14, 1447–1457. [Google Scholar]
- Chen, H.; Ping, L.; Xing, H. Remote sensing image change detection based on spatial neighborhood analysis. In Proceedings of the 2013 IEEE International Conference on Control System, Computing and Engineering, Penang, Malaysia, 29 November–1 December 2013; pp. 296–299. [Google Scholar]
- Amitrano, D.; Di Martino, G.; Iodice, A.; Riccio, D.; Ruello, G. A New Framework for SAR Multitemporal Data RGB Representation: Rationale and Products. IEEE Trans. Geosci. Remote Sens. 2015, 53, 117–133. [Google Scholar] [CrossRef]
- Wang, K.; Li, T.; Wei, J. Exploring drought conditions in the Three River Headwaters Region from 2002 to 2011 using multiple drought indices. Water 2019, 11, 190. [Google Scholar] [CrossRef]
- Zha, Y.; Gao, J.; Jiang, J.; Lv, H.; Huang, J. Normalized difference haze index: A new spectral index for monitoring urban air pollution. Int. J. Remote Sens. 2012, 33, 309–321. [Google Scholar] [CrossRef]
- Zhang, Q.; Yu, H.; Sun, P.; Singh, V.P.; Shi, P. Multisource data based agricultural drought monitoring and agricultural loss in China. Global Planet. Chang. 2019, 172, 298–306. [Google Scholar] [CrossRef]
- Ohkura, H.; Jitsufuchi, T.; Matsumoto, T.; Fujinawa, Y. Application of SAR data to monitoring of earthquake disaster. Adv. Space Res. 1997, 19, 1429–1436. [Google Scholar] [CrossRef]
- Yonezawa, C.; Takeuchi, S. Detection of urban damage using interferometric SAR decorrelation. In Proceedings of the IEEE International Geoscience & Remote Sensing Symposium, Hamburg, Germany, 28 June–2 July 1999. [Google Scholar] [CrossRef]
- Refice, A.; Capolongo, D.; Pasquariello, G.; D’Addabbo, A.; Bovenga, F.; Nutricato, R.; Lovergine, F.P.; Pietranera, L. SAR and InSAR for Flood Monitoring: Examples with COSMO-SkyMed Data. IEEE J. Sel. Top. Appl. Earth Obs. Remote Sens. 2014, 7, 2711–2722. [Google Scholar] [CrossRef]
- Cian, F.; Marconcini, M.; Ceccato, P. Normalized Difference Flood Index for rapid flood mapping: Taking advantage of EO big data. Remote Sens. Environ. 2018, 209, 712–730. [Google Scholar] [CrossRef]
- Horita, F.; Albuquerque, J.; Marchezini, V. Understanding the decision-making process in disaster risk monitoring and early-warning: A case study within a control room in Brazil. Int. J. Disast. Risk Reduct. 2018, 28, 22–31. [Google Scholar] [CrossRef]
- Wu, J.; Li, Y.; Li, N.; Shi, P. Development of an Asset Value Map for Disaster Risk Assessment in China by Spatial Disaggregation Using Ancillary Remote Sensing Data. Risk Anal. 2018, 38, 17–30. [Google Scholar] [CrossRef] [PubMed]
- Archer, R.S. Measuring and Monitoring Long Term Disaster Recovery Using Remote Sensing: A Case Study of Post Katrina New Orleans. Ph.D. Dissertation, University of California at Davis, Davis, CA, USA, 2013. Available online: https://www.proquest.com/docview/1468440164 (accessed on 10 January 2022).
- Van Westen, C. Remote sensing for natural disaster management. Int. Arch. Photogramm. Remote Sens. 2000, 33, 1609–1617. [Google Scholar]
- Kaku, K. Satellite remote sensing for disaster management support: A holistic and staged approach based on case studies in Sentinel Asia. Int. J. Disast. Risk Reduct. 2019, 33, 417–432. [Google Scholar] [CrossRef]
- Maldonado, M.; Alulema, D.; Morocho, D.; Proaño, M. System for monitoring natural disasters using natural language processing in the social network Twitter. In Proceedings of the 2016 International Carnahan Conference on Security Technology (ICCST), Orlando, FL, USA, 24–27 October 2016; pp. 1–6. [Google Scholar]
- Pastor-Escuredo, D.; Morales-Guzman, A.; Torres-Fernandez, Y.; Bauer, J.; Wadhwa, A.; Castro-Correa, C.; Romanoff, L.; Lee, J.; Rutherford, A.; Frias-Martinez, V.; et al. Flooding through the lens of mobile phone activity. Proceedings of IEEE Global Humanitarian Technology Conference (GHTC 2014), San Jose, CA, USA, 10–13 October 2014; pp. 279–286. [Google Scholar]
- Pastor-Escuredo, D.; Torres, Y.; Martínez-Torres, M.; Zufiria, P.J. Rapid Multi-Dimensional Impact Assessment of Floods. Sustainability 2020, 12, 4246. [Google Scholar] [CrossRef]
- Worboys, M. Event-oriented approaches to geographic phenomena. Int. J. Geogr. Inf. Sci. 2005, 19, 1–28. [Google Scholar] [CrossRef]
- Mcintosh, J.; Yuan, M. Assessing Similarity of Geographic Processes and Events. T. GIS 2005, 9, 223–245. [Google Scholar] [CrossRef]
- Peuquet, D.J.; Duan, N. An event-based spatiotemporal data model (ESTDM) for temporal analysis of geographical data. Int. J. Geogr. Inf. Sys. 1995, 9, 7–24. [Google Scholar] [CrossRef]
- Du, Y.; Yi, J.; Xue, C.; Qian, J.; Pei, T. Geographic event modeling and analysis supported by multi-source geographic big data. Acta Geogr. Sinica 2021, 76, 2853–2866. [Google Scholar]
- Zhang, X.; Zhang, C.; Wu, M.; Lv, G. Spatiotemporal features based geographical knowledge graph construction. Sci. Sin. (Inf.) 2020, 50, 1019–1032. [Google Scholar]


| Scale Classifications | Timescales | Applicable Types of Disaster Elements | ||||
|---|---|---|---|---|---|---|
| Extent | Granularity (/y) | Pregnant Environment | Causing Factor | Disaster-Bearing Body | ||
| Time Range(/y) | Timespan(/y) | |||||
| Extra-long scale | >100 | >1000 | 100 | Solar activity, climate change, landform change | - | Human, economic, environmental, social, and other major categories |
| 100–1000 | 10, 50, 100 | |||||
| Long scale | 10–100 | 50–100 | 10 | Climate change, desertification, soil erosion | - | Human, economic, environmental, social, and other major categories |
| 10–50 | 1, 5, 10 | |||||
| Meso scale | 1–10 | 5–10 | 1 | Land use, vegetation cover | Drought, precipitation, cold wave | Population (rural population, urban population, etc.), industry (heavy industry, light industry, etc.), agriculture (planting industry, breeding industry, etc.), construction (infrastructure, housing, etc.), transportation (land transport, water transport, etc.) and objects in the primary and secondary classifications in other categories. |
| 1–5 | 1 month, 1 year | |||||
| Short scale | ≤1 | 1 year | 10 days, 1 month, 1 season | - | Rainstorms, typhoons, high temperatures, cold waves, snowfall, hail, and other weather phenomena | Population (rural youth population, urban youth population, etc.), industry (food processing industry, metal manufacturing, etc.), agriculture (corn, wheat, etc.), construction (factory, community, etc.), transportation (railway, aircraft, etc.) and other objects in the primary, secondary, and tertiary classifications in other categories |
| 1 season | 10 days, 1 month | |||||
| 10 days | 1 day, 1 week | |||||
| 1 week | 1 day | |||||
| 1 day | 1 hour, 30 minutes, 1 minute | |||||
| Types | Revisit Period (/d) | Spatial Resolution (/m) | Spectral Resolution (/nm) | Spectral Range (/μm) | |
|---|---|---|---|---|---|
| Drought [45] | 2–6 | 5–1000 | 2–50 | 0.76–14.0 | |
| Precipitation | Flood [46] | 1–2 | 0.5–30 | 5–50 | 0.76–2.5 |
| Typhoon [47] | 2–12 h | 50–1000 | 5–50 | 0.76–2.5 | |
| Snow | Snow cover [48] | 1–2 | 5–30 | 2–50 | 0.76–2.5 |
| Sea ice [49] | 2–5 | 30–1000 | 10–50 | 0.76–2.5 | |
| Ice slush [50] | 2–5 | 5–30 | 10–50 | 0.76–2.5 | |
| Type | Index/Method | Description |
|---|---|---|
| Cloud top radiation | Precipitation Estimation from Remotely Sensed Information using Artificial Neural Networks (PERSIANN) [92] | Cloud top radiation and reflection information are used to judge the possibility of precipitation. Determination of precipitation probability and duration from cloud thickness and cloud top temperature. The combination of the above precipitation estimates. |
| Zhang et al., 2003 [93] | ||
| Microwave-based inversion | Microwave radiation index [94] | Compared with infrared and visible light, microwaves can penetrate non-precipitation clouds; thus, it can detect the temperature and humidity information under all kinds of weather conditions except heavy precipitation. |
| Microwave scattering index [95] | ||
| Comprehensive microwave index [96] | ||
| Multi-sensor combination | TRMM microwave and TRMM rain radar [97] | Uses a combination of sensors to improve accuracy, coverage, and resolution. |
| Microwave/infrared rainfall algorithm (MIRA) [98] |
| Type | Index/Method | Description |
|---|---|---|
| Snow identification | Normalized difference snow index (NDSI) [99] | The inversion function is constructed by using the reflectivity of the green band and short-wave infrared band to distinguish snow cover from other ground objects and clouds. |
| Normalized difference forest–snow index (NDFSI) [100] | ||
| Universal ratio snow index (URSI) [101] | ||
| Snow coverage | MODSCAG algorithm [102] | Snow coverage can be estimated by the transition between snow-free and snow-free signals, which comes from the methods of mixed pixel decomposition and supervised classification. |
| Sirguey et al., 2009 [103] | ||
| Hao et al., 2018 [104] | ||
| Aalstad et al., 2020 [105] |
| Type | Index/Method | Description |
|---|---|---|
| Spectral feature | Lan et al., 1998 [106] | In the near-infrared band, haze particles are usually yellow or gray—white, while cloud and fog particles are usually white. In the thermal infrared band, the difference between haze and ground surface brightness temperature is small, but the difference between haze and cloud brightness temperature is large. |
| Gao et al., 2015 [107] | ||
| Ge et al., 2017 [108] | ||
| Image preferential | HOT transform [109] | The amplitude of the image after HOT transform is directly proportional to the influence degree of haze, and the value of HOT reflects haze’s degree of influence. |
| Tasseled cap transformation [110] | The method is suitable for normalizing Landsat MSS with the influence of haze. | |
| Aerosol optical depth | Li et al., 2013 [111] | The size of AOD was classified and the relationship between the degree of haze and the aerosol optical depth was analyzed. For instance, when AOD (440 nm) > 1, the haze occurred. |
| Tao et al., 2014 [112] | ||
| Multi-source remote sensing stereo monitoring | Optical sensor and laser radar [113] | Part of the solution to the lack of night observation data. |
| Laser radar and infrared [114] | Distribution at different vertical heights. |
| Type | Index/Method | Description |
|---|---|---|
| Threshold range | Rau et al., 2013 [118] | The judgement is based on the different gray levels of different types of clouds in the same channel cloud image. |
| Chen et al., 2015 [119] | ||
| Mathematical morphology | Sasaki et al., 2015 [120] | The structure and characteristics of meteorological satellite cloud maps are described by using seven basic operations (dilation, erosion, opening, closing, hitting, thinning and thickening) in the space domain. |
| Xie et al., 2017 [121] | ||
| Dynamic clustering | Kitamoto et al., 2002 [122] | According to the principle of clustering, the sample points to be classified are clustered to the cluster center, and the iterative operation of modifying the cluster center is repeated. |
| Liu et al., 2013 [123] |
| Type | Index/Method | Description |
|---|---|---|
| Dark pixels | Kaufman et al., 1997 [125] | Based on the reflectance difference between the dust and the surface, the dust can be inverted according to the idea that the reflectance of the sand dust area is higher than that of the surface. |
| Hsu et al., 2006 [126] | ||
| Brightness temperature difference | Infrared difference dust index (IDDI) [127] | According to the difference between brightness temperature measured by remote sensing and surface brightness temperature in the clear sky, the occurrence of dust can be indicated to some extent. |
| Infrared classification window algorithm [128] | ||
| Three channels [129] | ||
| Four channels [130] |
| Target Type | Typical Target | Target Signature | Main Detection Algorithm |
|---|---|---|---|
| Linear objects | Roads, airport runways, rivers, etc. | Edge, size, texture, grayscale | Data-driven strategies such as edge extraction, structural analysis, etc. |
| Blob objects | Trees, crops, buildings, vehicles, ships, etc. | Texture and shape features, spatial region features, visual saliency features | Data-driven strategies such as image segmentation, structural analysis detection, statistical analysis detection, distribution model (CFAR) detection, transform domain detection, multi-core learning, manifold learning, etc. |
| Complex objects | Residential areas, airports, stations, ports, etc. | Point, line, and texture features, multi-feature combinations | Task-driven and data-driven integrated strategy |
| Target Type | Index/Method | Description | |
|---|---|---|---|
| Buildings | Image characteristics | Zhu et al., 2008 [135] | The characteristics in different images are compared and analyzed regarding gray-scale characteristics, shape characteristics, texture characteristics, and context characteristics. |
| Nia et al., 2017 [136] | |||
| Ismail et al., 2022 [137] | |||
| Polarization characteristics | Ma et al., 2019 [138] | Polarization characteristics are sensitive to the shape and direction of target objects. | |
| Roads | Image features | Boundary detection [139] | The image features are mainly the gray-level features, shape features, and edge features of the road. |
| Morphological operator [140] | |||
| Binary conversion [141] | |||
| Dynamic programming | Poz et al., 2010 [142] | The parameter model of the road is transformed into the function of the road points, and the optimal path connecting the seed points of the road is determined. | |
| Fischler et al., 1987 [143] | |||
| Barzoha et al., 1996 [144] | |||
| Parallel line pair | Liang et al., 2008 [145] | The road edge has the characteristics of parallel line pairs. | |
| Woodlands | Multiscale segmentation | Lai et al., 2022 [146] | Establish classification and recognition rule set to extract various damage information of natural forest. |
| Scene Type | Index/Method | Description | |
|---|---|---|---|
| Flood submerging area (Farmland) | Spectral signature | Li et al., 2014 [158] | Scene classification of water body remote sensing. |
| Alfieri et al., 2014 [159] | |||
| Spatial shape and texture features | Henry et al., 2018 [160] | ||
| Li et al., 2015 [161] | |||
| Wang et al., 2017 [162] | |||
| Attention mechanism | Wang et al., 2016 [163] | Thematic information enhancement of submerged area based on selective visual attention mechanism. | |
| Wang et al., 2019 [164] | |||
| Type | Index/Method | Description |
|---|---|---|
| Pixel-level change | Vegetation index [181] | Changes in agricultural drought distribution |
| Haze index NDHI [182] | Changes in haze distribution | |
| Drought severity index (DSI) [183] | Changes in agricultural drought distribution | |
| Object-level change | Strength characteristics [184] | Damaged condition of buildings |
| Coherent characteristics [185] | ||
| Scene-level change | Refice et al., 2014 [186] | Flood submerging area |
| Cian et al., 2018 [187] |
Publisher’s Note: MDPI stays neutral with regard to jurisdictional claims in published maps and institutional affiliations. |
© 2022 by the author. Licensee MDPI, Basel, Switzerland. This article is an open access article distributed under the terms and conditions of the Creative Commons Attribution (CC BY) license (https://creativecommons.org/licenses/by/4.0/).
Share and Cite
Ye, P. Remote Sensing Approaches for Meteorological Disaster Monitoring: Recent Achievements and New Challenges. Int. J. Environ. Res. Public Health 2022, 19, 3701. https://doi.org/10.3390/ijerph19063701
Ye P. Remote Sensing Approaches for Meteorological Disaster Monitoring: Recent Achievements and New Challenges. International Journal of Environmental Research and Public Health. 2022; 19(6):3701. https://doi.org/10.3390/ijerph19063701
Chicago/Turabian StyleYe, Peng. 2022. "Remote Sensing Approaches for Meteorological Disaster Monitoring: Recent Achievements and New Challenges" International Journal of Environmental Research and Public Health 19, no. 6: 3701. https://doi.org/10.3390/ijerph19063701
APA StyleYe, P. (2022). Remote Sensing Approaches for Meteorological Disaster Monitoring: Recent Achievements and New Challenges. International Journal of Environmental Research and Public Health, 19(6), 3701. https://doi.org/10.3390/ijerph19063701