
A Roadmap toward Achieving Sustainable Environment: Evaluating the Impact of Technological Innovation and Globalization on Load Capacity Factor

 ,
, 
 ,
,  ,
,  and
and 
Abstract
:1. Introduction
2. Literature Review
2.1. Economic–Energy–Environmental Degradation Nexus
2.2. Technological Innovation–Environmental Degradation Nexus
2.3. Globalization–Environmental Degradation Nexus
3. Theoretical Framework, Model Construction, and Model
3.1. Empirical Framework
3.2. Data Description
3.3. Methods
4. Results and Discussion
5. Conclusions
Policy Directions
Author Contributions
Funding
Institutional Review Board Statement
Informed Consent Statement
Data Availability Statement
Conflicts of Interest
References
- Miao, Y.; Razzaq, A.; Adebayo, T.S.; Awosusi, A.A. Do renewable energy consumption and financial globalisation contribute to ecological sustainability in newly industrialized countries? Renew. Energy 2022, 167, 688–697. [Google Scholar] [CrossRef]
- Adebayo, T.S.; Awosusi, A.A.; Rjoub, H.; Agyekum, E.B.; Kirikkaleli, D. The influence of renewable energy usage on consumption-based carbon emissions in MINT economies. Heliyon 2022, 8, e08941. [Google Scholar] [CrossRef] [PubMed]
- Ayobamiji, A.A.; Kalmaz, D.B. Reinvestigating the Determinants of Environmental Degradation in Nigeria: International Journal of Economic Policy in Emerging Economies: Vol 13, No 1. Int. J. Econ. Policy Emerg. Econ. 2020, 13, 52–71. [Google Scholar] [CrossRef]
- Chen, M.; Sinha, A.; Hu, K.; Shah, M.I. Impact of Technological Innovation on Energy Efficiency in Industry 4.0 Era: Moderation of Shadow Economy in Sustainable Development. Technol. Forecast. Soc. Chang. 2021, 164, 120521. [Google Scholar] [CrossRef]
- Sinha, A.; Sengupta, T.; Alvarado, R. Interplay between Technological Innovation and Environmental Quality: Formulating the SDG Policies for next 11 Economies. J. Clean. Prod. 2020, 242, 118549. [Google Scholar] [CrossRef]
- Kirikkaleli, D.; Adebayo, T.S. Do Renewable Energy Consumption and Financial Development Matter for Environmental Sustainability? New Global Evidence. Sustain. Develop. 2021, 29, 583–594. [Google Scholar] [CrossRef]
- AbdulKareem, H.K.; Adebayo, T.S.; Kirikkaleli, D.; Shah, M.I.; Abbas, S. CO2 behavior amidst the COVID-19 pandemic in the United Kingdom: The role of renewable and non-renewable energy development. Renew. Energy 2022, 175, 1012–1024. [Google Scholar] [CrossRef]
- Oladipupo, S.D.; Adebayo, T.S.; Awosusi, A.A.; Agyekum, E.B.; Jayakumar, A.; Kumar, N.M. Dominance of Fossil Fuels in Japan’s National Energy Mix and Implications for Environmental Sustainability. Int. J. Environ. Res. Public Health 2021, 18, 7347. [Google Scholar] [CrossRef]
- Yuping, L.; Ramzan, M.; Xincheng, L.; Murshed, M.; Awosusi, A.A.; Bah, S.I.; Adebayo, T.S. Determinants of Carbon Emissions in Argentina: The Roles of Renewable Energy Consumption and Globalization. Energy Rep. 2021, 7, 4747–4760. [Google Scholar] [CrossRef]
- Akinsola, G.D.; Awosusi, A.A.; Kirikkaleli, D.; Umarbeyli, S.; Adeshola, I.; Adebayo, T.S. Ecological Footprint, Public-Private Partnership Investment in Energy, and Financial Development in Brazil: A Gradual Shift Causality Approach. Environ. Sci. Pollut. Res. 2021, 29, 10077–10090. [Google Scholar] [CrossRef]
- Kihombo, S.; Ahmed, Z.; Chen, S.; Adebayo, T.S.; Kirikkaleli, D. Linking Financial Development, Economic Growth, and Ecological Footprint: What Is the Role of Technological Innovation? Environ. Sci. Pollut. Res. 2021, 28, 61235–61245. [Google Scholar] [CrossRef] [PubMed]
- Kirikkaleli, D.; Adebayo, T.S.; Khan, Z.; Ali, S. Does Globalization Matter for Ecological Footprint in Turkey? Evidence from Dual Adjustment Approach. Environ. Sci. Pollut. Res. 2021, 28, 14009–14017. [Google Scholar] [CrossRef] [PubMed]
- Chunling, L.; Memon, J.A.; Thanh, T.L.; Ali, M.; Kirikkaleli, D. The Impact of Public-Private Partnership Investment in Energy and Technological Innovation on Ecological Footprint: The Case of Pakistan. Sustainability 2021, 13, 10085. [Google Scholar] [CrossRef]
- Kihombo, S.; Vaseer, A.I.; Ahmed, Z.; Chen, S.; Kirikkaleli, D.; Adebayo, T.S. Is There a Tradeoff between Financial Globalization, Economic Growth, and Environmental Sustainability? An Advanced Panel Analysis. Environ. Sci. Pollut. Res. 2021, 29, 3983–3993. [Google Scholar] [CrossRef] [PubMed]
- Siche, R.; Pereira, L.; Agostinho, F.; Ortega, E. Convergence of Ecological Footprint and Emergy Analysis as a Sustainability Indicator of Countries: Peru as Case Study. Commun. Nonl. Sci. Num. Simul. 2010, 15, 3182–3192. [Google Scholar] [CrossRef]
- Fareed, Z.; Salem, S.; Adebayo, T.S.; Pata, U.K.; Shahzad, F. Role of Export Diversification and Renewable Energy on the Load Capacity Factor in Indonesia: A Fourier Quantile Causality Approach. Front. Environ. Sci. 2021, 9, 434. [Google Scholar] [CrossRef]
- Xu, D.; Sultan, S.; Abraham, A.A.; Gulnora, A.; Mehmet, A.; Dokun, O.; Dervis, K.; Opeoluwaseun, O. Load Capacity Factor and Financial Globalization in Brazil: The Role of Renewable Energy and Urbanization. Front. Environ. Sci. 2022, 9, 823185. [Google Scholar] [CrossRef]
- Narayan, P.K.; Narayan, S. Carbon dioxide emissions and economic growth: Panel data evidence from developing countries. Energy Policy 2010, 38, 661–666. [Google Scholar] [CrossRef]
- Akadiri, S.S.; Adebayo, T.S. Asymmetric Nexus among Financial Globalization, Non-Renewable Energy, Renewable Energy Use, Economic Growth, and Carbon Emissions: Impact on Environmental Sustainability Targets in India. Environ. Sci. Pollut. Res. 2021, 29, 16311–16323. [Google Scholar] [CrossRef]
- Alola, A.A.; Adebayo, T.S.; Onifade, S.T. Examining the Dynamics of Ecological Footprint in China with Spectral Granger Causality and Quantile-on-Quantile Approaches. Int. J. Sustain. Develop. World Ecol. 2021, 3, 1–14. [Google Scholar] [CrossRef]
- Yang, B.; Jahanger, A.; Ali, M. Remittance Inflows Affect the Ecological Footprint in BICS Countries: Do Technological Innovation and Financial Development Matter? Environ. Sci. Pollut. Res. 2021, 28, 23482–23500. [Google Scholar] [CrossRef] [PubMed]
- Destek, M.A.; Manga, M. Technological Innovation, Financialization, and Ecological Footprint: Evidence from BEM Economies. Environ. Sci. Pollut. Res. 2021, 28, 21991–22001. [Google Scholar] [CrossRef] [PubMed]
- Ahmad, M.; Jiang, P.; Majeed, A.; Umar, M.; Khan, Z.; Muhammad, S. The Dynamic Impact of Natural Resources, Technological Innovations and Economic Growth on Ecological Footprint: An Advanced Panel Data Estimation. Res. Policy 2020, 69, 101817. [Google Scholar] [CrossRef]
- Usman, M.; Hammar, N. Dynamic Relationship between Technological Innovations, Financial Development, Renewable Energy, and Ecological Footprint: Fresh Insights Based on the STIRPAT Model for Asia Pacific Economic Cooperation Countries. Environ. Sci. Pollut. Res. 2021, 28, 15519–15536. [Google Scholar] [CrossRef] [PubMed]
- Wahab, S.; Zhang, X.; Safi, A.; Wahab, Z.; Amin, M. Does Energy Productivity and Technological Innovation Limit Trade-Adjusted Carbon Emissions? Econ. Res.-Ekon. Istraživanja 2021, 34, 1896–1912. [Google Scholar] [CrossRef]
- Su, Z.-W.; Umar, M.; Kirikkaleli, D.; Adebayo, T.S. Role of Political Risk to Achieve Carbon Neutrality: Evidence from Brazil. J. Environ. Manag. 2021, 298, 113463. [Google Scholar] [CrossRef] [PubMed]
- Adebayo, T.S.; Kirikkaleli, D. Impact of Renewable Energy Consumption, Globalization, and Technological Innovation on Environmental Degradation in Japan: Application of Wavelet Tools. Environ. Dev. Sustain. 2021, 23, 16057–16082. [Google Scholar] [CrossRef]
- Osemeahon, O.S.; Bekun, F.V.; Adebayo, T.S.; Akinsola, G.D.; Sarkodie, S.A. Mitigating Human-Induced Emissions in Argentina: Role of Renewables, Income, Globalization, and Financial Development. Environ. Sci. Pollut. Res. 2021, 28, 67764–67778. [Google Scholar] [CrossRef]
- Adebayo, T.S.; Acheampong, A.O. Modelling the Globalization-CO2 Emission Nexus in Australia: Evidence from Quantile-on-Quantile Approach. Environ. Sci. Pollut. Res. 2021, 29, 9867–9882. [Google Scholar] [CrossRef]
- Coelho, M.F.; Onbaşıoğlu, D.Ç.; Adebayo, T.S.; Rjoub, H.; Mata, M.N.; Carvalho, P.V.; Rita, J.X.; Adeshola, I. Modeling the Dynamic Linkage between Renewable Energy Consumption, Globalization, and Environmental Degradation in South Korea: Does Technological Innovation Matter? Energies 2021, 14, 4265. [Google Scholar] [CrossRef]
- Adebayo, T.S.; Kirikkaleli, D.; Adeshola, I.; Oluwajana, D.; Akinsola, G.D.; Osemeahon, O.S. Coal Consumption and Environmental Sustainability in South Africa: The Role of Financial Development and Globalization. Int. J. Renew. Energy Develop. 2021, 10, 527–536. [Google Scholar] [CrossRef]
- Ahmed, Z.; Wang, Z.; Mahmood, F.; Hafeez, M.; Ali, N. Does Globalization Increase the Ecological Footprint? Empirical Evidence from Malaysia. Environ. Sci. Pollut. Res. 2019, 26, 18565–18582. [Google Scholar] [CrossRef] [PubMed]
- Ansari, M.A.; Haider, S.; Masood, T. Do Renewable Energy and Globalization Enhance Ecological Footprint: An Analysis of Top Renewable Energy Countries? Environ. Sci. Pollut. Res. 2021, 28, 6719–6732. [Google Scholar] [CrossRef] [PubMed]
- Salari, T.E.; Roumiani, A.; Kazemzadeh, E. Globalization, Renewable Energy Consumption, and Agricultural Production Impacts on Ecological Footprint in Emerging Countries: Using Quantile Regression Approach. Environ. Sci. Pollut. Res. 2021, 28, 49627–49641. [Google Scholar] [CrossRef] [PubMed]
- Ramzan, M.; Adebayo, T.S.; Iqbal, H.A.; Awosusi, A.A.; Akinsola, G.D. The Environmental Sustainability Effects of Financial Development and Urbanization in Latin American Countries. Environ. Sci. Pollut. Res. 2021. [Google Scholar] [CrossRef]
- Pesaran, M.H.; Shin, Y.; Smith, R.J. Bounds Testing Approaches to the Analysis of Level Relationships. J. Appl. Econom. 2001, 16, 289–326. [Google Scholar] [CrossRef]
- Kripfganz, S.; Schneider, D.C. ARDL: Stata Module to Perform Autoregressive Distributed Lag Model Estimation. In Proceedings of the Stata Conference, Chicago, IL, USA, 29 July 2018. [Google Scholar]
- Usman, O.; Olanipekun, I.O.; Iorember, P.T.; Abu-Goodman, M. Modelling Environmental Degradation in South Africa: The Effects of Energy Consumption, Democracy, and Globalization Using Innovation Accounting Tests. Environ. Sci. Pollut. Res. 2020, 27, 8334–8349. [Google Scholar] [CrossRef]
- Rafindadi, A.A.; Usman, O. Globalization, Energy Use, and Environmental Degradation in South Africa: Startling Empirical Evidence from the Maki-Cointegration Test. J. Environ. Manag. 2019, 244, 265–275. [Google Scholar] [CrossRef]
- Rjoub, H.; Adebayo, T.S.; Akinsola, G.D.; Oladipupo, S.D. The Asymmetric Effects of Renewable Energy Consumption and Trade Openness on Carbon Emissions in Sweden: New Evidence from Quantile-on-Quantile Regression Approach. Environ. Sci. Pollut. Res. 2021, 29, 1875–1886. [Google Scholar] [CrossRef]
- He, K.; Ramzan, M.; Awosusi, A.A.; Ahmed, Z.; Ahmad, M.; Altuntaş, M. Does globalization moderate the effect of economic complexity on CO2 emissions? Evidence from the top 10 energy transition economies. Front. Environ. Sci. 2021, 9, 778088. [Google Scholar] [CrossRef]
- Awosusi, A.A.; Mata, M.N.; Ahmed, Z.; Coelho, M.F.; Altuntaş, M.; Martins, J.M.; Martins, J.N.; Onifade, S.T. How Do Renewable Energy, Economic Growth and Natural Resources Rent Affect Environmental Sustainability in a Globalized Economy? Evidence From Colombia Based on the Gradual Shift Causality Approach. Front. Energy Res. 2022, 9, 739721. [Google Scholar] [CrossRef]
- Güngör, H.; Abu-Goodman, M.; Olanipekun, I.O.; Usman, O. Testing the Environmental Kuznets Curve with Structural Breaks: The Role of Globalization, Energy Use, and Regulatory Quality in South Africa. Environ. Sci. Pollut. Res. 2021, 28, 20772–20783. [Google Scholar] [CrossRef] [PubMed]
- Salahuddin, M.; Gow, J.; Ali, M.I.; Hossain, M.R.; Al-Azami, K.S.; Akbar, D.; Gedikli, A. Urbanization-Globalization-CO2 Emissions Nexus Revisited: Empirical Evidence from South Africa. Heliyon 2019, 5, e01974. [Google Scholar] [CrossRef] [PubMed] [Green Version]
- Breitung, J.; Candelon, B. Testing for Short- and Long-Run Causality: A Frequency-Domain Approach. J. Econom. 2006, 132, 363–378. [Google Scholar] [CrossRef]


| Indicators | Description | Unit | Sourced |
|---|---|---|---|
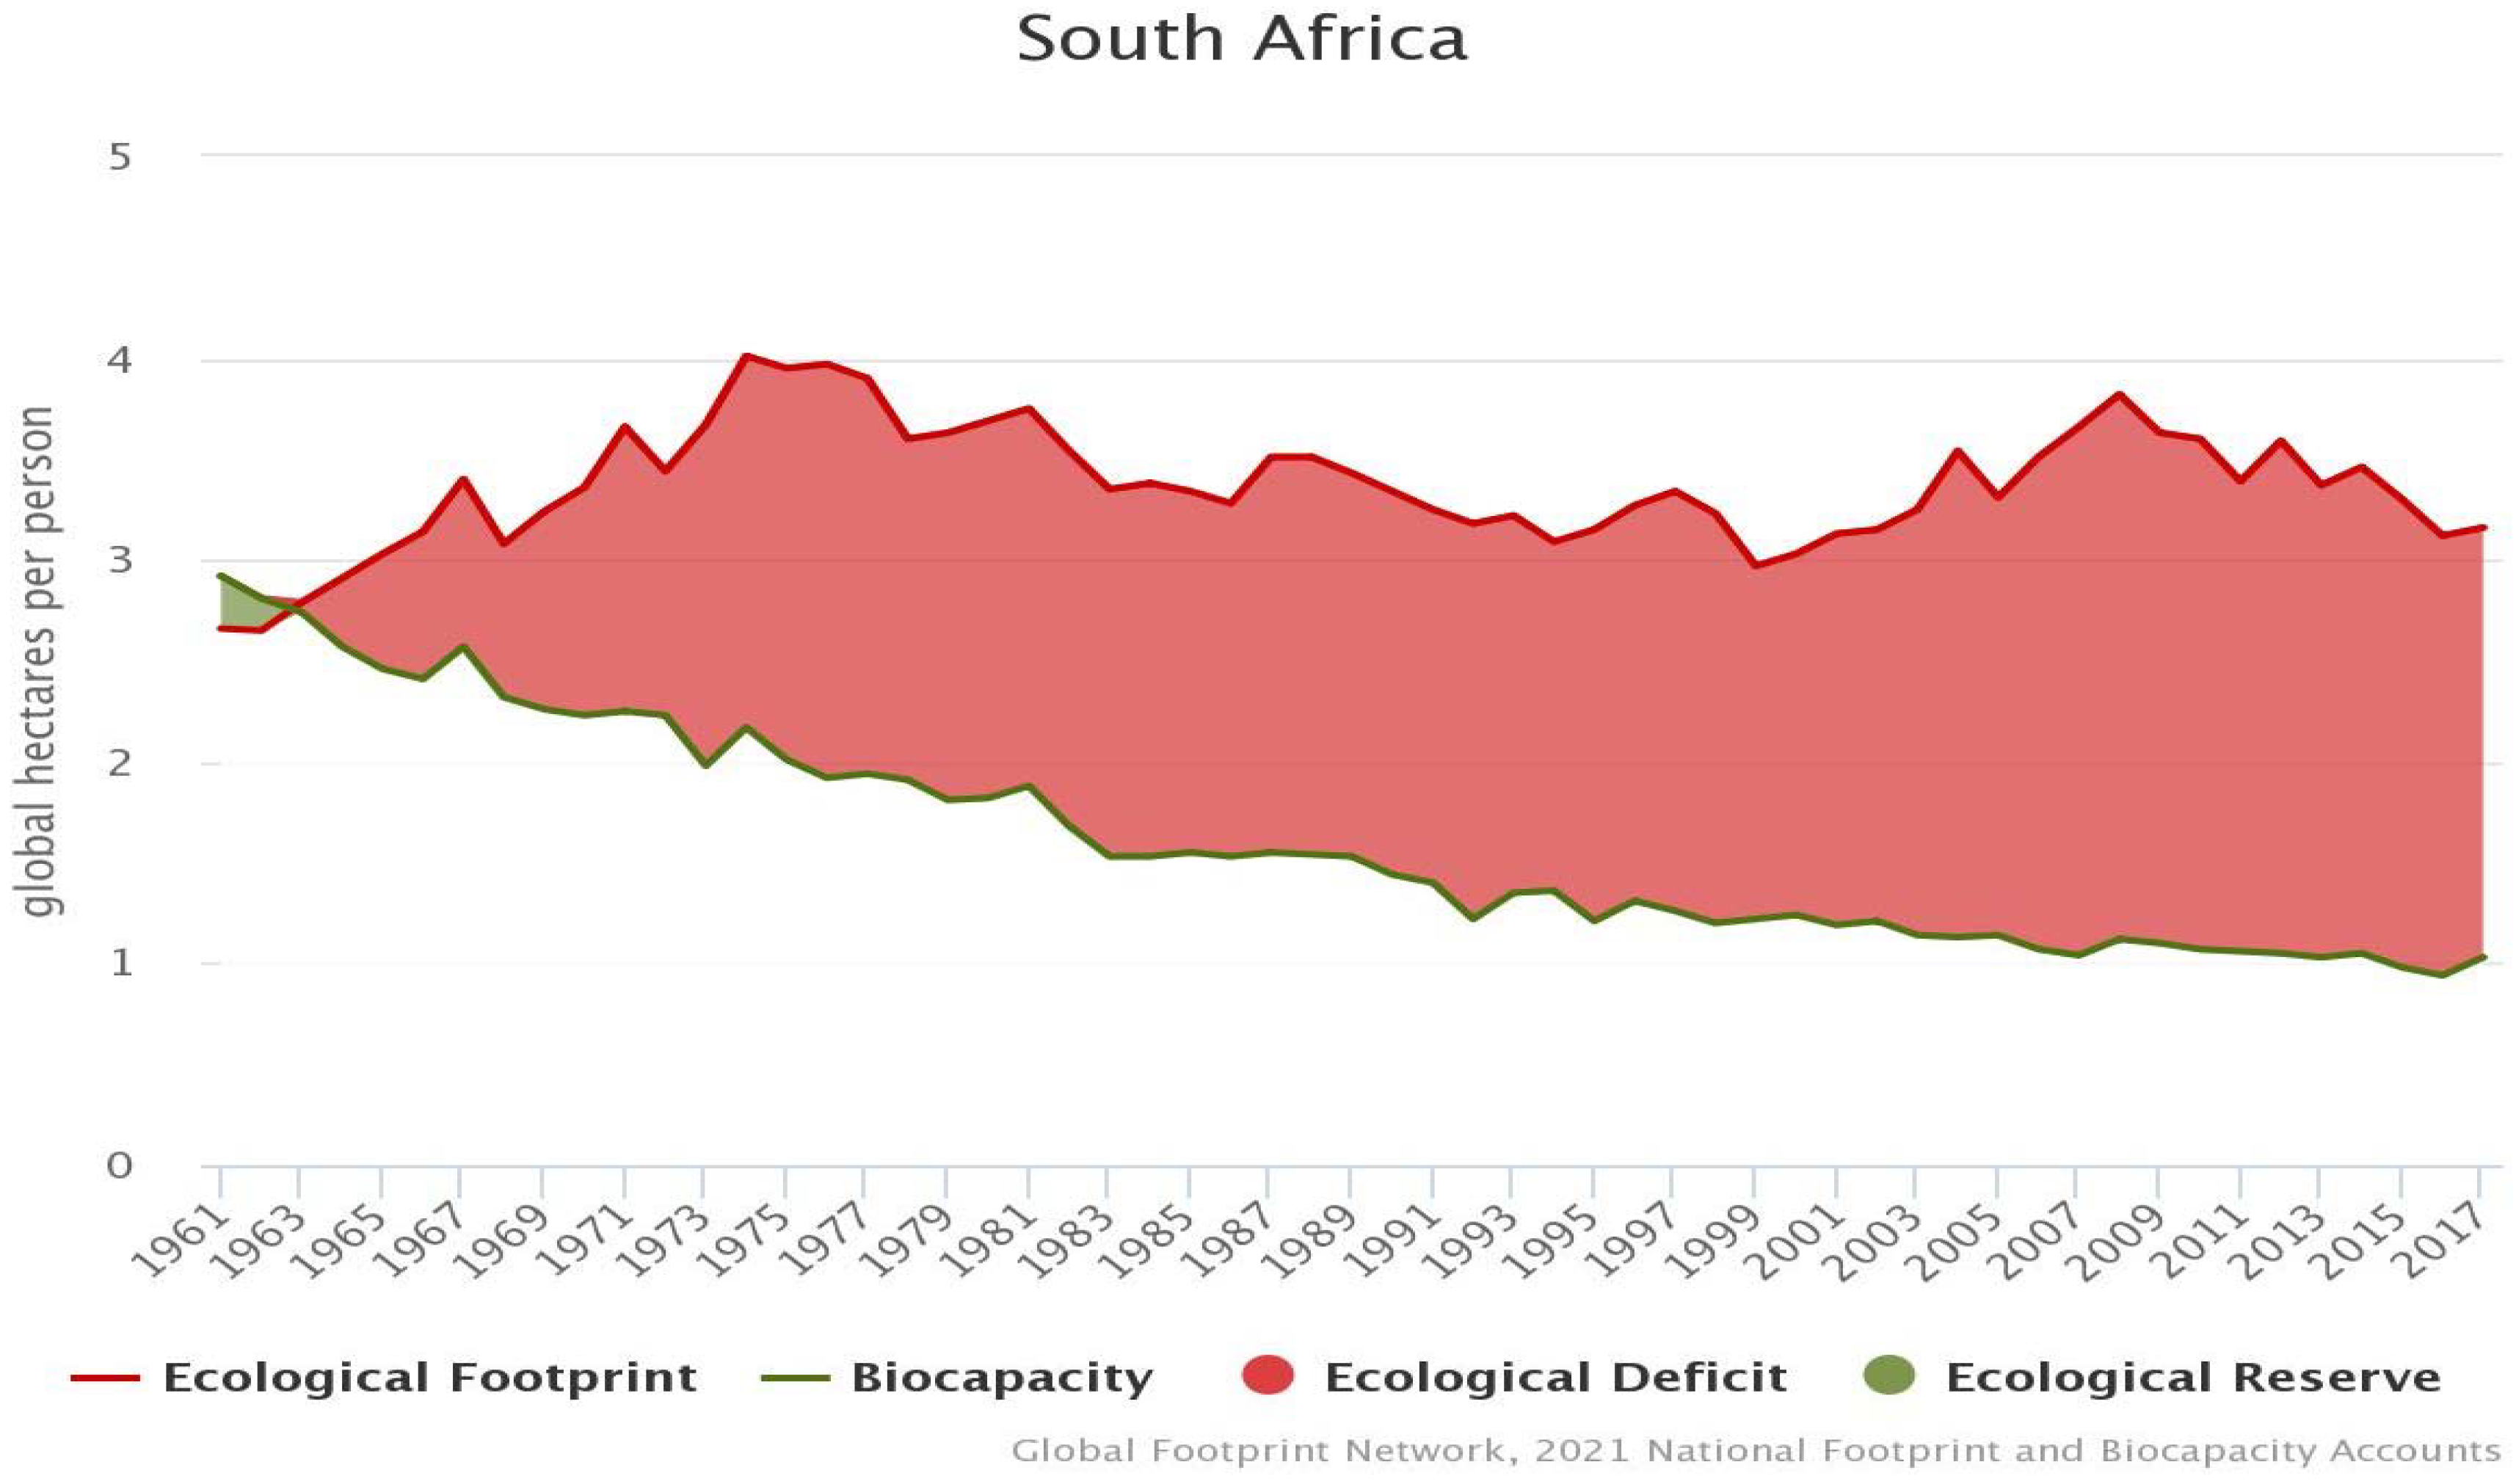
| LOCAP | Load capacity factor | Biocapacity divided by ecological footprint | Global Footprint Network |
| NREN | Nonrenewable energy | KWPH | BP database |
| GDP | GDP per capita | constant 2015 USD | World Bank Database indicators |
| TEC | Technological innovation | Added both resident and non-resident patent applications | |
| GLO | Globalization index | Index based on economic, political, and social | KOF Globalization Index |
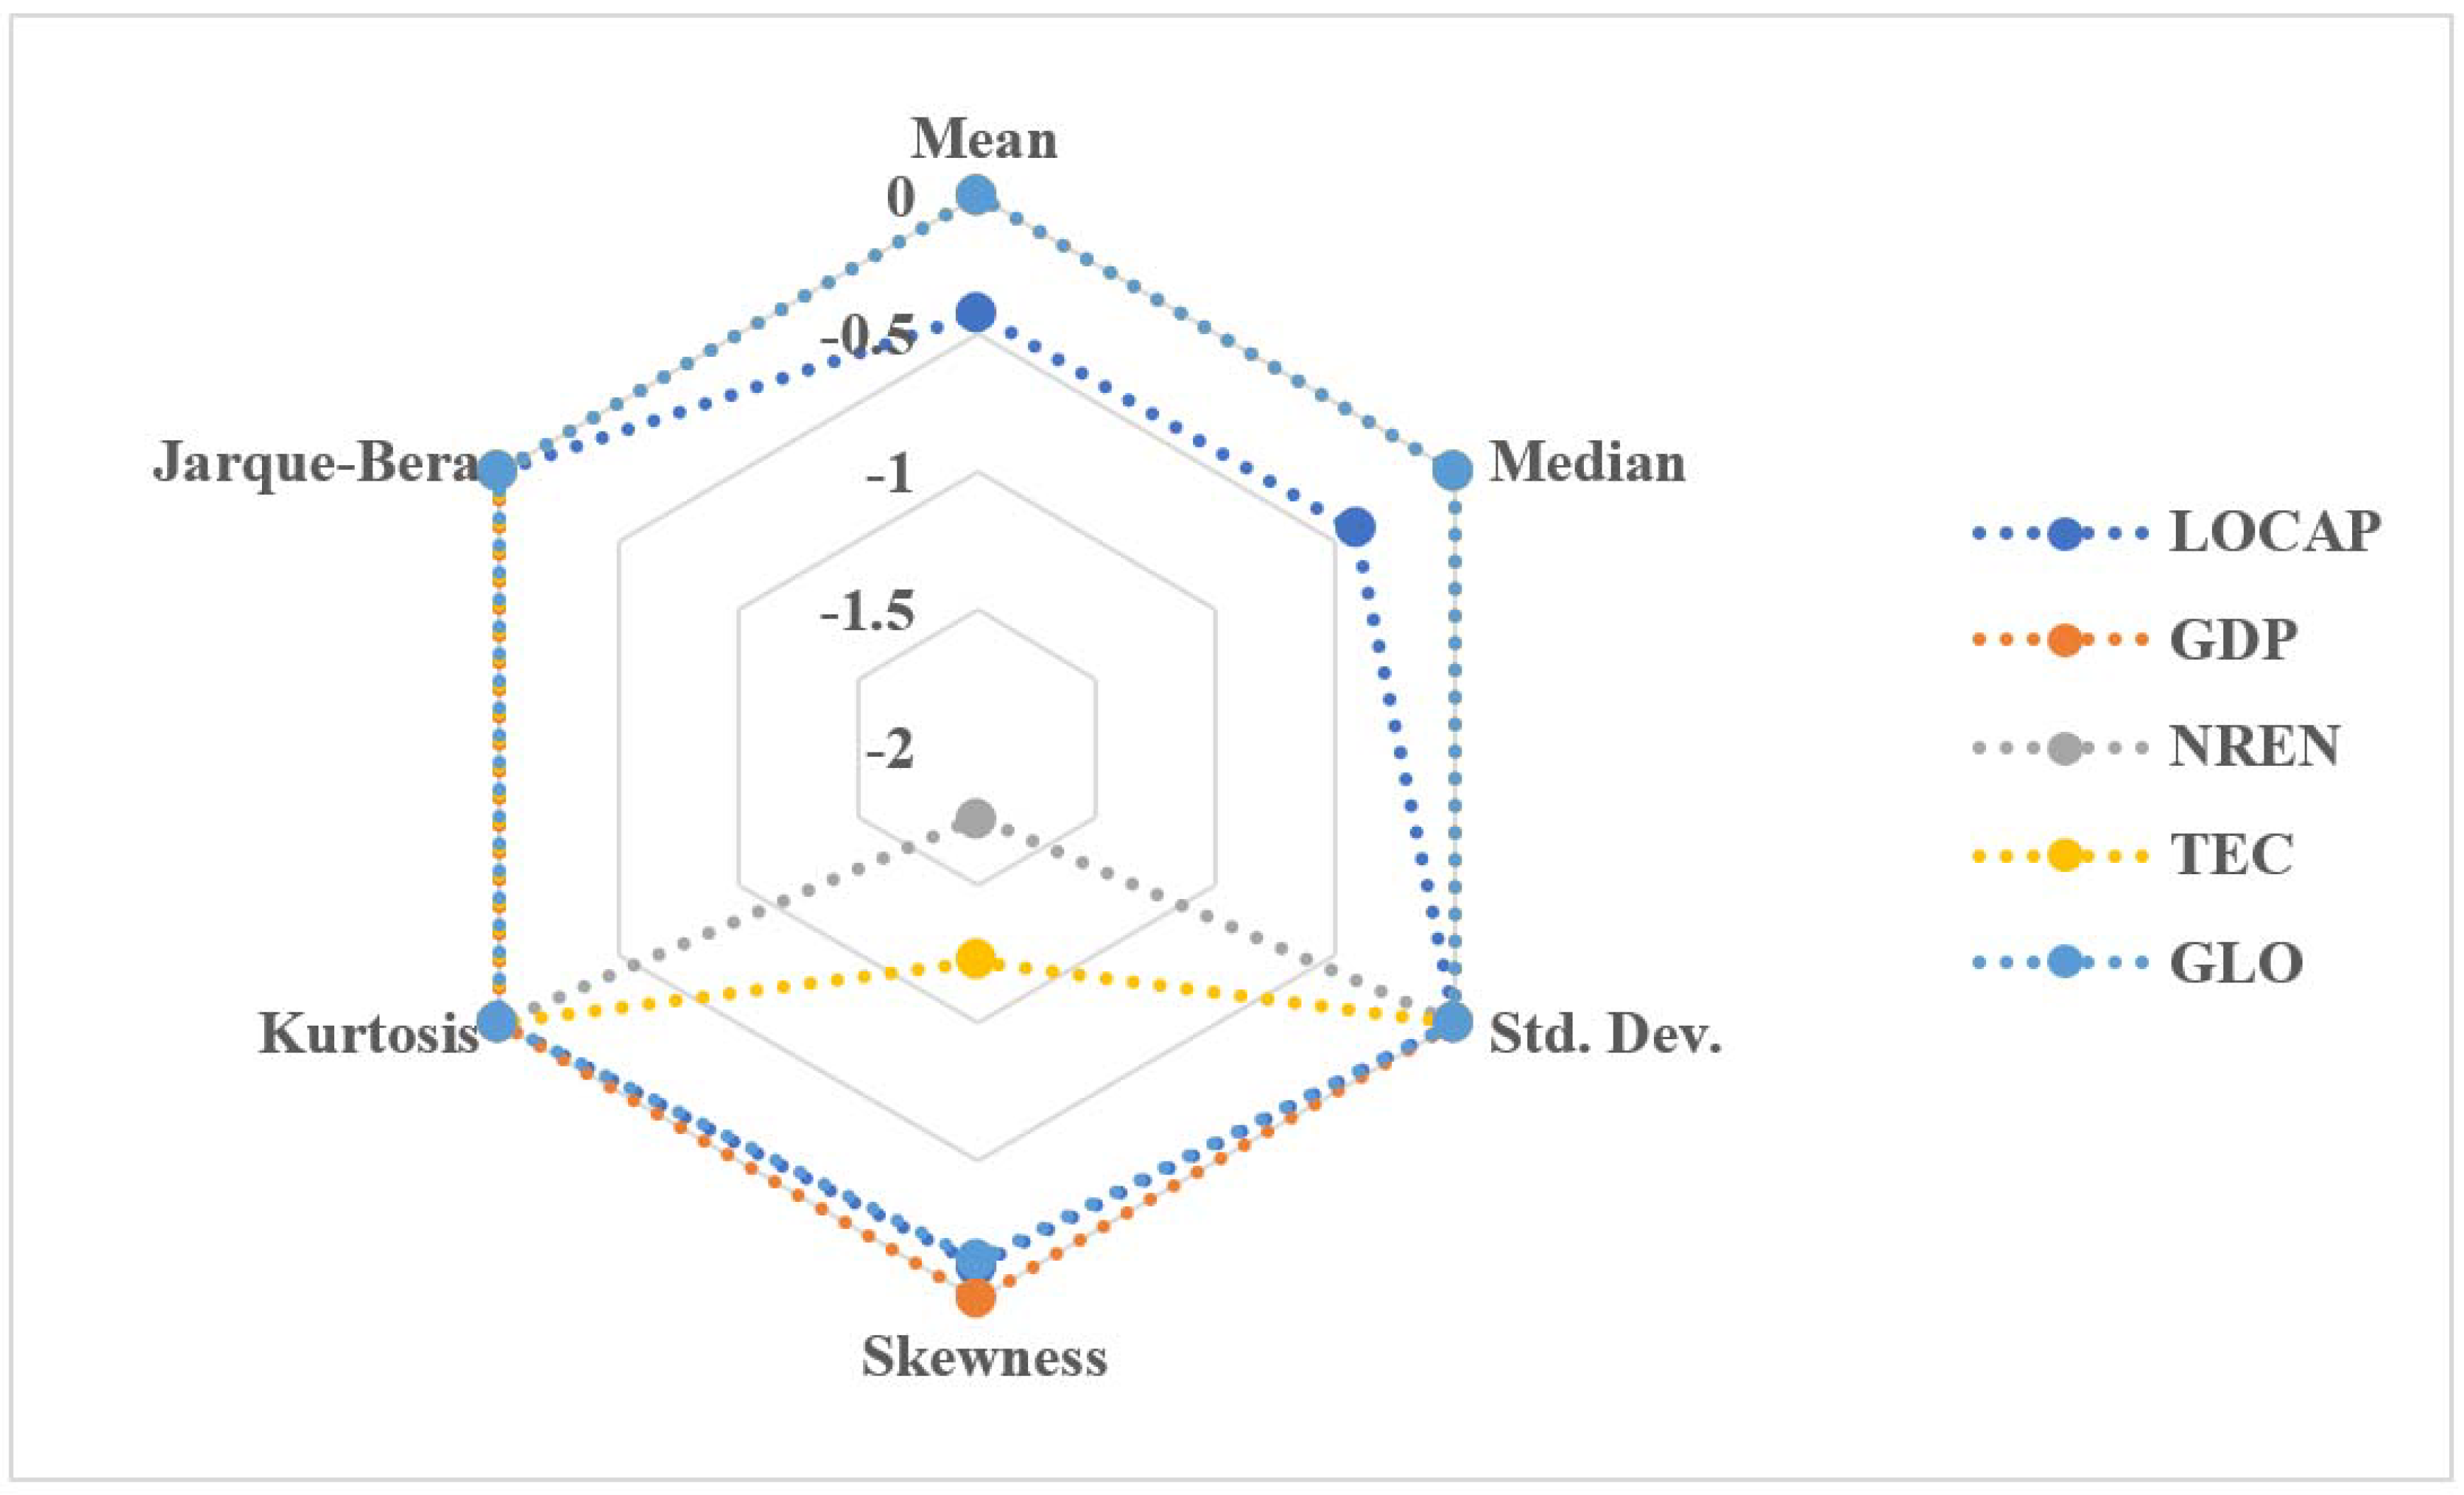
| LOCAP | GDP | NREN | TEC | GLO | |
|---|---|---|---|---|---|
| Mean | −0.425 | 3.692 | 3.746 | 3.854 | 1.709 |
| Median | −0.416 | 3.682 | 3.761 | 3.862 | 1.736 |
| Maximum | −0.299 | 3.760 | 3.869 | 4.006 | 1.850 |
| Minimum | −0.548 | 3.622 | 3.380 | 3.497 | 1.545 |
| Std. Dev. | 0.078 | 0.046 | 0.099 | 0.115 | 0.124 |
| Skewness | −0.119 | 0.138 | −1.743 | −1.224 | −0.134 |
| Kurtosis | 1.592 | 1.636 | 6.952 | 5.249 | 1.230 |
| Jarque–Bera | 3.228 | 3.065 | 43.978 | 17.490 | 5.075 |
| Probability | 0.199 | 0.216 | 0.000 | 0.000 | 0.079 |
| Observations | 38 | 38 | 38 | 38 | 38 |
| Variables | KPSS | PP | ||
|---|---|---|---|---|
| Level | Δ | Level | Δ | |
| LOCAP | 0.073 | 0.431 * | −2.954 | −7.974 * |
| GDP | 0.203 | 0.262 * | −1.725 | −4.288 * |
| NREN | 0.254 * | 0.024 | −3.673 ** | −5.650 * |
| GLO | 0.097 | 0.726 * | −1.975 | −5.029 * |
| TEC | 0.162 | 0.199 ** | −2.359 | −4.155 * |
| I(0) | I(1) | |
|---|---|---|
| LOCAP | −5.366 (2006) | −7.175 * (2009) |
| GDP | −3.582 (1990) | −5.980 * (2009) |
| NREN | −4.964 (2005) ** | −5.429 ** (1999) |
| GLO | −3.664 (2006) | −5.925 * (1993) |
| TEC | −4.206 (1990) | −6.770 * (2001) |
| F-Statistic | 7.947 * | |||||
| T-Statistic | −6.936 * | |||||
| Kripfganz and Schneider Critical Values | ||||||
| 1% | 5% | 10% | ||||
| LB | HB | LB | HB | LB | HB | |
| F-statistic | 3.74 | 5.06 | 2.86 | 4.01 | 2.45 | 3.52 |
| T-statistic | −3.43 | −4.6 | −2.86 | −3.99 | −2.57 | −3.66 |
| Diagnostic Check | ||||||
| χ2 Normality | 1.206 (0.547) | |||||
| χ2 LM | 0.490 (0.621) | |||||
| χ2 Heteroscedasticity | 0.716 (0.742) | |||||
| χ2 Ramsey | 1.931 (0.176) | |||||
| Variable | Coefficients | T-Statistics |
|---|---|---|
| GDP | −1.592 ** | −2.839 |
| NREN | −0.187 ** | −2.407 |
| GLO | 1.481 * | 3.154 |
| TEC | 0.169 *** | 2.060 |
| ΔGDP | −1.857 * | −4.005 |
| ΔNREN | −0.187 * | −3.066 |
| ΔGLO | 1.481 * | 4.488 |
| ΔTEC | −0.270 * | −3.672 |
| ECT(−1) | −0.572 * | −6.936 |
Publisher’s Note: MDPI stays neutral with regard to jurisdictional claims in published maps and institutional affiliations. |
© 2022 by the authors. Licensee MDPI, Basel, Switzerland. This article is an open access article distributed under the terms and conditions of the Creative Commons Attribution (CC BY) license (https://creativecommons.org/licenses/by/4.0/).
Share and Cite
Awosusi, A.A.; Kutlay, K.; Altuntaş, M.; Khodjiev, B.; Agyekum, E.B.; Shouran, M.; Elgbaily, M.; Kamel, S. A Roadmap toward Achieving Sustainable Environment: Evaluating the Impact of Technological Innovation and Globalization on Load Capacity Factor. Int. J. Environ. Res. Public Health 2022, 19, 3288. https://doi.org/10.3390/ijerph19063288
Awosusi AA, Kutlay K, Altuntaş M, Khodjiev B, Agyekum EB, Shouran M, Elgbaily M, Kamel S. A Roadmap toward Achieving Sustainable Environment: Evaluating the Impact of Technological Innovation and Globalization on Load Capacity Factor. International Journal of Environmental Research and Public Health. 2022; 19(6):3288. https://doi.org/10.3390/ijerph19063288
Chicago/Turabian StyleAwosusi, Abraham Ayobamiji, Kaan Kutlay, Mehmet Altuntaş, Bakhtiyor Khodjiev, Ephraim Bonah Agyekum, Mokhtar Shouran, Mohamed Elgbaily, and Salah Kamel. 2022. "A Roadmap toward Achieving Sustainable Environment: Evaluating the Impact of Technological Innovation and Globalization on Load Capacity Factor" International Journal of Environmental Research and Public Health 19, no. 6: 3288. https://doi.org/10.3390/ijerph19063288
APA StyleAwosusi, A. A., Kutlay, K., Altuntaş, M., Khodjiev, B., Agyekum, E. B., Shouran, M., Elgbaily, M., & Kamel, S. (2022). A Roadmap toward Achieving Sustainable Environment: Evaluating the Impact of Technological Innovation and Globalization on Load Capacity Factor. International Journal of Environmental Research and Public Health, 19(6), 3288. https://doi.org/10.3390/ijerph19063288