Article

The Impact of COVID-19 Related Changes on Air Quality in Birmingham, Alabama, United States

1
School of Health Professions, The University of Alabama at Birmingham, Birmingham, AL 35233, USA
2
Department of Environmental Health Sciences, School of Public Health, The University of Alabama at Birmingham, Birmingham, AL 35233, USA
*
Author to whom correspondence should be addressed.
Int. J. Environ. Res. Public Health 2022, 19(6), 3168; https://doi.org/10.3390/ijerph19063168
Submission received: 12 February 2022 / Revised: 26 February 2022 / Accepted: 28 February 2022 / Published: 8 March 2022
(This article belongs to the Topic Indoor and Outdoor Air Quality in the Era of COVID-19)

Abstract

:
Air pollution is responsible for a wide range of health effects in exposed populations. Variations in local air pollution can affect local population health outcomes. The strict regulations imposed during the peak of the COVID-19 pandemic (‘lockdowns’) resulted in a unique situation where human mobility was limited significantly, resulting in improved air quality in several major cities. The main goal of this study was to investigate if lockdowns during the COVID-19 pandemic significantly impacted air quality in Birmingham, Alabama—a city with a history of high air pollution levels—with a focus on PM2.5 (Particulate Matter with an aerodynamic diameter ≤2.5 µm) and NO2 (Nitrogen dioxide). Daily air pollutant and traffic data were obtained for the Birmingham Metropolitan Area for the period January to October 2020, and previous years. Mean PM2.5 and NO2 concentrations and traffic volumes during the official city/state lockdown period (24 March to 30 April 2020) were compared to pre- and post-lockdown means. The mean PM2.5 and NO2 concentrations during the lockdown did not significantly differ from that of the pre- or post-lockdown periods. However, NO2 significantly decreased even after the lockdown order was removed, with the mean decreasing significantly compared to pre-lockdown and lockdown periods. Both PM2.5 and NO2 annual means in 2020 were significantly lower than the annual means in 2019, indicating the occurrence of significant changes over the longer term that were not limited by defined lockdown periods. Traffic significantly increased after the lockdown order was removed but did not correlate with the two pollutants studied. Therefore, we conclude that the Stay at Home/lockdown regulations and other COVID-19 restrictions had an impact on the air quality of Birmingham Alabama; although these lockdown impacts varied for each pollutant and were not limited only by the official lockdown dates/periods.

1. Introduction

Air pollution is responsible for causing a range of adverse health effects including, respiratory and cardiovascular diseases, chronic airway diseases, lung cancer, and increased mortality [1,2,3,4,5]. The World Health Organization estimates that air pollution related diseases are responsible for over 7 million deaths every year, of which 4.2 million deaths are attributed to outdoor air pollution [5]. The six most common criteria pollutants that are associated with most of these adverse health effects include Particulate Matter, Nitrogen Dioxide (NO2), Carbon Monoxide (CO), Sulfur dioxide (SO2), Ground-level Ozone (O3), and Lead (Pb) [6]. Particles with an aerodynamic diameter ≤ 2.5 µm are particularly harmful as they can penetrate deeper into the lungs, and therefore, is important in the study of air pollution related health outcomes. The gaseous pollutants are also associated with a range of harmful health effects impacting the respiratory system, mainly as irritants. In the environment, they can act as precursors in the formation of secondary pollutants including Ozone and secondary particles [7].
Various chemical constituents released from diverse sources combine to form the PM2.5 pollutant components of a city/region. Therefore, the study of PM2.5 and related public health outcomes can be complex. Source apportionment studies have demonstrated that the major sources of PM2.5 in US cities were metal industries, crustal/solid particles, Motor Vehicles, Steel Industries, Coal Combustion, Salt Particles, and Biomass burning [7]. The primary source of NO2 emission was found to be vehicular traffic, although industrial processes can also be a significant contributor. SO2 was most correlated to Oil/Diesel and coal combustion. While stationary and mobile anthropogenic sources (industrial and traffic emissions) can contribute significantly to air pollution in cities [8], natural phenomena, such as dust storms and smog events can also significantly alter air quality [9]. Emissions from local stationary and mobile sources significantly impact local air quality; changes in traffic volumes, variations in emissions from industries and power plants, and weather patterns contribute to short- and long-term air quality variations. For example, during the Beijing Olympics in 2008, authorities in Beijing implemented restrictions on industry operations and changed traffic plans, resulting in improved air quality over the short term [10]. Studies have shown that exposure to such varying air quality impacts health outcomes, and improved air quality can result in reductions in adverse outcomes [11,12,13,14]. While exposure to short-term elevated levels of PM can result in lowered lung function, subsequent improvement in air quality has been shown to be associated with improvements in lung function and reduction in respiratory symptoms (i.e., possible ‘recovery’) [15].
In March 2020, a major change in human mobility was caused by the restrictions imposed to control the Severe Acute Respiratory Syndrome Coronavirus 2 (SARS-CoV-2), or the COVID-19 pandemic [16,17]. In order to contain the spread of the virus, many states in the U.S. and countries around the world-imposed restrictions and guidelines, such as lockdowns, social distancing rules, travel bans, and limited business operations. This in turn caused direct and indirect effects on air quality across several countries, including the U.S. [18]. Current findings demonstrate that, overall, the pandemic resulted in improved air quality in most major cities. Major cities with populations of more than 1 million, such as Los Angeles, Chicago, Phoenix, Philadelphia, San Antonio, San Jose, New York, and San Diego saw PM2.5 concentrations decrease significantly compared to the previous year’s values during the same period [19,20], while some cities had drops in concentrations compared to previous months [18,21,22,23]. Data collected from over 2000 monitoring sites located in USA, Canada and Mexico demonstrated that gaseous pollutants, such as NO2 had significantly decreased in April 2020 in comparison to the month of April in the past five years [24]. This decrease in NO2 was directly linked to locations that witnessed a reduction in mobility. In contrast, PM2.5 concentrations across most sites in this study witnessed no significant change but rather, saw an increase in some of the sites [24]. Studies in other parts of the world have also demonstrated mixed results. Despite the expectation of a significant reduction in air pollutants due to the lockdowns, not all urban areas experienced reduced levels. During the initial period of the lockdown in China (January–February 2020), some regions saw an increase in PM2.5. Levels of PM2.5 in Northern China rose compared to other regions, possibly due to severe haze events. During this time, a mean increase of 30.6 µg/m3 was reported compared to the previous year [25]. London and Paris both reported increased levels of PM2.5 during the quarantine period [26]. During the period from 24 March to 31 May 2020, in Delhi, India, it was found that PM2.5, NO2 and CO had reduced by 47%, 68% and 58%, respectively, and a significant increase in O3 when compared to 2019 [27]. North India as a whole experienced a 34% decrease in PM2.5 concentration compared to 2019, however, O3 concentrations increased [23]. Ozone in New Delhi increased temporarily (during April–May) compared to the previous lockdown phase. Some studies concluded that air quality had improved during the lockdown period with each pollutant varying in its concentration in relation to the lockdown irrespective of the geographical and climatic conditions [28]. However, when studying the impact of lockdowns on air quality, factors, such as seasonal changes and the impact of meteorological events on air pollution have to be considered [29].
Historically, Birmingham—the largest and most populous city in Alabama, was known to have one of the worst air quality levels in the country [30]. The major contributors were mines, industrial mills, and factories that manufactured iron ore. Early studies during the peak of the manufacturing boom in Alabama pointed out the importance of industrial emissions on Birmingham’s air quality, which identified domestic, transportation, commercial, and industrial sources as predominant sources [31]. A study conducted in 1956 during and after the steel strike in Birmingham, AL showed the effect of the industries on particulate matter [32]. The average level of suspended particulate matter increased significantly once the steel industries resumed production. Elevated levels of air pollution in Birmingham were shown to be associated with increased daily mortality and increased hospital admissions for the elderly [33,34]. However, in recent times air quality in Birmingham has improved dramatically, although still among the 15 most polluted cities in the US (based on PM levels from 2016 to 2018) as per a recent ‘State of the Air’ report by the American Lung Association [35]. The metropolitan Birmingham area ranked 14th in the nation for year-round PM pollution, however, was the best ever from the years 2016–2018, and met the United States Environmental Protection Agency (US EPA) standards during this period. Notwithstanding this drastic change and improvement in air quality, recent studies on criteria pollutant concentrations in Birmingham, AL are very limited. Importantly, at the time of the submission of this manuscript, we are not aware of any peer-reviewed studies that have researched the change in levels of criteria pollutants in Birmingham, AL. Given the history of air pollution and being the largest city in Alabama, we believe a detailed study of how COVID-19 related changes impacted air quality in the city is important and will contribute to other studies investigating health impacts.
Therefore, the primary objective of this study was to investigate the changes in selected criteria air pollutant levels in the Birmingham Metropolitan Area during the COVID-19 pandemic period, in comparison to ‘Business as usual’, i.e., previous months and years prior to the pandemic. The study primarily focused on PM2.5 and NO2 levels as they were considered markers of mobile source air pollution, which was impacted by the restrictions.

2. Materials and Methods

Our study utilized regional-level air pollutant and traffic data to investigate if air pollutant levels were significantly impacted during the government ‘Stay at Home Order’ (i.e., COVID-19 lockdown) period in Birmingham, Alabama, USA. Primary air pollutants of focus were PM2.5 (Particulate matter with diameter less than 2.5 µm) and NO2 (Nitrogen dioxide), although data were collected and limited analyses were conducted for other criteria pollutants including Ozone (O3), Carbon monoxide (CO) and Sulfur dioxide (SO2). The official ‘lockdown’/Stay at Home Order period for the city of Birmingham (AL) went into effect on the 24 March 2020 at 12.00 PM [36], followed by a state-wide lockdown (Alabama) from 4 April to 30 April 2020 [37,38]. However, some restrictions remained in effect until mid-May, and businesses were permitted to open for regular operation only on 22 May 2020. For analyses in this study, we defined pre-lockdown, lockdown and post-lockdown periods as 17 February to 24 March, 25 March to 30 April and 1 May to 6 June, respectively.

2.1. Data Sources and Measurements

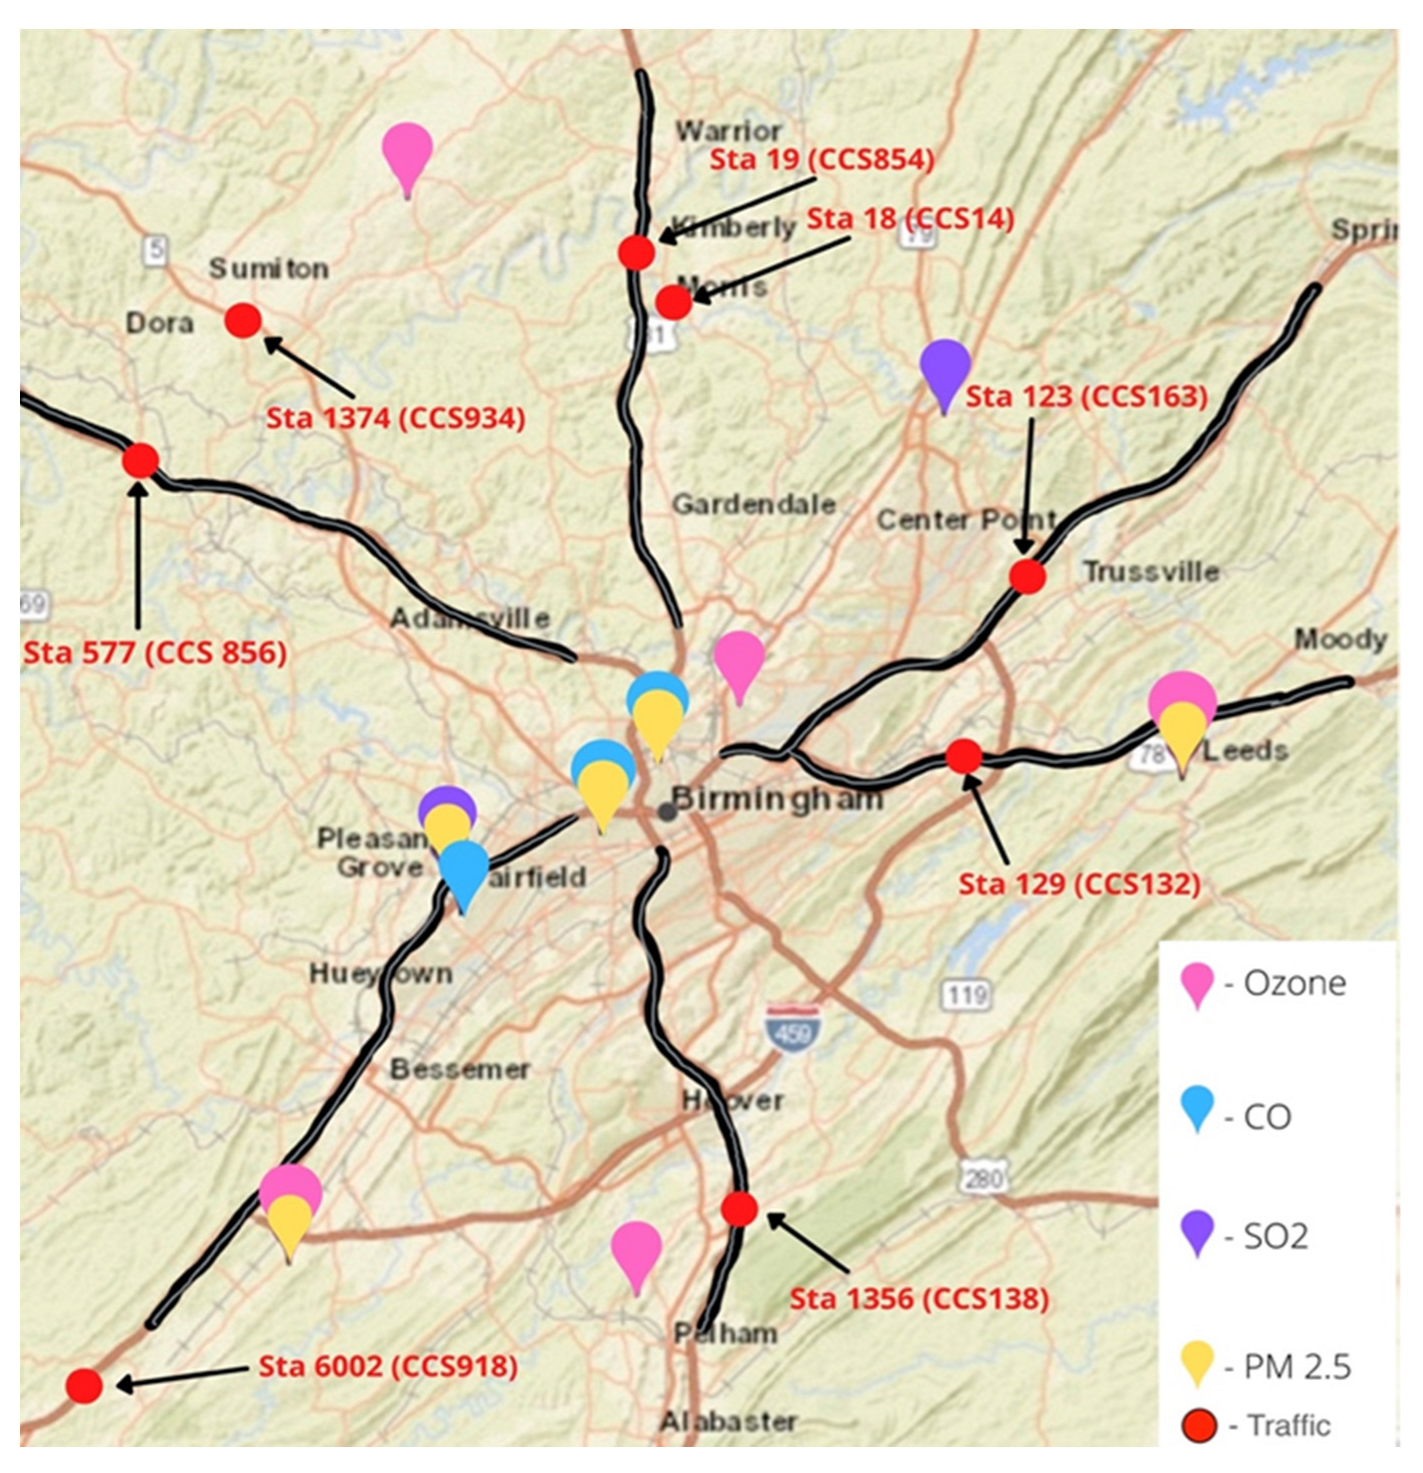
2.1.1. Air Quality Data Retrieval

Daily concentration data for selected criteria pollutants were obtained for the period January 2016 to October 2020, from US EPA, fixed air quality monitors via the EPA Air Quality System (AQS) database for Birmingham, Alabama. The EPA Air Quality System is a platform where air quality data is collected from around the country, and publicly available to download. Our study primarily evaluated PM2.5 and NO2 variations in the Birmingham Metropolitan Area located in Jefferson County, Alabama. Table 1 contains details on air pollutants, number of monitoring sites, and measurement metrics analyzed in this study, and Figure 1 shows the locations of the monitoring stations. Please see supplemental Table S1 for a list of all monitoring sites that data were obtained from, for the study.

2.1.2. Traffic Data Retrieval

The daily traffic data for Jefferson County, Birmingham was downloaded from the Alabama Department of Transportation (ALDOT) for 2019 and 2020. The data collected reflected the total amount of vehicles that entered and exited Jefferson County on a given day in 2019 and 2020. To estimate the traffic that entered and exited Jefferson County, data were obtained from traffic monitoring sites located (1) Along eight major highways/interstate routes where traffic enter/exit Birmingham and (2) from two sites closest to the respective central air monitors in Birmingham (Figure 1). The totals and averages of inbound and outbound traffic volumes were calculated and analyzed.

2.1.3. Data Processing

Some central monitor sites had up to three different monitors located in close proximity with the same site ID. In such cases, the average of these sub-station values was taken as the site’s concentration. If there was no traffic data provided for a given day, the average of the day before and after was used. If the traffic data was not provided for more than a week to a month, the average of the previous two months was used.

2.2. Statistical Analysis

Daily mean values of pollutants were used to calculate descriptive statistics including the mean monthly concentrations and Standard Deviations, (SD) with more detailed data and analyses focusing on PM2.5 and NO2. A General Linear Model Analysis of Variance (ANOVA) was employed to analyze the mean concentration differences between pre, during and post lockdown periods and monthly concentration differences between months in 2020. Tukey’s simultaneous tests were used to compare the differences in means post ANOVA. Student’s t-tests were used to compare each month’s concentration in 2020 with the corresponding months in 2019. A linear regression analysis was conducted to analyze the correlation between traffic volumes and PM2.5 and NO2 concentrations. A significance level of p ≤ 0.05 was considered for all analyses. Analyses were completed using the Minitab Version 19 statistical software (Minitab LLC, State College, PA, USA), which was also used to generate figures. Some figures were generated using Microsoft Excel version 16.16.27 (Microsoft, Redmond, WA, USA).

3. Results

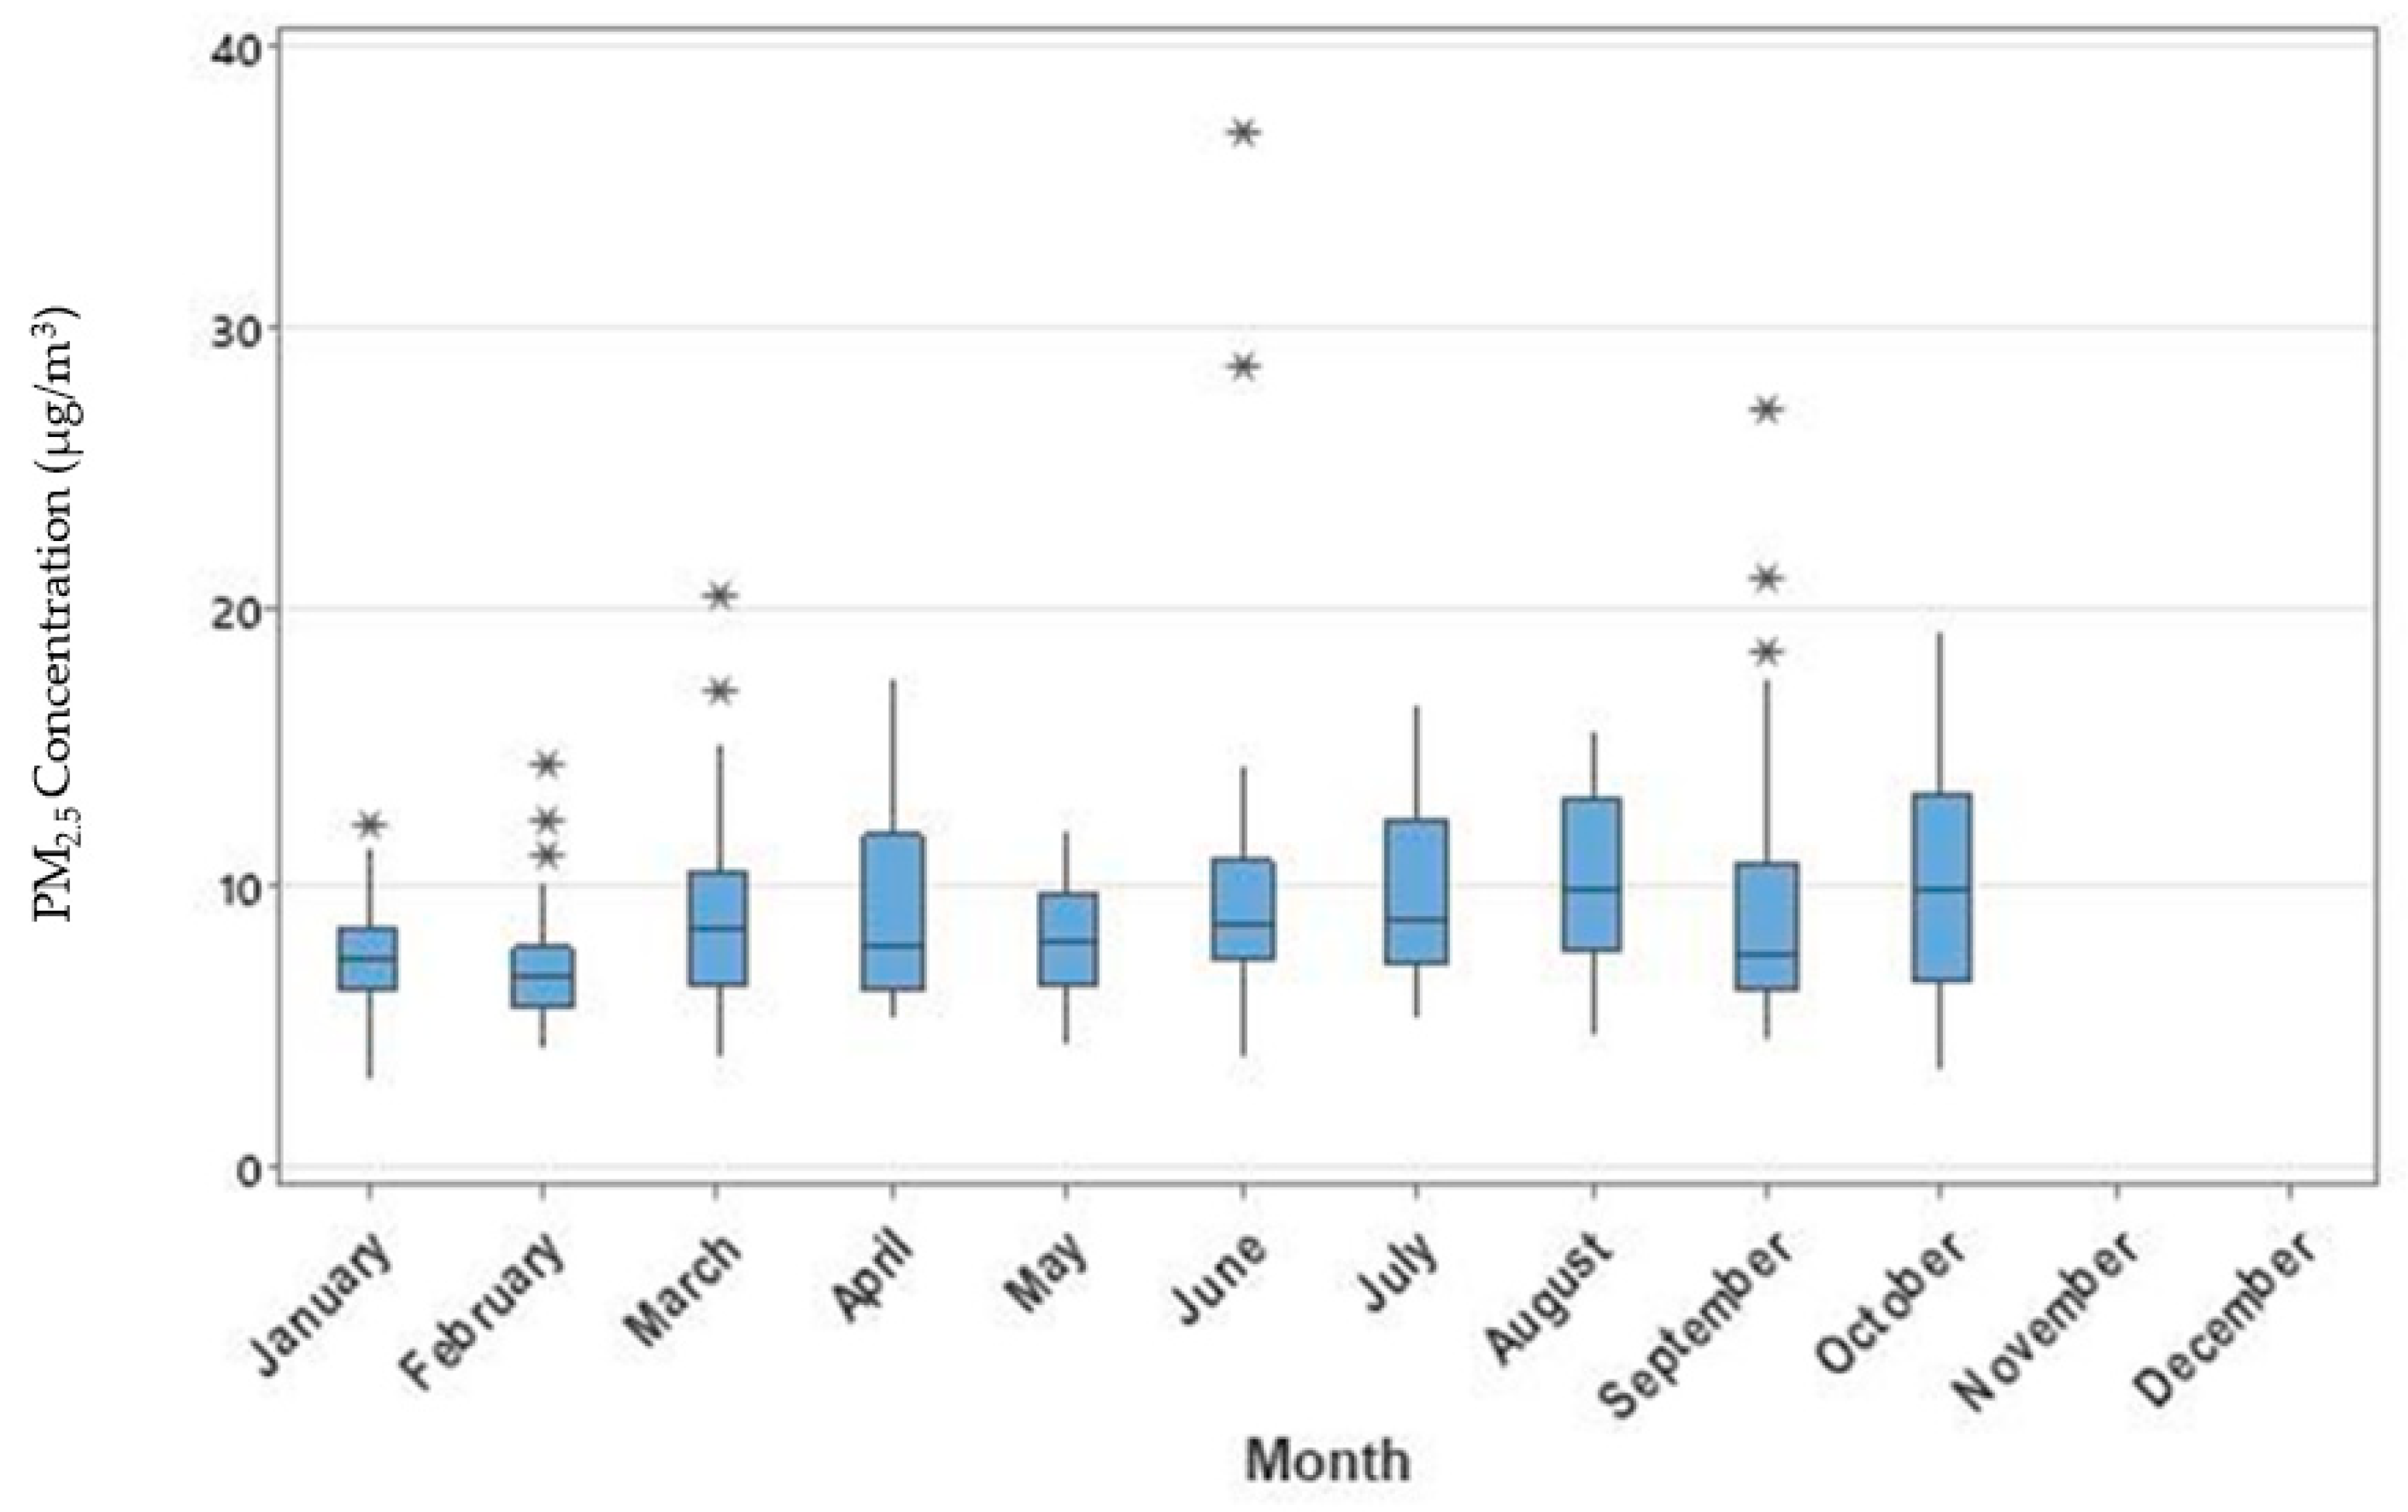
3.1. Descriptive Statistics

Descriptive statistics for each air pollutant, and traffic volumes, in 2019 and 2020 are shown in Table 2. For some of the pollutants, data were not available for the full year of 2019 or 2020 at the time they were collected, and therefore, the data used to generate the descriptive statistics for each pollutant spans to the latest date available at the time of data collection. In 2020, Birmingham experienced a dust storm from 26–28th June, which was considered an outlier for PM2.5 concentration statistics (the outlier values were over 4 times the mean and confirmed by an outlier test in Minitab). Mean PM2.5 concentrations with and without the outliers are reported.
Briefly, PM2.5 concentrations in 2020 during the study period (January to October) ranged from 3.1 to 36.9 µg/m3, while the mean PM2.5 concentration (including the outliers in June) for that year was 9.1 µg/m3 with a standard deviation of 3.6 µg/m3. When the outliers were removed, the mean PM2.5 concentration was 8.9 µg/m3 with a standard deviation of 3.4 µg/m3. For 2020, the NO2 data available ran from January to August from the two NO2 monitoring sites (North Birmingham and Arkadelphia), during which time the average NO2 concentration was 20.76 ppb with a standard deviation of 8.29 ppb. NO2 concentrations during this period ranged from 5.45 to 44.15 ppb. Traffic volumes during the study period varied widely from a minimum of 98,484 to 494,507 vehicles, with a mean and standard deviation (SD) of 347,888 and 70,922, respectively.
We also calculated means and SDs during the lockdown period (38 days), pre and post lockdown periods (38 days before the lockdown and 38 days after the lockdown was lifted, respectively) including the post lockdown period after businesses opened, which are shown in Table 3.

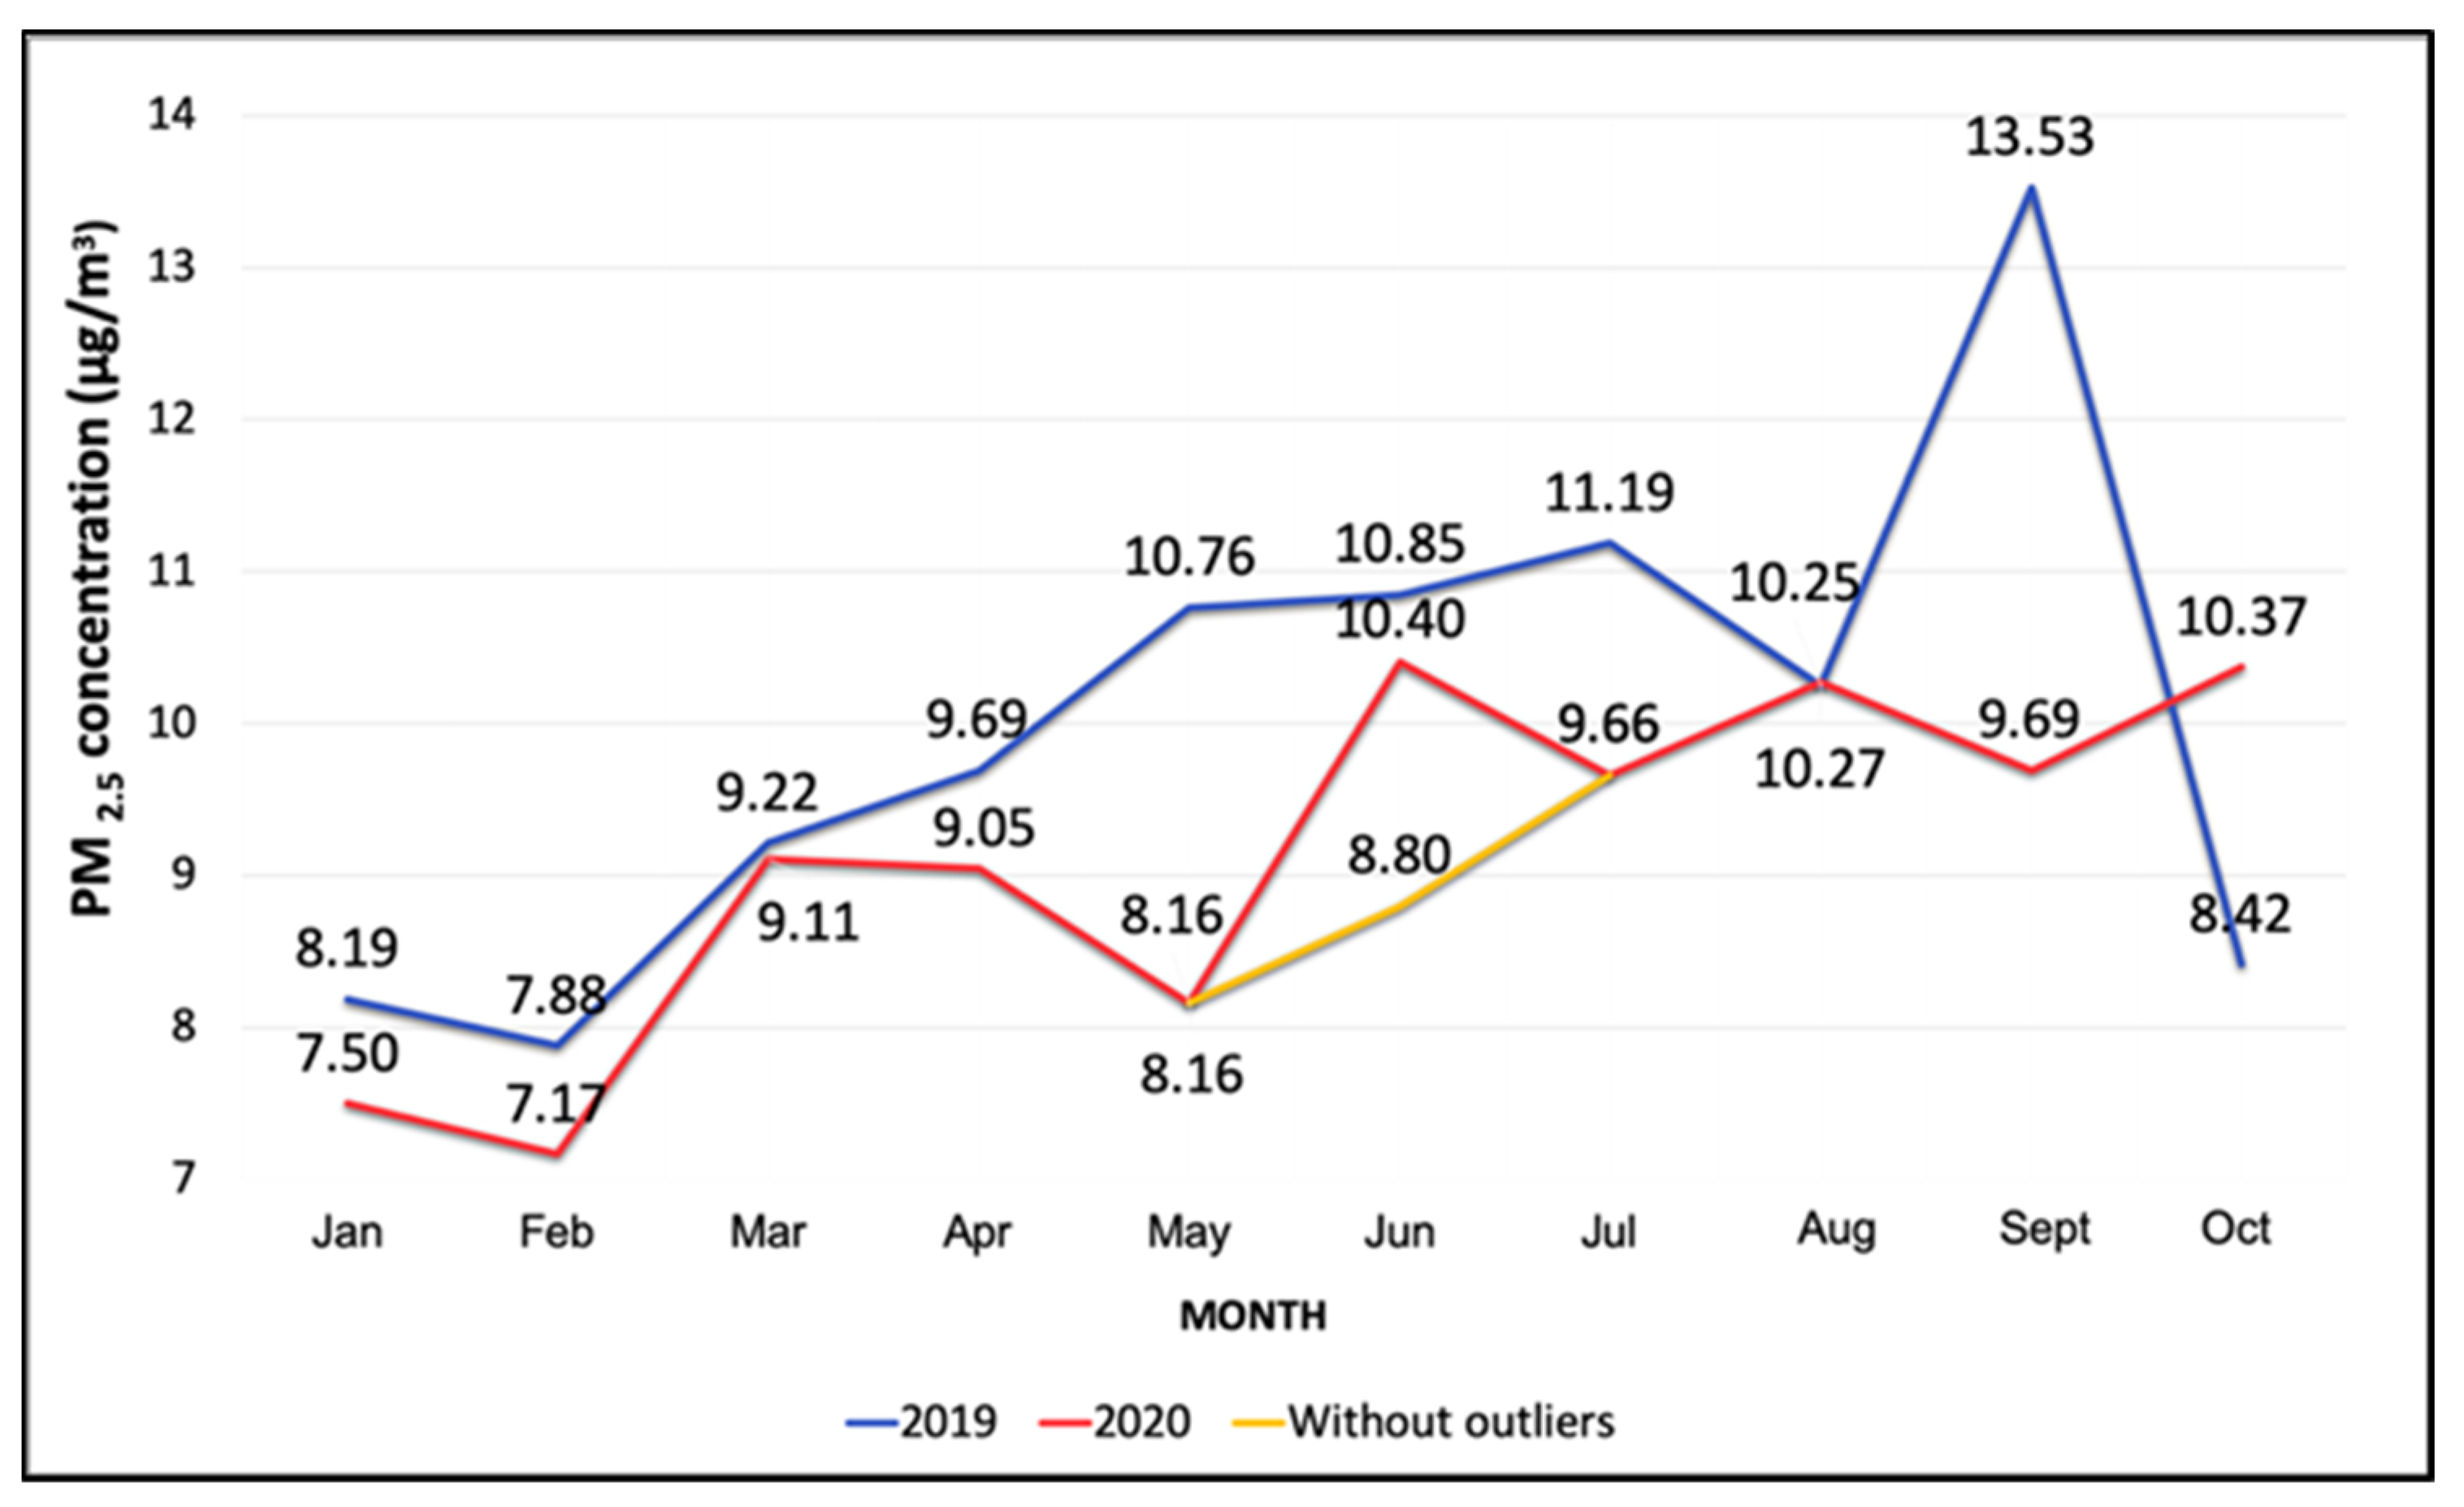
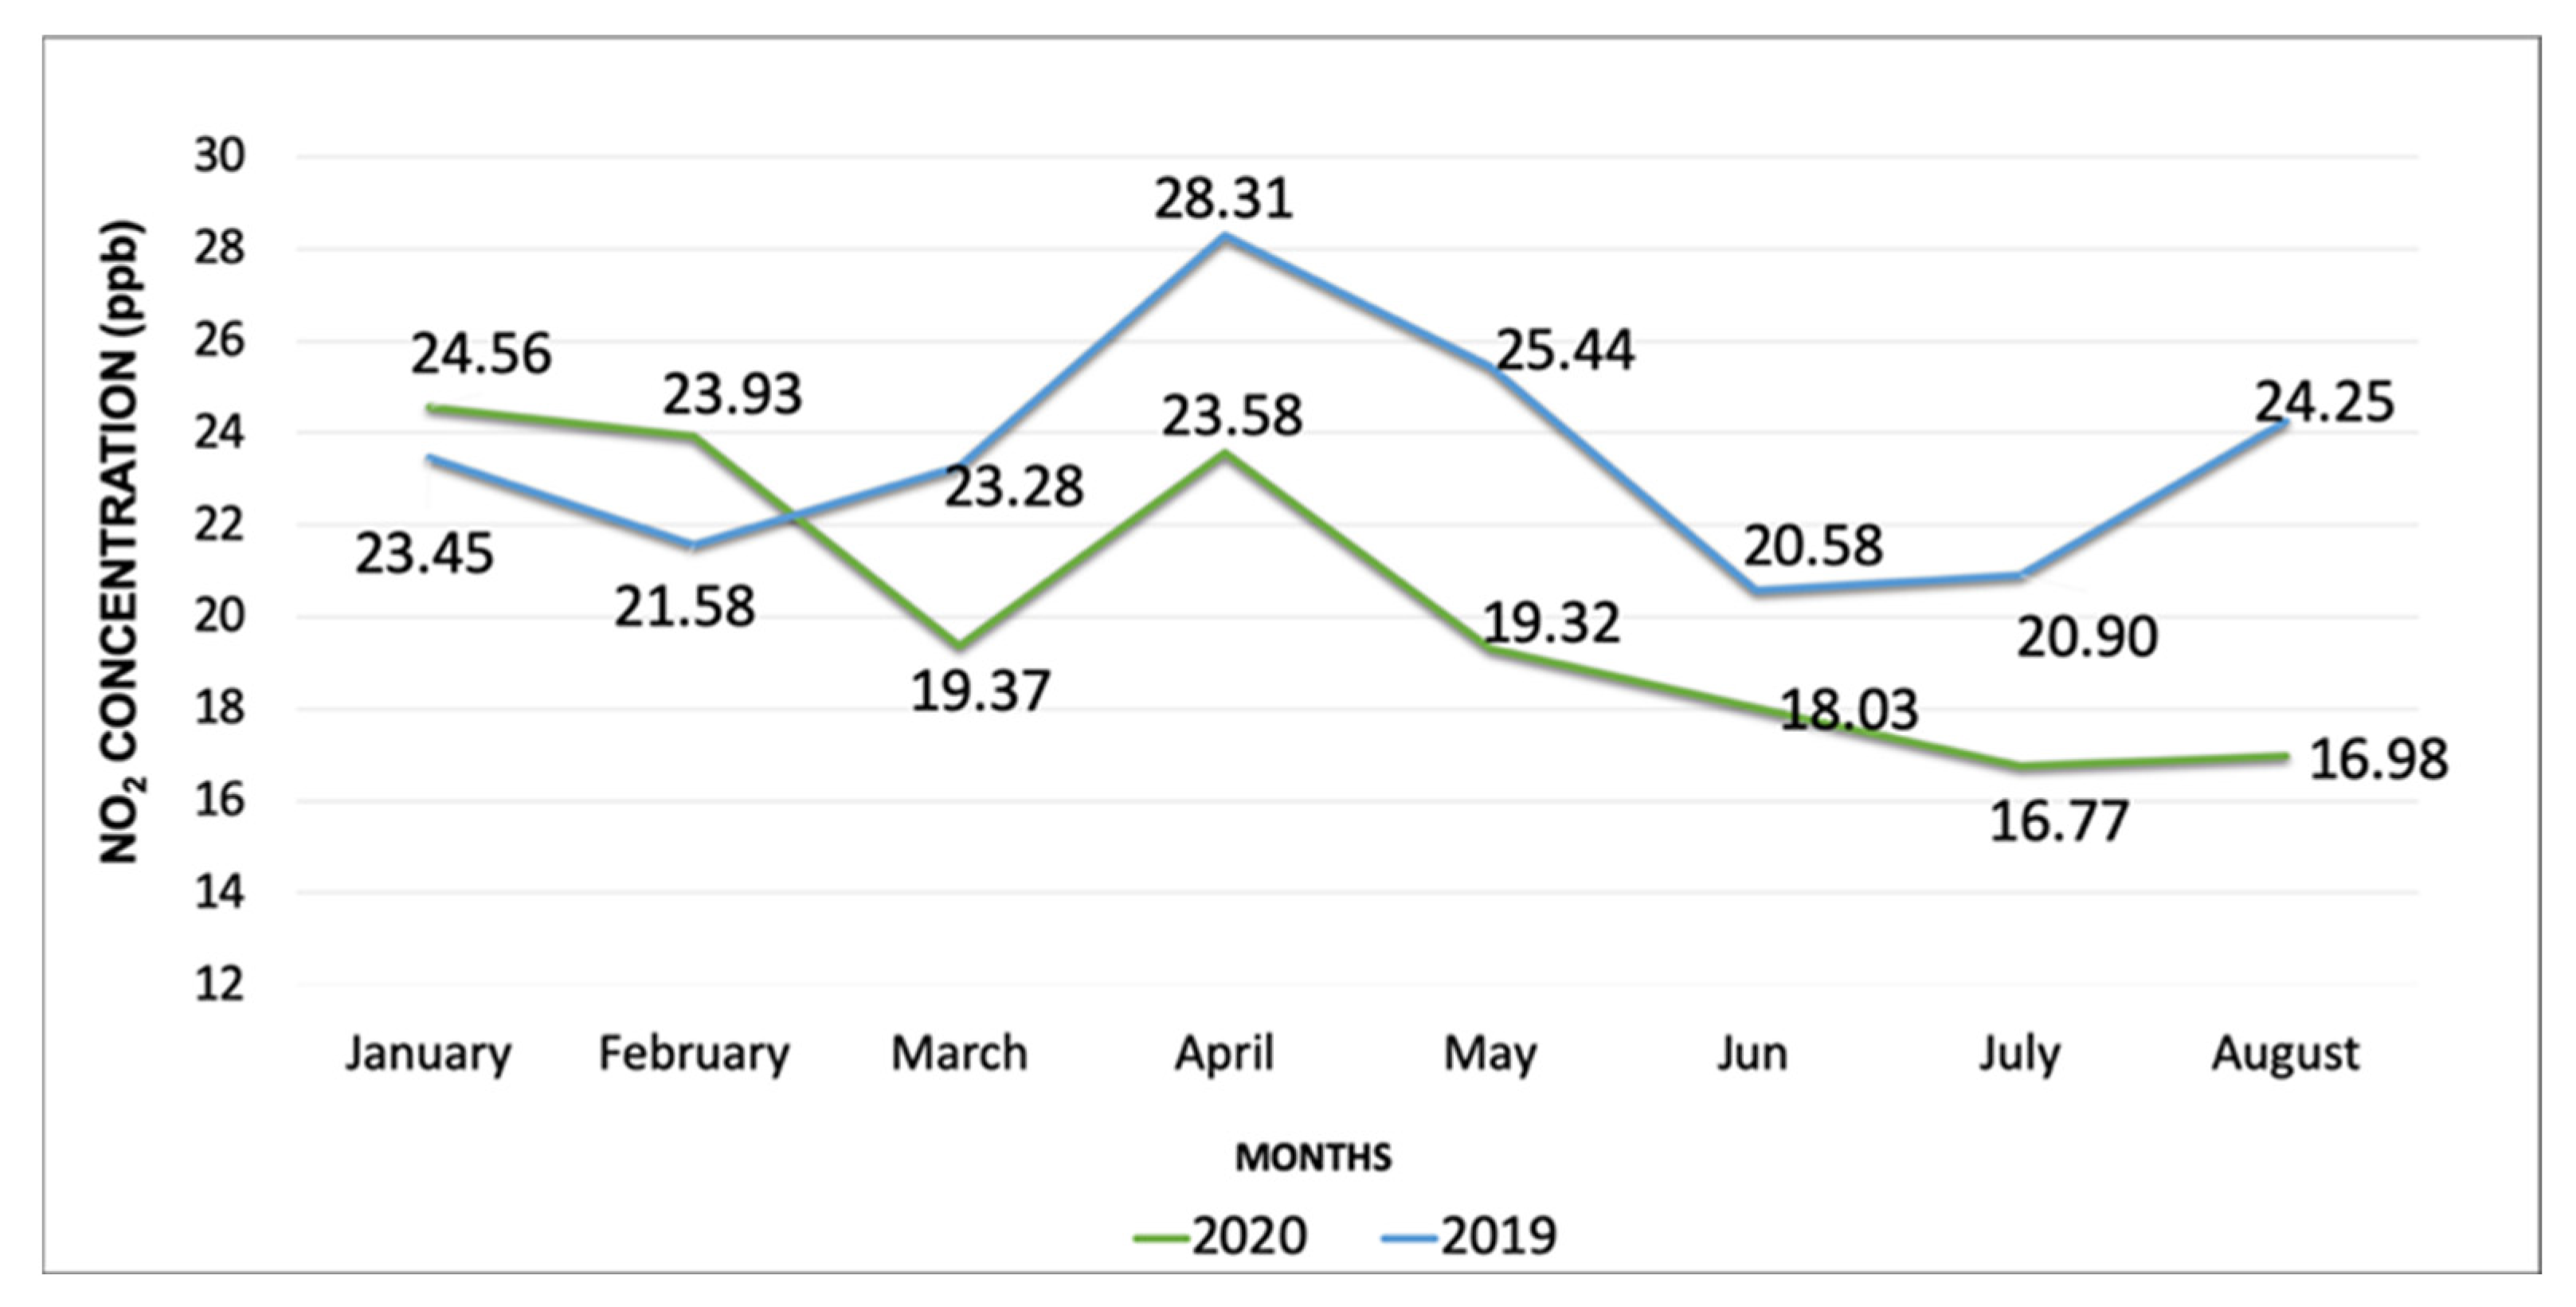
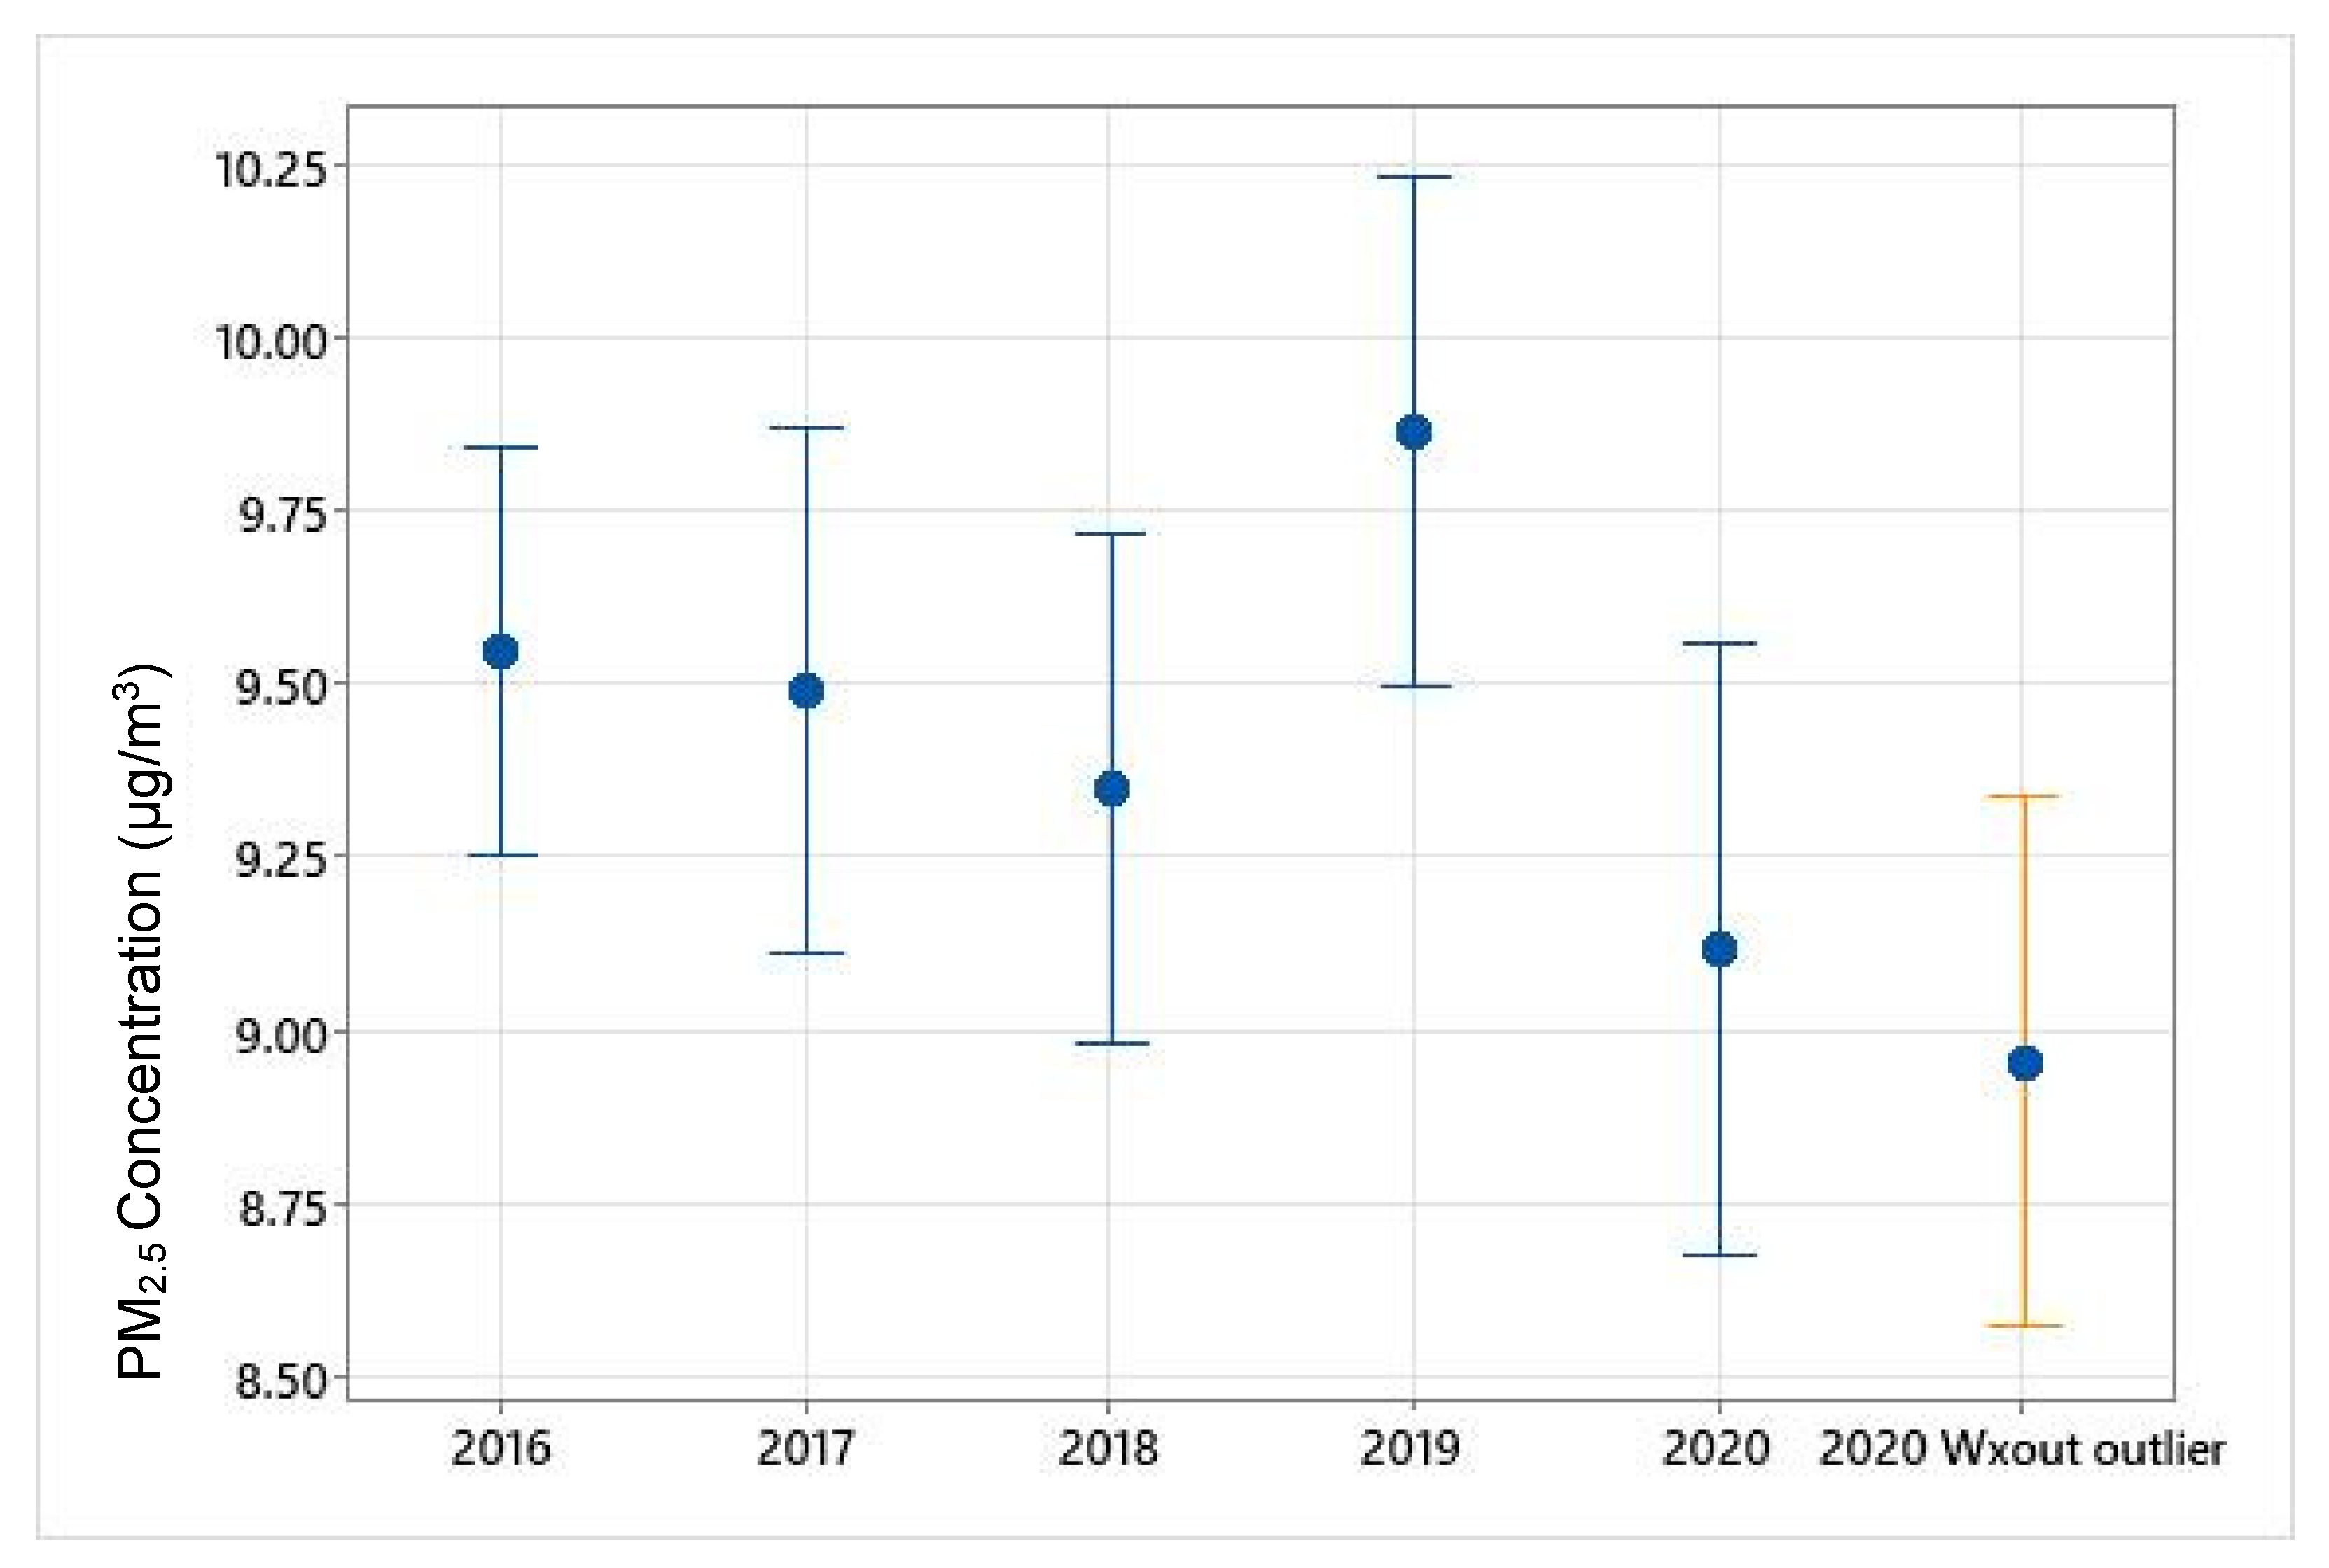
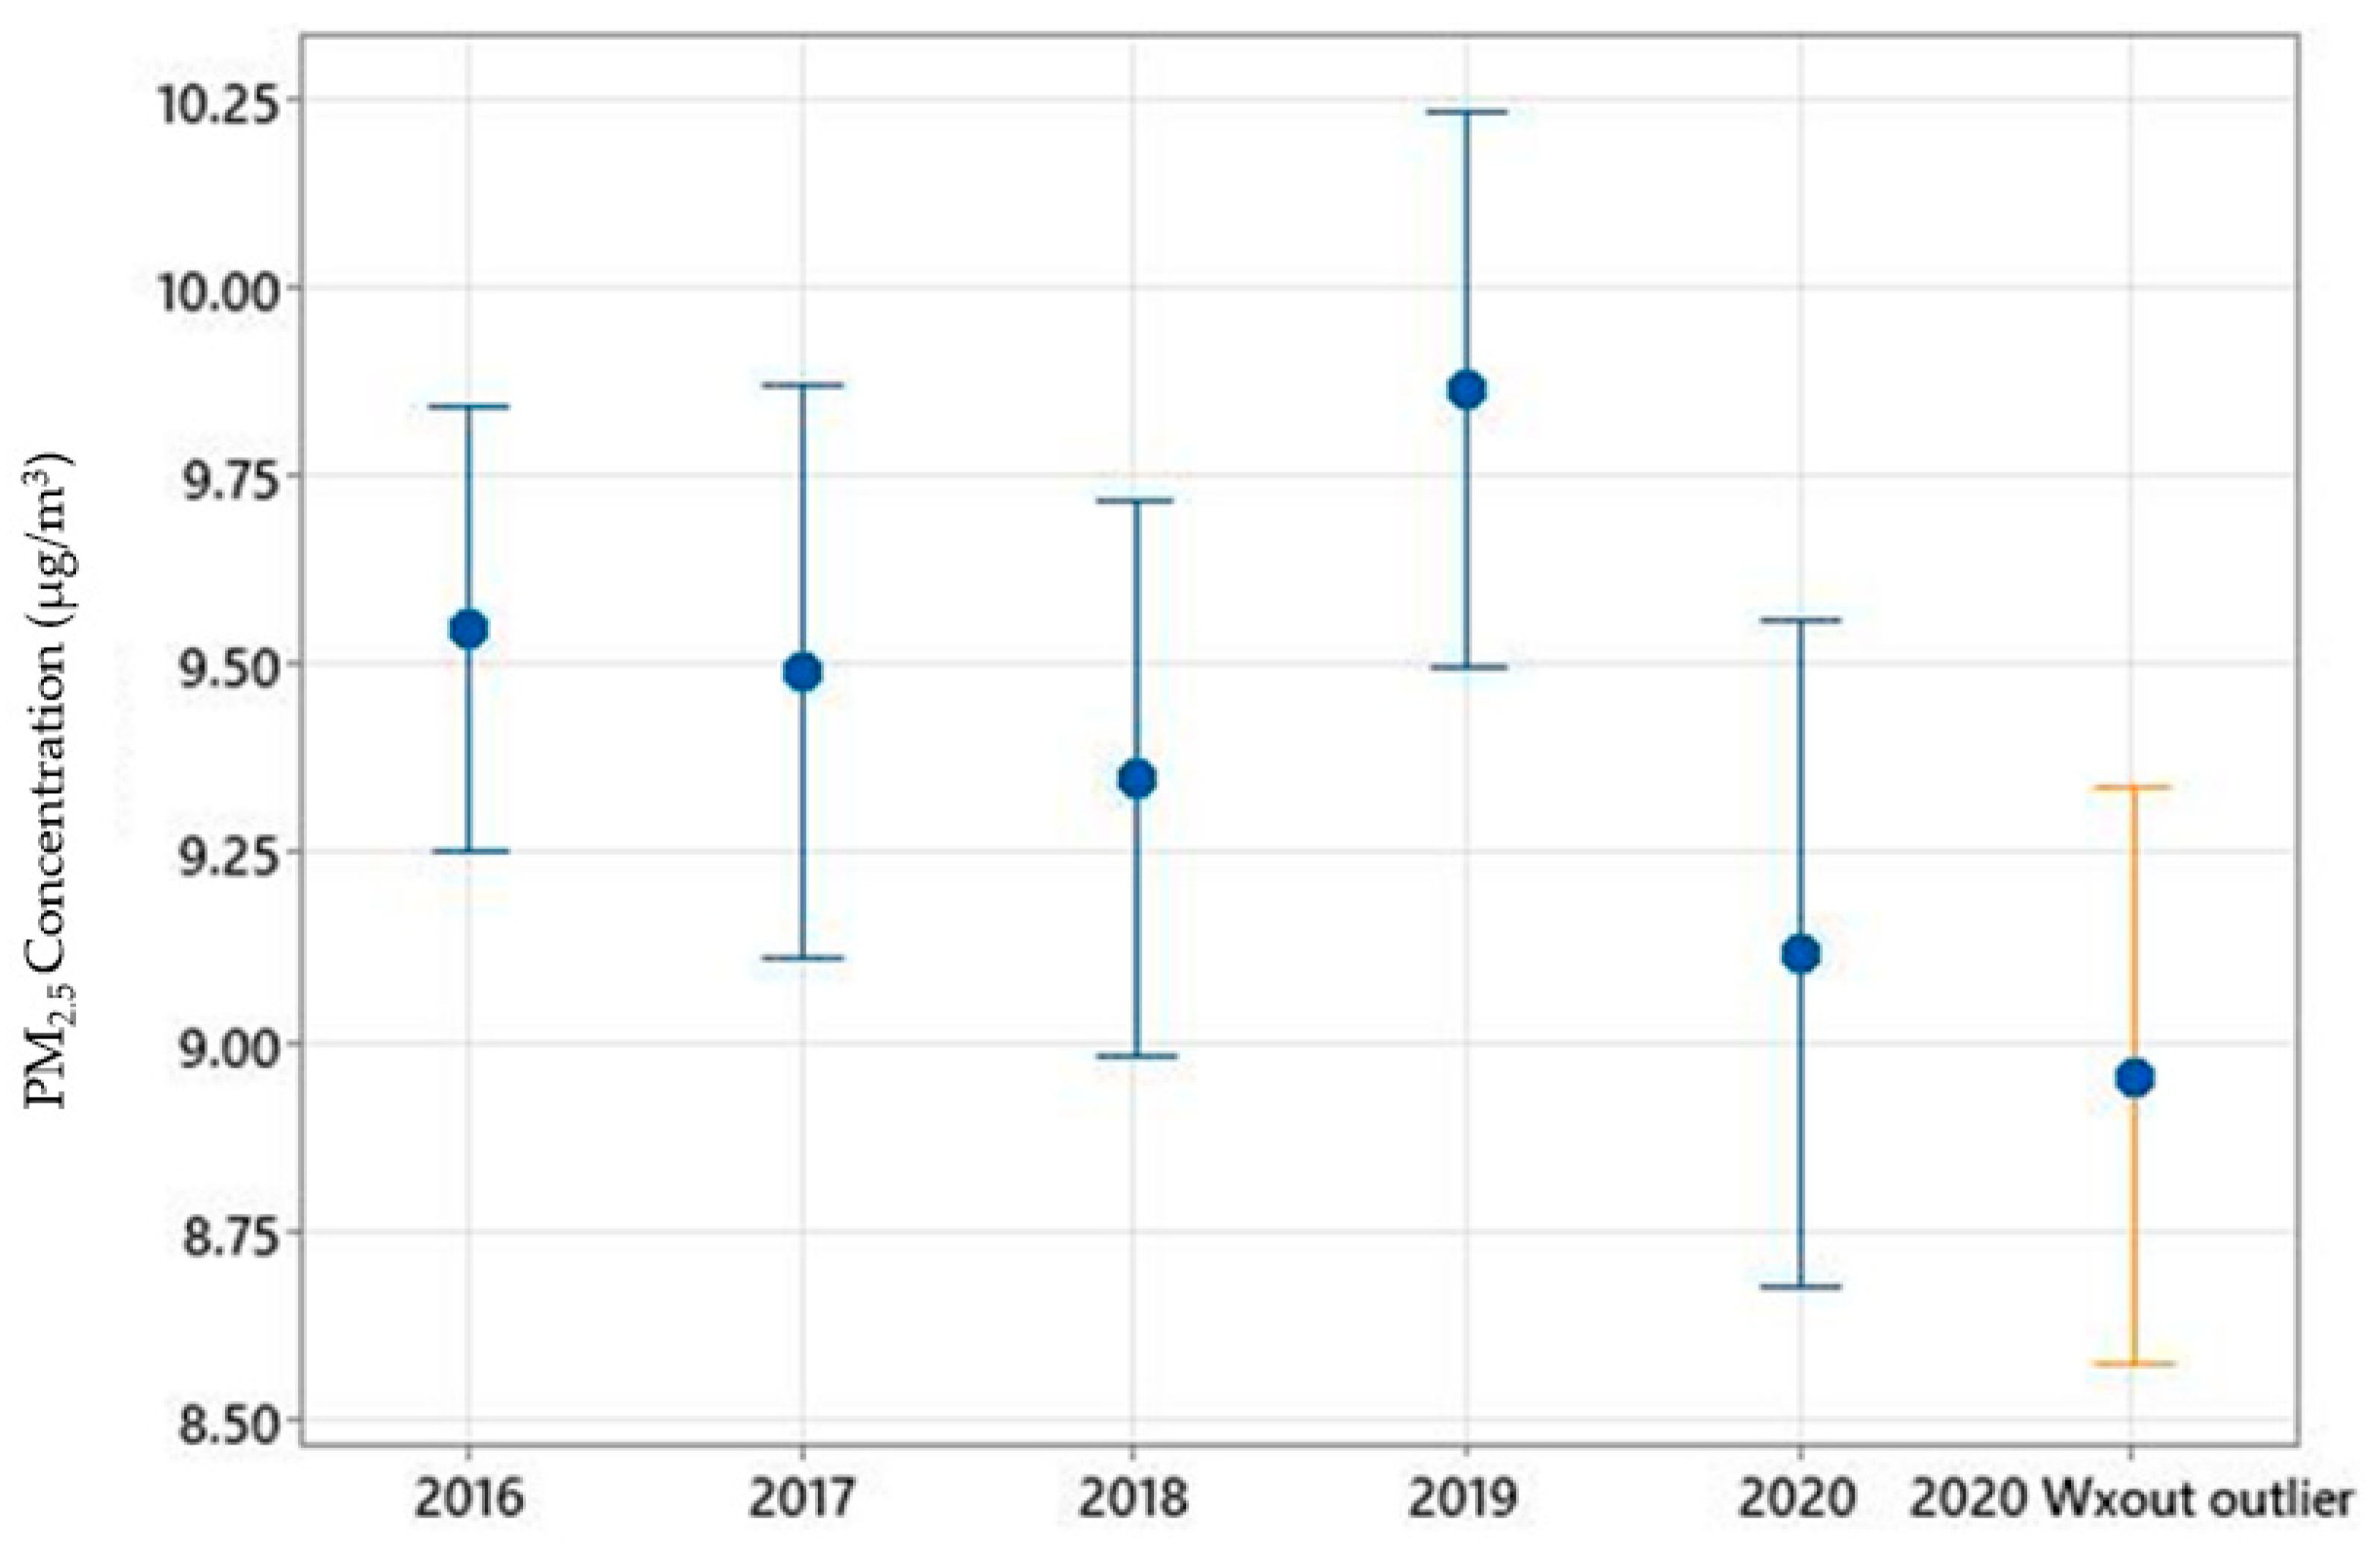
3.2. Variations in PM2.5 and NO2 Concentrations during the Study Period and Comparisons with Previous Years

Monthly variations in PM2.5 concentrations during the study period (January–October 2020) are shown in Figure 2 and Figure 3. PM2.5 concentrations gradually decreased from March through May, however, increased throughout the rest of the months until October. The boxplot (Figure 2) demonstrates the variations within each month and outliers. NO2 concentrations saw a temporary increase in April compared to March, however, monthly mean values continued to decline from April to August 2020 (Figure 4). Overall, the mean PM2.5 and NO2 concentrations in 2020 were statistically significantly lower compared to the mean concentrations of these pollutants in 2019 (Figure 5 and Supplemental Figure S1, respectively). The mean PM2.5 concentration of 2020 was also the lowest compared to historical yearly averages from 2016 to 2019 (Figure 5). PM2.5 concentrations of 2019 and 2020 by month are shown in Supplemental Figure S2.

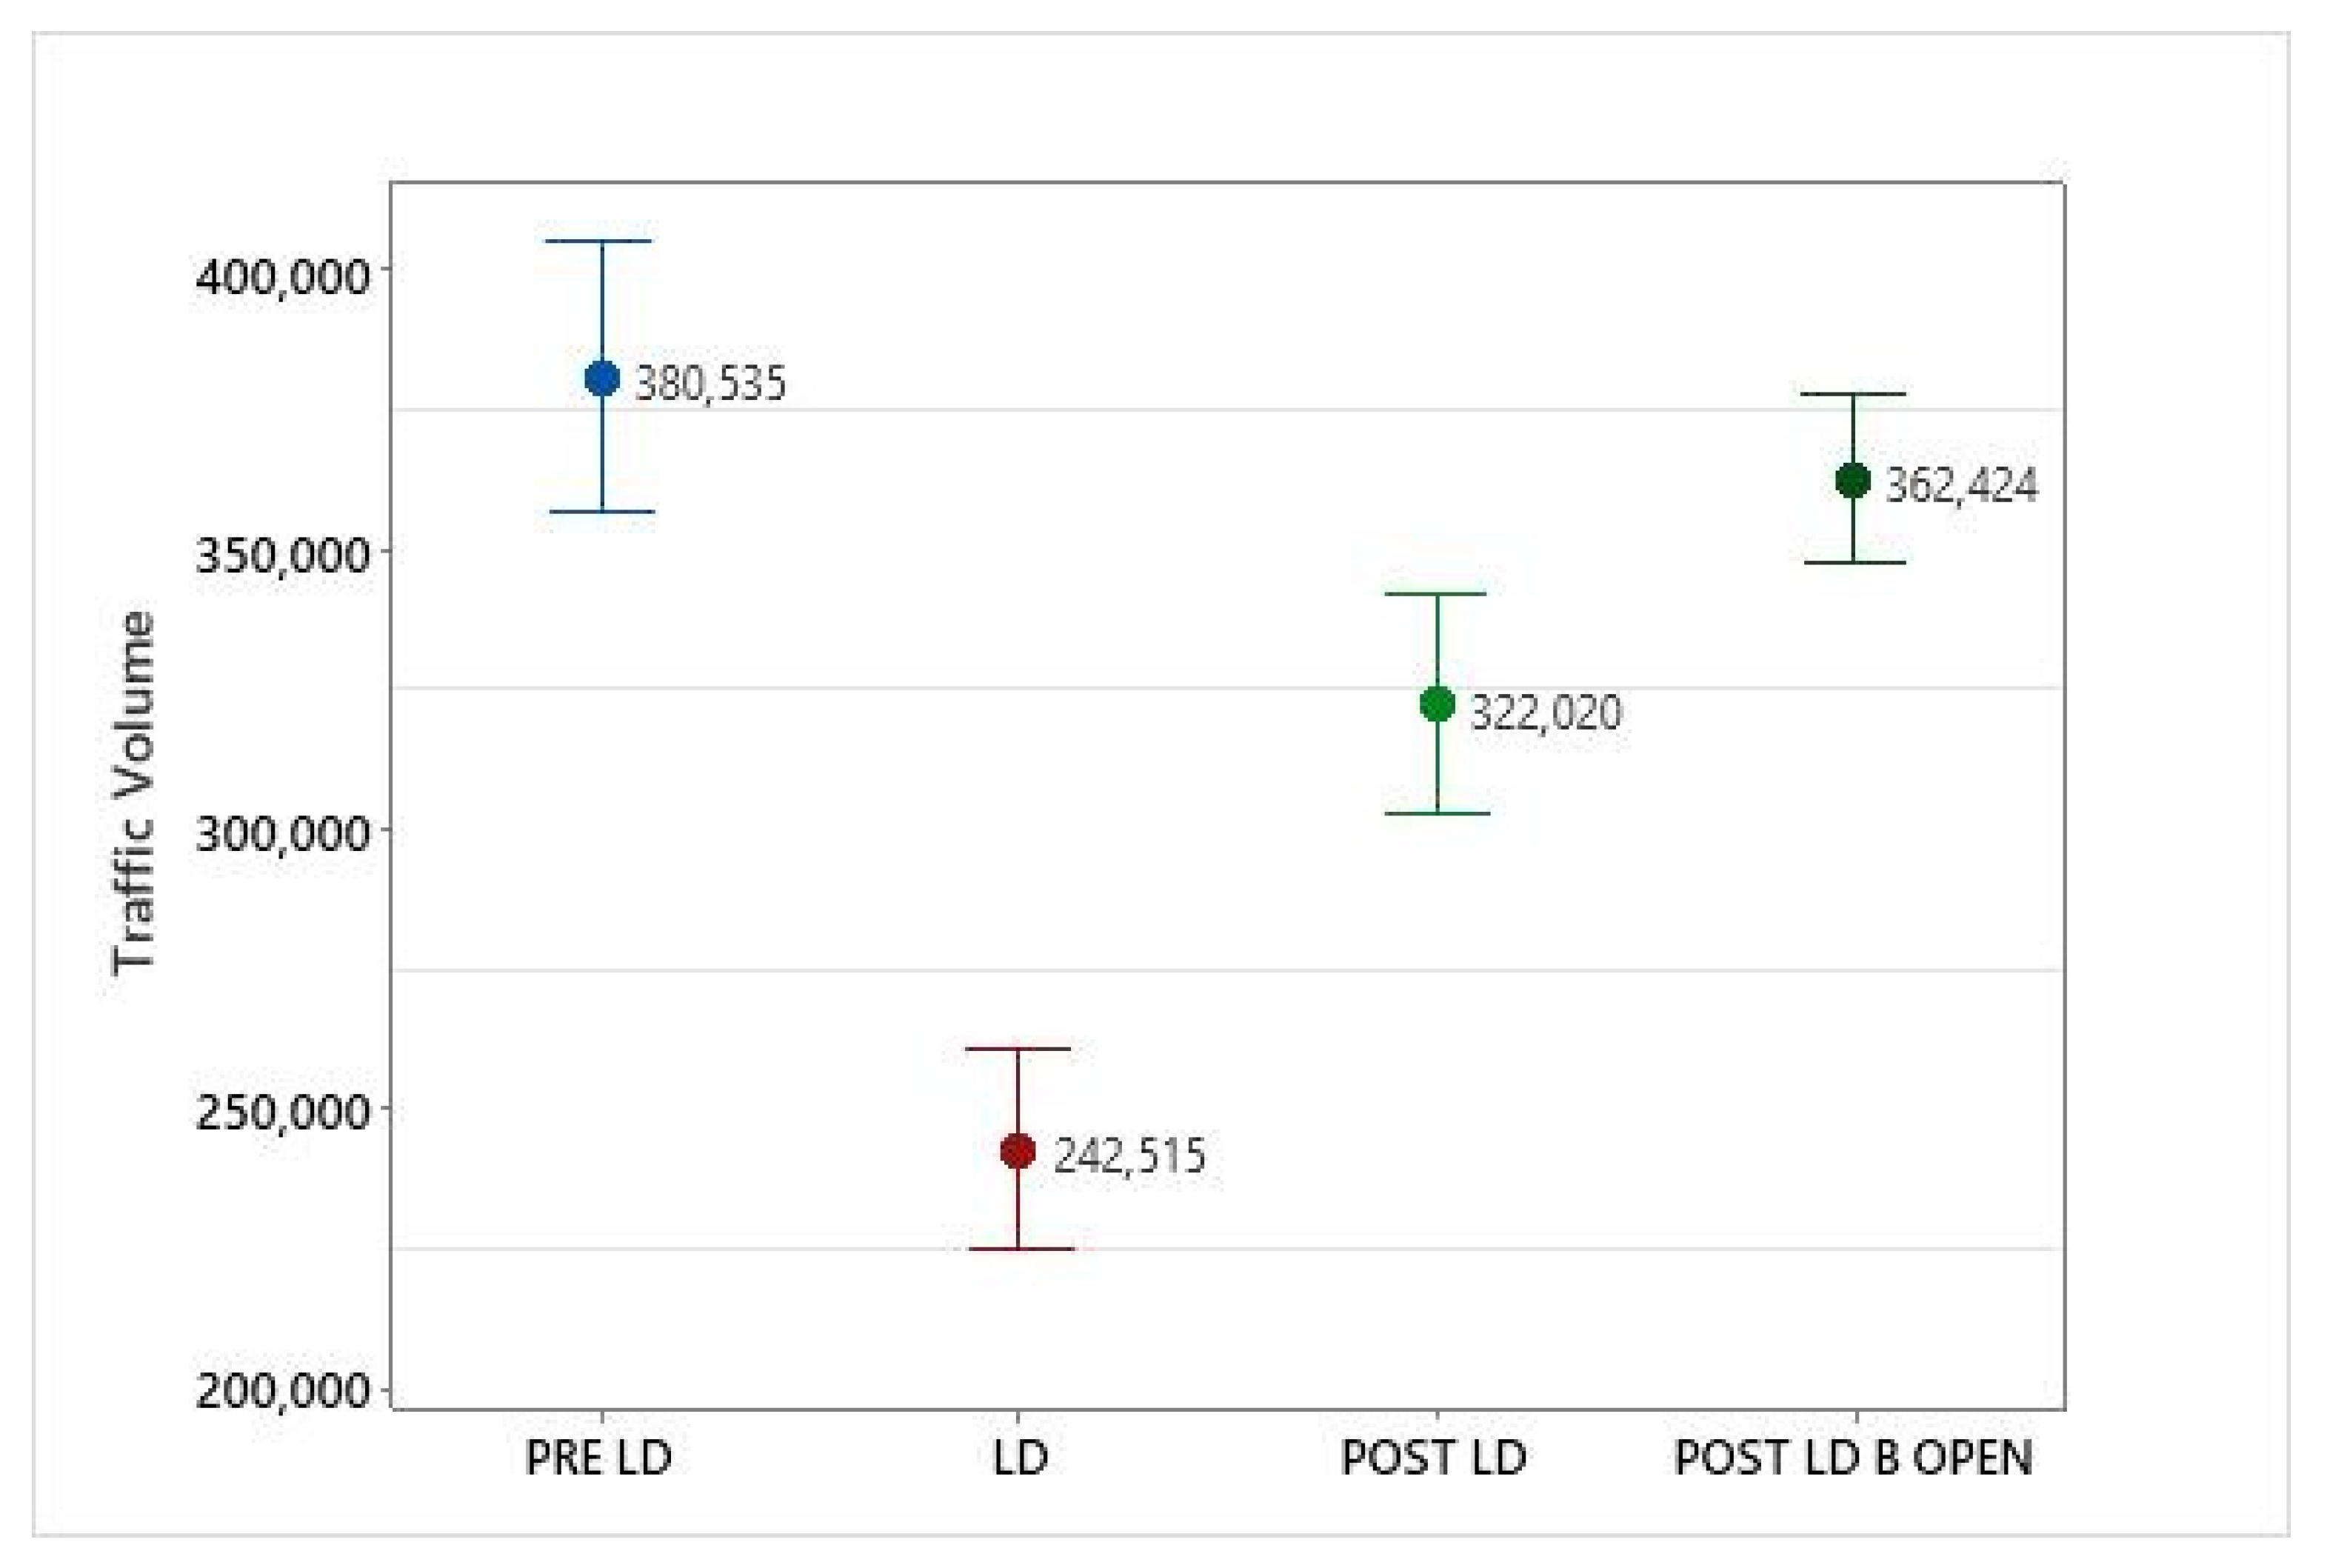
3.3. Comparison of Air Quality and Traffic Volumes between Lockdown, Pre-Lockdown and Post-Lockdown Periods

Mean PM2.5 concentrations recorded during the pre-lockdown, lockdown and post-lockdown periods were 8.3, 9.3, and 8.2 µg/m3, respectively (Table 3 and Figure 6). Post-ANOVA comparisons of PM2.5 concentrations between the lockdown and non-lockdown periods did not identify any significant differences between the lockdown period and pre and post lockdown periods. However, significant differences in NO2 concentrations between these periods were identified. While the mean NO2 concentration did not significantly decrease due to the lockdown (compared to pre-lockdown), surprisingly, the mean NO2 level reduced significantly during the post-lockdown period/s compared to the lockdown period (p ≤ 0.05) (Figure 7). Therefore, our data indicate that NO2 concentrations did not go down significantly during the official city/state lockdown period but continued to reduce after the stay at home orders were removed. Table 3 shows the mean values of each pollutant during these periods.
As expected, traffic levels significantly reduced during the lockdown period compared to pre-lockdown (p ≤ 0.05) and increased significantly during the post-lockdown period (Table 3). However, the average traffic volume in the post-lockdown period did not reach pre-lockdown levels and was significantly lower (p ≤ 0.05) than the pre-lockdown level (Figure 8). Post-ANOVA Tukey comparisons identified that the mean traffic volume during the lockdown period was statistically significantly lower compared to mean levels of all other periods analyzed (i.e., Pre-lockdown, post-lockdown including after businesses were open).
Further analyses on the impact of traffic on air pollutant levels were conducted using linear regression analysis. However, we did not find significant correlations between PM2.5 concentrations or NO2 concentrations with traffic volumes, either when analyzed with the total volumes (Northbound + Southbound total) or with the average traffic volume (p = 0.062, R2 = 1.4 and p = 0.523, R2 = 0.2 for PM2.5 and NO2, respectively).

4. Discussion

To our knowledge, this is the first study that investigated the impact of COVID-19 related lockdowns on the air quality of the Birmingham City/ Metropolitan Area, a city with a history of elevated air pollution levels. Our findings primarily demonstrate that mean PM2.5 and NO2 concentrations in Birmingham, AL in 2020 were significantly impacted compared to the previous year, however, levels during the official lockdown period in 2020 were not significantly reduced, compared to pre-lockdown levels. Although NO2 concentrations did not decrease during the official lockdown, NO2 concentrations significantly declined even after the lockdown order was removed (i.e., during the post-lockdown period), indicating that COVID-19 related changes did significantly impact air quality in Birmingham, AL over the following months. Results from past studies on the impact of lockdowns on air quality in cities are mixed, with some reporting similar results as this study with PM and/or NO2 concentrations [39], and others reporting significant increases or decreases in PM and other gaseous pollutant concentrations due to lockdowns in various cities [18,20,40,41]. Overall, the average PM2.5 and NO2 yearly mean concentrations in 2020 were significantly lower compared to the annual means of these pollutants in 2019, demonstrating that when lockdown and post-lockdown periods are combined, the COVID-19 related changes possibly impacted yearly mean air pollutant levels in Birmingham, AL.
When inferring changes in air quality due to COVID-19 related lockdowns, it is important to also consider the ‘baseline’ air pollutant levels of a city. Most studies that have reported significant/drastic reductions in PM and other pollutants were in cities with high air pollution levels, such as cities in India, China and Brazil [23,40,42]. We assume that in cities that have relatively lower mean PM and NO2 annual means, such as Birmingham during this period (which are in attainment to EPA standard levels—see Table 1), such significant changes may not be observed [39]. Studies have demonstrated that the contributing factors to air quality changes during the COVID-19 lockdowns are complex and vary depending on urban/commercial vs. rural neighborhoods, primary energy sources used (wood vs. coal) and influence of secondary pollutants, such as Ozone in some regions [43,44,45].
As expected, traffic volumes significantly reduced during the lockdown, and increased back to significant levels (although not reaching pre-lockdown levels) during the post-lockdown periods. However, this change was not correlated with the changes in the two main air pollutants studied during the defined periods. As traffic is a major contributor NO2, it is possible that traffic volume reduction contributed to post-lockdown reductions in NO2. We also assume that ‘Limited Business Operations’ imposed early by the largest employer of the city—The University of Alabama at Birmingham—impacted traffic and stationary source emissions before the official lockdown periods, and therefore, affected the concentrations of the pre-lockdown and during lockdown periods. The presence of busy ‘satellite’ suburban areas surrounding Birmingham city may have also contributed; while traffic volumes that were entering Birmingham city reduced, mobility in surrounding suburban areas were likely not reduced.
The air pollutant and traffic data showed mild to moderate skewness, and therefore, we performed the analyses using non-parametric tests such as the Kruskal–Wallis test, to compare levels of pre-, during, and post-lockdown periods. Results from the non-parametric tests revealed the same outcomes.
The study had several limitations. We relied on regionally available EPA data which had limitations with regards to the number of monitoring sites as well as data availability. While sufficient central monitors were present to measure PM2.5 concentrations in the Birmingham Metropolitan Area, only two NO2 monitoring sites were present, which may not represent the levels in areas that are further away from these two monitors. This limitation in central sites also limited our ability to analyze variations in other criteria pollutants, such as Ozone. Additionally, we were unable to factor in the contributions from stationary sources on the concentration variations of these pollutants. Birmingham and surrounding areas are still home to many industries, and it is possible that emissions from powerplants and other stationary sources were impacted during the lockdown periods, with some possibly increasing activity and emissions.

5. Conclusions

Our study found that air quality in Birmingham, AL significantly improved in the months studied in 2020, compared to the previous year (2019). However, PM2.5 concentrations did not show significant variations between the defined lockdown period and the pre- and post-lockdown periods, which were based on the city and state-wide ‘stay at home’ orders that significantly reduced mobility and traffic volumes. NO2 mean concentrations were significantly impacted, although not during the official lockdown period. The significant reduction in the post lockdown NO2 mean indicates that COVID-19 related changes had a significant impact on air quality. However, both pollutant concentration variations did not correlate with traffic volumes entering and exiting the Birmingham city area. Further studies on the impact and interaction of mobile and stationary sources, and concentration variations of secondary pollutants, such as Ozone, can improve our understanding of how COVID-19 related changes or other major events impact a city’s air quality.

Supplementary Materials

The following are available online at https://www.mdpi.com/article/10.3390/ijerph19063168/s1, Figure S1: Annual mean NO2 concentrations (ppb) from year 2016–2020. Error bars represent 95% confidence interval of the mean, Figure S2: Monthly mean PM2.5 concentrations (μg/m3) in years 2019 and 2020 (Error bars represent 95% confidence interval of the mean), Table S1: Locations of central air monitoring sites that provided data for the study.

Author Contributions

Project administration: M.J.R.V.; Concept, design and methodology: M.J.R.V., D.J. and S.S.; Data acquisition, processing and interpretation: M.J.R.V., D.J., S.S., I.B., A.S. and A.C.; Drafting the manuscript: D.J., S.S., M.J.R.V.; Analyses: M.J.R.V., D.J. and S.S.; Revision of the manuscript, and generating figures and tables: M.J.R.V., D.J., S.S., A.S. and A.C. All authors have read and agreed to the published version of the manuscript.

Funding

This research did not receive external funding from any public, commercial, or non-profit agencies.

Data Availability Statement

Air pollutant data used in this study can be retrieved from the United States Environmental Protection Agency (US EPA) website: www.epa.gov.

Acknowledgments

We would like to thank Jason Howanitz of the Air and Radiation Protection Division of the Jefferson County Department of Health for his help with obtaining air pollutant data. We are also thankful to Dawson B. Grant of the Alabama Department of Transportation for providing us traffic data for the selected monitoring sites in Birmingham.

Conflicts of Interest

The authors declare no conflict of interest.

References

  1. Guarnieri, M.; Balmes, J.R. Outdoor air pollution and asthma. Lancet 2014, 383, 1581–1592. [Google Scholar] [CrossRef] [Green Version]
  2. Pope, C.A., III; Dockery, D.W. Health effects of fine particulate air pollution: Lines that connect. J. Air Waste Manag. Assoc. 2006, 56, 709–742. [Google Scholar] [CrossRef] [PubMed]
  3. Franklin, B.A.; Brook, R.; Arden Pope, C., 3rd. Air pollution and cardiovascular disease. Curr. Probl. Cardiol. 2015, 40, 207–238. [Google Scholar] [CrossRef] [PubMed]
  4. Landrigan, P.J.; Fuller, R.; Acosta, N.J.; Adeyi, O.; Arnold, R.; Baldé, A.B.; Bertollini, R.; Bose-O’Reilly, S.; Boufford, J.I.; Breysse, P.N.; et al. The Lancet Commission on pollution and health. Lancet 2018, 391, 462–512. [Google Scholar] [CrossRef] [Green Version]
  5. World Health Organization (WHO). Ambient (Outdoor) Air Pollution. 2018. Available online: https://www.who.int/en/news-room/fact-sheets/detail/ambient-(outdoor)-air-quality-and-health (accessed on 19 February 2021).
  6. US-EPA. Criteria Air Pollutants. 2018. Available online: https://www.epa.gov/criteria-air-pollutants#self (accessed on 25 March 2018).
  7. Thurston, G.D.; Ito, K.; Lall, R. A Source Apportionment of U.S. Fine Particulate Matter Air Pollution. Atmos. Environ. 2011, 45, 3924–3936. [Google Scholar] [CrossRef] [Green Version]
  8. Guttikunda, S.K.; Nishadh, K.A.; Jawahar, P. Air pollution knowledge assessments (APnA) for 20 Indian cities. Urban Clim. 2019, 27, 124–141. [Google Scholar] [CrossRef]
  9. Wheida, A.; Nasser, A.; El Nazer, M.; Borbon, A.; El Ata, G.A.A.; Wahab, M.A.; Alfaro, S.C. Tackling the mortality from long-term exposure to outdoor air pollution in megacities: Lessons from the Greater Cairo case study. Environ. Res. 2018, 160, 223–231. [Google Scholar] [CrossRef]
  10. Li, Y.; Wang, W.; Kan, H.; Xu, X.; Chen, B. Air quality and outpatient visits for asthma in adults during the 2008 Summer Olympic Games in Beijing. Sci. Total Environ. 2010, 408, 1226–1227. [Google Scholar] [CrossRef]
  11. Rich, D.Q.; Kipen, H.M.; Huang, W.; Wang, G.; Wang, Y.; Zhu, P.; Ohman-Strickland, P.; Hu, M.; Philipp, C.; Diehl, S.R.; et al. Association between changes in air pollution levels during the Beijing Olympics and biomarkers of inflammation and thrombosis in healthy young adults. JAMA 2012, 307, 2068–2078. [Google Scholar] [CrossRef]
  12. Zhang, J.; Zhu, T.; Kipen, H.; Wang, G.; Huang, W.; Rich, D.; Zhu, P.; Wang, Y.; Lu, S.-E.; Ohman-Strickland, P.; et al. Cardiorespiratory biomarker responses in healthy young adults to drastic air quality changes surrounding the 2008 Beijing Olympics. Res. Rep. Health Eff. Inst. 2013, 174, 5. [Google Scholar]
  13. Ruzmyn Vilcassim, M.J.; Thurston, G.D.; Chen, L.C.; Lim, C.C.; Gordon, T. Exposure to Greater Air Pollution when Traveling Abroad Is Associated with Decreased Lung Function. Am. J. Respir. Crit. Care Med. 2019, 199, 1570–1572. [Google Scholar] [CrossRef] [PubMed]
  14. Vilcassim, M.J.R.; Callahan, A.E.; Zierold, K.M. Travelling to polluted cities: A systematic review on the harm of air pollution on international travellers’ health. J. Travel Med. 2021, 28, taab055. [Google Scholar] [CrossRef]
  15. Vilcassim, M.R.; Thurston, G.D.; Chen, L.-C.; Lim, C.C.; Saunders, E.; Yao, Y.; Gordon, T. Exposure to air pollution is associated with adverse cardiopulmonary health effects in international travelers. J. Travel Med. 2019, 26, taz032. [Google Scholar] [CrossRef]
  16. WHO Director-General’s Remarks at the Media Briefing on 2019-nCoV on 11 February 2020 [Press Release]. 2020. Available online: https://www.who.int/director-general/speeches/detail/who-director-general-s-remarks-at-the-media-briefing-on-2019-ncov-on-11-february-2020 (accessed on 19 February 2021).
  17. Chan, J.F.-W.; Yuan, S.; Kok, K.-H.; To, K.K.-W.; Chu, H.; Yang, J.; Xing, F.; Liu, J.; Yip, C.C.-Y.; Poon, R.W.-S.; et al. A familial cluster of pneumonia associated with the 2019 novel coronavirus indicating person-to-person transmission: A study of a family cluster. Lancet 2020, 395, 514–523. [Google Scholar] [CrossRef] [Green Version]
  18. Chauhan, A.; Singh, R.P. Decline in PM2.5 concentrations over major cities around the world associated with COVID-19. Environ. Res. 2020, 187, 109634. [Google Scholar] [CrossRef] [PubMed]
  19. Berman, J.D.; Ebisu, K. Changes in U.S. air pollution during the COVID-19 pandemic. Sci. Total Environ. 2020, 739, 139864. [Google Scholar] [CrossRef] [PubMed]
  20. Pata, U.K. How is COVID-19 affecting environmental pollution in US cities? Evidence from asymmetric Fourier causality test. Air Qual. Atmos. Health 2020, 13, 1149–1155. [Google Scholar] [CrossRef]
  21. Adhikari, A.; Yin, J. Short-Term Effects of Ambient Ozone, PM2.5, and Meteorological Factors on COVID-19 Confirmed Cases and Deaths in Queens, New York. Int. J. Environ. Res. Public Health 2020, 17, 4047. [Google Scholar] [CrossRef]
  22. Ma, C.J.; Kang, G.U. Air Quality Variation in Wuhan, Daegu, and Tokyo during the Explosive Outbreak of COVID-19 and Its Health Effects. Int. J. Environ. Res. Public Health 2020, 17, 4119. [Google Scholar] [CrossRef]
  23. Sharma, S.; Zhang, M.; Gao, J.; Zhang, H.; Kota, S.H. Effect of restricted emissions during COVID-19 on air quality in India. Sci. Total Environ. 2020, 728, 138878. [Google Scholar] [CrossRef]
  24. Archer, C.; Cervone, G.; Golbazi, M.; Fahel, N.; Hultquist, C. Changes in air quality and human mobility in the USA during the COVID-19 pandemic. Bull. Atmos. Sci. Technol. 2020, 1, 491–514. [Google Scholar] [CrossRef]
  25. Le, T.; Wang, Y.; Liu, L.; Yang, J.; Yung, Y.L.; Li, G.; Seinfeld, J.H. Unexpected air pollution with marked emission reductions during the COVID-19 outbreak in China. Science 2020, 369, 702–706. [Google Scholar] [CrossRef] [PubMed]
  26. Rodriguez-Urrego, D.; Rodriguez-Urrego, L. Air quality during the COVID-19: PM2.5 analysis in the 50 most polluted capital cities in the world. Environ. Pollut. 2020, 266 Pt 1, 115042. [Google Scholar] [CrossRef]
  27. Srivastava, A.K.; Bhoyar, P.D.; Kanawade, V.P.; Devara, P.C.S.; Thomas, A.; Soni, V.K. Improved air quality during COVID-19 at an urban megacity over the Indo-Gangetic Basin: From stringent to relaxed lockdown phases. Urban Clim. 2021, 36, 100791. [Google Scholar] [CrossRef] [PubMed]
  28. Kumari, P.; Toshniwal, D. Impact of lockdown on air quality over major cities across the globe during COVID-19 pandemic. Urban Clim. 2020, 34, 100719. [Google Scholar] [CrossRef] [PubMed]
  29. Sun, Y.; Lei, L.; Zhou, W.; Chen, C.; He, Y.; Sun, J.; Li, Z.; Xu, W.; Wang, Q.; Ji, D.; et al. A chemical cocktail during the COVID-19 outbreak in Beijing, China: Insights from six-year aerosol particle composition measurements during the Chinese New Year holiday. Sci. Total Environ. 2020, 742, 140739. [Google Scholar] [CrossRef]
  30. Pillion, D. Birmingham Rated 14th Word U.S. City for Year-Round Particulate Air Pollution. 2019. Available online: https://www.al.com/news/birmingham/2019/04/birmingham-rated-14th-worst-us-city-for-year-round-particulate-air-pollution.html (accessed on 26 February 2021).
  31. Robison, C.B.; Chambers, J.C.; Bates, J.W. Defining the Problem of Air Pollution in Metropolitan Birmingham, Alabama. Public Health Rep. 1968, 83, 1033–1044. [Google Scholar] [CrossRef] [Green Version]
  32. Tabor, E.C. Effects of the 1956 Steel Strike on Air Pollution Levels in Several Communities. In Proceedings of the 1958 Air Pollution Control Association Annual Meeting, Philadelphia, PA, USA, 25 May 1958. [Google Scholar]
  33. Schwartz, J. Air pollution and daily mortality in Birmingham, Alabama. Am. J. Epidemiol. 1993, 137, 1136–1147. [Google Scholar] [CrossRef]
  34. Schwartz, J. Air pollution and hospital admissions for the elderly in Birmingham, Alabama. Am. J. Epidemiol. 1994, 139, 589–598. [Google Scholar] [CrossRef]
  35. American Lung Association. State of the Air; American Lung Association: Chicago, IL, USA, 2021. [Google Scholar]
  36. Birmingham City Council Approves ‘Shelter in Place’ Ordinance to Slow COVID-19. Available online: https://www.birminghamal.gov/2020/03/24/birmingham-city-council-approves-shelter-in-place-ordinance-to-slow-covid-19/ (accessed on 1 March 2021).
  37. Governor Ivey Issues Amended Safer at Home Order. Available online: https://governor.alabama.gov/newsroom/2020/05/governor-ivey-issues-amended-safer-at-home-order-2/ (accessed on 1 March 2021).
  38. Governor Ivey Issues Stay at Home Order. Available online: https://governor.alabama.gov/newsroom/2020/04/governor-ivey-issues-stay-at-home-order/ (accessed on 1 March 2021).
  39. Zangari, S.; Hill, D.T.; Charette, A.T.; Mirowsky, J.E. Air quality changes in New York City during the COVID-19 pandemic. Sci. Total Environ. 2020, 742, 140496. [Google Scholar] [CrossRef]
  40. Srivastava, S.; Kumar, A.; Bauddh, K.; Gautam, A.S.; Kumar, S. 21-Day Lockdown in India Dramatically Reduced Air Pollution Indices in Lucknow and New Delhi, India. Bull. Environ. Contam. Toxicol. 2020, 105, 9–17. [Google Scholar] [CrossRef] [PubMed]
  41. Kerimray, A.; Baimatova, N.; Ibragimova, O.P.; Bukenov, B.; Kenessov, B.; Plotitsyn, P.; Karaca, F. Assessing air quality changes in large cities during COVID-19 lockdowns: The impacts of traffic-free urban conditions in Almaty, Kazakhstan. Sci. Total Environ. 2020, 730, 139179. [Google Scholar] [CrossRef] [PubMed]
  42. Dantas, G.; Siciliano, B.; Franca, B.B.; da Silva, C.M.; Arbilla, G. The impact of COVID-19 partial lockdown on the air quality of the city of Rio de Janeiro, Brazil. Sci. Total Environ. 2020, 729, 139085. [Google Scholar] [CrossRef] [PubMed]
  43. Adam, M.G.; Tran, P.T.M.; Balasubramanian, R. Air quality changes in cities during the COVID-19 lockdown: A critical review. Atmos. Res. 2021, 264, 105823. [Google Scholar] [CrossRef] [PubMed]
  44. Martinez-Soto, A.; Avendano Vera, C.C.; Boso, A.; Hofflinger, A.; Shupler, M. Energy poverty influences urban outdoor air pollution levels during COVID-19 lockdown in south-central Chile. Energy Policy 2021, 158, 112571. [Google Scholar] [CrossRef]
  45. Zoran, M.A.; Savastru, R.S.; Savastru, D.M.; Tautan, M.N. Assessing the relationship between surface levels of PM 2.5 and PM 10 particulate matter impact on COVID-19 in Milan, Italy. Sci. Total Environ. 2020, 738, 139825. [Google Scholar] [CrossRef]
Figure 1. Map of the Birmingham Metropolitan area and the air and traffic monitoring sites used in this study. Highways where traffic monitoring sensors are located are highlighted. Map source: US EPA Interactive Map of Air Quality Monitors.
Ijerph 19 03168 g001
Figure 2. Boxplot of monthly PM2.5 concentrations (µg/m3) in 2020 (January–October). The * symbol represents values that were considered outliers for that particular month.
Ijerph 19 03168 g002
Figure 3. Variation in monthly mean PM2.5 concentrations (µg/m3) from January to October in 2019 and 2020. The mean concentration in June is shown with and without the outlier due to a dust storm.
Ijerph 19 03168 g003
Figure 4. Variation in monthly mean NO2 concentrations (ppb) from January to August in 2019 and 2020.
Ijerph 19 03168 g004
Figure 5. Yearly mean PM2.5 concentrations from 2016 to 2020. Error bars represent 95% confidence interval of the mean.
Ijerph 19 03168 g005
Figure 6. Change in mean PM2.5 concentrations before, during, and after the lockdown period. Error bars represent 95% confidence interval of the mean. Abbreviations: PRE LD: Pre-lockdown, LD: Lockdown, POST LD: Post-lockdown and POST LD_B OPEN: Post-lockdown—businesses open.
Ijerph 19 03168 g006
Figure 7. Change in mean NO2 concentrations before, during, and after the lockdown period. Error bars represent 95% confidence interval of the mean. Abbreviations: PRE LD: Pre-lockdown, LD: Lockdown, POST LD: Post-lockdown and POST LD_B OPEN: Post-lockdown—businesses open.
Ijerph 19 03168 g007
Figure 8. Change in traffic volumes before, during, and after the lockdown period. Error bars represent 95% confidence interval of the mean. Abbreviations: PRE LD: Pre-lockdown, LD: Lockdown, POST LD: Post-lockdown and POST LD_B OPEN: Post-lockdown—businesses.
Ijerph 19 03168 g008
Table 1. Air pollutants, number of monitoring stations and related metrics used in the study.
PollutantUnitConcentration ParameterNumber of Central Monitor Sites Data Retrieved fromAverage Concentration in 2020 (January–October)EPA NAAQS a
(Primary)
PM2.5µg/m³Daily Mean7–89.112 (annual)
NO2ppbDaily Maximum1-h220.7653 (annual)
O3ppmDaily Maximum 8-h70.0400.070
SO2ppbDaily Maximum1-h21.7075
COppmDaily Maximum 8-h30.399
a National Ambient Air Quality Standards.
Table 2. Descriptive statistics of air pollutant concentrations (of interest in this study) and traffic volumes in 2019 and 2020 in Birmingham, Alabama.
Mean (±Standard Deviation)MinimumMaximum(n) Days
Year20192020201920202019202020192020
Metric
PM2.5
(µg/m3)
9.9 (±3.6)9.1 (±3.9)
8.9 (±3.4) b
2.93.120.036.9365297
NO2
(ppb)
24.58 (±10.39)20.76 (±8.29)5.455.3564.0544.15360243
O3
(ppm)
0.044 (±0.01)0.040 (±0.01)0.0170.0150.0750.063244245
SO2
(ppb)
4.90 (±4.11)1.70 (±1.45)0.330.1526.5510.9365366
CO
(ppm)
0.43 (±0.19)0.39 (±0.19)0.10.11.251.1365366
Traffic: Number of vehicles409,405.6 (±52,166.8)347,887.6 (±70,921.5)246,02398,484504,150494,507243244
b PM2.5 mean and SD without the outliers in June 2020.
Table 3. Mean and standard deviation of PM2.5 and NO2 concentrations, and traffic volumes before, during and after the lockdown period in Birmingham, AL.
ParameterPre-Lockdown (17 February–24 March)Lockdown
(25 March–30 April)
Post-Lockdown
(1 May to 22 May)
Post-Lockdown (Businesses Open—22 May–30 June)
PM2.5
(µg/m3)
8.3 (±3.4)9.3 (±3.4)8.2 (±2.0)8.6 (±2.4)
NO2
(ppb)
22.2 (±8.4)22.5 (±8.8)21.0 (±8.6)17.4 (±6.8) *
Traffic380,535
(±72,972)
242,515 *
(±53,389)
322,020
(±42,809)
362,424
(±46,327)
* Indicate means that were statistically significantly different from all other means in their respective categories (p < 0.05).
Publisher’s Note: MDPI stays neutral with regard to jurisdictional claims in published maps and institutional affiliations.

