
Ecosystem Service Values in the Dongting Lake Eco-Economic Zone and the Synergistic Impact of Its Driving Factors


Abstract
:1. Introduction
2. Data and Methods
2.1. Data
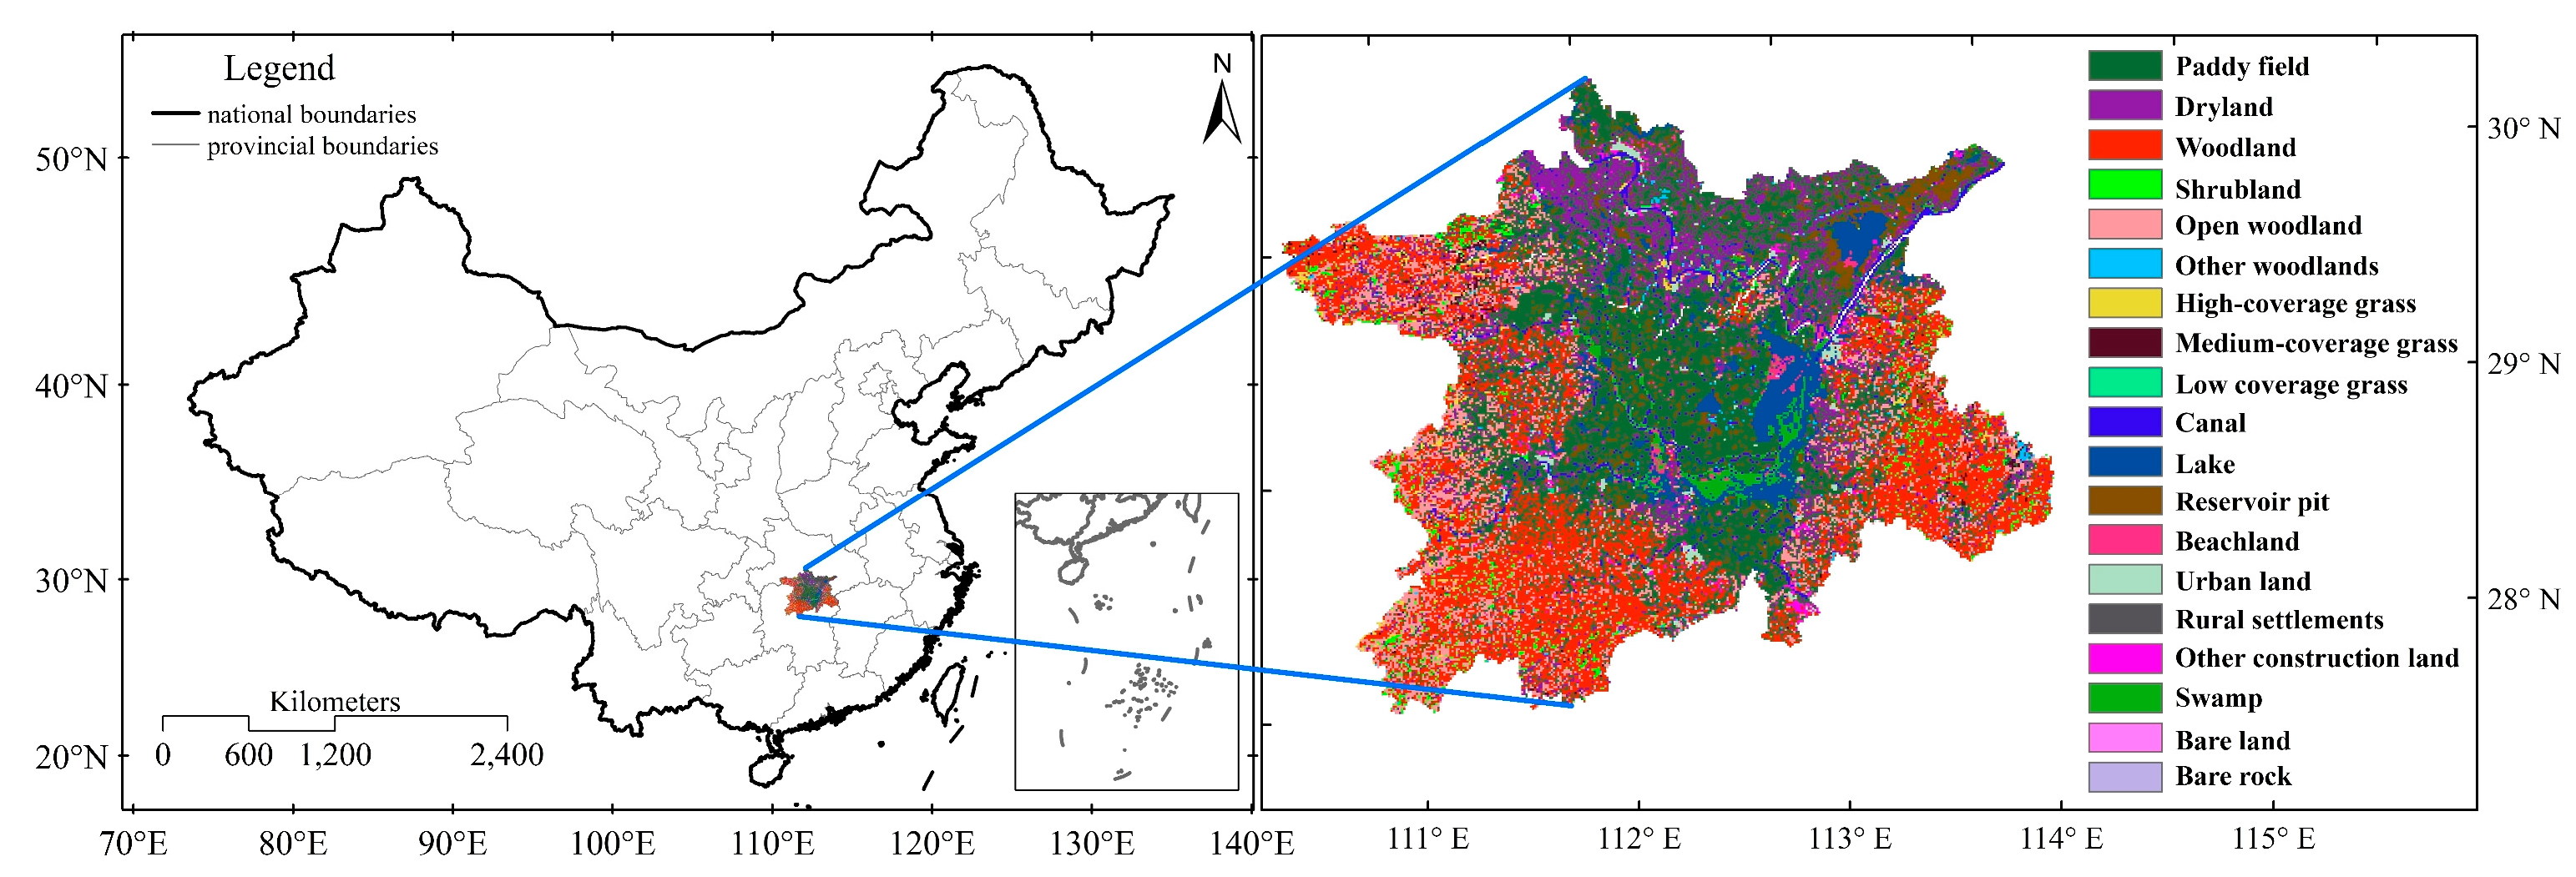
2.2. Study Area
2.3. Methods
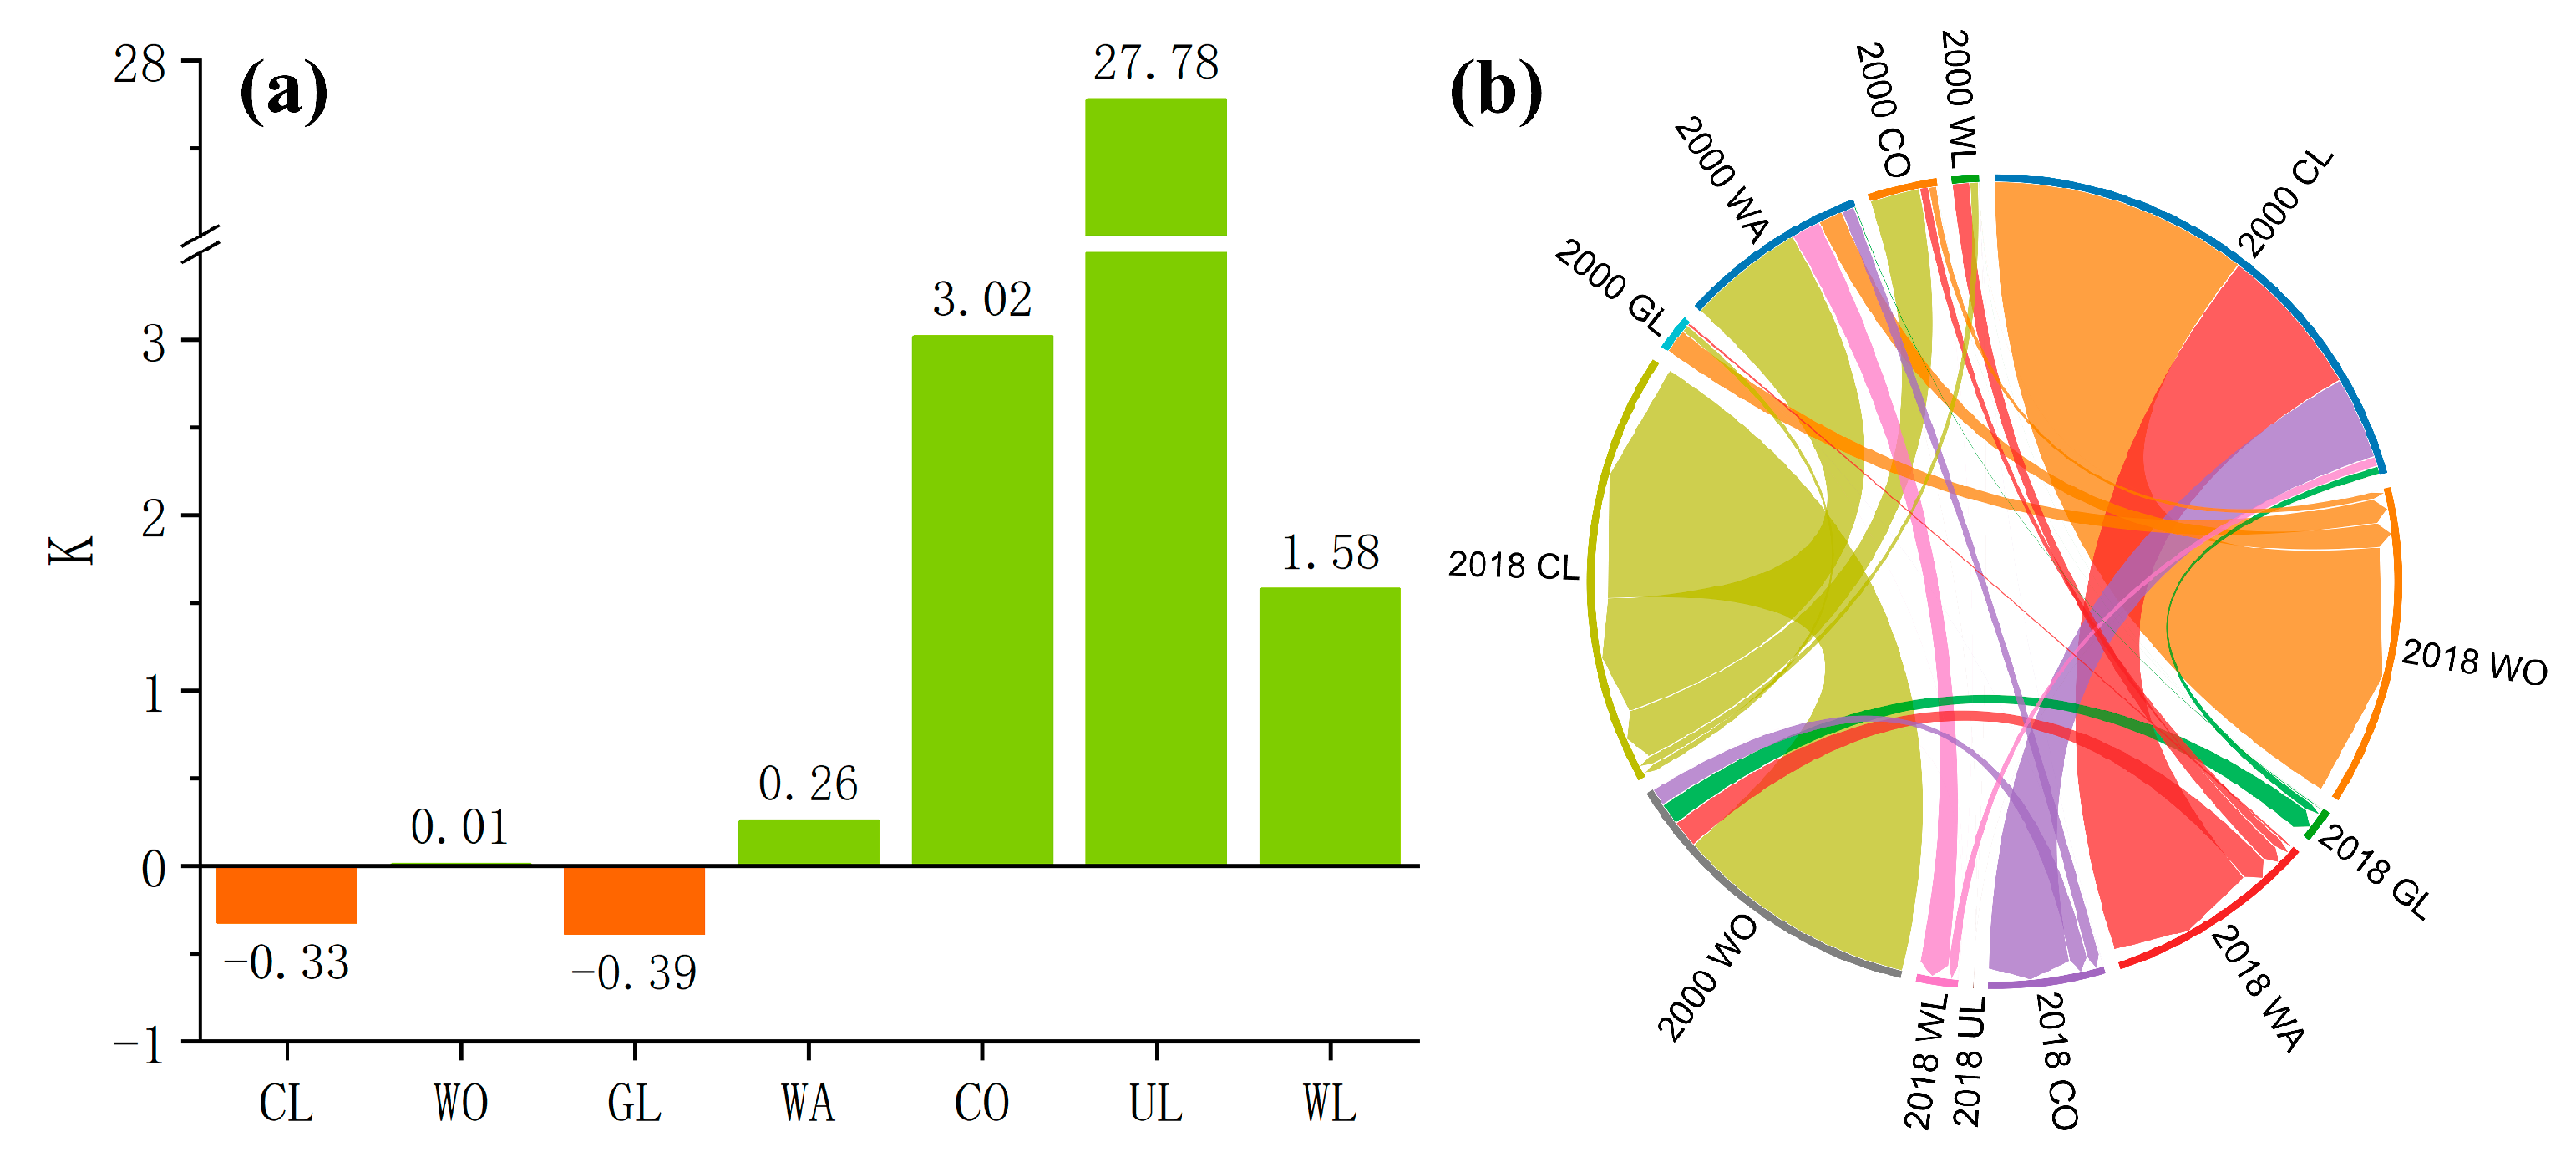
2.3.1. Land Use Changes
2.3.2. Ecosystem Service Values
2.3.3. Human Impact Index
2.3.4. Correlation Analysis
- 1.
- XGBoost algorithm
- 2.
- SHAP method
3. Results
3.1. Land Use Changes
3.2. Value of Each Service Type in Different Ecosystems
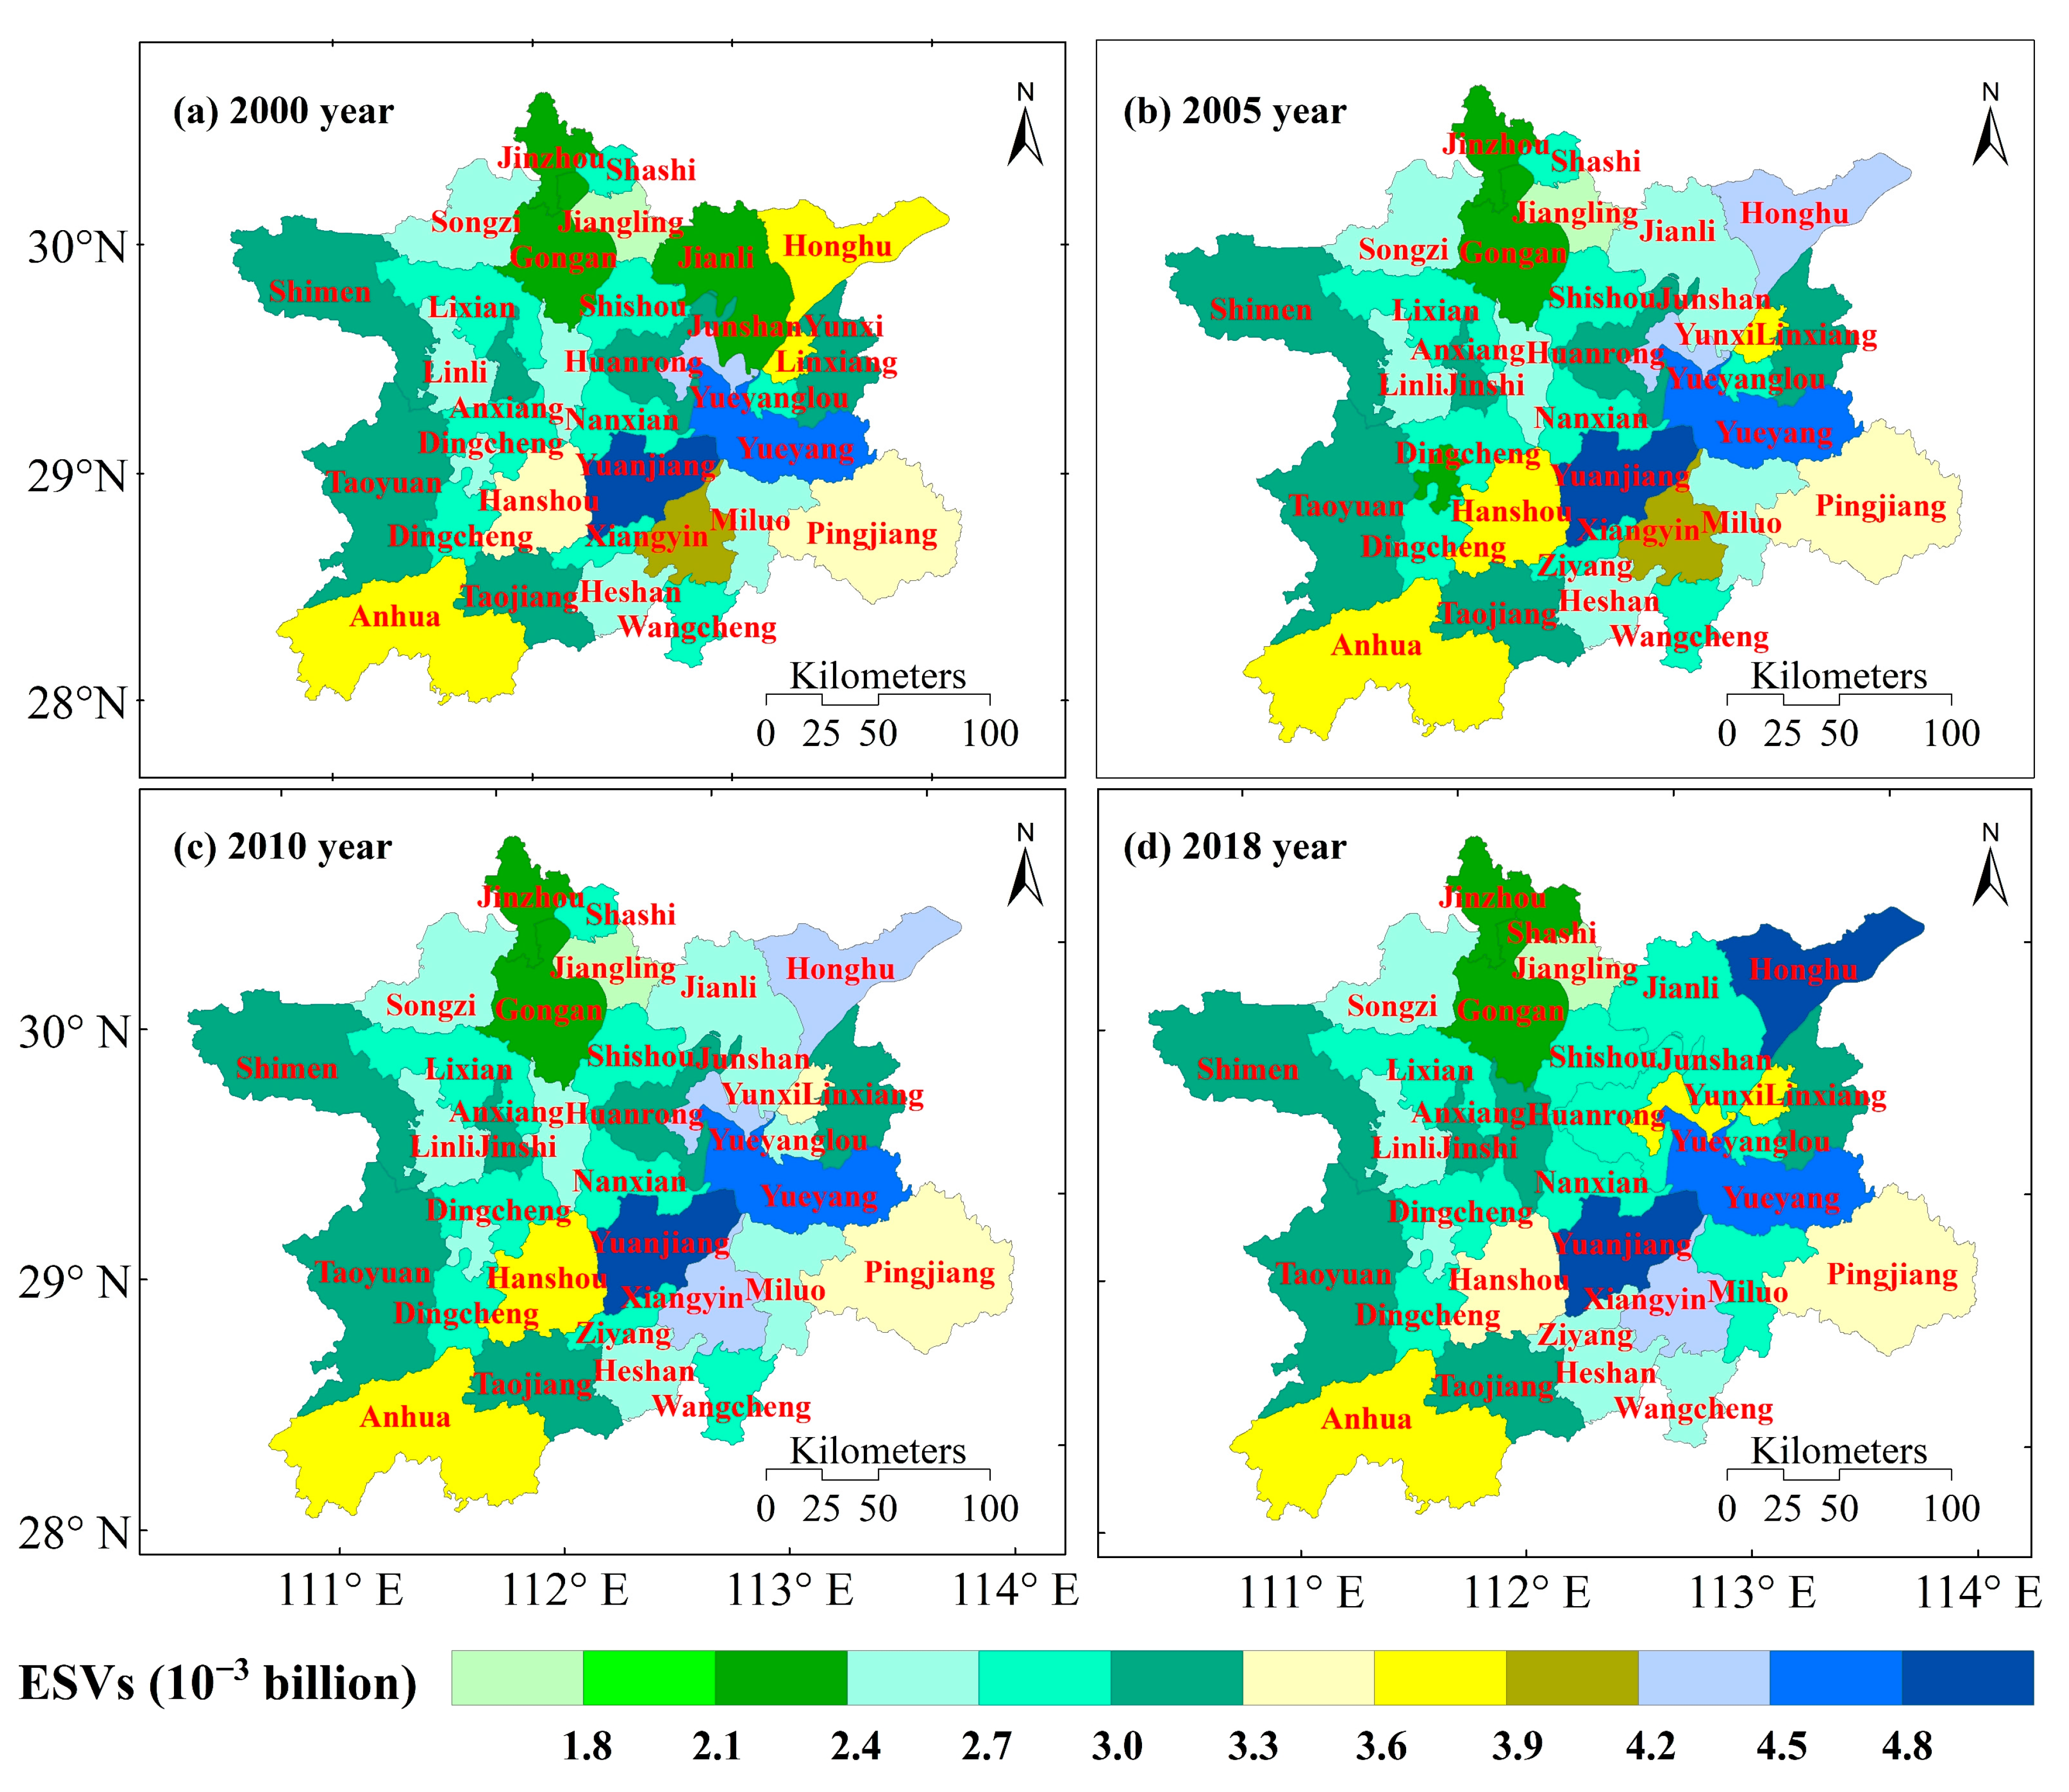
3.3. Spatial Distribution of ESVs
3.4. Machine Learning Analysis of Driving Factors
3.4.1. Human Impact Index
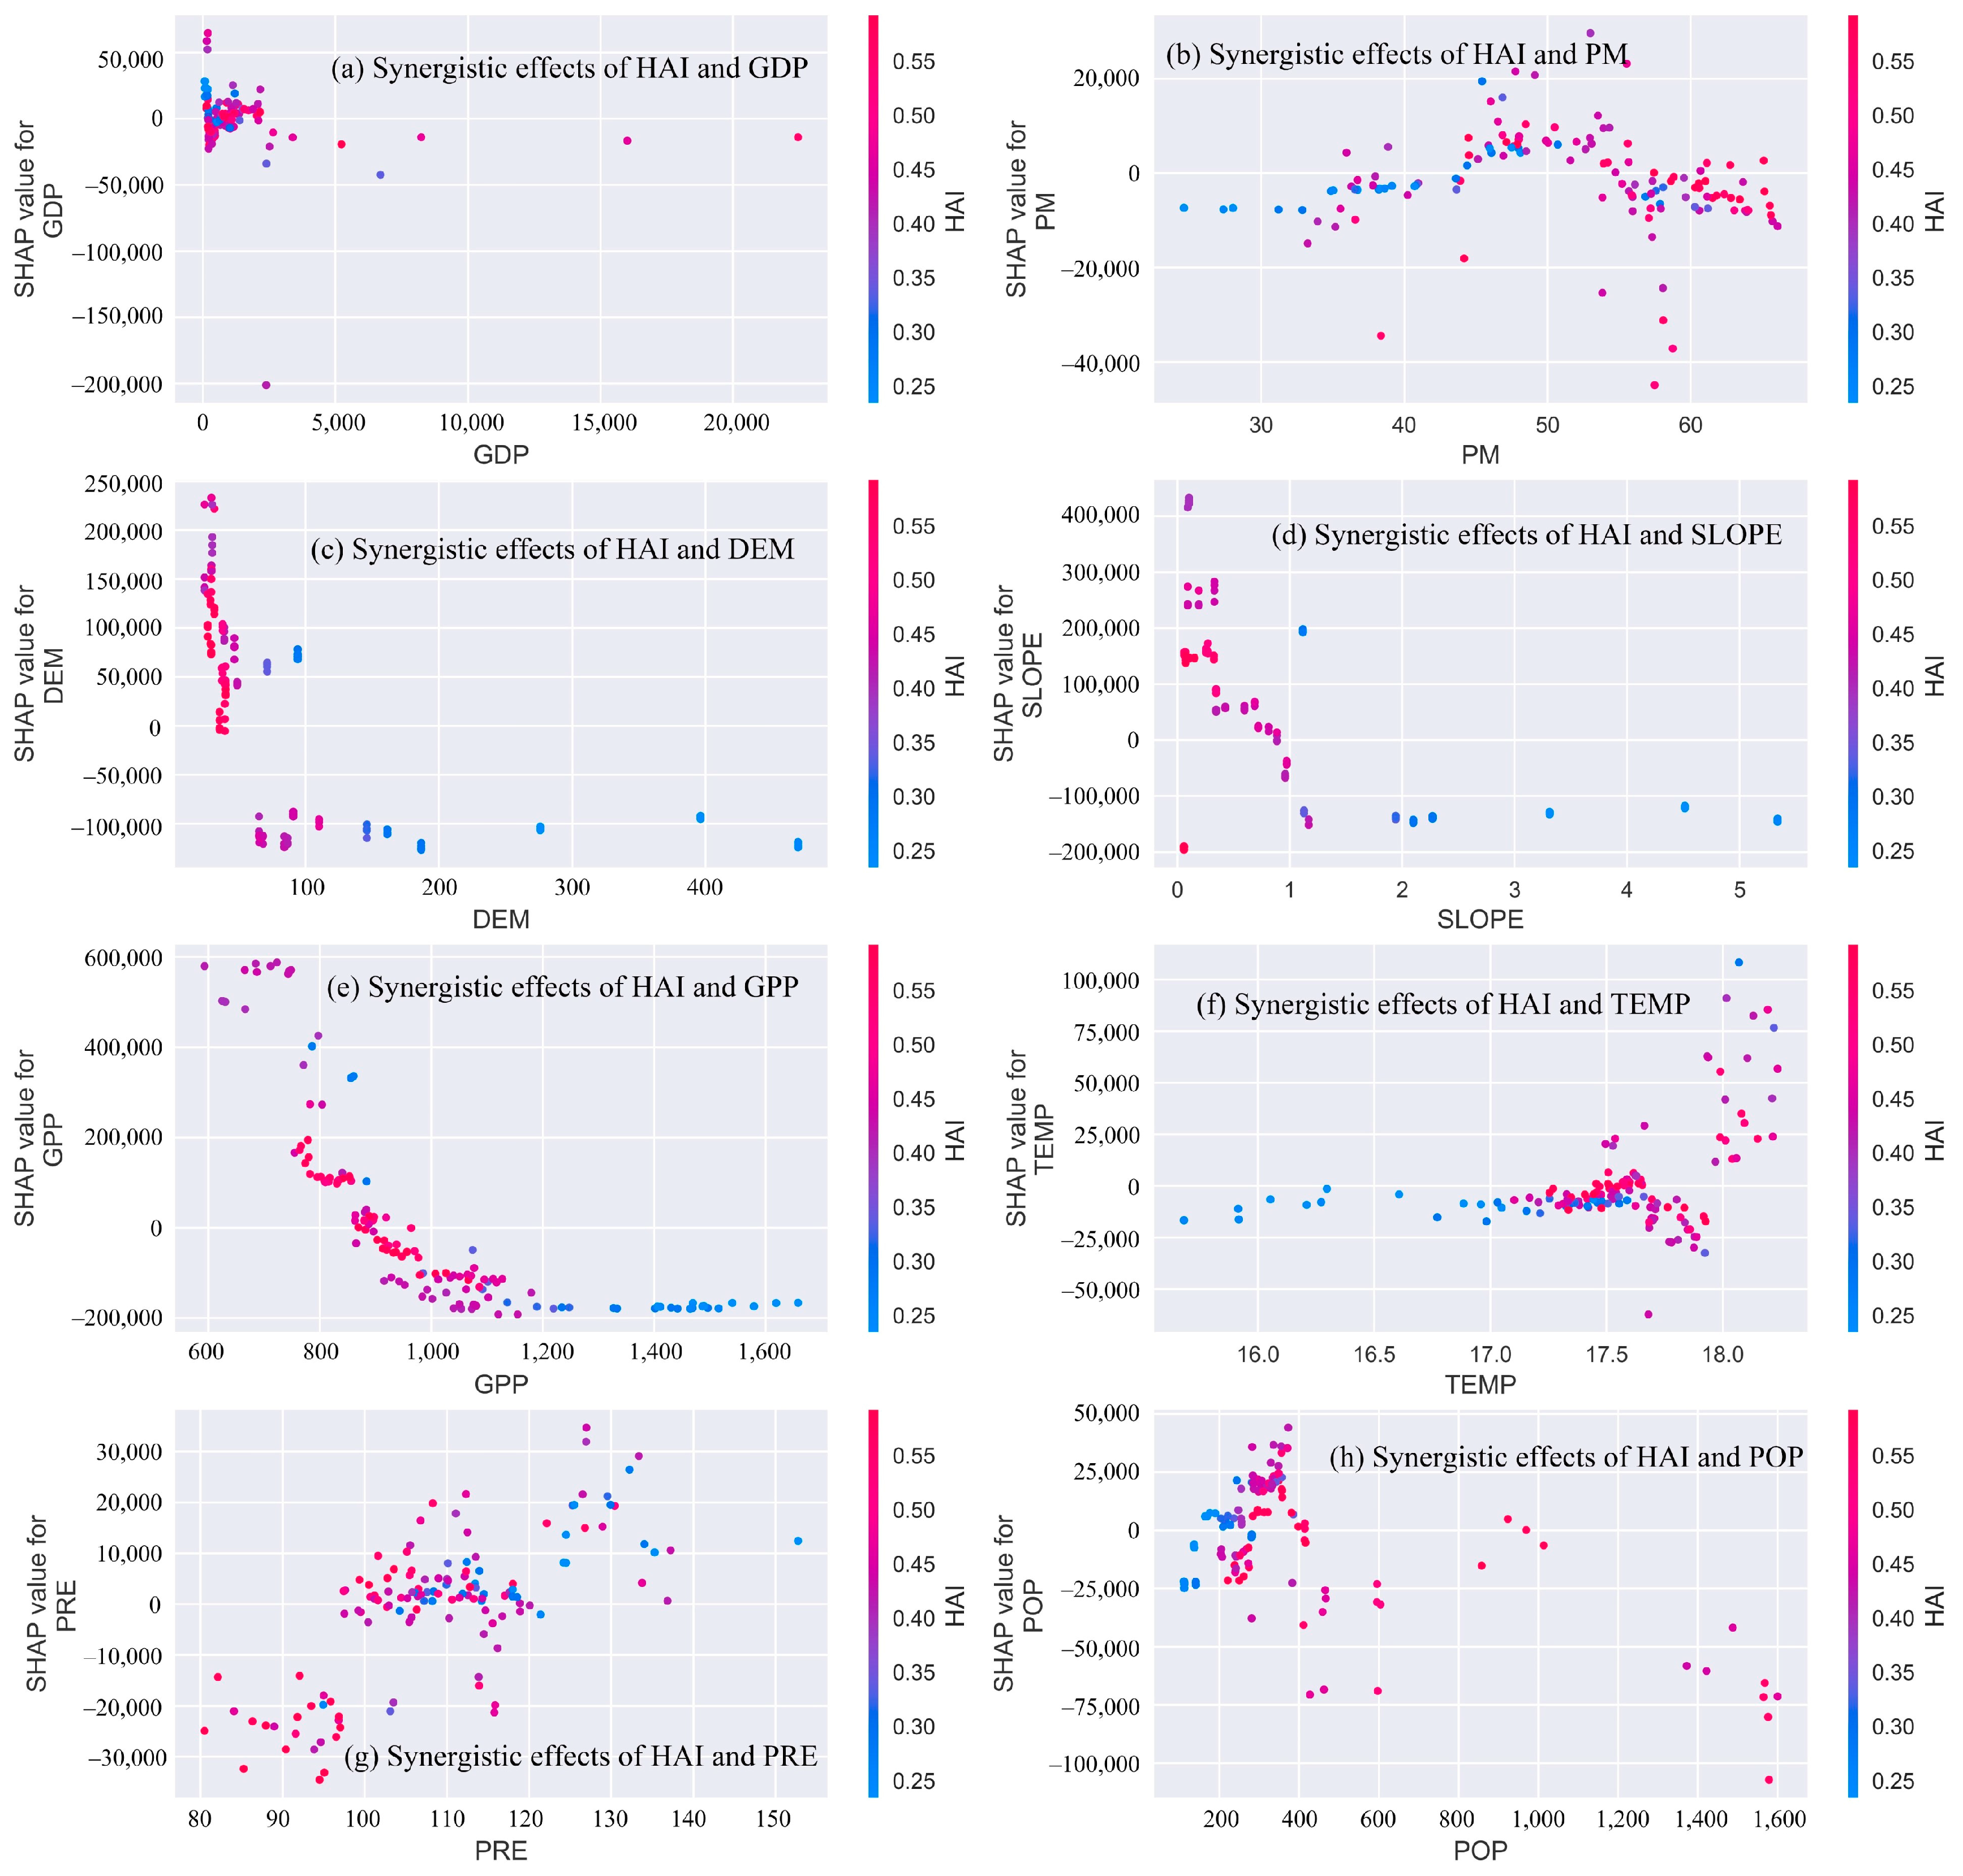
3.4.2. Driving Factor Analysis
4. Discussion
4.1. Spatial Variation of ESVs
4.2. Driving Factor Analysis
4.3. Limitations and Future Work
5. Conclusions
- (1)
- The largest changes in land use areas of the Dongting Lake from 2000 to 2018 were in cropland (2.54% decrease) and construction land (plus 1.46%) and the largest values of dynamic degree were in unused land use types, followed by construction land and wetlands.
- (2)
- The ESVs of the Dongting Lake showed an increasing trend, and the forestland ESVs were the highest, accounting for approximately 44.65% of the total value. Among the ESVs functions, water containment, waste treatment, soil formation and protection, biodiversity conservation and climate regulation contributed the most to the ESVs, with a combined contribution of 76.64% to 76.99%.
- (3)
- The integrated intensity of anthropogenic disturbance showed a U-shaped spatial distribution, decreasing from U1 to U3. The driving factors in descending order of importance were HAI, GPP, Slope, DEM, POP, Temp, GDP, Pre and PM.
- (4)
- When the GPP was low (GPP < 900), the SHAP value of the high HAI was greater than zero, indicating that an increase in the GPP of the Dongting Lake increases the ESVs. When the SHAP value of the DEM was greater than zero, an increase in the DEM led to an increase in the ESVs. Moreover, the high DEM values and low HAI values indicated that the ESVs tended to be lower.
Author Contributions
Funding
Institutional Review Board Statement
Informed Consent Statement
Data Availability Statement
Conflicts of Interest
References
- Gong, P.; Liu, H.; Zhang, M.N.; Li, C.C.; Wang, J.; Huang, H.B.; Clinton, N.; Ji, L.Y.; Li, W.Y.; Bai, Y.Q.; et al. Stable classification with limited sample: Transferring a 30-m resolution sample set collected in 2015 to mapping 10-m resolution global land cover in 2017. Sci. Bull. 2019, 64, 370–373. [Google Scholar] [CrossRef] [Green Version]
- Sterling, S.M.; Ducharne, A.; Polcher, J. The impact of global land-cover change on the terrestrial water cycle. Nat. Clim. Chang. 2013, 3, 385–390. [Google Scholar] [CrossRef]
- Li, Y.; Zhu, L.J.; Zhao, X.Y.; Li, S.C.; Yan, Y. Urbanization impact on temperature change in China with emphasis on land cover change and human activity. J. Clim. 2013, 26, 8765–8780. [Google Scholar] [CrossRef]
- Claussen, M.; Brovkin, V.; Ganopolski, A. Biogeophysical versus biogeochemical feedbacks of large-scale land cover change. Geophys. Res. Lett. 2001, 28, 1011–1014. [Google Scholar] [CrossRef] [Green Version]
- Reyers, B.; O’Farrell, P.J.; Cowling, R.M.; Egoh, B.N.; Le Maitre, D.C.; Vlok, J.H.J. Ecosystem services, land-cover change, and stakeholders: Finding a sustainable foothold for a semiarid biodiversity hotspot. Ecol. Soc. 2009, 14, 38. [Google Scholar] [CrossRef] [Green Version]
- Turner, B.L.; Lambin, E.F.; Reenberg, A. The emergence of land change science for global environmental change and sustainability. Proc. Natl. Acad. Sci. USA 2007, 104, 20666–20671. [Google Scholar] [CrossRef] [PubMed] [Green Version]
- Watson, L.; Straatsma, M.W.; Wanders, N.; Verstegen, J.A.; de Jong, S.M.; Karssenberg, D. Global ecosystem service values in climate class transitions. Environ. Res. Lett. 2020, 15, 15. [Google Scholar] [CrossRef]
- Wingfield, M.J.; Brockerhoff, E.G.; Wingfield, B.D.; Slippers, B. Planted forest health: The need for a global strategy. Science 2015, 349, 832–836. [Google Scholar] [CrossRef] [PubMed]
- Abulizi, A.; Yang, Y.; Mamat, Z.; Luo, J.; Abdulslam, D.; Xu, Z.; Zayiti, A.; Ahat, A.; Halik, W. Land-use change and its effects in Charchan Oasis, Xinjiang, China. Land Degrad. Dev. 2016, 28, 106–115. [Google Scholar] [CrossRef]
- Phelps, J.; Jones, C.A.; Pendergrass, J.A.; Gomez-Baggethun, E. Environmental liability: A missing use for ecosystem services valuation. Proc. Natl. Acad. Sci. USA 2015, 112, E5359. [Google Scholar] [CrossRef] [Green Version]
- Sannigrahi, S.; Chakraborti, S.; Joshi, P.K.; Keesstra, S.; Sen, S.; Paul, S.K.; Kreuter, U.; Sutton, P.C.; Jha, S.; Dang, K.B. Ecosystem service value assessment of a natural reserve region for strengthening protection and conservation. J. Environ. Manag. 2019, 244, 208–227. [Google Scholar] [CrossRef] [PubMed]
- Wanxu, C.; Yuanyuan, Z.; Jie, Z. Impacts of traffic accessibility on ecosystem services: An integrated spatial approach. J. Geogr. Sci. 2021, 31, 1816–1838. [Google Scholar]
- Schmidt, J.P.; Moore, R.; Alber, M. Integrating ecosystem services and local government finances into land use planning: A case study from coastal Georgia. Landsc. Urban Plan. 2014, 122, 56–67. [Google Scholar] [CrossRef]
- Nguyet, D.A.; Marie, J.B.; Rubianca, B.; Anne, T.S. Review of ecosystem service assessments: Pathways for policy integration in Southeast Asia. Ecosyst. Serv. 2021, 49, 101266. [Google Scholar]
- Lautenbach, S.; Kugel, C.; Lausch, A.; Seppelt, R. Analysis of historic changes in regional ecosystem service provisioning using land use data. Ecol. Indic. 2010, 11, 676–687. [Google Scholar] [CrossRef]
- Wainger, L.A.; King, D.M.; Mack, R.N.; Price, E.W.; Maslin, T. Can the concept of ecosystem services be practically applied to improve natural resource management decisions? Ecol. Econ. 2009, 69, 978–987. [Google Scholar] [CrossRef]
- Liu, Y.; Zhang, L.; Wei, X.; Xie, P. Integrating the spatial proximity effect into the assessment of changes in ecosystem services for biodiversity conservation. Ecol. Indic. 2016, 70, 382–392. [Google Scholar] [CrossRef]
- Zhang, H.; Wu, J.; Gao, Y.; Chen, Z. Spatial assessment of ecological vulnerability in Fuzhou District in China using remote sensing and GIS. Nat. Environ. Polution Technol. 2017, 16, 1303–1312. [Google Scholar]
- Kaifeng, P.; Weiguo, J.; Ziyan, L.; Peng, H.; Yawen, D. Evaluating the potential impacts of land use changes on ecosystem service value under multiple scenarios in support of SDG reporting: A case study of the Wuhan urban agglomeration. J. Clean. Prod. 2021, 307, 127321. [Google Scholar]
- Smith, P.; Cotrufo, M.F.; Rumpel, C.; Paustian, K.; Kuikman, P.J.; Elliott, J.A.; McDowell, R.; Griffiths, R.I.; Asakawa, S.; Bustamante, M.; et al. Biogeochemical cycles and biodiversity as key drivers of ecosystem services provided by soils. Soil 2015, 1, 665–685. [Google Scholar] [CrossRef] [Green Version]
- Dengyu, Y.; Xiaoshun, L.; Guie, L.; Jian, Z.; Haochen, Y. Spatio-temporal evolution of land use transition and its eco-environmental effects: A case study of the Yellow River basin, China. Land 2020, 9, 514. [Google Scholar]
- Haozhe, Z.; Qingyuan, Y.; Zhongxun, Z.; Dan, L.; Huiming, Z. Spatiotemporal changes of ecosystem service value determined by national land space pattern change: A case study of Fengdu county in The Three Gorges Reservoir Area, China. Int. J. Environ. Res. Public Health 2021, 18, 5007. [Google Scholar]
- Estoque, R.C.; Murayama, Y. Quantifying landscape pattern and ecosystem service value changes in four rapidly urbanizing hill stations of Southeast Asia. Landsc. Ecol. 2016, 31, 1481–1507. [Google Scholar] [CrossRef]
- Gong, J.; Li, J.Y.; Yang, J.X.; Li, S.C.; Tang, W.W. Land Use and Land Cover Change in the Qinghai Lake Region of the Tibetan Plateau and Its Impact on Ecosystem Services. Int. J. Environ. Res. Public Health 2017, 14, 818. [Google Scholar] [CrossRef] [PubMed]
- Li, T.H.; Li, W.K.; Qian, Z.H. Variations in ecosystem service value in response to land use changes in Shenzhen. Ecol. Econ. 2010, 69, 1427–1435. [Google Scholar]
- Wang, Y.; Li, X.; Zhang, F.; Wang, W.; Xiao, R. Effects of rapid urbanization on ecological functional vulnerability of the land system in Wuhan, China: A flow and stock perspective. J. Clean. Prod. 2020, 248, 119284. [Google Scholar] [CrossRef]
- Ting, L.; Jing, L.; Zixiang, Z.; Yanze, W.; Xiaonan, Y.; Keyu, Q.; Jingya, L. Taking climate, land use, and social economy into estimation of carbon budget in the Guanzhong-Tianshui Economic Region of China. Environ. Sci. Pollut. Res. Int. 2017, 24, 10466–10480. [Google Scholar]
- Zhe, Y.; Jijun, X.; Yongqiang, W.; Bo, Y. Analyzing the influence of land use/land cover change on landscape pattern and ecosystem services in the Poyang Lake Region, China. Environ. Sci. Pollut. Res. Int. 2021, 28, 27193–27206. [Google Scholar]
- Wang, R.; Xu, X.; Bai, Y.; Alatalo, J.M.; Yang, Z.; Yang, W.; Yang, Z. Impacts of urban land use changes on ecosystem services in Dianchi Lake Basin, China. Sustainability 2021, 13, 4813. [Google Scholar] [CrossRef]
- Rodgers, M.; Emmanuel, K.; Seyoum, M.; Tena, A. Impact of land use/land cover dynamics on ecosystem service value-a case from Lake Malombe, Southern Malawi. Environ. Monit. Assess. 2021, 193, 492. [Google Scholar]
- Yi, H.; Wenhui, W.; Youdong, C.; Haowen, Y. Assessing spatio-temporal patterns and driving force of ecosystem service value in the main urban area of Guangzhou. Sci. Rep. 2021, 11, 3027. [Google Scholar]
- Xing, G.; Jie, W.; Chenxi, L.; Weining, S.; Zhaoying, S.; Chengjing, N.; Xueru, Z. Land use change simulation and spatial analysis of ecosystem service value in Shijiazhuang under multi-scenarios. Environ. Sci. Pollut. Res. Int. 2021, 28, 31043–31058. [Google Scholar]
- Jiamin, L.; Bin, X.; Jizong, J.; Yueshi, L.; Xiaoyun, W. Modeling the response of ecological service value to land use change through deep learning simulation in Lanzhou, China. Sci. Total Environ. 2021, 796, 148981. [Google Scholar]
- Wang, Y.; Dai, E. Spatial-temporal changes in ecosystem services and the trade-off relationship in mountain regions: A case study of Hengduan Mountain region in Southwest China. J. Clean. Prod. 2020, 264, 121573, (prepublish). [Google Scholar] [CrossRef]
- Jie, G.; Xuguang, T.; Shiqiu, L.; Hongyan, B. The influence of land use change on key ecosystem services and their relationships in a mountain region from past to future (1995–2050). Forests 2021, 12, 616. [Google Scholar]
- Wei, C.; Xuepeng, Z.; Yingshuang, H. Spatial and temporal changes in ecosystem service values in karst areas in southwestern China based on land use changes. Environ. Sci. Pollut. Res. Int. 2021, 28, 45724–45738. [Google Scholar]
- Hu, Z.; Wang, S.; Bai, X.; Luo, G.; Li, Q.; Wu, L.; Yang, Y.; Tian, S.; Li, C.; Deng, Y. Changes in ecosystem service values in karst areas of China. Agric. Ecosyst. Environ. 2020, 301, 107206. [Google Scholar] [CrossRef]
- Zhou, L.; Guan, D.; Huang, X.; Yuan, X.; Zhang, M. Evaluation of the cultural ecosystem services of wetland park. Ecol. Indic. 2020, 114, 106286. [Google Scholar] [CrossRef]
- Zhang, X.; He, S.; Yang, Y. Evaluation of wetland ecosystem services value of the yellow river delta. Environ. Monit. Assess 2021, 193, 353. [Google Scholar] [CrossRef]
- Guo, C.; Gao, J.; Zhou, B.; Yang, J. Factors of the ecosystem service value in water conservation areas considering the natural environment and human activities: A case study of Funiu mountain, China. Int. J. Environ. Res. Public Health 2021, 18, 11074. [Google Scholar] [CrossRef]
- Pan, N.; Guan, Q.; Wang, Q.; Sun, Y.; Li, H.; Ma, Y. Spatial differentiation and driving mechanisms in ecosystem service value of Arid Region:A case study in the middle and lower reaches of Shule River Basin, NW China. J. Clean. Prod. 2021, 319, 128718. [Google Scholar] [CrossRef]
- Chen, M.; Lu, Y.; Ling, L.; Wan, Y.; Luo, Z.; Huang, H. Drivers of changes in ecosystem service values in Ganjiang upstream watershed. Land Use Policy 2015, 47, 247–252. [Google Scholar] [CrossRef]
- Kaloudis, S.; Pantera, A.; Papadopoulos, A.; Galanopoulou, S.; Damianidis, C. Impact of human and environmental factors on land cover changes of an oak silvopastoral system. Agrofor. Syst. 2021, 95, 931–950. [Google Scholar] [CrossRef]
- Costanza, R.; De Groot, R.; Sutton, P.; Van der Ploeg, S.; Anderson, S.J.; Kubiszewski, I.; Farber, S.; Turner, R.K. Changes in the global value of ecosystem services. Glob. Environ. Change 2014, 26, 152–158. [Google Scholar] [CrossRef]
- Liu, Z.; Wu, R.; Chen, Y.; Fang, C.; Wang, S. Factors of ecosystem service values in a fast-developing region in China: Insights from the joint impacts of human activities and natural conditions. J. Clean. Prod. 2021, 297, 126588. [Google Scholar] [CrossRef]
- Sutton, P.C.; Costanza, R. Global estimates of market and non-market values derived from nighttime satellite imagery, land cover, and ecosystem service valuation. Ecol. Econ. 2002, 41, 509–527. [Google Scholar] [CrossRef]
- Shoko, C.; Mutanga, O.; Dube, T. Remotely sensed C3 and C4 grass species aboveground biomass variability in response to seasonal climate and topography. Afr. J. Ecol. 2019, 57, 477–489. [Google Scholar] [CrossRef]
- Ling, H.; Yan, J.; Xu, H.; Guo, B.; Zhang, Q. Estimates of shifts in ecosystem service values due to changes in key factors in the Manas River basin, northwest China. Sci. Total Environ. 2019, 659, 177–187. [Google Scholar] [CrossRef]
- Estoque, R.C.; Murayama, Y. Landscape pattern and ecosystem service value changes: Implications for environmental sustainability planning for the rapidly urbanizing summer capital of the Philippines. Landsc. Urban Plan. 2013, 116, 60–72. [Google Scholar] [CrossRef]
- Shan, L.; Mingxia, Y.; Yuling, M.; Yanrong, M.; Xiaolu, Z.; Changhui, P. Effect of urbanization on ecosystem service values in the Beijing-Tianjin-Hebei urban agglomeration of China from 2000 to 2014. Sustainability 2020, 12, 10233. [Google Scholar]
- Mina, M.; Bugmann, H.; Cordonnier, T.; Irauschek, F.; Klopcic, M.; Pardos, M.; Cailleret, M. Future ecosystem services from European mountain forests under climate change. J. Appl. Ecol. 2017, 54, 389–401. [Google Scholar] [CrossRef]
- Prather, C.M.; Pelini, S.L.; Laws, A.; Rivest, E.; Woltz, M.; Bloch, C.P.; Del Toro, I.; Ho, C.K.; Kominoski, J.; Newbold, T.S.; et al. Invertebrates, ecosystem services and climate change. Biol. Rev. Camb. Philos. Soc. 2013, 88, 327–348. [Google Scholar] [CrossRef] [PubMed]
- Fu, Q.; Li, B.; Hou, Y.; Bi, X.; Zhang, X. Effects of land use and climate change on ecosystem services in Central Asia’s arid regions: A case study in Altay Prefecture, China. Sci. Total Environ. 2017, 607, 633–646. [Google Scholar] [CrossRef] [PubMed]
- Zhao, L.L.; Fan, X.C.; Lin, H.; Hong, T.; Hong, W. Impact of urbanization on the value of ecosystem services in Nanping City, China. Pol. J. Environ. Stud. 2021, 30, 965–975. [Google Scholar] [CrossRef]
- Hou, Y.; Zhou, S.; Burkhard, B.; Müller, F. Socioeconomic influences on biodiversity, ecosystem services and human well-being: A quantitative application of the DPSIR model in Jiangsu, China. Sci. Total Environ. 2014, 490, 1012–1028. [Google Scholar] [CrossRef] [PubMed]
- Wang, B.; Gao, P.; Niu, X.; Sun, J. Policy-driven China’s grain to green program: Implications for ecosystem services. Ecosyst. Serv. 2017, 27, 38–47. [Google Scholar] [CrossRef]
- Wang, H.; Zhou, S.; Li, X.; Liu, H.; Chi, D.; Xu, K. The influence of climate change and human activities on ecosystem service value. Ecol. Eng. 2016, 87, 224–239. [Google Scholar] [CrossRef]
- Yuan, W.P.; Liu, S.G.; Yu, G.R.; Bonnefond, J.M.; Chen, J.Q.; Davis, K.; Desai, A.R.; Goldstein, A.H.; Gianelle, D.; Rossi, F.; et al. Global estimates of evapotranspiration and gross primary production based on MODIS and global meteorology data. Remote Sens. Environ. 2010, 114, 1416–1431. [Google Scholar] [CrossRef] [Green Version]
- Peng, S.; Ding, Y.; Liu, W.; Li, Z. 1 km monthly temperature and precipitation dataset for China from 1901 to 2017. Earth Syst. Sci. Data 2019, 11, 1931–1946. [Google Scholar] [CrossRef] [Green Version]
- Liu, H.; Liu, H. Value evaluation of biodiversity conservation in Dongting lake wetland. J. Cent. South Univ. For. Technol. 2021, 41, 140–147. [Google Scholar]
- Xie, G.D.; Zhang, C.X.; Zhen, L.; Zhang, L.M. Dynamic changes in the value of China’s ecosystem services. Ecosyst. Serv. 2017, 26, 146–154. [Google Scholar] [CrossRef]
- Yan, E.; Lin, H.; Wang, G.; Xia, C. Analysis of evolution and driving force of ecosystem service values in the Three Gorges Reservoir region during 1990–2011. Acta Ecol. Sin. 2014, 34, 5962–5973. [Google Scholar]
- Jabeur, S.B.; Mefteh-Wali, S.; Viviani, J.-L. Forecasting gold price with the XGBoost algorithm and SHAP interaction values. Ann. Oper. Res. 2021. [Google Scholar] [CrossRef]
- Lundberg, S.; Lee, S.I. A unified approach to interpreting model predictions. Adv. Neural Inf. Processing Syst. 2017, 30, 4766–4775. [Google Scholar]
- Lundberg, S.M.; Erion, G.G.; Lee, S.I. Consistent Individualized Feature Attribution for Tree Ensembles. arXiv 2018, arXiv:1802.03888. Available online: https://arxiv.org/abs/1802.03888 (accessed on 7 March 2019).
- Chen, C.; Park, T.; Wang, X.; Piao, S.; Xu, B.; Chaturvedi, R.K.; Fuchs, R.; Brovkin, V.; Ciais, P.; Fensholt, R.; et al. China and India lead in greening of the world through land-use management. Nat. Sustain. 2019, 2, 122–129. [Google Scholar] [CrossRef] [PubMed]
- Talukdar, S.; Singha, P.; Mahato, S.; Praveen, B.; Rahman, A. Dynamics of ecosystem services (ESs) in response to land use land cover (LU/LC) changes in the lower Gangetic plain of India. Ecol. Indic. 2020, 112, 106121. [Google Scholar] [CrossRef]
- Xie, Z.L.; Li, X.Z.; Chi, Y.; Jiang, D.G.; Zhang, Y.Q.; Ma, Y.X.; Chen, S.L. Ecosystem service value decreases more rapidly under the dual pressures of land use change and ecological vulnerability: A case study in Zhujiajian Island. Ocean Coastal Manag. 2021, 201, 11. [Google Scholar] [CrossRef]
- Song, J.; Zhang, Z.; Chen, L.; Wang, D.; Liu, H.; Wang, Q.; Wang, M.; Yu, D. Changes in ecosystem services values in the south and north Yellow Sea between 2000 and 2010. Ocean Coastal Manag. 2021, 202, 105497. [Google Scholar] [CrossRef]
- Zheng, L.; Liu, H.; Huang, Y.; Yin, S.; Jin, G. Assessment and analysis of ecosystem services value along the Yangtze River under the background of the Yangtze River protection strategy. J. Geogr. Sci. 2020, 30, 553–568. [Google Scholar] [CrossRef]
- Wang, H.; Liu, L.; Yin, L.; Shen, J.; Li, S. Exploring the complex relationships and drivers of ecosystem services across different geomorphological types in the Beijing-Tianjin-Hebei region, China (2000–2018). Ecol. Indic. 2021, 121, 107116. [Google Scholar] [CrossRef]
- Luo, Q.L.; Zhou, J.F.; Li, Z.G.; Yu, B.L. Spatial differences of ecosystem services and their driving factors: A comparation analysis among three urban agglomerations in China’s Yangtze River Economic Belt. Sci. Total Environ. 2020, 725, 138452. [Google Scholar] [CrossRef]
- Msofe, N.K.; Sheng, L.X.; Li, Z.X.; Lyimo, J. Impact of land use/cover change on ecosystem service values in the Kilombero Valley Floodplain, Southeastern Tanzania. Forests 2020, 11, 109. [Google Scholar] [CrossRef] [Green Version]
- Kayiranga, A.; Chen, B.Z.; Guo, L.F.; Measho, S.; Hirwa, H.; Liu, S.; Bofana, J.; Sun, S.B.; Wang, F.; Karamage, F.; et al. Spatiotemporal variations of forest ecohydrological characteristics in the Lancang-Mekong region during 1992–2016 and 2020–2099 under different climate scenarios. Agric. For. Meteorol. 2021, 310, 108662. [Google Scholar] [CrossRef]
- Reynaud, A.; Lanzanova, D. A global meta-analysis of the value of ecosystem services provided by lakes. Ecol. Econ. 2017, 137, 184–194. [Google Scholar] [CrossRef] [PubMed]
- Braun, D.; de Jong, R.; Schaepman, M.E.; Furrer, R.; Hein, L.; Kienast, F.; Damm, A. Ecosystem service change caused by climatological and non-climatological drivers: A Swiss case study. Ecol. Appl. 2019, 29, e01901. [Google Scholar] [CrossRef] [PubMed]
- De Lima, G.; Hackbart, V.C.D.; Bertolo, L.S.; dos Santos, R.F. Identifying driving forces of landscape changes: Historical relationships and the availability of ecosystem services in the Atlantic forest. Ecosyst. Serv. 2016, 22, 11–17. [Google Scholar] [CrossRef]


| Primary Type | Secondary Type | Abbreviation | CL | WO | GL | WA | UL | WL |
|---|---|---|---|---|---|---|---|---|
| Provision | Food production | FP | 1793.88 | 179.39 | 538.16 | 179.39 | 17.94 | 538.16 |
| Raw material | RM | 179.39 | 4664.08 | 89.69 | 17.94 | 0.00 | 125.57 | |
| Regulation | Gas regulation | GR | 896.94 | 6278.58 | 1435.10 | 0.00 | 0.00 | 3228.98 |
| Climate regulation | CR | 1596.55 | 4843.47 | 1614.49 | 825.18 | 0.00 | 30,675.33 | |
| Water supply | WS | 1076.33 | 5740.41 | 1435.10 | 36,559.25 | 53.82 | 27,805.12 | |
| Waste treatment | WD | 2941.96 | 2349.98 | 2349.98 | 32,612.71 | 17.94 | 32,612.71 | |
| Support | Soil formation and retention | SFR | 2619.06 | 6996.13 | 3498.06 | 17.94 | 35.88 | 3067.53 |
| Biodiversity protection | BD | 1273.65 | 5848.04 | 1955.33 | 4466.76 | 609.92 | 4484.70 | |
| Culture | Recreation and culture | EC | 17.94 | 2296.16 | 71.76 | 7785.43 | 17.94 | 9956.03 |
| Total | 12,395.70 | 39,196.25 | 12,987.68 | 82,464.60 | 753.43 | 112,494.13 | ||
| LULC | Year | GR | CR | WS | SFR | WD | BD | FP | RM | EC |
|---|---|---|---|---|---|---|---|---|---|---|
| CL | 2000 | 2.467 | 4.392 | 2.961 | 7.204 | 8.092 | 3.503 | 4.934 | 0.493 | 0.049 |
| 2005 | 2.431 | 4.327 | 2.917 | 7.098 | 7.973 | 3.452 | 4.861 | 0.486 | 0.049 | |
| 2010 | 2.418 | 4.304 | 2.902 | 7.060 | 7.931 | 3.434 | 4.836 | 0.484 | 0.048 | |
| 2018 | 2.322 | 4.133 | 2.786 | 6.779 | 7.615 | 3.297 | 4.643 | 0.464 | 0.046 | |
| WO | 2000 | 13.930 | 10.746 | 12.736 | 15.522 | 5.214 | 12.975 | 0.398 | 10.348 | 5.095 |
| 2005 | 13.916 | 10.735 | 12.723 | 15.506 | 5.208 | 12.962 | 0.398 | 10.337 | 5.089 | |
| 2010 | 13.907 | 10.728 | 12.715 | 15.496 | 5.205 | 12.953 | 0.397 | 10.331 | 5.086 | |
| 2018 | 13.940 | 10.754 | 12.745 | 15.534 | 5.218 | 12.984 | 0.398 | 10.356 | 5.098 | |
| GL | 2000 | 0.131 | 0.148 | 0.131 | 0.320 | 0.215 | 0.179 | 0.049 | 0.008 | 0.007 |
| 2005 | 0.130 | 0.146 | 0.130 | 0.317 | 0.213 | 0.177 | 0.049 | 0.008 | 0.006 | |
| 2010 | 0.125 | 0.140 | 0.125 | 0.304 | 0.204 | 0.170 | 0.047 | 0.008 | 0.006 | |
| 2018 | 0.122 | 0.137 | 0.122 | 0.297 | 0.200 | 0.166 | 0.046 | 0.008 | 0.006 | |
| WA | 2000 | 0.000 | 0.604 | 26.743 | 0.013 | 23.856 | 3.267 | 0.131 | 0.013 | 5.695 |
| 2005 | 0.000 | 0.634 | 28.081 | 0.014 | 25.050 | 3.431 | 0.138 | 0.014 | 5.980 | |
| 2010 | 0.000 | 0.635 | 28.121 | 0.014 | 25.086 | 3.436 | 0.138 | 0.014 | 5.989 | |
| 2018 | 0.000 | 0.632 | 27.990 | 0.014 | 24.968 | 3.420 | 0.137 | 0.014 | 5.961 | |
| WL | 2000 | 0.288 | 2.733 | 2.477 | 0.273 | 2.906 | 0.400 | 0.048 | 0.011 | 0.887 |
| 2005 | 0.279 | 2.647 | 2.400 | 0.265 | 2.814 | 0.387 | 0.046 | 0.011 | 0.859 | |
| 2010 | 0.299 | 2.837 | 2.572 | 0.284 | 3.017 | 0.415 | 0.050 | 0.012 | 0.921 | |
| 2018 | 0.369 | 3.506 | 3.178 | 0.351 | 3.728 | 0.513 | 0.062 | 0.014 | 1.138 |
Publisher’s Note: MDPI stays neutral with regard to jurisdictional claims in published maps and institutional affiliations. |
© 2022 by the authors. Licensee MDPI, Basel, Switzerland. This article is an open access article distributed under the terms and conditions of the Creative Commons Attribution (CC BY) license (https://creativecommons.org/licenses/by/4.0/).
Share and Cite
Li, G.; Chen, W.; Zhang, X.; Yang, Z.; Bi, P.; Wang, Z. Ecosystem Service Values in the Dongting Lake Eco-Economic Zone and the Synergistic Impact of Its Driving Factors. Int. J. Environ. Res. Public Health 2022, 19, 3121. https://doi.org/10.3390/ijerph19053121
Li G, Chen W, Zhang X, Yang Z, Bi P, Wang Z. Ecosystem Service Values in the Dongting Lake Eco-Economic Zone and the Synergistic Impact of Its Driving Factors. International Journal of Environmental Research and Public Health. 2022; 19(5):3121. https://doi.org/10.3390/ijerph19053121
Chicago/Turabian StyleLi, Guangchao, Wei Chen, Xuepeng Zhang, Zhen Yang, Pengshuai Bi, and Zhe Wang. 2022. "Ecosystem Service Values in the Dongting Lake Eco-Economic Zone and the Synergistic Impact of Its Driving Factors" International Journal of Environmental Research and Public Health 19, no. 5: 3121. https://doi.org/10.3390/ijerph19053121
APA StyleLi, G., Chen, W., Zhang, X., Yang, Z., Bi, P., & Wang, Z. (2022). Ecosystem Service Values in the Dongting Lake Eco-Economic Zone and the Synergistic Impact of Its Driving Factors. International Journal of Environmental Research and Public Health, 19(5), 3121. https://doi.org/10.3390/ijerph19053121