
Optimization of Lipid Production by Schizochytrium limacinum Biomass Modified with Ethyl Methane Sulfonate and Grown on Waste Glycerol


 ,
,  and
and 
Abstract
:1. Introduction
2. Materials and Methods
2.1. Experimental Design
2.2. Materials
2.2.1. Subsubsection
2.2.2. Growth Media and Chemical Reagents
2.3. Experimental Station
2.4. Experimental Procedure—Stage 1
2.4.1. Treatment of Algae with EMS
2.4.2. Incubation
2.4.3. Microalgae Screening
2.5. Optimization Design—Stage 2
2.5.1. Plackett–Burman Design
2.5.2. Central Composite Design (CCD)
2.5.3. Validation of Optimal Culture Conditions
2.6. Analytical Methods
2.7. Statistical Analysis
3. Results and Discussion
3.1. Stage 1
3.2. Stage 2
3.3. Stage 3
4. Conclusions
Author Contributions
Funding
Institutional Review Board Statement
Informed Consent Statement
Data Availability Statement
Conflicts of Interest
References
- Jariah, N.F.; Hassan, M.A.; Taufiq-Yap, Y.H.; Roslan, A.M. Technological Advancement for Efficiency Enhancement of Biodiesel and Residual Glycerol Refining: A Mini Review. Processes 2021, 9, 1198. [Google Scholar] [CrossRef]
- Simionescu, M.; Bilan, Y.; Zawadzki, P.; Wojciechowski, A.; Rabe, M. GHG Emissions Mitigation in the European Union Based on Labor Market Changes. Energies 2021, 14, 465. [Google Scholar] [CrossRef]
- Khan, S.; Naushad, M.; Iqbal, J.; Bathula, C.; Sharma, G. Production and harvesting of microalgae and an efficient operational approach to biofuel production for a sustainable environment. Fuel 2021, 122543. [Google Scholar] [CrossRef]
- Chandrasekhar, K.; Kumar, S.; Lee, B.-D.; Kim, S.-H. Waste based hydrogen production for circular bioeconomy: Current status and future directions. Bioresour. Technol. 2020, 302, 122920. [Google Scholar] [CrossRef] [PubMed]
- Dębowski, M.; Zieliński, M.; Świca, I.; Kazimierowicz, J. Algae Biomass as a Potential Source of Liquid Fuels. Phycology 2021, 1, 105–118. [Google Scholar] [CrossRef]
- Crosse, A.J.; Brady, D.; Zhou, N.; Rumbold, K. Biodiesel’s trash is a biorefineries’ treasure: The use of “dirty” glycerol as an industrial fermentation substrate. World J. Microbiol. Biotechnol. 2020, 36, 2. [Google Scholar] [CrossRef]
- Chen, C.-Y.; Lee, M.-H.; Leong, Y.K.; Chang, J.-S.; Lee, D.-J. Biodiesel production from heterotrophic oleaginous microalga Thraustochytrium sp. BM2 with enhanced lipid accumulation using crude glycerol as alternative carbon source. Bioresour. Technol. 2020, 306, 123113. [Google Scholar] [CrossRef]
- Kujawska, N.; Talbierz, S.; Dębowski, M.; Kazimierowicz, J.; Zieliński, M. Cultivation Method Effect on Schizochytrium sp. Biomass Growth and Docosahexaenoic Acid (DHA) Production with the Use of Waste Glycerol as a Source of Organic Carbon. Energies 2021, 14, 2952. [Google Scholar] [CrossRef]
- Kujawska, N.; Talbierz, S.; Dębowski, M.; Kazimierowicz, J.; Zieliński, M. Optimizing Docosahexaenoic Acid (DHA) Production by Schizochytrium sp. Grown on Waste Glycerol. Energies 2021, 14, 1685. [Google Scholar] [CrossRef]
- Kosamia, N.M.; Samavi, M.; Uprety, B.K.; Rakshit, S.K. Valorization of Biodiesel Byproduct Crude Glycerol for the Production of Bioenergy and Biochemicals. Catalysts 2020, 10, 609. [Google Scholar] [CrossRef]
- Ortiz Ruiz, A. Microalgae-Based Wastewater Treatment Systems at Demonstrative Scale: Gravity Harvesting and Thickening of Biomass, and Advanced Design of Bioreactors. Ph.D. Thesis, Departament d’Enginyeria Civil i Ambiental, UPC, Barcelona, Spain, 2021. [Google Scholar]
- González-Balderas, R.M.; Felix, M.; Bengoechea, C.; Orta Ledesma, M.T.; Guerrero, A.; Velasquez-Orta, S.B. Development of composites based on residual microalgae biomass cultivated in wastewater. Eur. Polym. J. 2021, 160, 110766. [Google Scholar] [CrossRef]
- Borowiak, D.; Lenartowicz, P.; Grzebyk, M.; Wiśniewski, M.; Lipok, J.; Kafarski, P. Novel, automated, semi-industrial modular photobioreactor system for cultivation of demanding microalgae that produce fine chemicals—The next story of H. pluvialis and astaxanthin. Algal Res. 2021, 53, 102151. [Google Scholar] [CrossRef]
- Shekh, A.; Sharma, A.; Schenk, P.M.; Kumar, G.; Mudliar, S. Microalgae cultivation: Photobioreactors, CO2 utilization, and value-added products of industrial importance. J. Chem. Technol. Biotechnol. 2021. [Google Scholar] [CrossRef]
- Kumar, V.; Sharma, N.; Jaiswal, K.K.; Vlaskin, M.S.; Nanda, M.; Tripathi, M.K.; Kumar, S. Microalgae with a truncated light-harvesting antenna to maximize photosynthetic efficiency and biomass productivity: Recent advances and current challenges. Process Biochem. 2021, 104, 83–91. [Google Scholar] [CrossRef]
- Sharamo, F.F.; Shimelis, H.; OlaOlorun, B.M.; Korir, H.; Indetie, A.H.; Mashilo, J. Determining ethyl methane sulfonate-mediated (EMS) mutagenesis protocol for inducing high biomass yield in fodder barley (‘Hordeum vulgare’ L.). Aust. J. Crop Sci. 2021, 15, 983–989. [Google Scholar] [CrossRef]
- Watford, S.; Warrington, S.J. Bacterial DNA Mutations. In StatPearls [Internet]; StatPearls Publishing: Treasure Island, FL, USA, 2017. Available online: https://pubmed.ncbi.nlm.nih.gov/29083710/ (accessed on 2 March 2022).
- Siddique, M.I.; Back, S.; Lee, J.-H.; Jo, J.; Jang, S.; Han, K.; Venkatesh, J.; Kwon, J.-K.; Jo, Y.D.; Kang, B.-C. Development and Characterization of an Ethyl Methane Sulfonate (EMS) Induced Mutant Population in Capsicum annuum L. Plants 2020, 9, 396. [Google Scholar] [CrossRef] [Green Version]
- Khalil, F.; Naiyan, X.; Tayyab, M.; Pinghua, C. Screening of EMS-Induced Drought-Tolerant Sugarcane Mutants Employing Physiological, Molecular and Enzymatic Approaches. Agronomy 2018, 8, 226. [Google Scholar] [CrossRef] [Green Version]
- Smith-Baedorf, H.D. Microalgae for the Biochemical Conversion of CO2 and Production of Biodiesel. Ph.D. Thesis, Department of Biology and Biochemistry, University of Bath, Bath, UK, 2012. [Google Scholar]
- Murbach, T.S.; Glávits, R.; Endres, J.R.; Hirka, G.; Vértesi, A.; Béres, E.; Szakonyiné, I.P. A toxicological evaluation of Chlamydomonas reinhardtii, a green algae. Int. J. Toxicol. 2018, 37, 53–62. [Google Scholar] [CrossRef] [Green Version]
- Kawaroe, M.; Sudrajat, A.O.; Hwangbo, J.; Augustine, D. Chemical mutagenesis of microalgae Nannochloropsis sp. using ems (ethyl methanesulfonate). Br. J. Appl. Sci. Technol. 2015, 8, 494–505. [Google Scholar] [CrossRef]
- Huang, G.-H.; Chen, G.; Chen, F. Rapid screening method for lipid production in alga based on Nile red fluorescence. Biomass Bioenergy 2009, 33, 1386–1392. [Google Scholar] [CrossRef]
- Cohen, Z.; Shiran, D.; Khozin, I.; Heimer, Y.M. Fatty acid unsaturation in the red alga Porphyridium cruentum. Is the methylene interrupted nature of polyunsaturated fatty acids an intrinsic property of the desaturases? Biochim. Et Biophys. Acta (BBA)–Lipids Lipid Metab. 1997, 1344, 59–64. [Google Scholar] [CrossRef]
- Zhang, Y.; He, M.; Zou, S.; Fei, C.; Yan, Y.; Zheng, S.; Rajper, A.A.; Wang, C. Breeding of high biomass and lipid producing Desmodesmus sp. by Ethylmethane sulfonate-induced mutation. Bioresour. Technol. 2016, 207, 268–275. [Google Scholar] [CrossRef] [PubMed]
- Tanadul, O.; Noochanong, W.; Jirakranwong, P.; Chanprame, S. EMS-induced mutation followed by quizalofop-screening increased lipid productivity in Chlorella sp. Bioprocess Biosyst. Eng. 2018, 41, 613–619. [Google Scholar] [CrossRef] [PubMed]
- Dinesh Kumar, S.; Sojin, K.; Santhanam, P.; Dhanalakshmi, B.; Latha, S.; Park, M.S.; Kim, M.-K. Triggering of fatty acids on Tetraselmis sp. by ethyl methanesulfonate mutagenic treatment. Bioresour. Technol. Rep. 2018, 2, 21–28. [Google Scholar] [CrossRef]
- Kawaroe, M.; Prartono, T.; Hwangbo, J.; Sunuddin, A.; Augustine, D.; Gustina, A.S. Effect of ethyl methane sulfonate (EMS) on cell size, fatty acid content, growth rate, and antioxidant activities of microalgae Dunaliella sp. AACL Bioflux 2015, 8, 924–932. [Google Scholar]
- Sarayloo, E.; Tardu, M.; Unlu, Y.S.; Simsek, S.; Cevahir, G.; Erkey, C.; Kavakli, I.H. Understanding lipid metabolism in high-lipid-producing Chlorella vulgaris mutants at the genome-wide level. Algal Res. 2017, 28, 244–252. [Google Scholar] [CrossRef]
- Yokochi, T.; Honda, D.; Higashihara, T.; Nakahara, T. Optimization of docosahexaenoic acid production by Schizochytrium limacinum SR21. Appl. Microbiol. Biotechnol. 1998, 49, 72–76. [Google Scholar] [CrossRef]
- Kong, W.; Yang, S.; Wang, H.; Huo, H.; Guo, B.; Liu, N.; Zhang, A.; Niu, S. Regulation of biomass, pigments, and lipid production by Chlorella vulgaris 31 through controlling trophic modes and carbon sources. J. Appl. Phycol. 2020, 32, 1569–1579. [Google Scholar] [CrossRef]
- Capa-Robles, W.; García-Mendoza, E.; Paniagua-Michel, J.d.J. Enhanced β-carotene and Biomass Production by Induced Mixotrophy in Dunaliella salina across a Combined Strategy of Glycerol, Salinity, and Light. Metabolites 2021, 11, 866. [Google Scholar] [CrossRef]
- Sohrabi, D.; Jazini, M.H.; Shariati, M. Mixotrophic cultivation of Dunaliella salina on crude glycerol obtained from calcinated fatty acid production process. Russ. J. Mar. Biol. 2019, 45, 470–480. [Google Scholar] [CrossRef]
- Rattanapoltee, P.; Dujjanutat, P.; Muanruksa, P.; Kaewkannetra, P. Biocircular platform for third generation biodiesel production: Batch/fed batch mixotrophic cultivations of microalgae using glycerol waste as a carbon source. Biochem. Eng. J. 2021, 175, 108128. [Google Scholar] [CrossRef]
- Pyle, D.J.; Garcia, R.A.; Wen, Z. Producing docosahexaenoic acid (DHA)-rich algae from biodiesel-derived crude glycerol: Effects of impurities on DHA production and algal biomass composition. J. Agric. Food Chem. 2008, 56, 3933–3939. [Google Scholar] [CrossRef] [PubMed]
- Chang, G.; Gao, N.; Tian, G.; Wu, Q.; Chang, M.; Wang, X. Improvement of docosahexaenoic acid production on glycerol by Schizochytrium sp. S31 with constantly high oxygen transfer coefficient. Bioresour. Technol. 2013, 142, 400–406. [Google Scholar] [CrossRef] [PubMed]
- Huang, T.Y.; Lu, W.C.; Chu, I.M. A fermentation strategy for producing docosahexaenoic acid in Aurantiochytrium limacinum SR21 and increasing C22:6 proportions in total fatty acid. Bioresour. Technol. 2012, 123, 8–14. [Google Scholar] [CrossRef] [PubMed]
- Yeh, K.-L.; Chang, J.-S. Effects of cultivation conditions and media composition on cell growth and lipid productivity of indigenous microalga Chlorella vulgaris ESP-31. Bioresour. Technol. 2012, 105, 120–127. [Google Scholar] [CrossRef] [PubMed]
- Hu, Q.; Sommerfeld, M.; Jarvis, E.; Ghirardi, M.; Posewitz, M.; Seibert, M.; Darzins, A. Microalgal triacylglycerols as feedstocks for biofuel production: Perspectives and advances. Plant J. 2008, 54, 621–639. [Google Scholar] [CrossRef]
- Chi, Z.; Liu, Y.; Frear, C.; Chen, S. Study of a two-stage growth of DHA-producing marine algae Schizochytrium limacinum SR21 with shifting dissolved oxygen level. Appl. Microbiol. Biotechnol. 2009, 81, 1141–1148. [Google Scholar] [CrossRef]
- Nagappan, S.; Devendran, S.; Tsai, P.-C.; Dahms, H.-U.; Ponnusamy, V.K. Potential of two-stage cultivation in microalgae biofuel production. Fuel 2019, 252, 339–349. [Google Scholar] [CrossRef]


| Medium (Symbol) | Yeast Extract (g/dm3) | Peptone (g/dm3) | Glucose (g/dm3) | Glycerol (g/dm3) | Refined Glycerol (g/dm3) | Sea Water Made up to the Target vol. (dm3) |
|---|---|---|---|---|---|---|
| M1 | 5.0 | 5.0 | 15.0 | - | - | 1.0 (35 PSU) |
| M2 | 0.5 | - | - | 15.0 | - | 1.0 (35 PSU) |
| M3 | 5.0 | 5.0 | - | 15.0 | - | 1.0 (35 PSU) |
| M4 | 20.0 | 20.0 | - | 100.0 | - | 1.0 (35 PSU) |
| M5 | 20.0 | 20.0 | - | - | 204.4 | 1.0 (35 PSU) |
| M6 | 20.0 | 20.0 | - | 136.3 | - | 1.0 (35 PSU) |
| M7 | 20.0 | 20.0 | 100 | - | - | 1.0 (35 PSU) |
| M8 | 45.0 | - | - | 249.0 | - | 1.0 (15 PSU) |
| Code | Variable | Low (−) | High (+) |
|---|---|---|---|
| A | Initial cell concentrations in the culture (gDW/dm3) | 5 | 10 |
| B | Volumetric air flow rate (dm3/min.) | 0.1 | 0.5 |
| C | pH | 6 | 8 |
| D | Glycerol level (g/dm3) | 100 | 200 |
| E | Culture volume (dm3) | 1 | 2 |
| F | Salinity (PSU) | 15 | 35 |
| G | Turbine speed (rpm) | 400 | 800 |
| H | Concentration of yeast extract (g/dm3) | 10 | 30 |
| I | Temperature (°C) | 20 | 30 |
| J | Oxygen concentration (%) | 20 | 35 |
| Variant No. | A | B | C | D | E | F | G | H | I | J | d1 |
|---|---|---|---|---|---|---|---|---|---|---|---|
| 1 | + | + | − | − | + | + | + | + | − | + | − |
| 2 | − | + | + | − | − | + | + | + | + | − | + |
| 3 | + | − | + | + | − | − | + | + | + | + | − |
| 4 | − | + | − | + | + | − | − | + | + | + | + |
| 5 | + | − | + | − | + | + | − | − | + | + | + |
| 6 | + | + | − | + | − | + | + | − | − | + | + |
| 7 | + | + | + | − | + | − | + | + | − | − | + |
| 8 | + | + | + | + | − | + | − | + | + | − | − |
| 9 | − | + | + | + | + | − | + | − | + | + | − |
| 10 | − | − | + | + | + | + | − | + | − | + | + |
| 11 | + | − | − | + | + | + | + | − | + | − | + |
| 12 | − | − | − | − | − | − | − | − | − | − | − |
| Variable | Variable Code | Unit | −2 | −1 | 0 | 1 | 2 |
|---|---|---|---|---|---|---|---|
| Temperature | Z1 | °C | 15 | 20 | 25 | 30 | 35 |
| Glycerol level | Z2 | g/dm3 | 50 | 100 | 150 | 200 | 250 |
| Concentration of yeast extract | Z4 | g/dm3 | 10 | 30 | 50 | 70 | 90 |
| Oxygen saturation | Z3 | % | 2.5 | 15 | 27.5 | 40 | 52.5 |
| Strain Name | Variant | Survival Rate (%) | rDW (g/dm3·h) | rLIP (g/dm3·h) |
|---|---|---|---|---|
| S. limacinum C | V1–reference strain | 100 | 0.046 ± 0.002 | 0.017 ± 0.02 |
| S. limacinum E5 | V2–EMS (5 min) | 23 ± 4 | 0.051 ± 0.003 | 0.017 ± 0.02 |
| S. limacinum E10 | V3–EMS (10 min) | 17 ± 7 | 0.045 ± 0.005 | 0.011 ± 0.01 |
| S. limacinum E15 | V4–EMS (15 min) | 16 ± 3 | 0.059 ± 0.002 | 0.018 ± 0.02 |
| S. limacinum E20 | V5–EMS (20 min) | 11 ± 2 | 0.054 ± 0.004 | 0.021 ± 0.03 |
| S. limacinum E25 | V6–EMS (25 min) | 12 ± 5 | 0.039 ± 0.002 | 0.011 ± 0.02 |
| S. limacinum E30 | V7–EMS (30 min) | 2 ± 1 | 0.031 ± 0.001 | 0.011 ± 0.03 |
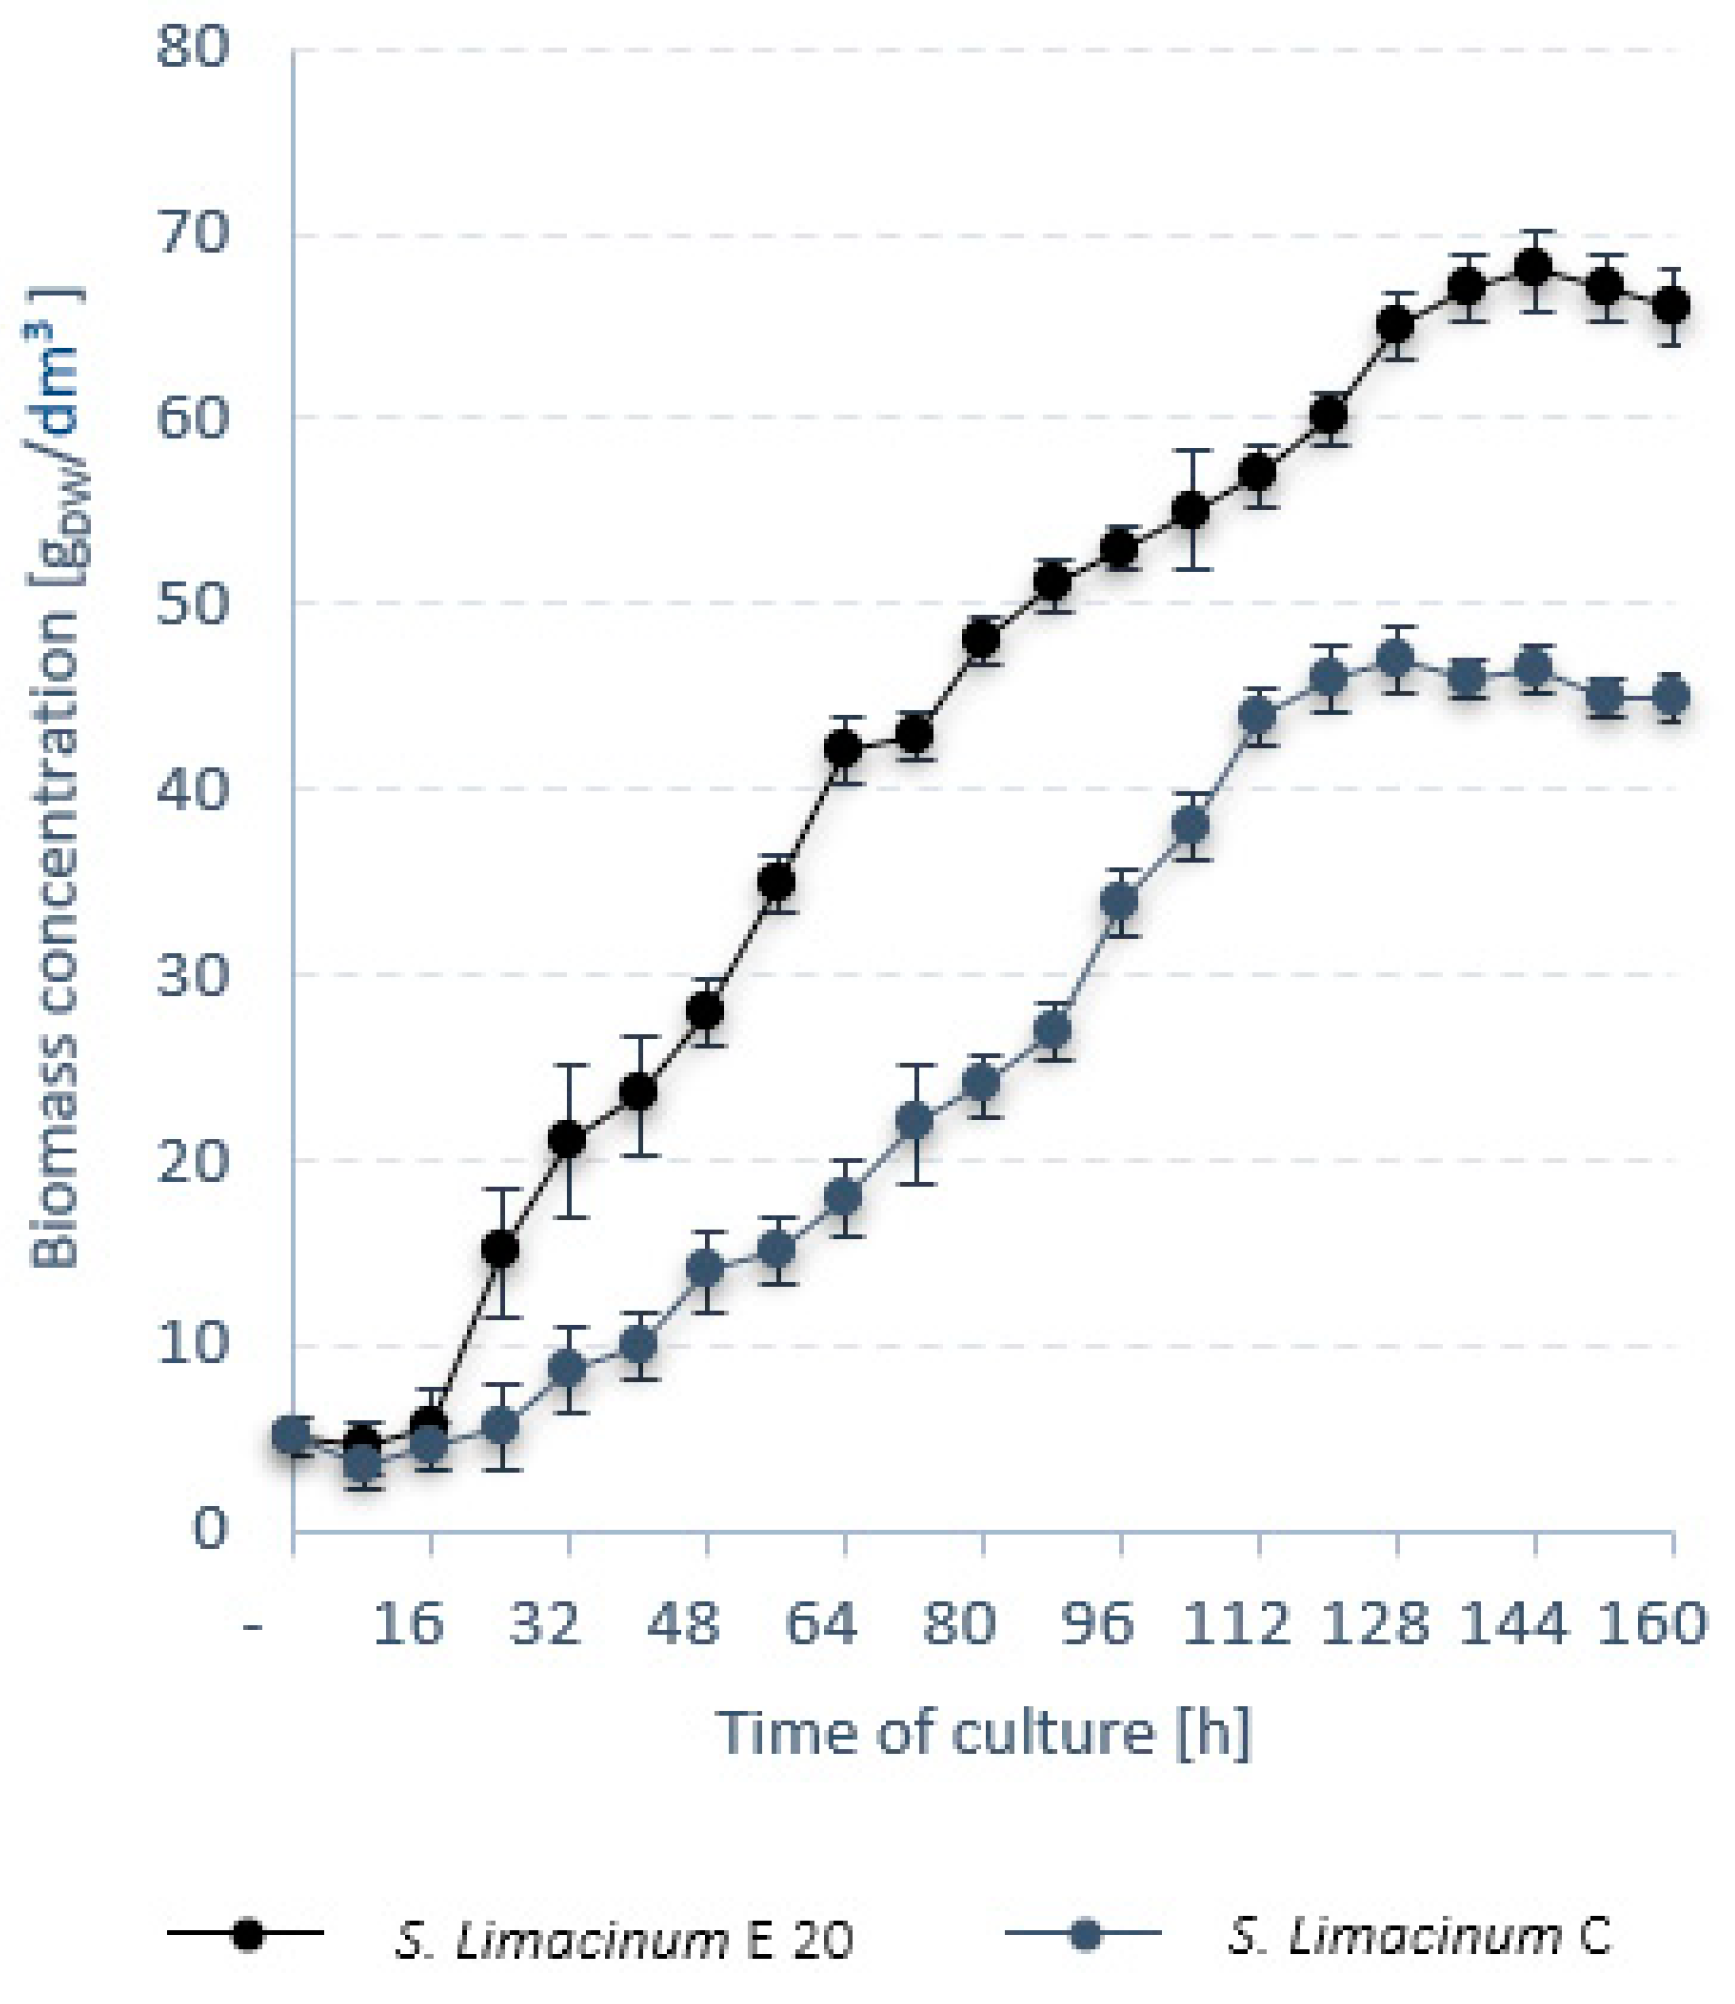
| Unit | S. limacinum E20 | S. limacinum C | |
|---|---|---|---|
| Dry weight | gDW/dm3 | 68.0 ± 0.3 | 47.0 ± 0.4 |
| rDW | gDW/dm3·h | 0.47 ± 0.1 | 0.36 ± 0.1 |
| rLIP | g/dm3·h | 0.21 ± 0.2 | 0.12 ± 0.1 |
| Lipids | % DW | 48 ± 1.2 | 42 ± 0.9 |
| Proteins | % DW | 15 ± 0.5 | 22 ± 0.8 |
| Carbohydrates | % DW | 22 ± 0.3 | 23 ± 0.5 |
| Ash | % DW | 15 ± 0.3 | 13 ± 0.2 |
| C14:0 | % SCFA | 3.03 ± 0.5 | 2.19 ± 0.6 |
| C16:0 | % SCFA | 61.02 ± 0.4 | 54.24 ± 0.4 |
| C18:0 | % SCFA | 3.33 ± 0.3 | 2.87 ± 0.5 |
| C22:5 | % SCFA | 5.23 ± 0.4 | 10.29 ± 0.9 |
| C22:6 | % SCFA | 26.24 ± 1.1 | 31.23 ± 0.7 |
| Culture | no. | 1 | 2 | 3 | 4 | 5 | 6 | 7 | 8 | 9 | 10 | 11 | 12 |
|---|---|---|---|---|---|---|---|---|---|---|---|---|---|
| Dry weight | gDW/dm3 | 72.2 | 73.1 | 75.2 | 74.3 | 68.3 | 31.8 | 22.3 | 73.4 | 75.1 | 52.0 | 67.5 | 74.0 |
| Lipids | g/dm3 | 37.3 | 30.0 | 41.4 | 39.0 | 28.0 | 22.3 | 21.0 | 38.5 | 40.0 | 25.0 | 39.1 | 37.0 |
| Variable | ||||||||||
|---|---|---|---|---|---|---|---|---|---|---|
| Dry Cell Weight | A | B | C | D | E | F | G | H | I | J |
| Effect | 10.37 | 14.20 | 19.93 | 23.23 | 17.37 | 19.57 | 12.53 | 20.97 | 42.43 | 23.10 |
| F value | 10.28 | 19.29 | 38.01 | 51.63 | 28.85 | 36.62 | 15.03 | 42.05 | 172.23 | 51.04 |
| p level | 0.192 | 0.143 | 0.102 | 0.088 | 0.117 | 0.104 | 0.161 | 0.097 | 0.048 | 0.089 |
| Lipid Concentration | A | B | C | D | E | F | G | H | I | J |
| Effect | 9.43 | 9.60 | 8.20 | 15.33 | 10.03 | 6.97 | 10.60 | 10.97 | 18.90 | 11.23 |
| F value | 30.79 | 31.89 | 23.27 | 81.35 | 34.83 | 16.79 | 38.88 | 41.62 | 123.60 | 43.66 |
| p level | 0.114 | 0.112 | 0.130 | 0.070 | 0.107 | 0.152 | 0.101 | 0.098 | 0.057 | 0.096 |
| No ofExperiment | Variable Code | Dry Weight (gDW/dm3) | Lipid Concentration (g/dm3) | |||
|---|---|---|---|---|---|---|
| Z1 | Z2 | Z3 | Z4 | |||
| 1 | −1 | −1 | −1 | −1 | 74.6 | 33.0 |
| 2 | 1 | −1 | −1 | −1 | 82.9 | 48.8 |
| 3 | −1 | 1 | −1 | −1 | 75.0 | 49.0 |
| 4 | 1 | 1 | −1 | −1 | 82.3 | 45.2 |
| 5 | −1 | −1 | 1 | −1 | 75.0 | 31.8 |
| 6 | 1 | −1 | 1 | −1 | 82.5 | 46.4 |
| 7 | −1 | 1 | 1 | −1 | 80.0 | 47.3 |
| 8 | 1 | 1 | 1 | −1 | 83.2 | 44.0 |
| 9 | −1 | −1 | −1 | 1 | 75.1 | 33.3 |
| 10 | 1 | −1 | −1 | 1 | 81.1 | 42.2 |
| 11 | −1 | 1 | −1 | 1 | 79.1 | 46.0 |
| 12 | 1 | 1 | −1 | 1 | 84.2 | 49.0 |
| 13 | −1 | −1 | 1 | 1 | 75.0 | 47.0 |
| 14 | 1 | −1 | 1 | 1 | 82.9 | 47.5 |
| 15 | −1 | 1 | 1 | 1 | 80.4 | 47.8 |
| 16 | 1 | 1 | 1 | 1 | 82.2 | 46.2 |
| 17 | −2 | 0 | 0 | 0 | 75.0 | 45.0 |
| 18 | 2 | 0 | 0 | 0 | 82.5 | 37.2 |
| 19 | 0 | −2 | 0 | 0 | 82.4 | 45.7 |
| 20 | 0 | 2 | 0 | 0 | 84.5 | 43.7 |
| 21 | 0 | 0 | −2 | 0 | 84.1 | 47.8 |
| 22 | 0 | 0 | 2 | 0 | 83.4 | 46.4 |
| 23 | 0 | 0 | 0 | −2 | 83.9 | 50.1 |
| 24 | 0 | 0 | 0 | 2 | 83.5 | 48.7 |
| 25 | 0 | 0 | 0 | 0 | 82.7 | 48.8 |
| 26 | 0 | 0 | 0 | 0 | 81.6 | 47.9 |
| 27 | 0 | 0 | 0 | 0 | 82.1 | 48.0 |
| 28 | 0 | 0 | 0 | 0 | 81.9 | 48.5 |
| 29 | 0 | 0 | 0 | 0 | 81.0 | 48.0 |
| 30 | 0 | 0 | 0 | 0 | 80.4 | 47.0 |
| Variable | Dry Weight (gDW/dm3) | Lipid Concentration (g/dm3) | ||||
|---|---|---|---|---|---|---|
| Estimate | F Value | p-Value | Estimate | F Value | p-Value | |
| Z0 | 81.61 | 48.03 | ||||
| Z1-Temperature | 2.588 | 38.552 | 0.000 | 0.771 | 0.800 | 0.385 |
| Z2-Glycerol level | 0.896 | 4.621 | 0.048 | 1.688 | 3.835 | 0.069 |
| Z3-Oxygen saturation | 0.229 | 0.302 | 0.590 | 0.363 | 0.177 | 0.680 |
| Z4-Yeast extract | 0.154 | 0.137 | 0.717 | 0.446 | 0.268 | 0.612 |
| Z1 Z2 | −0.769 | 2.269 | 0.153 | −2.844 | 7.260 | 0.017 |
| Z1 Z3 | −0.394 | 0.595 | 0.452 | −0.856 | 0.658 | 0.430 |
| Z1 Z4 | −0.344 | 0.454 | 0.511 | −0.781 | 0.548 | 0.471 |
| Z2 Z3 | 0.219 | 0.184 | 0.674 | −1.206 | 1.306 | 0.271 |
| Z2 Z4 | 0.394 | 0.595 | 0.452 | −0.406 | 0.148 | 0.706 |
| Z3 Z4 | −0.306 | 0.360 | 0.557 | 1.531 | 2.105 | 0.167 |
| Z12 | −1.166 | 8.941 | 0.009 | −1.991 | 6.098 | 0.026 |
| Z22 | 0.009 | 0.001 | 0.981 | −1.091 | 1.831 | 0.196 |
| Z32 | 0.084 | 0.047 | 0.832 | −0.491 | 0.370 | 0.552 |
| Z42 | 0.072 | 0.034 | 0.856 | 0.084 | 0.011 | 0.918 |
| Culture Conditions | Dry Weight (gDW/dm3) | rDW (gDW/dm3xh) | |
|---|---|---|---|
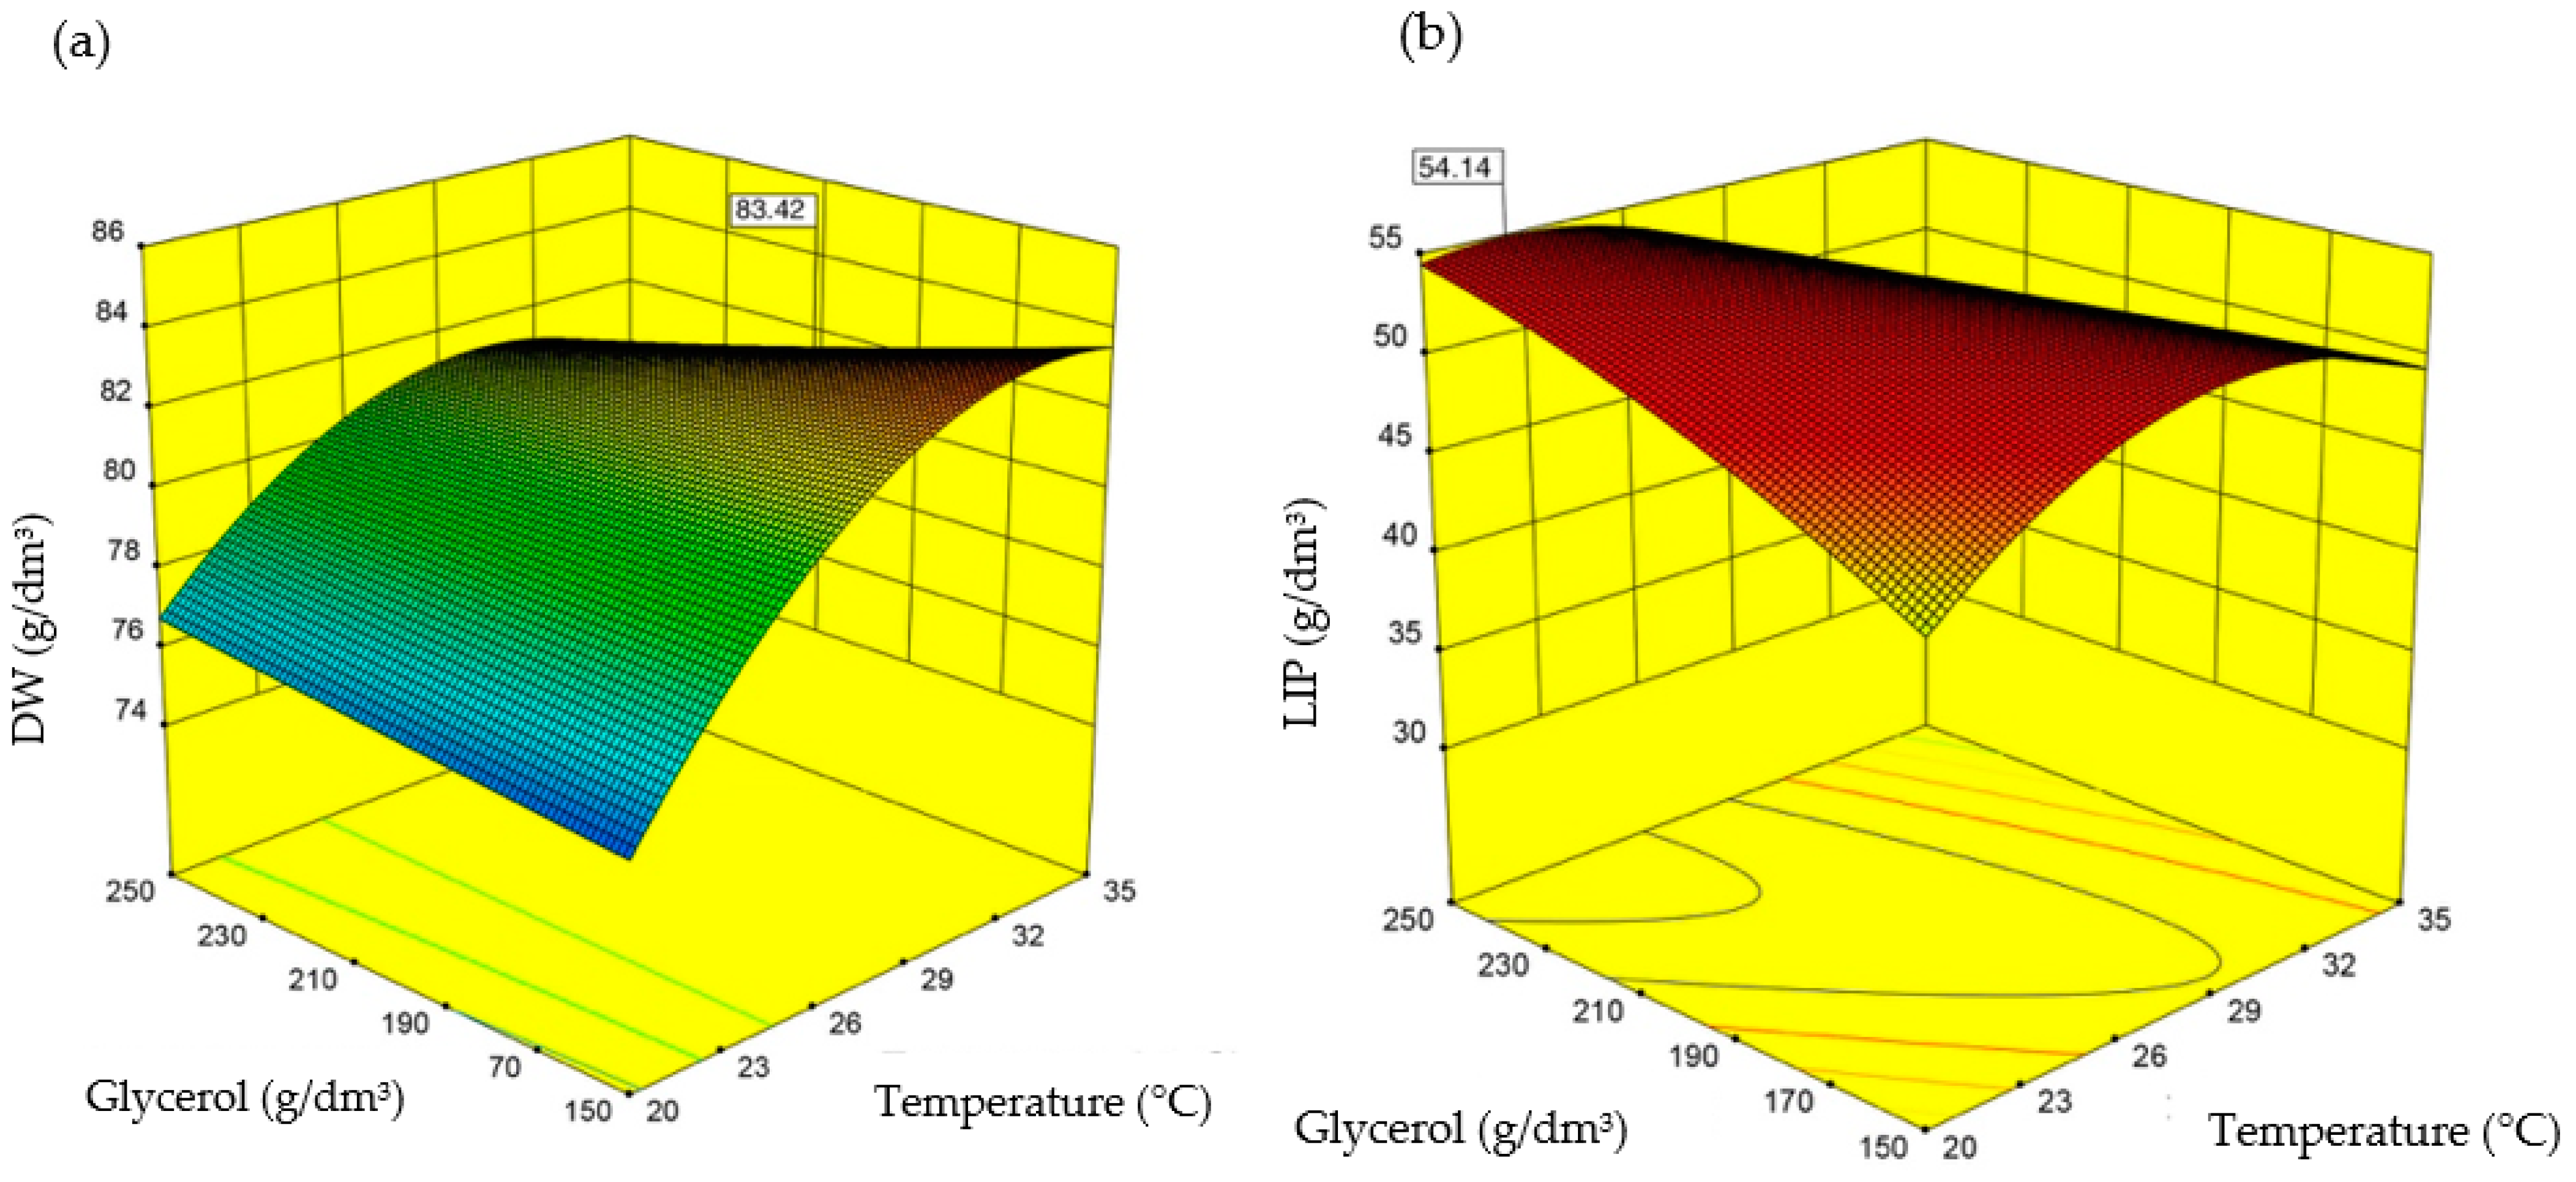
| Optimal values for dry biomass production | Predicted value | 83.4 | - |
| Experimental value | 84.0 ± 0.11 | 0.66 | |
| Error (%) | +0.6 | - | |
| Culture Conditions | Lipid Concentration (g/dm3) | rLIP (g/dm3xh) | |
| Optimal values for lipid accumulation | Predicted value | 54.1 | - |
| Experimental value | 54.8 ± 0.1 | 0.38 | |
| Error (%) | +1.2 | - |
Publisher’s Note: MDPI stays neutral with regard to jurisdictional claims in published maps and institutional affiliations. |
© 2022 by the authors. Licensee MDPI, Basel, Switzerland. This article is an open access article distributed under the terms and conditions of the Creative Commons Attribution (CC BY) license (https://creativecommons.org/licenses/by/4.0/).
Share and Cite
Talbierz, S.; Dębowski, M.; Kujawska, N.; Kazimierowicz, J.; Zieliński, M. Optimization of Lipid Production by Schizochytrium limacinum Biomass Modified with Ethyl Methane Sulfonate and Grown on Waste Glycerol. Int. J. Environ. Res. Public Health 2022, 19, 3108. https://doi.org/10.3390/ijerph19053108
Talbierz S, Dębowski M, Kujawska N, Kazimierowicz J, Zieliński M. Optimization of Lipid Production by Schizochytrium limacinum Biomass Modified with Ethyl Methane Sulfonate and Grown on Waste Glycerol. International Journal of Environmental Research and Public Health. 2022; 19(5):3108. https://doi.org/10.3390/ijerph19053108
Chicago/Turabian StyleTalbierz, Szymon, Marcin Dębowski, Natalia Kujawska, Joanna Kazimierowicz, and Marcin Zieliński. 2022. "Optimization of Lipid Production by Schizochytrium limacinum Biomass Modified with Ethyl Methane Sulfonate and Grown on Waste Glycerol" International Journal of Environmental Research and Public Health 19, no. 5: 3108. https://doi.org/10.3390/ijerph19053108
APA StyleTalbierz, S., Dębowski, M., Kujawska, N., Kazimierowicz, J., & Zieliński, M. (2022). Optimization of Lipid Production by Schizochytrium limacinum Biomass Modified with Ethyl Methane Sulfonate and Grown on Waste Glycerol. International Journal of Environmental Research and Public Health, 19(5), 3108. https://doi.org/10.3390/ijerph19053108