
Academic Self-Concept Dramatically Declines in Secondary School: Personal and Contextual Determinants

 , ,
, ,
Abstract
:1. Introduction
2. Materials and Methods
2.1. Participants
2.2. Instruments
2.2.1. Academic Self-Concept
2.2.2. Background Variables
2.2.3. Repetition and Schooling Pathway
- 0.
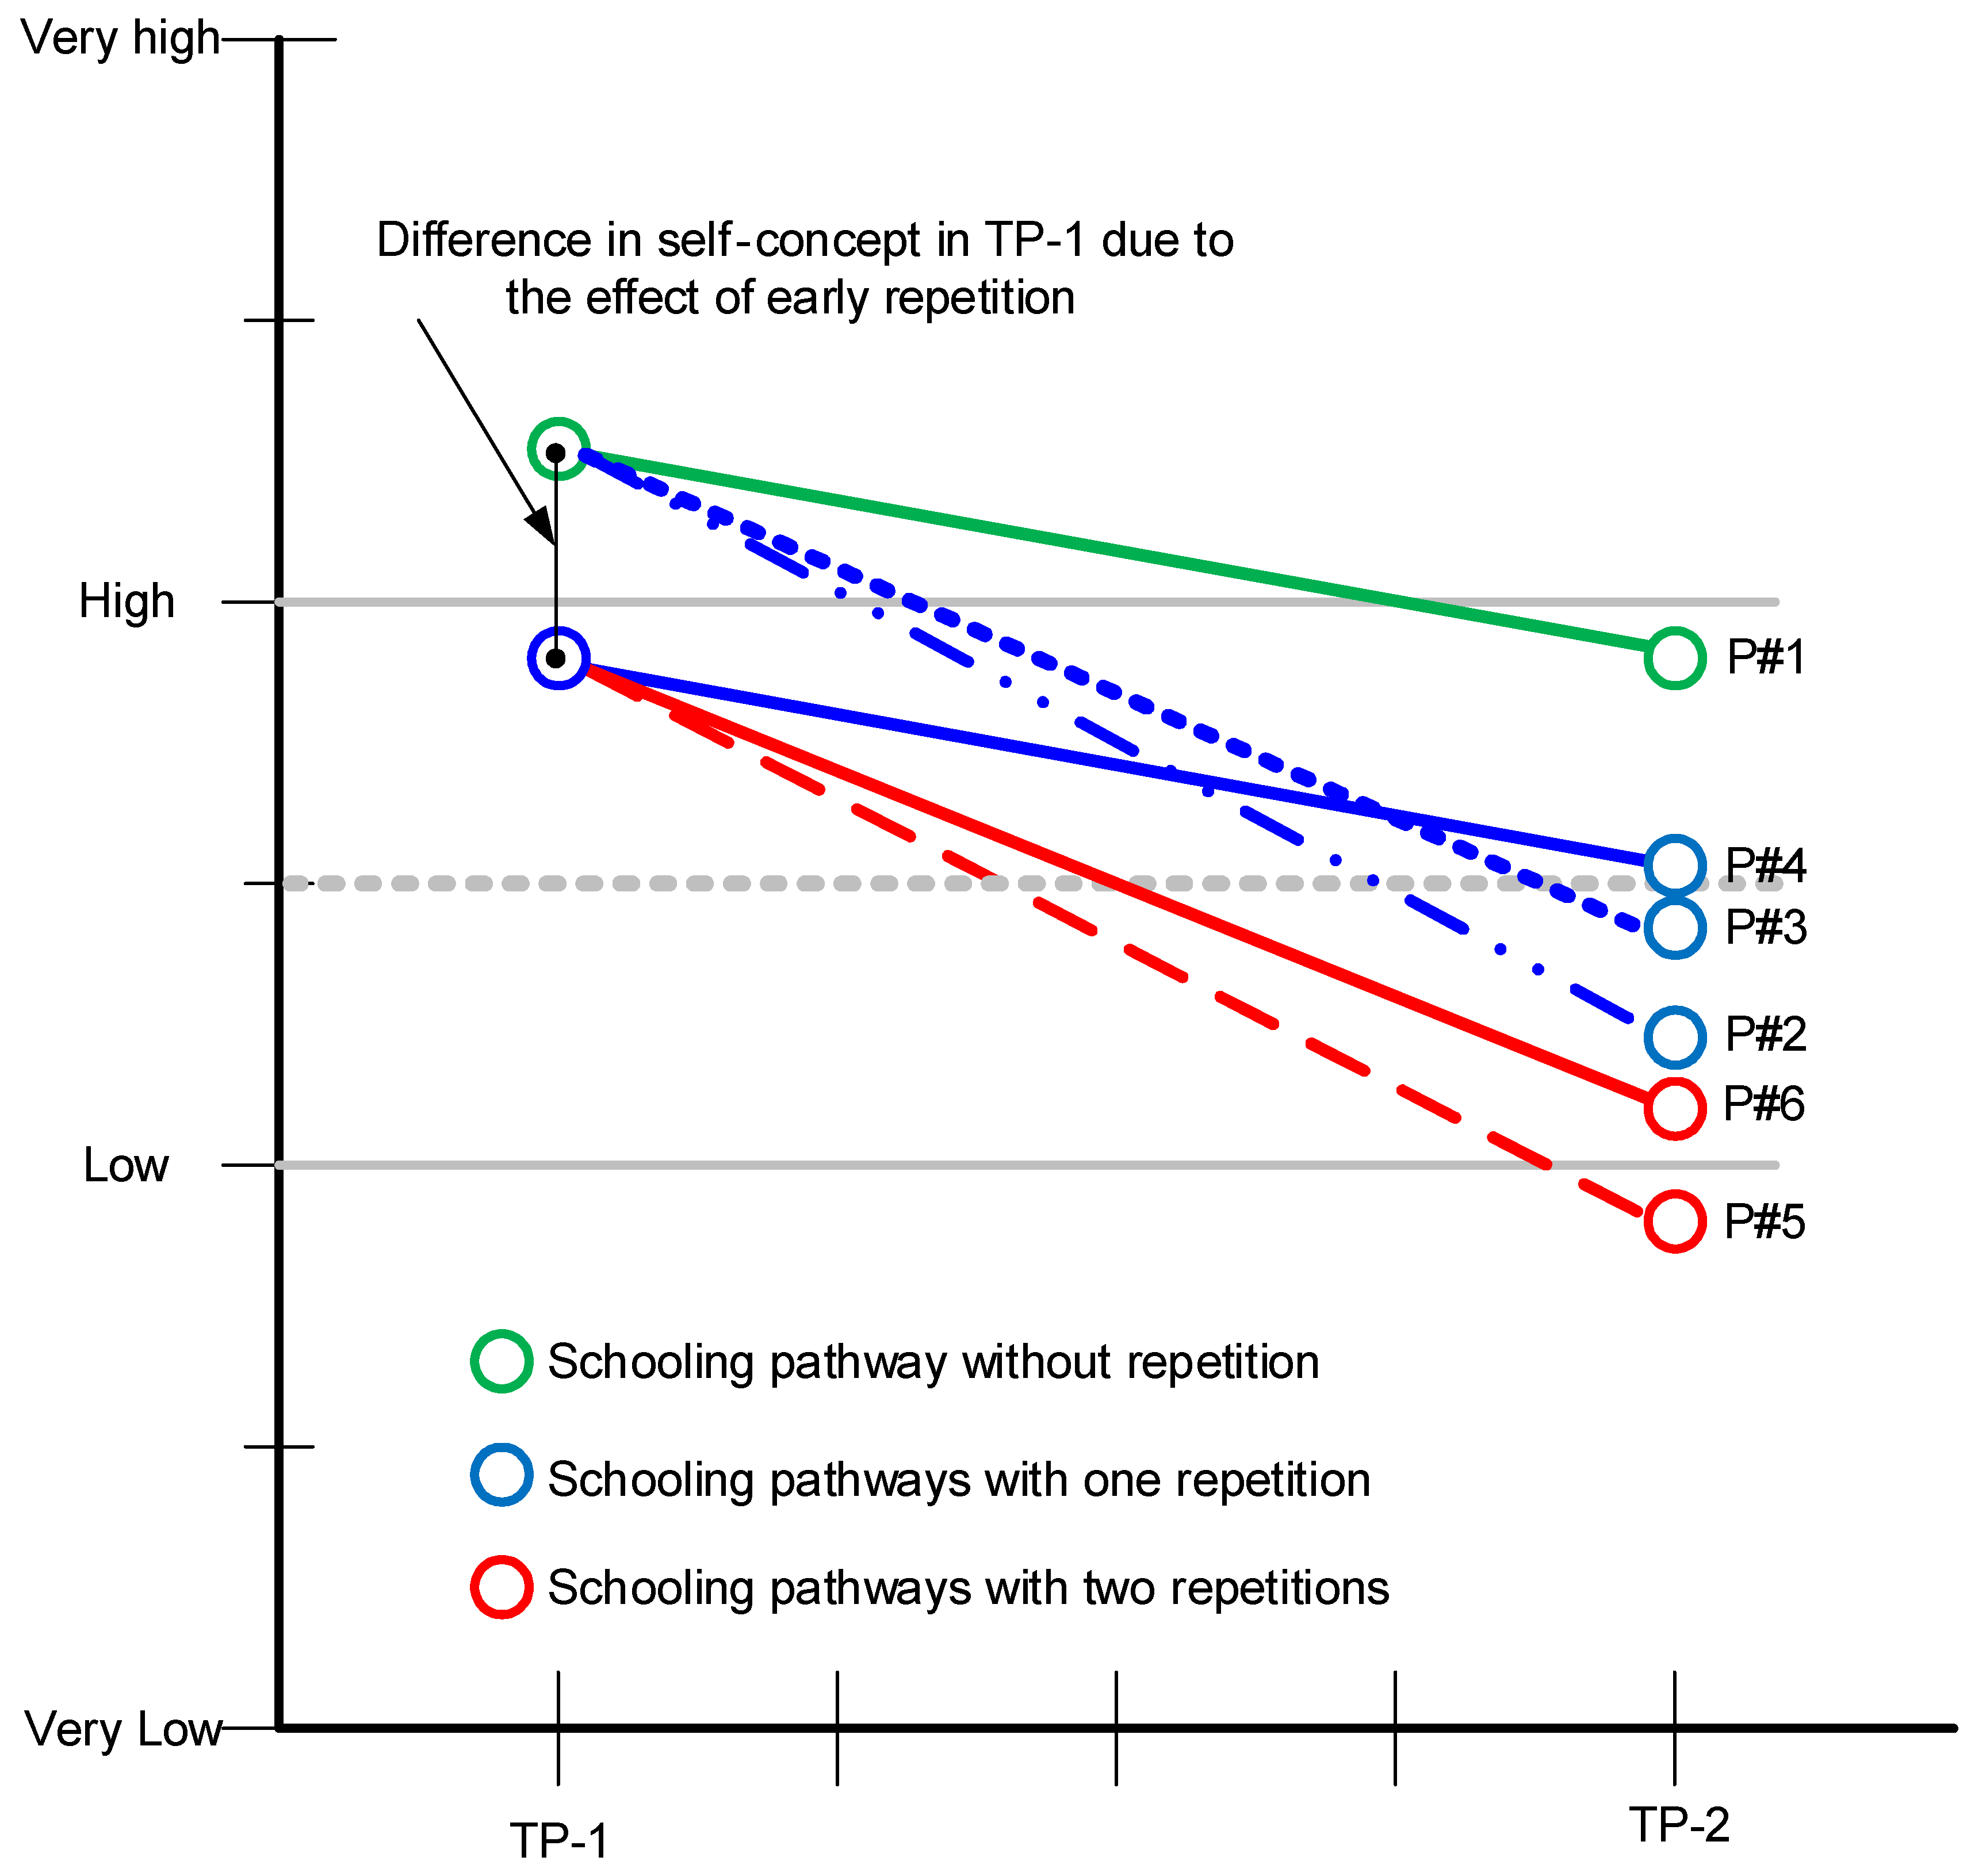
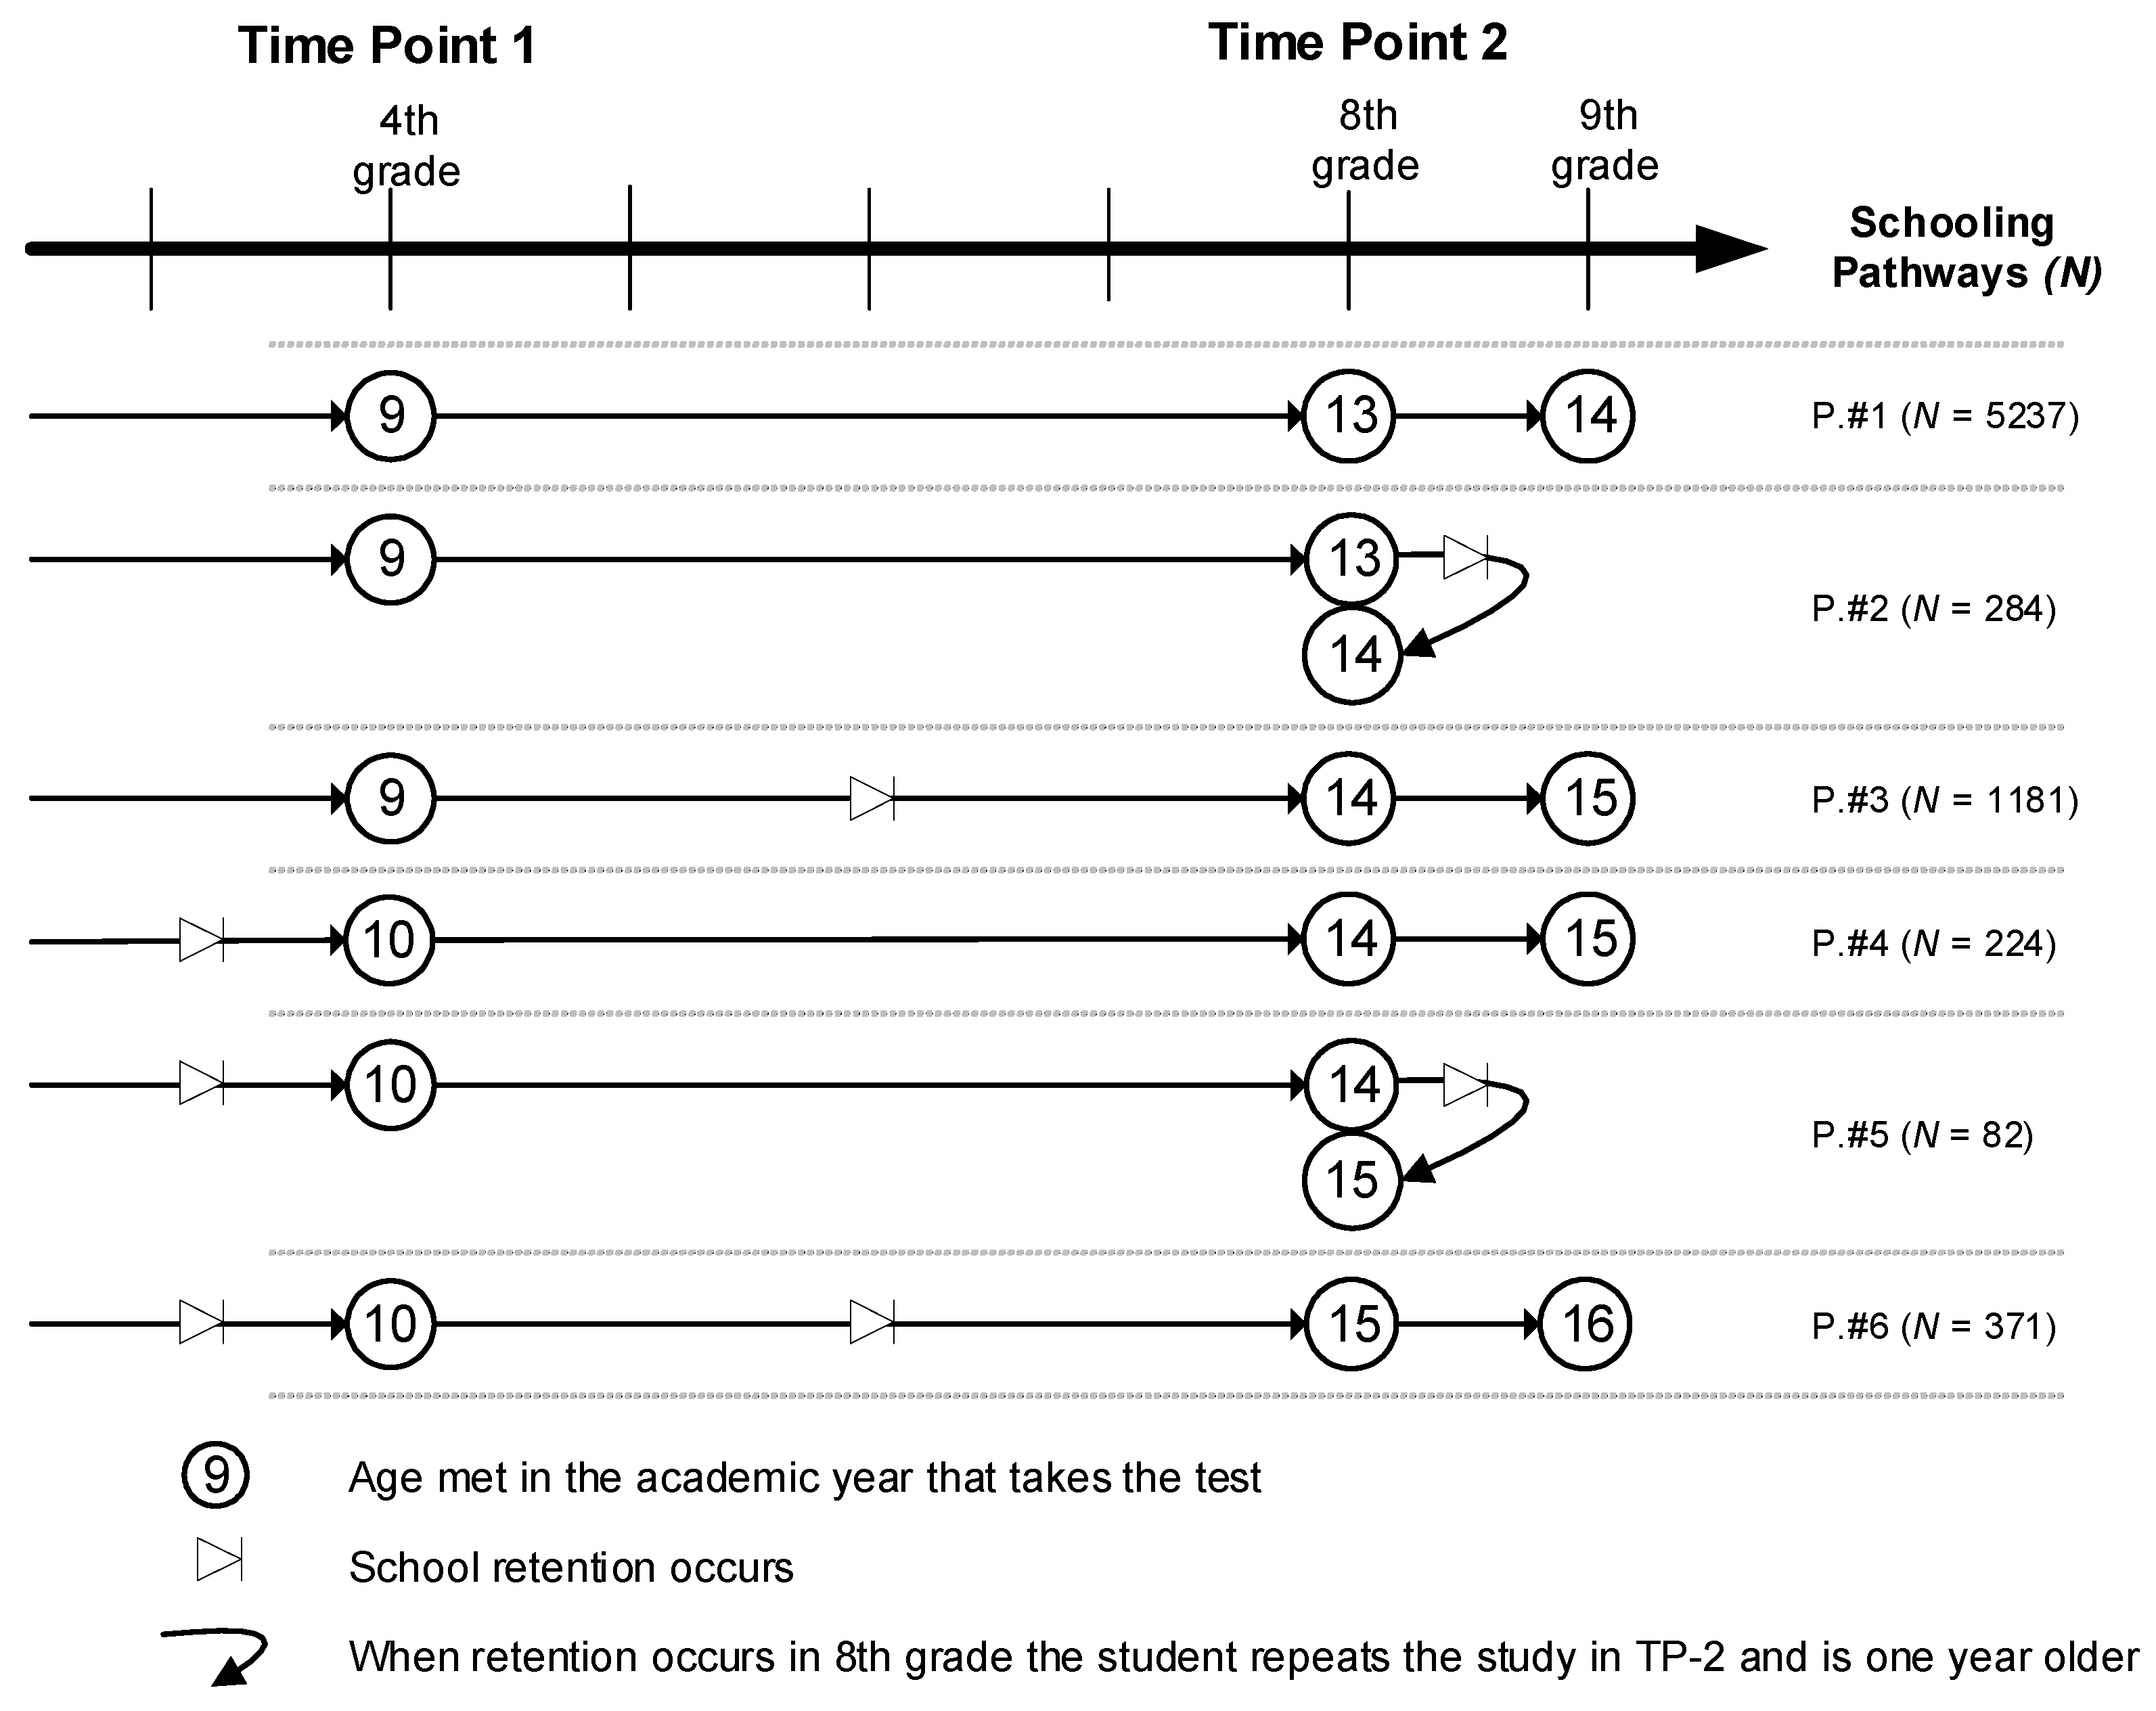
- Pathway 1: Normal progress. The student progresses through their schooling adequately in line with Spanish norms. They begin at age 9 in 4th grade primary education (T1 in the study) and start 8th grade (compulsory secondary education) at age 13 (T2). When they complete the school year corresponding to T2, they progress to the 9th grade. This profile includes the majority (71%) of students.
- 1.
- Pathway 2: First repetition on completion of 8th grade. This profile has the same characteristics as pathway 1, except that the student repeats the year at the end of the 8th grade, starting the following year at the same level. For these students, the self-concept measure used at T2 is estimated during the year they are repeating. This group represented 3.9% of the students.
- 2.
- Pathway 3: Repetition between 4th and 7th grade. These students were 9 years old at T1; however, they repeated a school year in one of the subsequent years, meaning that, at T2, they were 14. This group covered 16% of the students.
- 3.
- Pathway 4: Early repetition. These students repeated a school year before they began 4th grade, and so at T1 they were 10 years old. They did not repeat any school years between the two time-points and, at T2, they were 14 years old. At the end of that school year, they progressed to 9th grade. This group represented 3% of the students.
- 4.
- Pathway 5: Early repetition and second repetition in 8th grade. This group had the same characteristics as students in pathway 4, except that, at the end of the 8th grade they repeated the year, and so at T2 they were 15 years old. As in pathway 2, self-concept was assessed during the year they were repeating. This was the smallest group, with 1.1% of the students.
- 5.
- Pathway 6: Early repetition and second repetition between 4th and 8th grade. These students had two repeated years, the first at some time before they began 4th grade, meaning that they were 10 years old at T1. Subsequently, they repeated another year, meaning that, at T2, they were 15 years old. At the end of 8th grade, they progressed to 9th grade, as in Spain, students can only repeat two years during compulsory education. This group represented 5% of the sample.
2.3. Procedure
2.4. Data Analysis
3. Results
4. Discussion
5. Conclusions
Author Contributions
Funding
Institutional Review Board Statement
Informed Consent Statement
Data Availability Statement
Acknowledgments
Conflicts of Interest
References
- Álvarez-Díaz, M.; Gallego-Acedo, C.; Fernández-Alonso, R.; Muñiz, J.; Fonseca-Pedrero, E. Network analysis: An alternative to classic approaches for education systems evaluation. Psicol. Educ. 2021. [Google Scholar] [CrossRef]
- Beaton, A.; Mullis, I.; Martin, M.; Gonzalez, E.; Kelly, D.; Smith, T. Mathematics Achievement in the Middle School Years: IEA’s Third International Mathematics and Science Study (TIMSS); Center for the Study of Testing, Evaluation, and Educational Policy, Boston College: Chestnut Hill, MA, USA, 1996. [Google Scholar]
- Garaigordobil, M.; Berrueco, L. Self-concept in 5-year-old children: Relationships with intelligence, neuropsychological maturity, creativity, altruism and empathy. J. Study Educ. Dev. 2007, 30, 551–564. [Google Scholar] [CrossRef]
- García-Crespo, F.J.; Fernández-Alonso, R.; Muñiz, J. Academic resilience in European countries: The role of teachers, families, and student profiles. PLoS ONE 2021, 16, e0253409. [Google Scholar] [CrossRef]
- Hattie, J. Visible Learning: A Synthesis of Over 800 Meta-Analyses Relating to Achievement; Routledge: London, UK, 2009. [Google Scholar]
- Marsh, H.W.; Hau, K.-T. Big-Fish-Little-Pond effect on academic self-concept: A cross-cultural (26-country) test of the negative effects of academically selective schools. Am. Psychol. 2003, 58, 364–376. [Google Scholar] [CrossRef] [PubMed]
- Möller, J.; Zitzmann, S.; Helm, F.; Machts, N.; Wolff, F. A meta-analysis of relations between achievement and self-concept. Rev. Res. Educ. 2020, 90, 376–419. [Google Scholar] [CrossRef]
- Morales-Vives, F.; Camps, E.; Dueñas, J.M. Predicting academic achievement in adolescents: The role of maturity, intelligence and personality. Psicothema 2020, 32, 84–91. [Google Scholar] [CrossRef] [PubMed]
- Mullis, I.V.S.; Martin, M.O.; Foy, P. IEA’s TIMSS 2003 International Report on Achievement in the Mathematics Cognitive Domains; TIMSS & PIRLS International Study Center, Boston College: Chestnut Hill, MA, USA, 2005. [Google Scholar]
- Mullis, I.V.S.; Martin, M.O.; Foy, P.; Hooper, M. TIMSS 2015 International Results in Mathematics; TIMSS & PIRLS International Study Center, Boston College: Chestnut Hill, MA, USA, 2016. [Google Scholar]
- Richardson, M.; Abraham, C.; Bond, R. Psychological correlates of university students’ academic performance: A systematic review and meta-analysis. Psychol. Bull. 2012, 138, 353–387. [Google Scholar] [CrossRef] [PubMed] [Green Version]
- Stankov, L. Noncognitive predictors of intelligence and academic achievement: An important role of confidence. Personal. Individ. Differ. 2013, 55, 727–732. [Google Scholar] [CrossRef]
- Stankov, L.; Morony, S.; Lee, Y.P. Confidence: The best non-cognitive predictor of academic achievement? J. Exp. Child. Psychol. 2014, 34, 9–28. [Google Scholar] [CrossRef]
- Suárez-Álvarez, J.; Fernández-Alonso, R.; Muñiz, J. Self-concept, motivation, expectations, and socioeconomic level as predictors of academic performance in mathematics. Learn. Individ. Differ. 2014, 30, 118–123. [Google Scholar] [CrossRef]
- Harter, S. Emerging self-processes during childhood and adolescence. In Handbook of Self and Identity; Leary, M.R., Tangney, J.P., Eds.; The Guilford Press: New York, NY, USA, 2012; pp. 680–715. [Google Scholar]
- Koivuhovi, S.; Marsh, H.W.; Dicke, T.; Sahdra, B.; Guo, J.; Parker, P.D.; Vainikainen, M.P. Academic self-concept formation and peer-group contagion: Development of the big-fish-little-pond effect in primary-school classrooms and peer groups. J. Educ. Psychol. 2020, 114, 198–213. [Google Scholar] [CrossRef]
- Marsh, H.W. The big-fish-little-pond effect on academic self-concept. J. Educ. Psychol. 1987, 79, 280–295. [Google Scholar] [CrossRef]
- Marsh, H.W.; Pekrun, R.; Parker, P.D.; Murayama, K.; Guo, J.; Dicke, T.; Lichtenfeld, S. Long-term positive effects of repeating a year in school: Six-year longitudinal study of self-beliefs, anxiety, social relations, school grades, and test scores. J. Educ. Psychol. 2017, 109, 425–438. [Google Scholar] [CrossRef]
- Marsh, H.W.; Xu, K.M.; Parker, P.D.; Hau, K.T.; Pekrun, R.; Elliot, A.; Guo, J.; Dicke, T.; Basarkod, G. Moderation of the big-fish-little-pond effect: Juxtaposition of evolutionary (darwinian-economic) and achievement motivation theory predictions based on a delphi approach. Educ. Psychol. Rev. 2021, 33, 1353–1378. [Google Scholar] [CrossRef]
- Wolff, F.; Lüdtke, O.; Helm, F.; Möller, J. Integrating the big-fish-little-pond effect, the basking-in-reflected-glory effect, and the internal/external frame of reference model predicting students’ individual and collective academic self-concepts. Contemp. Educ. Psychol. 2021, 65, 101952. [Google Scholar] [CrossRef]
- Eccles, J.; Wigfield, A.; Harold, R.D.; Blumenfeld, P. Age and gender differences in children’s self-and task perceptions during elementary school. Child Dev. 1993, 64, 830–847. [Google Scholar] [CrossRef] [PubMed]
- Galindo-Domínguez, H. Estandarización por curso y género de la Escala de Autoconcepto AF-5 en Educación Primaria. Psicol. Educ. 2019, 25, 117–125. [Google Scholar] [CrossRef]
- Grygiel, P.; Modzelewski, M.; Pisarek, J. Academic self-concept and achievement in Polish primary schools: Cross-lagged modelling and gender-specific effects. Eur. J. Psychol. Educ. 2017, 32, 407–429. [Google Scholar] [CrossRef] [Green Version]
- Herrera, L.; Al-Lal, M.; Mohamed, L. Academic achievement, self-concept, personality and emotional intelligence in primary education. Analysis by gender and cultural group. Front. Psychol. 2020, 10, 3075. [Google Scholar] [CrossRef] [PubMed]
- Malo-Cerrato, S.; Bataller-Sallent, S.; Casas-Aznar, F.; Gras-Pérez, M.E.; González-Carrasco, M. Psychometric analysis of the AF5 multidimensional scale of self-concept in a sample of adolescents and adults in Catalonia. Psicothema 2011, 23, 871–878. [Google Scholar] [PubMed]
- Marsh, H.W. Age and sex effects in multiple dimensions of self-concept: Preadolescence to early adulthood. J. Educ. Psychol. 1989, 81, 417–430. [Google Scholar] [CrossRef]
- Antonio-Agirre, I.; Sáez, I.A.; Santos, A.S. The influence of socio-economic and cultural status on the relationship between self-concept and perceived emotional intelligence in adolescence. Eur. J. Educ. Educ. Psychol. 2020, 13, 33–48. [Google Scholar] [CrossRef]
- Chohan, B.I.; Khan, R.M. Impact of parental support on the academic performance and self concept of the student. J. Res. Educ. Sci. 2010, 4, 14–26. [Google Scholar]
- Crampton, A.; Hall, J. Unpacking socio-economic risks for reading and academic self-concept in primary school: Differential effects and the role of the preschool home learning environment. Br. J. Educ. Psychol. 2017, 87, 365–382. [Google Scholar] [CrossRef] [PubMed]
- Easterbrook, M.J.; Kuppens, T.; Manstead, A.S. Socio-economic status and the structure of the self-concept. Br. J. Soc. Psychol. 2020, 59, 66–86. [Google Scholar] [CrossRef]
- Trusty, J.; Peck, H.I.; Mathews, J. Achievement, socio-economic status and self-concepts of fourth-grade students. Child Study J. 1994, 24, 281–298. [Google Scholar]
- Alonso-Tapia, J.; Simón, C. Differences between immigrant and national students in motivational variables and classroom-motivational-climate perception. Span. J. Psychol. 2012, 15, 61–74. [Google Scholar] [CrossRef] [PubMed] [Green Version]
- Céspedes, C.; Rubio, A.; Viñas, F.; Cerrato, S.M.; Lara-Órdenes, E.; Ríos, J. Relationship between self-concept, self-efficacy, and subjective well-being of native and migrant adolescents. Front. Psychol. 2021, 11, 3821. [Google Scholar] [CrossRef] [PubMed]
- Figueiredo, S.; Marôco, J.; Martins, M.A.; Nunes, O. Self-concept in immigrant school children and the impact of length of residence: Evidence from PISA 2015 for current educational practice. CEPS J. 2021, 11, 213–235. [Google Scholar] [CrossRef]
- Giavrimis, P.; Konstantinou, E.; Hatzichristou, C. Dimensions of immigrant students’ adaptation in the Greek schools: Self-concept and coping strategies. Intercult. Educ. 2003, 14, 423–434. [Google Scholar] [CrossRef]
- Salmela-Aro, K.; Read, S.; Minkkinen, J.; Kinnunen, J.M.; Rimpelä, A. Immigrant status, gender, and school burnout in Finnish lower secondary school students: A longitudinal study. Int. J. Behav. Dev. 2018, 42, 225–236. [Google Scholar] [CrossRef] [Green Version]
- Zinovyeva, N.; Felgueroso, F.; Vazquez, P. Immigration and student achievement in Spain: Evidence from PISA. SERIEs 2014, 5, 25–60. [Google Scholar] [CrossRef] [Green Version]
- Gaspard, H.; Lauermann, F.; Rose, N.; Wigfield, A.; Eccles, J.S. Cross-domain trajectories of students’ ability self-concepts and intrinsic values in math and language arts. Child Dev. 2020, 91, 1800–1818. [Google Scholar] [CrossRef] [Green Version]
- Nagy, G.; Watt, H.M.; Eccles, J.S.; Trautwein, U.; Lüdtke, O.; Baumert, J. The development of students’ mathematics self-concept in relation to gender: Different countries, different trajectories? J. Res. Adolesc. 2010, 20, 482–506. [Google Scholar] [CrossRef]
- Orth, U.; Dapp, L.C.; Erol, R.Y.; Krauss, S.; Luciano, E.C. Development of domain-specific self-evaluations: A meta-analysis of longitudinal studies. J. Personal. Soc. Psychol. 2021, 120, 145–172. [Google Scholar] [CrossRef] [PubMed]
- Scherrer, V.; Preckel, F. Development of motivational variables and self-esteem during the school career: A meta-analysis of longitudinal studies. Rev. Educ. Res. 2019, 89, 211–258. [Google Scholar] [CrossRef]
- De Fraine, B.; Van Damme, J.; Onghena, P. A longitudinal analysis of gender differences in academic self-concept and language achievement: A multivariate multilevel latent growth approach. Contemp. Educ. Psychol. 2007, 32, 132–150. [Google Scholar] [CrossRef]
- Fredricks, J.A.; Eccles, J.S. Children’s competence and value beliefs from childhood through adolescence: Growth trajectories in two male-sex-typed domains. Dev. Psychol. 2002, 38, 519–533. [Google Scholar] [CrossRef]
- Young, J.F.; Mroczek, D.K. Predicting intraindividual self-concept trajectories during adolescence. J. Adolesc. 2003, 26, 586–600. [Google Scholar] [CrossRef]
- Guay, F.; Larose, S.; Boivin, M. Academic self-concept and educational attainment level: A ten-year longitudinal study. Self Identity 2004, 3, 53–68. [Google Scholar] [CrossRef] [PubMed]
- Ireson, J.; Hallam, S. Academic self-concepts in adolescence: Relations with achievement and ability grouping in schools. Learn. Instr. 2009, 19, 201–213. [Google Scholar] [CrossRef]
- Twenge, J.M.; Campbell, W.K. Self-esteem and socio-economic status: A meta-analytic review. Personal. Soc. Psychol. Rev. 2002, 6, 59–71. [Google Scholar] [CrossRef]
- Hsieh, T.Y.; Liu, Y.; Simpkins, S.D. Changes in United States Latino/a high school students’ science motivational beliefs: Within group differences across science subjects, gender, immigrant status, and perceived support. Front. Psychol. 2019, 10, 380. [Google Scholar] [CrossRef] [Green Version]
- Roebers, C.M.; Schneider, W. Self-concept and anxiety in immigrant children. Int. J. Behav. Dev. 1999, 23, 125–147. [Google Scholar] [CrossRef]
- Sewasew, D.; Koester, L.S. The developmental dynamics of students’ reading self-concept and reading competence: Examining reciprocal relations and ethnic-background patterns. Learn. Individ. Differ. 2019, 73, 102–111. [Google Scholar] [CrossRef]
- Ikeda, M.; García, E. Grade repetition: A comparative study of academic and nonacademic consequences. J. Econ. Stud. 2014, 2013, 269–315. [Google Scholar] [CrossRef]
- OECD. PISA 2009 Results: What Makes a School Successful? Resources, Policies and Practices (Volume IV); OECD Publishing: Paris, France, 2010. [Google Scholar] [CrossRef]
- OECD. When Students Repeat Grades or Are Transferred out of School: What Does It Mean to Education Systems? PISA in Focus; OECD Publishing: Paris, France, 2011; Volume 6, Available online: https://www.oecd.org/pisa/pisaproducts/pisainfocus/48363440.pdf (accessed on 3 March 2022).
- OECD. PISA 2012 Results: What Makes Schools Successful? Resources, Policies and Practices (Volume IV); OECD Publishing: Paris, France, 2013. [Google Scholar] [CrossRef]
- Valbuena, J.; Mediavilla, M.; Choi, Á.; Gil, M. Effects of grade retention policies: A literature review of empirical studies applying causal inference. J. Econ. Surv. 2021, 35, 408–451. [Google Scholar] [CrossRef]
- Eurydice. Grade Retention during Compulsory Education in Europe. Regulations and Statistics; European Education and Culture Executive Agency: Brussels, Belgium, 2011. [Google Scholar] [CrossRef]
- Allen, C.S.; Chen, Q.; Willson, V.L.; Hughes, J.N. Quality of research design moderates effects of grade retention on achievement: A meta-analytic, multilevel analysis. Educ. Eval. Policy Anal. 2009, 31, 480–499. [Google Scholar] [CrossRef] [PubMed] [Green Version]
- Goos, M.; Pipa, J.; Peixoto, F. Effectiveness of grade retention: A systematic review and meta-analysis. Educ. Res. Rev. 2021, 34, 100401. [Google Scholar] [CrossRef]
- Xia, N.; Kirby, S.N. Retaining Students in Grade: A Literature Review of the Effects of Retention on Students’ Academic and Nonacademic Outcomes; RAND Technical Report: Santa Monica, CA, USA, 2009. [Google Scholar]
- Ehmke, T.; Drechsel, B.; Carstensen, C.H. Effects of grade retention on achievement and self-concept in science and mathematics. Stud. Educ. Eval. 2010, 36, 27–35. [Google Scholar] [CrossRef]
- Klapproth, F.; Schaltz, P.; Brunner, M.; Keller, U.; Fischbach, A.; Ugen, S.; Martin, R. Short-term and medium-term effects of grade retention in secondary school on academic achievement and psychosocial outcome variables. Learn. Individ. Differ. 2016, 50, 182–194. [Google Scholar] [CrossRef]
- Kretschmann, J.; Vock, M.; Lüdtke, O.; Jansen, M.; Gronostaj, A. Effects of grade retention on students’ motivation: A longitudinal study over 3 years of secondary school. J. Educ. Psychol. 2019, 111, 1432–1446. [Google Scholar] [CrossRef]
- Lamote, C.; Pinxten, M.; Van Den Noortgate, W.; Van Damme, J. Is the cure worse than the disease? A longitudinal study on the effect of grade retention in secondary education on achievement and academic self-concept. Educ. Stud. 2014, 40, 496–514. [Google Scholar] [CrossRef]
- Peixoto, F.; Monteiro, V.; Mata, L.; Sanches, C.; Pipa, J.; Almeida, L.S. “To be or not to be retained… That’s the question!” Retention, self-esteem, self-concept, achievement goals, and grades. Front. Psychol. 2016, 7, 1550. [Google Scholar] [CrossRef] [Green Version]
- Salmela-Aro, K.; Tang, X.; Symonds, J.; Upadyaya, K. Student engagement in adolescence: A scoping review of longitudinal studies 2010–2020. J. Res. Adolesc. 2021, 31, 256–272. [Google Scholar] [CrossRef] [PubMed]
- Bonvin, P.; Bless, G.; Schuepbach, M. Grade retention: Decision-making and effects on learning as well as social and emotional development. Sch. Eff. Sch. Improv. 2018, 19, 1–19. [Google Scholar] [CrossRef]
- Wu, W.; West, S.G.; Hughes, J.N. Effect of grade retention in first grade on psychosocial outcomes. J. Educ. Psychol. 2010, 102, 135–152. [Google Scholar] [CrossRef] [PubMed] [Green Version]
- Fang, J.; Huang, X.; Zhang, M.; Huang, F.; Li, Z.; Yuan, Q. The Big-Fish-Little-Pond effect on academic self-concept: A meta-analysis. Front. Psychol. 2018, 9, 1569. [Google Scholar] [CrossRef] [Green Version]
- Holmes, C.T. Grade-level retention effects: A meta-analysis of research studies. In Flunking Grades: Research and Policies on Retention; Shepard, L.A., Smith, M.L., Eds.; Falmer Press: London, UK, 1989; pp. 16–33. [Google Scholar]
- Holmes, C.T.; Matthews, K.M. The effects of nonpromotion on elementary and junior high school pupils: A meta-analysis. Rev. Educ. Res. 1984, 54, 225–236. [Google Scholar] [CrossRef]
- Jimerson, S.R. Meta-analysis of grade retention research: Implications for practice in the 21st century. Educ. Psychol. Rev. 2001, 30, 420–437. [Google Scholar] [CrossRef]
- Jimerson, S.R.; Pletcher, S.M.W.; Graydon, K.; Schnurr, B.L.; Nickerson, A.B.; Kundert, D.K. Beyond grade retention and social promotion: Promoting the social and academic competence of students. Psychol. Sch. 2006, 43, 85–97. [Google Scholar] [CrossRef]
- Fine, J.G.; Davis, J.M. Grade retention and enrollment in post-secondary education. J. Sch. Psychol. 2003, 41, 401–411. [Google Scholar] [CrossRef]
- Hughes, J.N.; Cao, Q.; West, S.G.; Smith, P.A.; Cerda, C. Effect of retention in elementary grades on dropping out of school early. J. Sch. Psychol. 2017, 65, 11–27. [Google Scholar] [CrossRef] [PubMed]
- Tafreschi, D.; Thiemann, P. Doing it twice, getting it right? The effects of grade retention and course repetition in higher education. Econ. Educ. Rev. 2016, 55, 198–219. [Google Scholar] [CrossRef]
- Suárez-Álvarez, J.; Pedrosa, I.; Lozano, L.; García-Cueto, E.; Cuesta, M.; Muñiz, J. Using reversed items in Likert scales: A questionable practice. Psicothema 2018, 30, 149–158. [Google Scholar] [CrossRef] [PubMed]
- Vigil-Colet, A.; Navarro-González, D.; Morales-Vives, F. To reverse or to not reverse Likert-type items: That is the question. Psicothema 2020, 32, 108–114. [Google Scholar] [CrossRef]
- Ferrando, P.J. Seven decades of Factor Analysis: From Yela to present day. Psicothema 2021, 33, 378–385. [Google Scholar] [CrossRef] [PubMed]
- Timmerman, M.E.; Lorenzo-Seva, U. Dimensionality assessment of ordered polytomous items with parallel analysis. Psychol. Methods 2011, 16, 209–220. [Google Scholar] [CrossRef] [PubMed]
- Ferrando, P.J.; Lorenzo-Seva, U.; Hernández-Dorado, A.; Muñiz, J. Decalogue for the factor analysis of test items. Psicothema 2022, 34, 7–17. [Google Scholar] [CrossRef] [PubMed]
- Raudenbush, S.W.; Bryk, A.S.; Cheong, Y.F.; Congdon, R.T.; du Toit, M. HLM7: Hierarchical Linear and Nonlinear Modeling; Scientific Software International: Skokie, IL, USA, 2011. [Google Scholar]
- IBM Corp. IBM SPSS Statistics for Windows; Version 24.0; [Computer Software]; IBM Corp: Armonk, NY, USA, 2016. [Google Scholar]
- Fernández-Alonso, R.; Suárez-Álvarez, J.; Muñiz, J. Imputation of missing data in educational diagnostic evaluations. Psicothema 2012, 24, 167–175. [Google Scholar] [PubMed]
- Dapp, L.C.; Roebers, C. Self-concept in kindergarten and first grade children: A longitudinal study on structure, development, and relation to achievement. Psychology 2018, 9, 1605–1629. [Google Scholar] [CrossRef] [Green Version]
- Helmke, A. From optimism to realism? Development of children’s academic self-concept from kindergarten to grade six. In Individual Development from 3 to 12. Findings from the Munich Longitudinal Study; Schneider, W., Weinert, F.E., Eds.; Cambridge University Press: Cambridge, UK, 1999; pp. 198–221. [Google Scholar]
- Fernández-Alonso, R.; Álvarez-Díaz, M.; Woitschach, P.; Suárez-Álvarez, P.; Cuesta, M. Parental involvement and academic performance: Less control and more communication. Psicothema 2017, 29, 453–461. [Google Scholar] [CrossRef] [PubMed]
- Lynch, M. Alternatives to social promotion and retention. Interchange 2013, 44, 291–309. [Google Scholar] [CrossRef]
- Consejería de Educación del Principado de Asturias. La Repetición Escolar: Hechos y Creencias [Grade Retention: Facts and Beliefs]. Informe de Evaluación, 2. Serv. De Evaluación Educ. 2016, 1–8. [Google Scholar] [CrossRef]
- Norton, M.S. Please, not another push to get tough on student retention. Plan. Chang. 2011, 42, 209–223. [Google Scholar]
- Fernández-Lasarte, O.; Ramos-Díaz, E.; Goñi-Palacios, E.; Rodríguez-Fernández, A. The role of social support in school adjustment during secondary education. Psicothema 2020, 32, 100–107. [Google Scholar] [CrossRef] [PubMed]
- Jimerson, S.R.; Pletcher, S.M.; Kerr, M. Alternatives to grade retention. Princ. Leaders. 2005, 5, 11–15. [Google Scholar]
- Postigo, Á.; Cuesta, M.; Fernández-Alonso, R.; García-Cueto, E.; Muñiz, J. Academic grit modulates school performance evolution over time: A latent transition analysis. Rev. De Psicodidáctica 2021, 26, 87–95. [Google Scholar] [CrossRef]
- Postigo, Á.; Cuesta, M.; Fernández-Alonso, R.; García-Cueto, E.; Muniz, J. Temporal stability of grit and school performance in adolescents: A longitudinal perspective. Psicol. Educ. 2021, 27, 77–84. [Google Scholar] [CrossRef]
- Yeager, D.S.; Carroll, J.M.; Buontempo, J.; Cimpian, A.; Woody, S.; Crosnoe, R.; Muller, C.; Murray, J.; Mhatre, P.; Kersting, N.; et al. Teacher mindsets help explain where a growth mindset intervention does and doesn’t work. Psychol. Sci. 2021, 33, 18–32. [Google Scholar] [CrossRef]
- Mattison, A.; Raffaele-Mendez, L.M.; Dedrick, R.; Dickinson, S.; Wingate, E.; Hanks, C. Early elementary teacher ratings of behavior as predictors of grade retention: Race, gender, and socio-economic status as potential moderators. Psychol. Sch. 2018, 55, 1171–1187. [Google Scholar] [CrossRef]
- Smith, E.J.; Pellin, B.J.; Agruso, S.A. Bright Beginnings: An Effective Literacy-Focused PreK Program for Educationally Disadvantaged Four-Year-Old Children; Educational Research Service: Asheville, NC, USA, 2003. [Google Scholar]
- Baye, A.; Inns, A.; Lake, C.; Slavin, R.E. A synthesis of quantitative research on reading programs for secondary students. Read. Res. Q. 2019, 54, 133–166. [Google Scholar] [CrossRef]
- Roderick, M.; Engel, M.; Nagaoka, J. Ending Social Promotion: Summer Bridge; Consortium on Chicago School Research: Chicago, IL, USA, 2003. [Google Scholar]
- Poggi, S. Ensuring success for all students: Extended academic support for struggling learners. Viewpoints 2003, 10, 411–451. [Google Scholar]
- Xu, J.; Nuñez, J.C.; Cunha, J.; Rosário, P. Online Homework Distraction Scale: A validation study. Psicothema 2020, 32, 469–475. [Google Scholar] [CrossRef] [PubMed]
- Usher, E.L. Contextualizing teacher motivation research. Learn. Instr. 2021, 76, 101544. [Google Scholar] [CrossRef]


| M | SD | 1 | 2 | 3 | 4 | 5 | 6 | 7 | |
|---|---|---|---|---|---|---|---|---|---|
| 1. Self-concept T1 | 2.24 | 0.64 | - | ||||||
| 2. Self-concept T2 | 1.74 | 0.75 | 0.447 | - | |||||
| 3. Socioeconomic and cultural index (ISEC) | −0.01 | 0.94 | 0.227 | 0.289 | - | ||||
| 4. Gender (1 = girl) | 0.47 | 0.50 | 0.065 | 0.060 | −0.001 | - | |||
| 5. Nationality (1 = Non-Spanish) | 0.08 | 0.27 | −0.164 | −0.124 | −0.144 | 0.008 | - | ||
| 6. Repetition before T1 (1 = yes) | 0.09 | 0.29 | −0.217 | −0.230 | −0.250 | −0.028 | 0.217 | - | |
| 7. Repetition between T1–T2 (1 = yes) | 0.22 | 0.41 | −0.363 | −0.347 | −0.284 | −0.068 | 0.201 | 0.239 | - |
| 8. Repetition at the end of T2 (1 = yes) | 0.05 | 0.22 | −0.098 | −0.208 | −0.126 | −0.040 | 0.057 | 0.109 | −0.110 |
| Model 1 | Model 2 | Model 3 | Model 4 | Model 5 | |
|---|---|---|---|---|---|
| Self-Concept (T1, γ00) | 2.24 (0.01) * | 2.22 (0.01) | 2.26 (0.01) | 2.26 (0.01) | 2.26 (0.01) |
| Intercepts (T1) | |||||
| ISEC (γ01) | 0.16 (0.01) | 0.13 (0.01) | 0.10 (0.01) | 0.10 (0.01) | |
| Girl (γ02) | 0.09 (0.01) | 0.08 (0.01) | 0.08 (0.01) | 0.08 (0.01) | |
| Non-Spanish (γ03) | −0.29 (0.02) | −0.21 (0.03) | −0.24 (0.03) | −0.25 (0.03) | |
| RepBeforeT1 (γ04) | −0.42 (0.02) | −0.42 (0.02) | −0.36 (0.02) | ||
| Slopes | |||||
| T1–T2 (γ10) | −0.51 (0.01) | −0.51 (0.01) | −0.51 (0.01) | −0.52 (0.01) | −0.40 (0.01) |
| ISEC (γ11) | 0.07 (0.01) | 0.03 (0.01) | |||
| Girl (γ12) | 0.01 (0.02) ns | −0.02 (0.02) ns | |||
| Non-Spanish (γ13) | 0.06 (0.03) p | 0.20 (0.03) | |||
| RepBeforeT1 (γ14) | 0.04 (0.03) ns | ||||
| RepBetweenT1–T2 (γ15) | −0.44 (0.02) | ||||
| RepAfterT2 (γ16) | −0.63 (0.03) | ||||
| Percentage of variance explained | |||||
| Inter-subject variance | 15.81% | 22.33% | 21.86% | 37.21% | |
| Total variance | 6.87% | 9.70% | 9.50% | 16.16% | |
| Deviance (Np) | 29,969.3 (2) | 29,237.9 (2) | 28,924.7 | 28,881.3 (2) | 28,163.3 (2) |
Publisher’s Note: MDPI stays neutral with regard to jurisdictional claims in published maps and institutional affiliations. |
© 2022 by the authors. Licensee MDPI, Basel, Switzerland. This article is an open access article distributed under the terms and conditions of the Creative Commons Attribution (CC BY) license (https://creativecommons.org/licenses/by/4.0/).
Share and Cite
Postigo, Á.; Fernández-Alonso, R.; Fonseca-Pedrero, E.; González-Nuevo, C.; Muñiz, J. Academic Self-Concept Dramatically Declines in Secondary School: Personal and Contextual Determinants. Int. J. Environ. Res. Public Health 2022, 19, 3010. https://doi.org/10.3390/ijerph19053010
Postigo Á, Fernández-Alonso R, Fonseca-Pedrero E, González-Nuevo C, Muñiz J. Academic Self-Concept Dramatically Declines in Secondary School: Personal and Contextual Determinants. International Journal of Environmental Research and Public Health. 2022; 19(5):3010. https://doi.org/10.3390/ijerph19053010
Chicago/Turabian StylePostigo, Álvaro, Rubén Fernández-Alonso, Eduardo Fonseca-Pedrero, Covadonga González-Nuevo, and José Muñiz. 2022. "Academic Self-Concept Dramatically Declines in Secondary School: Personal and Contextual Determinants" International Journal of Environmental Research and Public Health 19, no. 5: 3010. https://doi.org/10.3390/ijerph19053010