
Mapping the Morbidity Risk Associated with Coal Mining in Queensland, Australia


Abstract
:1. Introduction
2. Materials and Methods
2.1. Data
2.2. Analysis
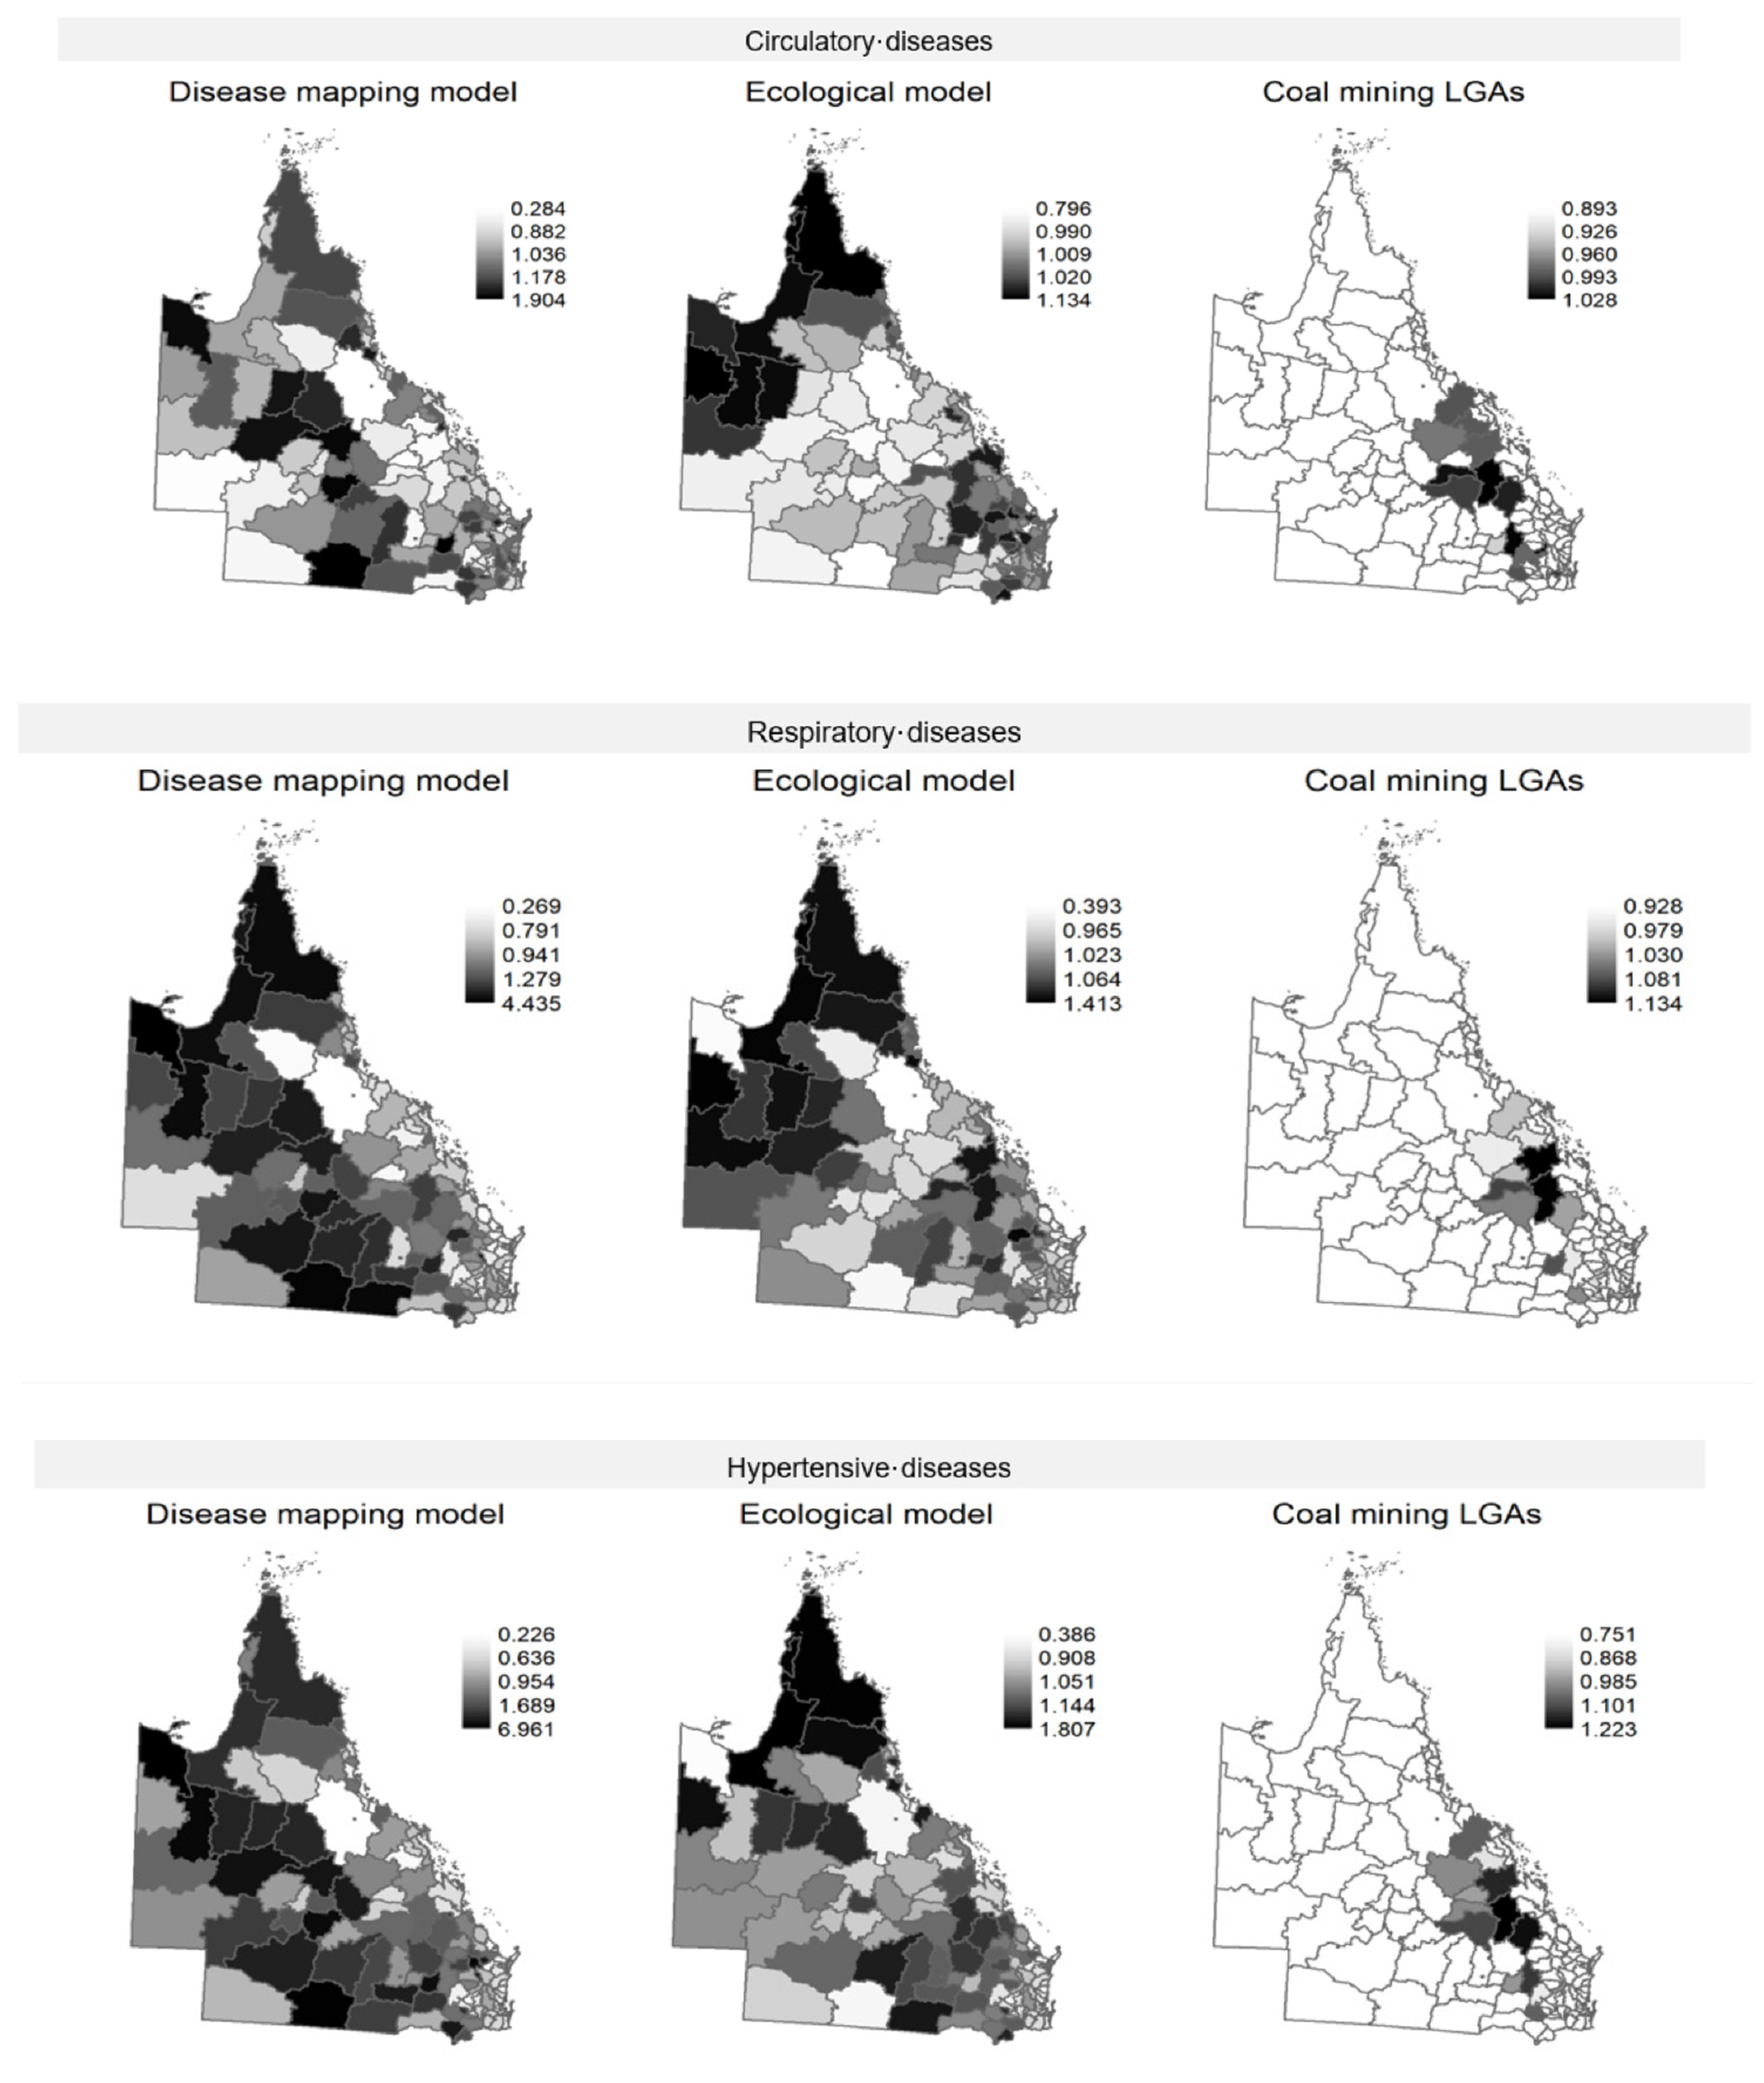
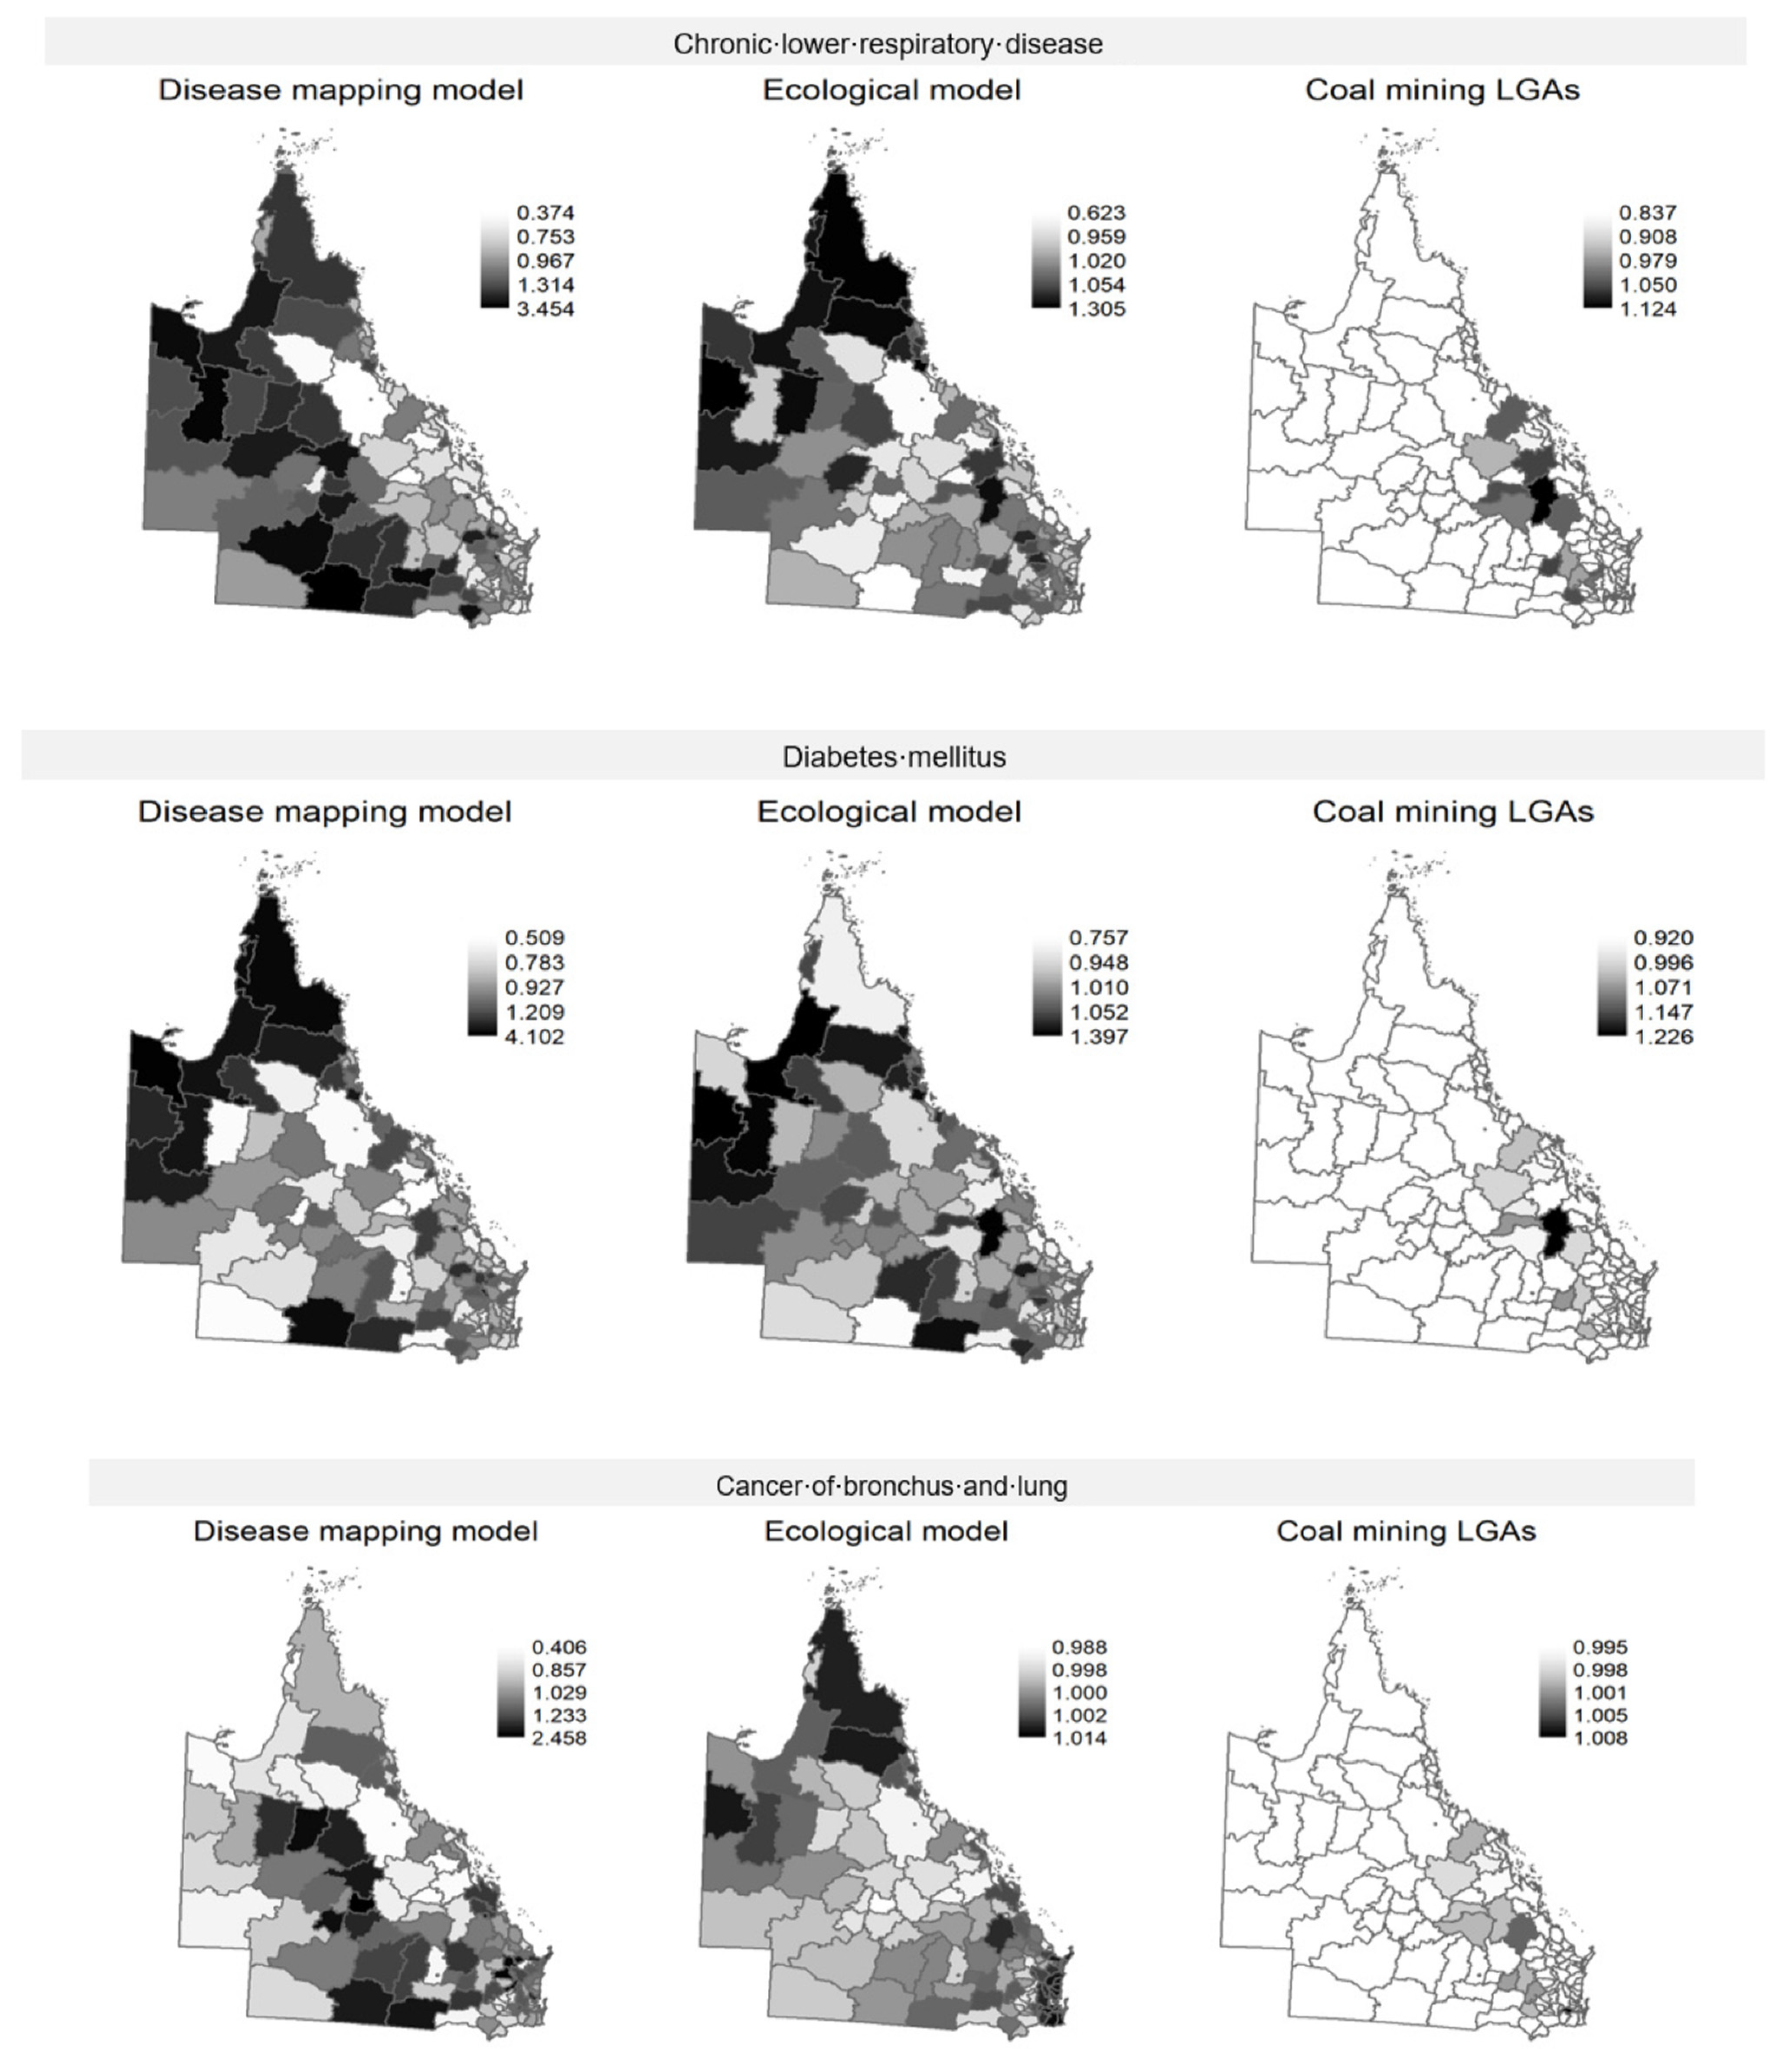
3. Results
4. Discussion
Limitations
5. Conclusions
Supplementary Materials
Author Contributions
Funding
Institutional Review Board Statement
Informed Consent Statement
Data Availability Statement
Conflicts of Interest
References
- Liu, T.; Liu, S. The impacts of coal dust on miners’ health: A review. Environ. Res. 2020, 190, 109849. [Google Scholar] [CrossRef] [PubMed]
- Stocks, P. On the Death Rates from Cancer of the Stomach and Respiratory Diseases in 1949-53 among coal miners and other male residents in counties of England and Wales. Br. J. Cancer 1962, 16, 592–598. [Google Scholar] [CrossRef] [Green Version]
- Jenkins, W.D.; Christian, W.J.; Mueller, G.; Robbins, K.T. Population cancer risks associated with coal mining: A systematic review. PLoS ONE 2013, 8, e71312. [Google Scholar] [CrossRef] [Green Version]
- Moreno, T.; Trechera, P.; Querol, X.; Lah, R.; Johnson, D.; Wrana, A.; Williamson, B. Trace element fractionation between PM10 and PM2.5 in coal mine dust: Implications for occupational respiratory health. Int. J. Coal Geol. 2019, 203, 52–59. [Google Scholar] [CrossRef]
- Su, R.; Jin, X.; Li, H.; Huang, L.; Li, Z. The mechanisms of PM2.5 and its main components penetrate into HUVEC cells and effects on cell organelles. Chemosphere 2020, 241, 125127. [Google Scholar] [CrossRef] [PubMed]
- Aneja, V.P.; Isherwood, A.; Morgan, P. Characterization of particulate matter (PM10) related to surface coal mining operations in Appalachia. Atmos. Environ. 2012, 54, 496–501. [Google Scholar] [CrossRef]
- Espitia-Perez, L.; Arteaga-Pertuz, M.; Soto, J.S.; Espitia-Perez, P.; Salcedo-Arteaga, S.; Pastor-Sierra, K.; Galeano-Páez, C.; Brango, H.; Da Silva, J.; Henriques, J.A. Geospatial analysis of residential proximity to open-pit coal mining areas in relation to micronuclei frequency, particulate matter concentration, and elemental enrichment factors. Chemosphere 2018, 206, 203–216. [Google Scholar] [CrossRef] [Green Version]
- Dubey, B.; Pal, A.K.; Singh, G. Trace metal composition of airborne particulate matter in the coal mining and non–mining areas of Dhanbad Region, Jharkhand, India. Atmos. Pollut. Res. 2012, 3, 238–246. [Google Scholar] [CrossRef] [Green Version]
- Zheng, L.; Ou, J.; Liu, M.; Chen, Y.; Tang, Q.; Hu, Y. Seasonal and spatial variations of PM10-bounded PAHs in a coal mining city, China: Distributions, sources, and health risks. Ecotoxicol. Environ. Saf. 2019, 169, 470–478. [Google Scholar] [CrossRef] [PubMed]
- Masto, R.E.; Singh, M.K.; Rout, T.K.; Kumar, A.; Kumar, S.; George, J.; Selvi, V.A.; Dutta, P.; Tripathi, R.C.; Srivastava, N.K. Health risks from PAHs and potentially toxic elements in street dust of a coal mining area in India. Environ Geochem Health. 2019, 41, 1923–1937. [Google Scholar] [CrossRef] [PubMed]
- Shahbaz, M.A.; Martikainen, M.V.; Ronkko, T.J.; Komppula, M.; Jalava, P.I.; Roponen, M. Urban air PM modifies differently immune defense responses against bacterial and viral infections in vitro. Environ. Res. 2021, 192, 110244. [Google Scholar] [CrossRef]
- Zhu, H.; Wu, Y.; Kuang, X.; Liu, H.; Guo, Z.; Qian, J.; Wang, D.; Wang, M.; Chu, H.; Gong, W.; et al. Effect of PM2.5 exposure on circulating fibrinogen and IL-6 levels: A systematic review and meta-analysis. Chemosphere 2021, 271, 129565. [Google Scholar] [CrossRef]
- Cortes-Ramirez, J.; Naish, S.; Sly, P.D.; Jagals, P. Mortality and morbidity in populations in the vicinity of coal mining: A systematic review. BMC Public Health 2018, 18, 721. [Google Scholar] [CrossRef] [PubMed] [Green Version]
- Hendryx, M. The public health impacts of surface coal mining. Extr. Ind. Soc. 2015, 2, 820–826. [Google Scholar] [CrossRef]
- Esch, L.; Hendryx, M. Chronic cardiovascular disease mortality in mountaintop mining areas of central Appalachian states. J. Rural. Health 2011, 27, 350–357. [Google Scholar] [CrossRef]
- Hendryx, M. Mortality from heart, respiratory, and kidney disease in coal mining areas of Appalachia. Int. Arch. Occup. Environ. Health 2009, 82, 243–249. [Google Scholar] [CrossRef] [PubMed]
- Mueller, G.S.; Clayton, A.L.; Zahnd, W.E.; Hollenbeck, K.M.; Barrow, M.E.; Jenkins, W.D.; Ruez, D.R. Manuscript title: Geospatial analysis of Cancer risk and residential proximity to coal mines in Illinois. Ecotoxicol. Environ. Saf. 2015, 120, 155–162. [Google Scholar] [CrossRef]
- Mueller, N.; Rojas-Rueda, D.; Cole-Hunter, T.; de Nazelle, A.; Dons, E.; Gerike, R.; Götschi, T.; Panis, L.I.; Kahlmeier, S.; Nieuwenhuijsen, M. Health impact assessment of active transportation: A systematic review. Prev. Med. 2015, 76, 103–114. [Google Scholar] [CrossRef]
- Christian, W.J.; Huang, B.; Rinehart, J.; Hopenhayn, C. Exploring geographic variation in lung cancer incidence in Kentucky using a spatial scan statistic: Elevated risk in the Appalachian coal-mining region. Public Health Rep. 2011, 126, 789–796. [Google Scholar] [CrossRef] [PubMed]
- Brink, L.L.; Talbott, E.O.; Stacy, S.; Marshall, L.P.; Sharma, R.K.; Buchanich, J. The association of respiratory hospitalization rates in WV counties, total, underground, and surface coal production and sociodemographic covariates. J. Occup. Environ. Med. 2014, 56, 1179–1188. [Google Scholar] [CrossRef] [Green Version]
- Liu, A.Y.; Curriero, F.C.; Glass, T.A.; Stewart, W.F.; Schwartz, B.S. The contextual influence of coal abandoned mine lands in communities and type 2 diabetes in Pennsylvania. Health Place 2013, 22, 115–122. [Google Scholar] [CrossRef] [PubMed]
- Hendryx, M.; Ahern, M.M.; Nurkiewicz, T.R. Hospitalization patterns associated with Appalachian coal mining. J. Toxicol. Environ. Health Part A 2007, 70, 2064–2070. [Google Scholar] [CrossRef]
- Pless-Mulloli, T.; Howel, D.; King, A.; Stone, I.; Merefield, J.; Bessell, J.; Darnell, R. Living near opencast coal mining sites and children’s respiratory health. Occup. Environ. Med. 2000, 57, 145–151. [Google Scholar] [CrossRef] [Green Version]
- Howel, D.; Pless-Mulloli, T.; Darnell, R. Consultations of children living near open-cast coal mines. Environ Health Perspect. 2001, 109, 567–571. [Google Scholar] [CrossRef]
- Ahern, M.M.; Hendryx, M.; Conley, J.; Fedorko, E.; Ducatman, A.; Zullig, K.J. The association between mountaintop mining and birth defects among live births in central Appalachia, 1996–2003. Environ. Res. 2011, 111, 838–846. [Google Scholar] [CrossRef] [PubMed]
- Liao, Y.; Zhang, Y.; He, L.; Wang, J.; Liu, X.; Zhang, N.; Xu, B. Temporal and Spatial Analysis of Neural Tube Defects and Detection of Geographical Factors in Shanxi Province, China. PLoS ONE 2016, 11, e0150332. [Google Scholar] [CrossRef]
- Liao, Y.; Wang, J.; Wu, J.; Driskell, L.; Wang, W.; Zhang, T.; Xue, G.; Zheng, X. Spatial analysis of neural tube defects in a rural coal mining area. Int. J. Environ. Health Res. 2010, 20, 439–450. [Google Scholar] [CrossRef]
- Geoscience Australia. Australia’s Energy Commodity Resources 2021. Available online: https://wwwgagovau/digital-publication/aecr2021 (accessed on 2 July 2021).
- Queensland government. Coal Industry Review Statistical Tables. Coal Industry Summary. 2021; The State of Queensland, Australia. Available online: https://wwwdataqldgovau/dataset/coal-industry-review-statistical-tables (accessed on 2 July 2021).
- Mining Technology. Analysis. Available online: https://wwwmining-technologycom/features/feature-the-10-biggest-coal-mines-in-the-world/ (accessed on 5 August 2020).
- Lockie, S.; Franettovich, M.; Petkova-Timmer, V.; Rolfe, J.; Ivanova, G. Coal mining and the resource community cycle: A longitudinal assessment of the social impacts of the Coppabella coal mine. Environ. Impact Assess. Rev. 2009, 29, 330–339. [Google Scholar] [CrossRef]
- Petkova, V.; Lockie, S.; Rolfe, J.; Ivanova, G. Mining developments and social impacts on communities: Bowen Basin case studies. Rural. Soc. 2009, 19, 211–228. [Google Scholar] [CrossRef]
- Cramb, S.M.; Moraga, P.; Mengersen, K.L.; Baade, P.D. Spatial variation in cancer incidence and survival over time across Queensland, Australia. Spat. Spatio-Temporal Epidemiol. 2017, 23, 59–67. [Google Scholar] [CrossRef] [PubMed] [Green Version]
- Cramb, S.M.; Baade, P.D.; White, N.M.; Ryan, L.M.; Mengersen, K.L. Inferring lung cancer risk factor patterns through joint Bayesian spatio-temporal analysis. Cancer Epidemiol. 2015, 39, 430–439. [Google Scholar] [CrossRef] [Green Version]
- Naish, S.; Mengersen, K.; Tong, S.L. Spatial analysis of risk factors for transmission of the Barmah Forest virus in Queensland, Australia. Geospat. Health 2013, 8, 289–299. [Google Scholar] [CrossRef] [Green Version]
- Hu, W.; Mengersen, K.; Tong, S. Risk factor analysis and spatiotemporal CART model of cryptosporidiosis in Queensland, Australia. BMC Infect. Dis. 2010, 10, 311. [Google Scholar] [CrossRef] [Green Version]
- Cortes-Ramirez, J.; Vilcins, D.; Jagals, P.; Soares Magalhaes, R.J. Environmental and sociodemographic risk factors associated with environmentally transmitted zoonoses hospitalisations in Queensland, Australia. One Health 2021, 12, 100206. [Google Scholar] [CrossRef]
- Australian Institute of Health and Welfare. Principles on the Use of Direct Age-Standardisation in Administrative Data Collections: For Measuring the Gap between Indigenous and Non-Indigenous Australians; Cat. no. CSI 12; AIHW: Canberra, Australia, 2011.
- 3101.0—Australian Demographic Statistics, Sep 2018. Available online: https://wwwabsgovau/Ausstats/abs@nsf/glossary/31010 (accessed on 5 November 2018).
- Cortes-Ramirez, J. Calculation of Coal Production in Queensland Local Government Areas, 1996–2010. Data Collections. Queensland University of Technology. 2021. Available online: https://doi.org/10.25912/RDF_1638409070916 (accessed on 2 July 2021).
- Kronmal, R.A. Spurious correlation and the fallacy of the ratio standard revisited. J. R. Stat. Soc. Ser. A Stat. Soc. 1993, 156, 379–392. [Google Scholar] [CrossRef]
- Milyo, J.; Mellor, J.M. On the importance of age-adjustment methods in ecological studies of social determinants of mortality. Health Serv. Res. 2003, 38, 1781–1790. [Google Scholar] [CrossRef] [Green Version]
- Australian Institute of Health and Welfare. Hospitals Contact Data. Available online: https://wwwmyhospitalsgovau/about-the-data/download-data (accessed on 10 November 2018).
- BOM. ACORN-SAT Australia v2 (snapshot v.2.1.0.1). Australian Climate Observations Reference Network—Surface Air Temperature (1910-May 2019). Available online: http://wwwbomgovau/metadata/catalogue/19115/ANZCW0503900447#distribution-information (accessed on 2 February 2021).
- O’brien, R.M. A caution regarding rules of thumb for variance inflation factors. Qual. Quant. 2007, 41, 673–690. [Google Scholar] [CrossRef]
- Cramb, S.M.; Mengersen, K.L.; Baade, P.D. Developing the atlas of cancer in Queensland: Methodological issues. Int. J. Health Geogr. 2011, 10, 9. [Google Scholar] [CrossRef] [PubMed] [Green Version]
- Besag, J.; York, J.; Mollie, A. Bayesian image restoration, with two applications in spatial statistics. Ann. Inst. Stat. Math. 1991, 43, 1–20. [Google Scholar] [CrossRef]
- Rue, H.; Martino, S.; Chopin, N. Approximate Bayesian inference for latent Gaussian models by using integrated nested Laplace approximations. J. R. Stat. Soc. Ser. B Stat. Methodol. 2009, 71, 319–392. [Google Scholar] [CrossRef]
- Bakka, H.; Rue, H.; Fuglstad, G.A.; Riebler, A.; Bolin, D.; Illian, J.; Krainski, E.; Simpson, D.; Lindgren, F. Spatial modeling with R-INLA: A review. WIREs Comput. Stat. 2018, 10, e1443. [Google Scholar] [CrossRef] [Green Version]
- Blangiardo, M.; Cameletti, M.; Baio, G.; Rue, H. Spatial and spatio-temporal models with R-INLA. Spat. Spatio-Temporal Epidemiol. 2013, 7, 39–55. [Google Scholar] [CrossRef] [Green Version]
- Tennekes, M. Tmap: Thematic Maps in R. J. Stat. Softw. 2018, 84, 1–39. [Google Scholar] [CrossRef] [Green Version]
- Hendryx, M.; Fedorko, E.; Anesetti-Rothermel, A. A geographical information system-based analysis of cancer mortality and population exposure to coal mining activities in West Virginia, United States of America. Geospat. Health 2010, 4, 243–256. [Google Scholar] [CrossRef] [Green Version]
- Melody, S.M.; Ford, J.; Wills, K.; Venn, A.; Johnston, F.H. Maternal exposure to fine particulate matter from a coal mine fire and birth outcomes in Victoria, Australia. Environ. Int. 2019, 127, 233–242. [Google Scholar] [CrossRef]
- Franks, D.M.; Brereton, D.; Moran, C.J. Managing the cumulative impacts of coal mining on regional communities and environments in Australia. Impact Assess. Proj. Apprais. 2010, 28, 299–312. [Google Scholar] [CrossRef]
- Higginbotham, N.; Heading, G.; McElduff, P.; Dobson, A.; Heller, R. Reducing coronary heart disease in the Australian Coalfields: Evaluation of a 10-year community intervention. Soc. Sci. Med. 1999, 48, 683–692. [Google Scholar] [CrossRef]
- Werner, A.K.; Watt, K.; Cameron, C.M.; Vink, S.; Page, A.; Jagals, P. All-age hospitalization rates in coal seam gas areas in Queensland, Australia, 1995–2011. BMC Public Health 2016, 16, 125. [Google Scholar] [CrossRef] [Green Version]
- Hendryx, M. Poverty and mortality disparities in central Appalachia: Mountaintop mining and environmental justice. J. Health Disparities Res. Pract. 2011, 4, 6. Available online: https://digitalscholarship.unlv.edu/jhdrp/vol4/iss3/6 (accessed on 2 July 2021).
- Cortes-Ramirez, J.; Sly, P.D.; Ng, J.; Jagals, P. Using human epidemiological analyses to support the assessment of the impacts of coal mining on health. Rev. Environ. Health 2019, 34, 391–401. [Google Scholar] [CrossRef]
- Riley, E.; Sainsbury, P.; McManus, P.; Colagiuri, R.; Viliani, F.; Dawson, A.; Duncan, E.; Stone, Y.; Pham, T.; Harris, P. Including health impacts in environmental impact assessments for three Australian coal-mining projects: A documentary analysis. Health Promot. Int. 2020, 35, 449–457. [Google Scholar] [CrossRef]
- Keywood, M.; Hibberd, M.F.; Selleck, P.W.; Desservettaz, M.; Cohen, D.D.; Stelcer, E.; Atanacio, A.J.; Scorgie, Y.; Chang, L.T.-C. Sources of Particulate Matter in the Hunter Valley, New South Wales, Australia. Atmosphere 2020, 11, 4. [Google Scholar] [CrossRef] [Green Version]
- Weng, Z.; Mudd, G.M.; Martin, T.; Boyle, C.A. Pollutant loads from coal mining in Australia: Discerning trends from the National Pollutant Inventory (NPI). Environ. Sci. Policy 2012, 19–20, 78–89. [Google Scholar] [CrossRef]
- Nardone, A.; Ferreccio, C.; Acevedo, J.; Enanoria, W.; Blair, A.; Smith, A.H.; Balmes, J.; Steinmaus, C. The impact of BMI on non-malignant respiratory symptoms and lung function in arsenic exposed adults of Northern Chile. Environ. Res. 2017, 158, 710–719. [Google Scholar] [CrossRef] [Green Version]
- Rahman, A.; Vahter, M.; Ekstrom, E.C.; Persson, L.A. Arsenic exposure in pregnancy increases the risk of lower respiratory tract infection and diarrhea during infancy in Bangladesh. Environ. Health Perspect. 2011, 119, 719–724. [Google Scholar] [CrossRef] [PubMed]
- Mazumder, D.N.; Haque, R.; Ghosh, N.; De, B.K.; Santra, A.; Chakraborti, D.; Smith, A.H. Arsenic in drinking water and the prevalence of respiratory effects in West Bengal, India. Int. J. Epidemiol. 2000, 29, 1047–1052. [Google Scholar] [CrossRef] [Green Version]
- Dallongeville, A.; Costet, N.; Zmirou-Navier, D.; Le Bot, B.; Chevrier, C.; Deguen, S.; Blanchard, O.; Zmirou-Navier, D.; Annesi-Maesano, I. Volatile and semi-volatile organic compounds of respiratory health relevance in French dwellings. Indoor Air 2016, 26, 426–438. [Google Scholar] [CrossRef]
- Zachariah, M.; Agouni, A.; Rayman, M.P.; Maamoun, H. 205 High Selenium Intake is Associated with Endothelial Dysfunction: Critical Role for Endoplasmic Reticulum Stress. Heart 2015, 101 (Suppl. 4), A113. [Google Scholar] [CrossRef]
- Li, X.-N.; Liu, Y.; Huang, N.; Cheng, X.-J.; Jia, L.-H. The Association Between Environmental Lead Exposure and Recurrent Respiratory Infections in Children Aged 3–7 Years in Shenyang, China. Indian Pediatrics 2020, 57, 1023–1025. [Google Scholar] [CrossRef] [PubMed]
- Khazdair, M.R.; Boskabady, M.H.; Afshari, R.; Dadpour, B.; Behforouz, A.; Javidi, M.; Abbasnezhad, A.; Moradi, V.; Tabatabaie, S.S. Respiratory symptoms and pulmonary function testes in lead exposed workers. Iran. Red. Crescent Med. J. 2012, 14, 737–742. [Google Scholar] [CrossRef] [Green Version]
- Chen, C.; Li, Q.; Nie, X.; Han, B.; Chen, Y.; Xia, F.; Zhai, H.; Wang, N.; Lu, Y. Association of lead exposure with cardiovascular risk factors and diseases in Chinese adults. Environ. Sci. Pollut. Res. Int. 2017, 24, 22275–22283. [Google Scholar] [CrossRef]
- Xu, C.; Shu, Y.; Fu, Z.; Hu, Y.; Mo, X. Associations between lead concentrations and cardiovascular risk factors in U.S. adolescents. Sci. Rep. 2017, 7, 9121. [Google Scholar] [CrossRef] [Green Version]
- Obeng-Gyasi, E.; Armijos, R.X.; Weigel, M.M.; Filippelli, G.M.; Sayegh, M.A. Cardiovascular-Related Outcomes in U.S. Adults Exposed to Lead. Int. J. Environ. Res. Public Health 2018, 15, 759. [Google Scholar] [CrossRef] [Green Version]
- Ahern, M.; Hendryx, M. Cancer Mortality Rates in Appalachian Mountaintop Coal Mining Areas. J. Environ. Occup. Sci. 2012, 1, 63–70. [Google Scholar] [CrossRef] [Green Version]
- Espitia-Perez, L.; da Silva, J.; Espitia-Perez, P.; Brango, H.; Salcedo-Arteaga, S.; Hoyos-Giraldo, L.S.h.; de Souza, C.T.; Dias, J.; Agudelo-Castañeda, D.M.; Toscano, A.V.; et al. Cytogenetic instability in populations with residential proximity to open-pit coal mine in Northern Colombia in relation to PM10 and PM2.5 levels. Ecotoxicol. Environ. Saf. 2018, 148, 453–466. [Google Scholar] [CrossRef] [PubMed]
- Roy, D.; Singh, G.; Seo, Y.-C. Carcinogenic and non-carcinogenic risks from PM10-and PM2.5-Bound metals in a critically polluted coal mining area. Atmos. Pollut. Res. 2019, 10, 1964–1975. [Google Scholar] [CrossRef]
- Zhang, Z.; Wang, J.; Lu, W. Exposure to nitrogen dioxide and chronic obstructive pulmonary disease (COPD) in adults: A systematic review and meta-analysis. Environ. Sci. Pollut. Res. Int. 2018, 25, 15133–15145. [Google Scholar] [CrossRef]
- Kuo, C.C.; Moon, K.A.; Wang, S.L.; Silbergeld, E.; Navas-Acien, A. The Association of Arsenic Metabolism with Cancer, Cardiovascular Disease, and Diabetes: A Systematic Review of the Epidemiological Evidence. Environ. Health Perspect. 2017, 125, 087001. [Google Scholar] [CrossRef] [PubMed] [Green Version]
- Wakefield, J. Multi-level modelling, the ecologic fallacy, and hybrid study designs. Int. J. Epidemiol. 2009, 38, 330–336. [Google Scholar] [CrossRef] [PubMed] [Green Version]
- Rosenbaum, P.R.; Rubin, D.B. Difficulties with regression analyses of age-adjusted rates. Biometrics 1984, 40, 437–443. [Google Scholar] [CrossRef]

| Disease Group | ICD-10 Code | Mean | SD | Min | Max |
|---|---|---|---|---|---|
| Diseases circulatory system | I00–199 | 10,030 | 29,344 | 52 | 277,180 |
| Diseases respiratory system | J00–J99 | 7499 | 20,702 | 79 | 199,305 |
| Hypertensive diseases | I10–I16 | 208 | 499 | 0 | 4793 |
| Chronic lower respiratory diseases | J40–J47 | 2267 | 6449 | 17 | 63,423 |
| Diabetes mellitus | E08–E13 | 1201 | 3280 | 3 | 31,082 |
| Cancer of bronchus and lung | C34 | 438 | 1283 | 0 | 12,192 |
| Predictor | Mean | SD | Min | Max |
|---|---|---|---|---|
| Coal production (Mt) | 19.8 | 79.9 | 0 | 694 |
| Index Socioeconomic Disadvantage | 957.7 | 69.6 | 472.1 | 1048.9 |
| Average temperature (°C) | 22.2 | 2.0 | 16.4 | 26.2 |
| Population density * | 53.7 | 170.0 | 0.004 | 1313.1 |
| Rate of hospitals per population | 0.5 | 0.9 | 0 | 6.4 |
| Standardised rate of indigenous population ** | 78.2 | 133.4 | 0 | 743.5 |
| Standardised rate of mining employees ** | 23.2 | 49.2 | 0 | 248 |
| Diseases Circulatory System | Diseases Respiratory System | ||||
| Posterior Mean * (95% CI) | SD | Posterior Mean (95% CI) | SD | ||
| Intercept | 0.354 (0.349–0.359) | 1.005 | Intercept | 0.324 (0.319–0.329) | 1.008 |
| Coal production | 1.022 (1.002–1.043) | 1.008 | Coal production | 1.031 (1.001–1.062) | 1.015 |
| Index of Social Disadvantage | 0.999 (0.969–1.03) | 1.012 | Index of Social Disadvantage | 0.99 (0.944–1.039) | 1.025 |
| Standardised rate of indigenous population | 0.982 (0.949–1.017) | 1.014 | Standardised rate of indigenous population | 0.942 (0.887–0.999) | 1.031 |
| Population density | 0.998 (0.982–1.013) | 1.006 | Population density | 1.003 (0.977–1.031) | 1.014 |
| Rate of hospitals per population | 1.01 (0.986–1.034) | 1.009 | Rate of hospitals per population | 1.022 (0.993–1.051) | 1.015 |
| Average temperature | 1.006 (0.971–1.043) | 1.014 | Average temperature | 0.988 (0.924–1.058) | 1.035 |
| Standardised rate of hospitalisation-females | 1.132 (1.097–1.168) | 1.012 | Standardised rate of hospitalisation-females | 1.161 (1.07–1.258) | 1.042 |
| Standardised rate of hospitalisation-males | 1.183 (1.15–1.217) | 1.011 | Standardised rate of hospitalisation-males | 1.344 (1.247–1.447) | 1.039 |
| Standardised rate of mining employees | 0.965 (0.942–0.988) | 1.009 | Standardised rate of mining employees | 0.968 (0.935–1.002) | 1.018 |
| Hypertensive diseases | Chronic lower respiratory diseases | ||||
| Posterior mean (95% CI) | SD | Posterior mean (95% CI) | SD | ||
| Intercept | 0.012 (0.011–0.012) | 1.021 | Intercept | 0.099 (0.097–0.1) | 1.009 |
| Coal production | 1.039 (0.977–1.106) | 1.032 | Coal production | 1.025 (0.996–1.054) | 1.014 |
| Index of Social Disadvantage | 0.982 (0.887–1.087) | 1.053 | Index of Social Disadvantage | 0.965 (0.923–1.009) | 1.023 |
| Standardised rate of indigenous population | 0.919 (0.818–1.033) | 1.061 | Standardised rate of indigenous population | 0.944 (0.896–0.994) | 1.026 |
| Population density | 0.995 (0.946–1.047) | 1.026 | Population density | 1.007 (0.985–1.03) | 1.011 |
| Rate of hospitals per population | 1.058 (0.977–1.142) | 1.041 | Rate of hospitals per population | 1.021 (0.988–1.054) | 1.017 |
| Average temperature | 0.978 (0.86–1.114) | 1.068 | Average temperature | 0.989 (0.937–1.044) | 1.028 |
| Standardised rate of hospitalisation-females | 1.559 (1.397–1.741) | 1.058 | Standardised rate of hospitalisation-females | 1.18 (1.134–1.228) | 1.020 |
| Standardised rate of hospitalisation-males | 1.263 (1.133–1.409) | 1.057 | Standardised rate of hospitalisation-males | 1.34 (1.285–1.397) | 1.021 |
| Standardised rate of mining employees | 0.969 (0.898–1.044) | 1.039 | Standardised rate of mining employees | 0.971 (0.939–1.003) | 1.017 |
| Diabetes mellitus | Cancer of bronchus and lung | ||||
| Posterior mean (95% CI) | SD | Posterior mean (95% CI) | SD | ||
| Intercept | 0.047 (0.046–0.048) | 1.011 | Intercept | 0.015 (0.014–0.015) | 1.012 |
| Coal production | 1.032 (0.999–1.065) | 1.016 | Coal production | 1.001 (0.977–1.026) | 1.013 |
| Index of Social Disadvantage | 0.966 (0.922–1.011) | 1.024 | Index of Social Disadvantage | 0.987 (0.959–1.016) | 1.015 |
| Standardised rate of indigenous population | 0.881 (0.823–0.943) | 1.035 | Standardised rate of indigenous population | 0.977 (0.937–1.017) | 1.021 |
| Population density | 1.002 (0.979–1.025) | 1.012 | Population density | 0.992 (0.985–0.999) | 1.004 |
| Rate of hospitals per population | 1.005 (0.96–1.05) | 1.023 | Rate of hospitals per population | 0.969 (0.922–1.016) | 1.025 |
| Average temperature | 1.013 (0.958–1.071) | 1.028 | Average temperature | 1.003 (0.981–1.026) | 1.011 |
| Standardised rate of hospitalisation -females | 1.276 (1.214–1.341) | 1.026 | Standardised rate of hospitalisation -females | 1.232 (1.194–1.27) | 1.016 |
| Standardised rate of hospitalisation -males | 1.323 (1.269–1.38) | 1.022 | Standardised rate of hospitalisation -males | 1.327 (1.3–1.354) | 1.010 |
| Standardised rate of mining employees | 0.949 (0.913–0.986) | 1.020 | Standardised rate of mining employees | 0.981 (0.951–1.012) | 1.016 |
Publisher’s Note: MDPI stays neutral with regard to jurisdictional claims in published maps and institutional affiliations. |
© 2022 by the authors. Licensee MDPI, Basel, Switzerland. This article is an open access article distributed under the terms and conditions of the Creative Commons Attribution (CC BY) license (https://creativecommons.org/licenses/by/4.0/).
Share and Cite
Cortes-Ramirez, J.; Wraith, D.; Sly, P.D.; Jagals, P. Mapping the Morbidity Risk Associated with Coal Mining in Queensland, Australia. Int. J. Environ. Res. Public Health 2022, 19, 1206. https://doi.org/10.3390/ijerph19031206
Cortes-Ramirez J, Wraith D, Sly PD, Jagals P. Mapping the Morbidity Risk Associated with Coal Mining in Queensland, Australia. International Journal of Environmental Research and Public Health. 2022; 19(3):1206. https://doi.org/10.3390/ijerph19031206
Chicago/Turabian StyleCortes-Ramirez, Javier, Darren Wraith, Peter D. Sly, and Paul Jagals. 2022. "Mapping the Morbidity Risk Associated with Coal Mining in Queensland, Australia" International Journal of Environmental Research and Public Health 19, no. 3: 1206. https://doi.org/10.3390/ijerph19031206
APA StyleCortes-Ramirez, J., Wraith, D., Sly, P. D., & Jagals, P. (2022). Mapping the Morbidity Risk Associated with Coal Mining in Queensland, Australia. International Journal of Environmental Research and Public Health, 19(3), 1206. https://doi.org/10.3390/ijerph19031206