Article

The Factors and Relationships Influencing Forest Hiking Exercise Characteristics after COVID-19 Occurrence: At Seoul Metropolitan Area and in Hikers’ 20s and 30s

1
Department of Information Statistics, Chungbuk National University, Cheongju 28644, Republic of Korea
2
Department of Forestry, Chungbuk National University, Cheongju 28644, Republic of Korea
*
Author to whom correspondence should be addressed.
Int. J. Environ. Res. Public Health 2022, 19(24), 16403; https://doi.org/10.3390/ijerph192416403
Submission received: 31 October 2022 / Revised: 18 November 2022 / Accepted: 23 November 2022 / Published: 7 December 2022
(This article belongs to the Special Issue 2nd Edition of Forest for Human Health and Welfare)

Abstract

:
The growing interest and usage of green space during the pandemic relates to why greenery increases enjoyment of daily life and alleviates troubles arising from infectious periods. However, it is necessary to understand what reactions to the degree of COVID-19’s spread were expressed in hiking exercise characteristics (hiking frequency, actual movement distance, average speed, total exercise time). To understand the progress of forest usage behavior during the pandemic, we analyzed factors influencing hiking exercise characteristics and relationships between those factors and hiking exercise characteristics. Hiking record data were obtained (2019–2020) from the workout app “Tranggle” pertaining to hikers in their 20s and 30s who visited the 13 mountains in the Seoul Metropolitan Area most frequently. The differences in hiking exercise characteristics (2019 data subtracted from 2020) were linked with factor data that could be related to them, including the degree of COVID-19’s spread ( R t ). To explore relationships between hiking exercise characteristics and factors, we developed four models with a linear mixed model. We found that R t , week, weekdays/weekends, and PM 10 contributed to explaining the hiking exercise characteristics’ differences. As a result of this analysis, the degree of COVID-19’s spread ( R t ) affected hiking frequency; the week affected hiking frequency and actual movement distance; weekdays or weekends affected hiking frequency, actual movement distance, average speed, and total exercise time; and PM 10 affected hiking frequency. These findings indicate that hiking was an alternative way for those looking for a new strategy to replace lost opportunities for physical activity. Therefore, we conclude that it is necessary to induce the usage of green space so that many people can take advantage of the functions and benefits of greenery, which stood out during the pandemic era.

1. Introduction

After 2020, when COVID-19 caused a global pandemic, the measures to prevent the spread of COVID-19 have basically changed the way people participate in personal and public activities [1]. Because of the pandemic, unneeded trips and international tourism diminished rapidly and domestic needs grew [2], centered on green spaces in areas such as suburbs of cities and rural regions of the country [3,4]. Likewise, Korea also increased people’s attention and usage of small-scale outdoor activities in natural spaces that could comply with quarantine policies outside of a hermetic, dense, closed environment. Moreover, the mention of natural green space online rose compared with before COVID-19 [5,6,7,8].
Surpassing the Alpha, Beta, Delta, Omicron variants, etc., the significant variance that seemed to have high pathogenicity in the early pandemic now results in reduced symptoms and lowered mortality, and many countries such as the UK, the USA, France, Germany, Denmark, etc., have relaxed their quarantine systems [9]. However, Anthony Fauci and the WHO noted that the present state of the pandemic does not mean COVID-19 has been stamped out [10,11]. In addition, sustaining change in climate and land usage stimulates zoonosis because it generates the chance for disease to spread in the shifting habitats of wild animals [12]. Moreover, it is seen that infectious diseases seem to be transmitted easily without difficulty because we have become more highly connected owing to several factors, such as transportation technology, globalization, etc. Infectious diseases can be expected to disseminate across a vast area, and the occurrence cycle is short. Therefore, it is necessary to think back on the effect of COVID-19 on during the turnover the pandemic period to an endemic one. After COVID-19, what change was aroused in the usage of forests? We need to identify what factors affect hiking exercise characteristics and what the relationships are between these factors and hiking exercise characteristics. Through this processing, we could comprehend the social change phenomena due to infectious diseases and realize causal relationships. It is helpful because it properly informs what aspects of the forest usage should be considered to quickly decrease health problems that could occur in a crisis from infectious diseases.
During the pandemic, people started paying attention to the benefits of forests on health and welfare. As a result of measures such as social distancing, working from home, and social distancing education (e.g., online classes, remote video classes), on the whole, physical activity decreased [13,14], and because of this, body and mind problems began to occur in a narrow sense and threats to health welfare occurred in a broader sense. Physical activity in green spaces or living nearby greenery improves mental health, such as easing depression, reducing stress, and mitigating mental health burdens [15,16,17,18,19] because of the close link between physical and health [19]. Visiting green spaces such as parks, urban forests, and national parks supports well-being [20], cushions the decrease in leisure-time physical activity [21], and also encourages the social cohesion of residents in high-density urban neighborhoods [22]. In the studies mentioned above, the interest and usage of green space that can comply with quarantine rules and be less restricted in activity explains that greenery could be utilized as a way to enjoy daily life and as a way to solve problems arising from infectious circumstances. Therefore, understanding the usage of green spaces and physical activity changes empirically prepares us for the subsequent waves of COVID-19 and presents strategies to cope with new contagious diseases. This understanding is also crucial because it could present guidelines based on evidence for public policy and individual selection.
This study demonstratively analyzes the usage behavior of forests according to the degree of COVID-19’s spread since the beginning of the COVID-19 pandemic. We are using recorded data on the change in physical activity characteristics (hiking frequency, actual movement distance, average speed, total exercise time) due to the effects of social circumstances. We obtained data from one year before to one year after COVID-19’s occurrence to examine changes in long-term physical activity characteristics. The exercise dataset, which is recorded of one’s own accord without artificial intervention, can be seen to be the result of natural experiments and provides a chance for causal inference [23]. In addition, analyzing the mobility of people is an excellent strategy to progress the speed and accuracy of fundamental data offered for social circumstances [24]. With this background, observing hiking activity and finding factors influencing it and the relationships between those factors, including the degree of COVID-19’s spread and the hiking characteristics, can help decision making for outdoor activities in the infectious era. These results provide the primary data for better public policy making in similar crises.
This study aims to find factors and the relationship influencing hiking exercise characteristics (hiking frequency, actual movement distance, average speed, total exercise time) concerning the degree of COVID-19 spread and other related factors (e.g., week, weekdays or weekends, PM 10 , average daily temperature, etc.). This paper therefore addresses the following research questions:
  • What factors have affected the change in hiking exercise characteristics?
  • What kind of relationship exists between these factors and hiking exercise characteristics?

2. Materials and Methods

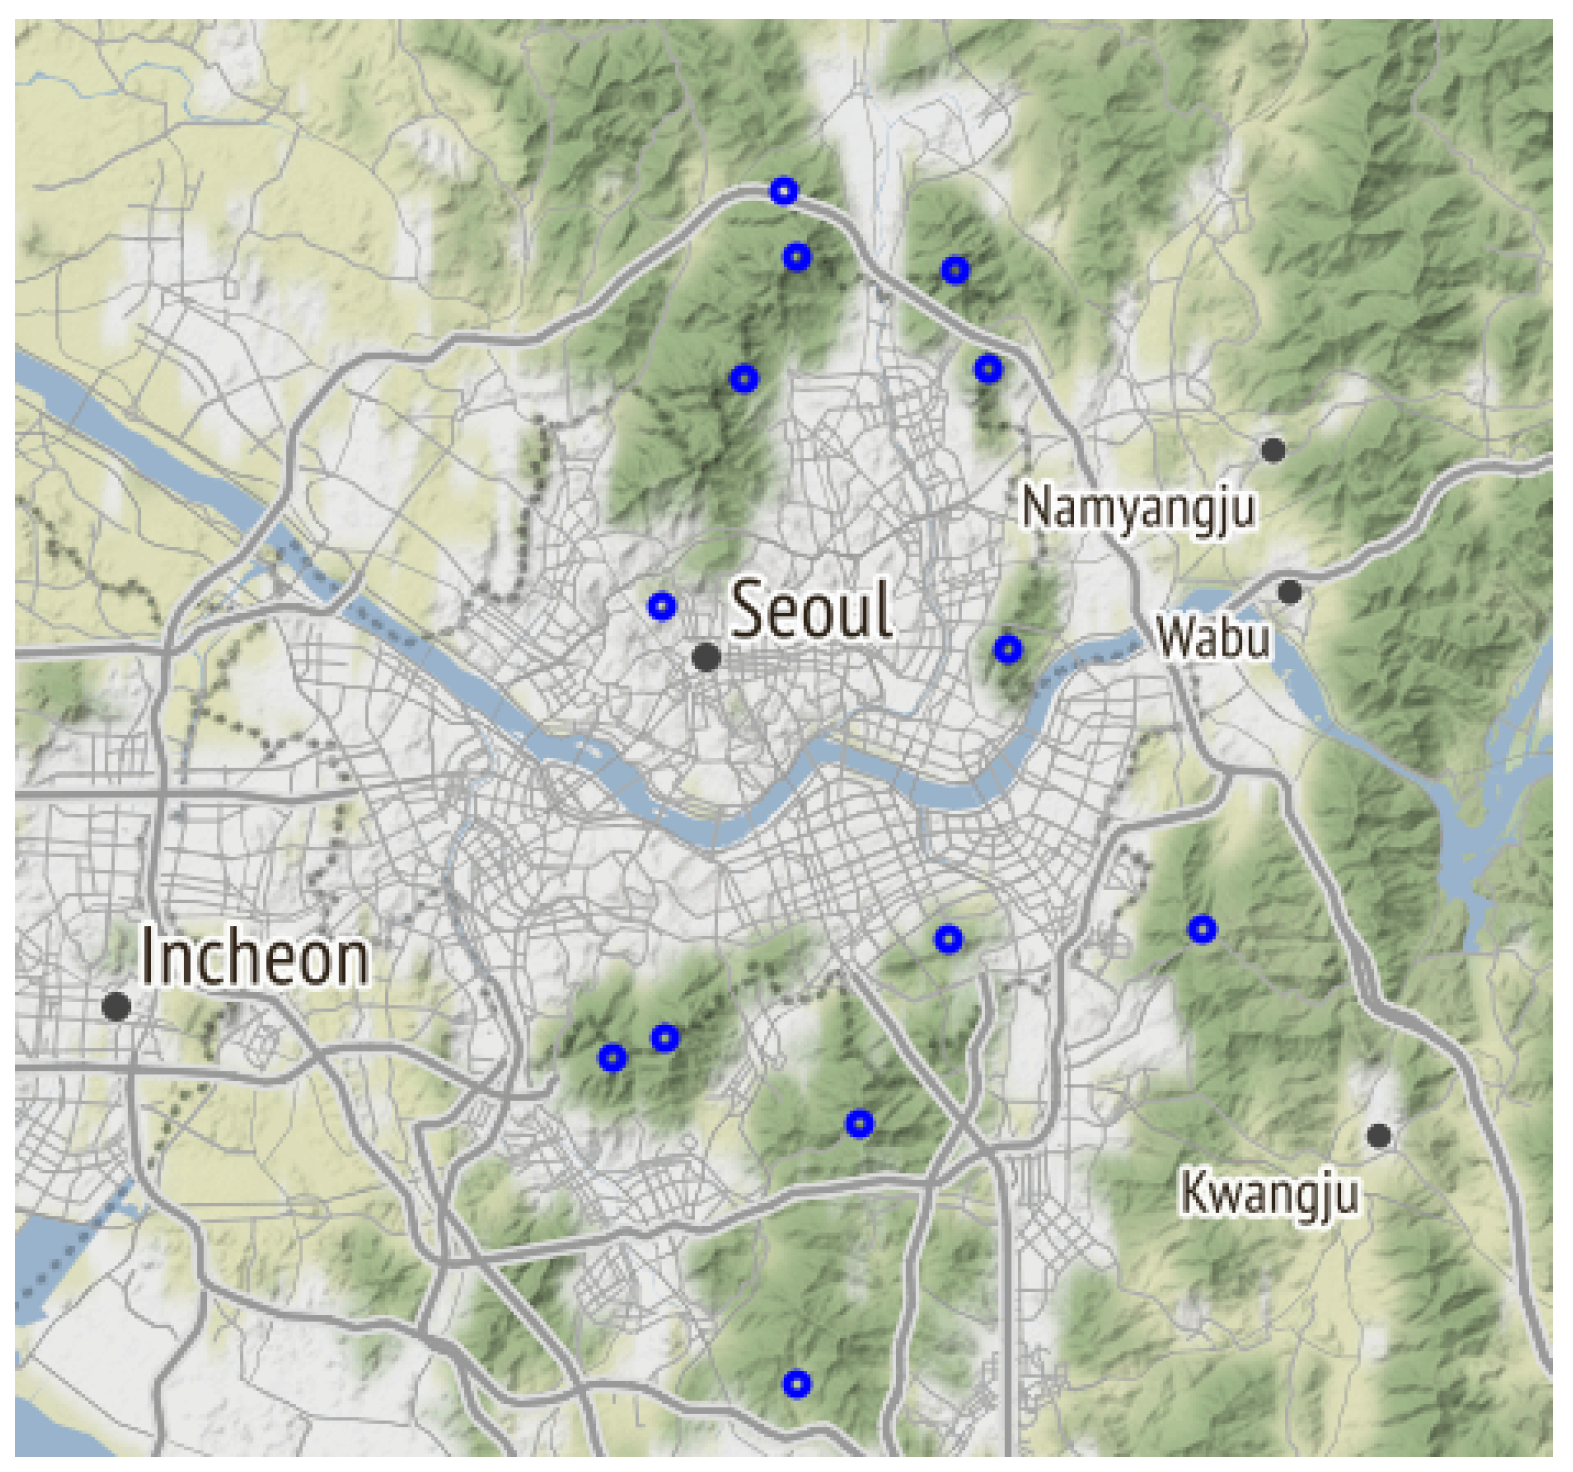
2.1. Study Design and Study Sites

This study’s procedure is as follows: First, the study period and sites were restricted because of the volume, velocity, and variety of the accumulated digital data. The period, age, and location range were selected based on prior studies and forest use statistics. Millennials and Generation Z (anyone born between 1984 and 1996 is considered a Millennial, and anyone born between 1997 and 2010 is considered a Generation Z [25]) tend to feel a sense of accomplishment through exercise in COVID-19 circumstances [26]. Hiking is the way to re-building the crumbling daily life in Millennials and Generation Z [25]. The young generation who did not hike a lot in the past [27] has noticeable hiking usage differences before and after the pandemic [28,29,30]. In addition, the visit ratio was high in urban forests [31,32,33] and comprised 50.4 percent of the population living in the Seoul Metropolitan Area [34]. Lastly, we selected data from the beginning of 2019 to the end of 2020 to compare the exercise characteristics before the COVID-19 outbreak with those after that. Second, we consulted with a company that operates a workout app (Tranggle); after that, we cut down the study range to the top 13 mountains in terms of the frequency of visits and were provided with data on users in their 20s and 30s through approval procedures for data use. Third, data preprocessing was performed to appropriately process data, such as extracting parts of the data, dividing them by type, or combining multiple points of data [35]. Fourth, before the data were compared to the probabilistic model, flexible research was conducted through exploratory data analysis [36] (this is the follow-up study that Lee and Yeon conducted; a detailed description of the exploratory data analysis results may be found in [37]). Fifth, we want to know the general hiking exercise characteristics, not specific users within the study’s age and site ranges. Thus, we implemented a linear mixed model. This model can identify, separately and simultaneously, fixed (model average trends, such as R t , week, weekdays or weekends, PM 10 , temperature in this case) and random model effects (model the extent to which these trends vary across levels of some grouping factor, in this case, mountains) [38].

2.2. Study Site

The most popular 13 mountains in the Seoul metropolitan area for hikers in their 20s and 30s in 2019 and 2020, mostly located in the outskirts of Seoul, were peri-urban forests that form the framework of the city. The study sites were: Acha Mountain, Gwanak Mountain, Gwanggyo Mountain, Inwang Mountain, Bulam Mountain, Suraksan Mountain, Dobong Mountain, Sapae Mountain, Daemo Mountain, Cheonggye Mountain, Bukhan Mountain, and Namhan Mountain. All or parts of 9 of these mountains are within Seoul or forest areas in affluent suburban areas outside of Seoul (Figure 1). In addition, eight of these mountains are interconnected by the Seoul Dulle-Gil that circles the city of Seoul, connecting suburbs and the center with prominent mountains. The heights of the 13 mountains were 287–836 m, with a mean elevation of 538 m.

2.3. Data Collection and Variable Selection

2.3.1. The User Recording Data
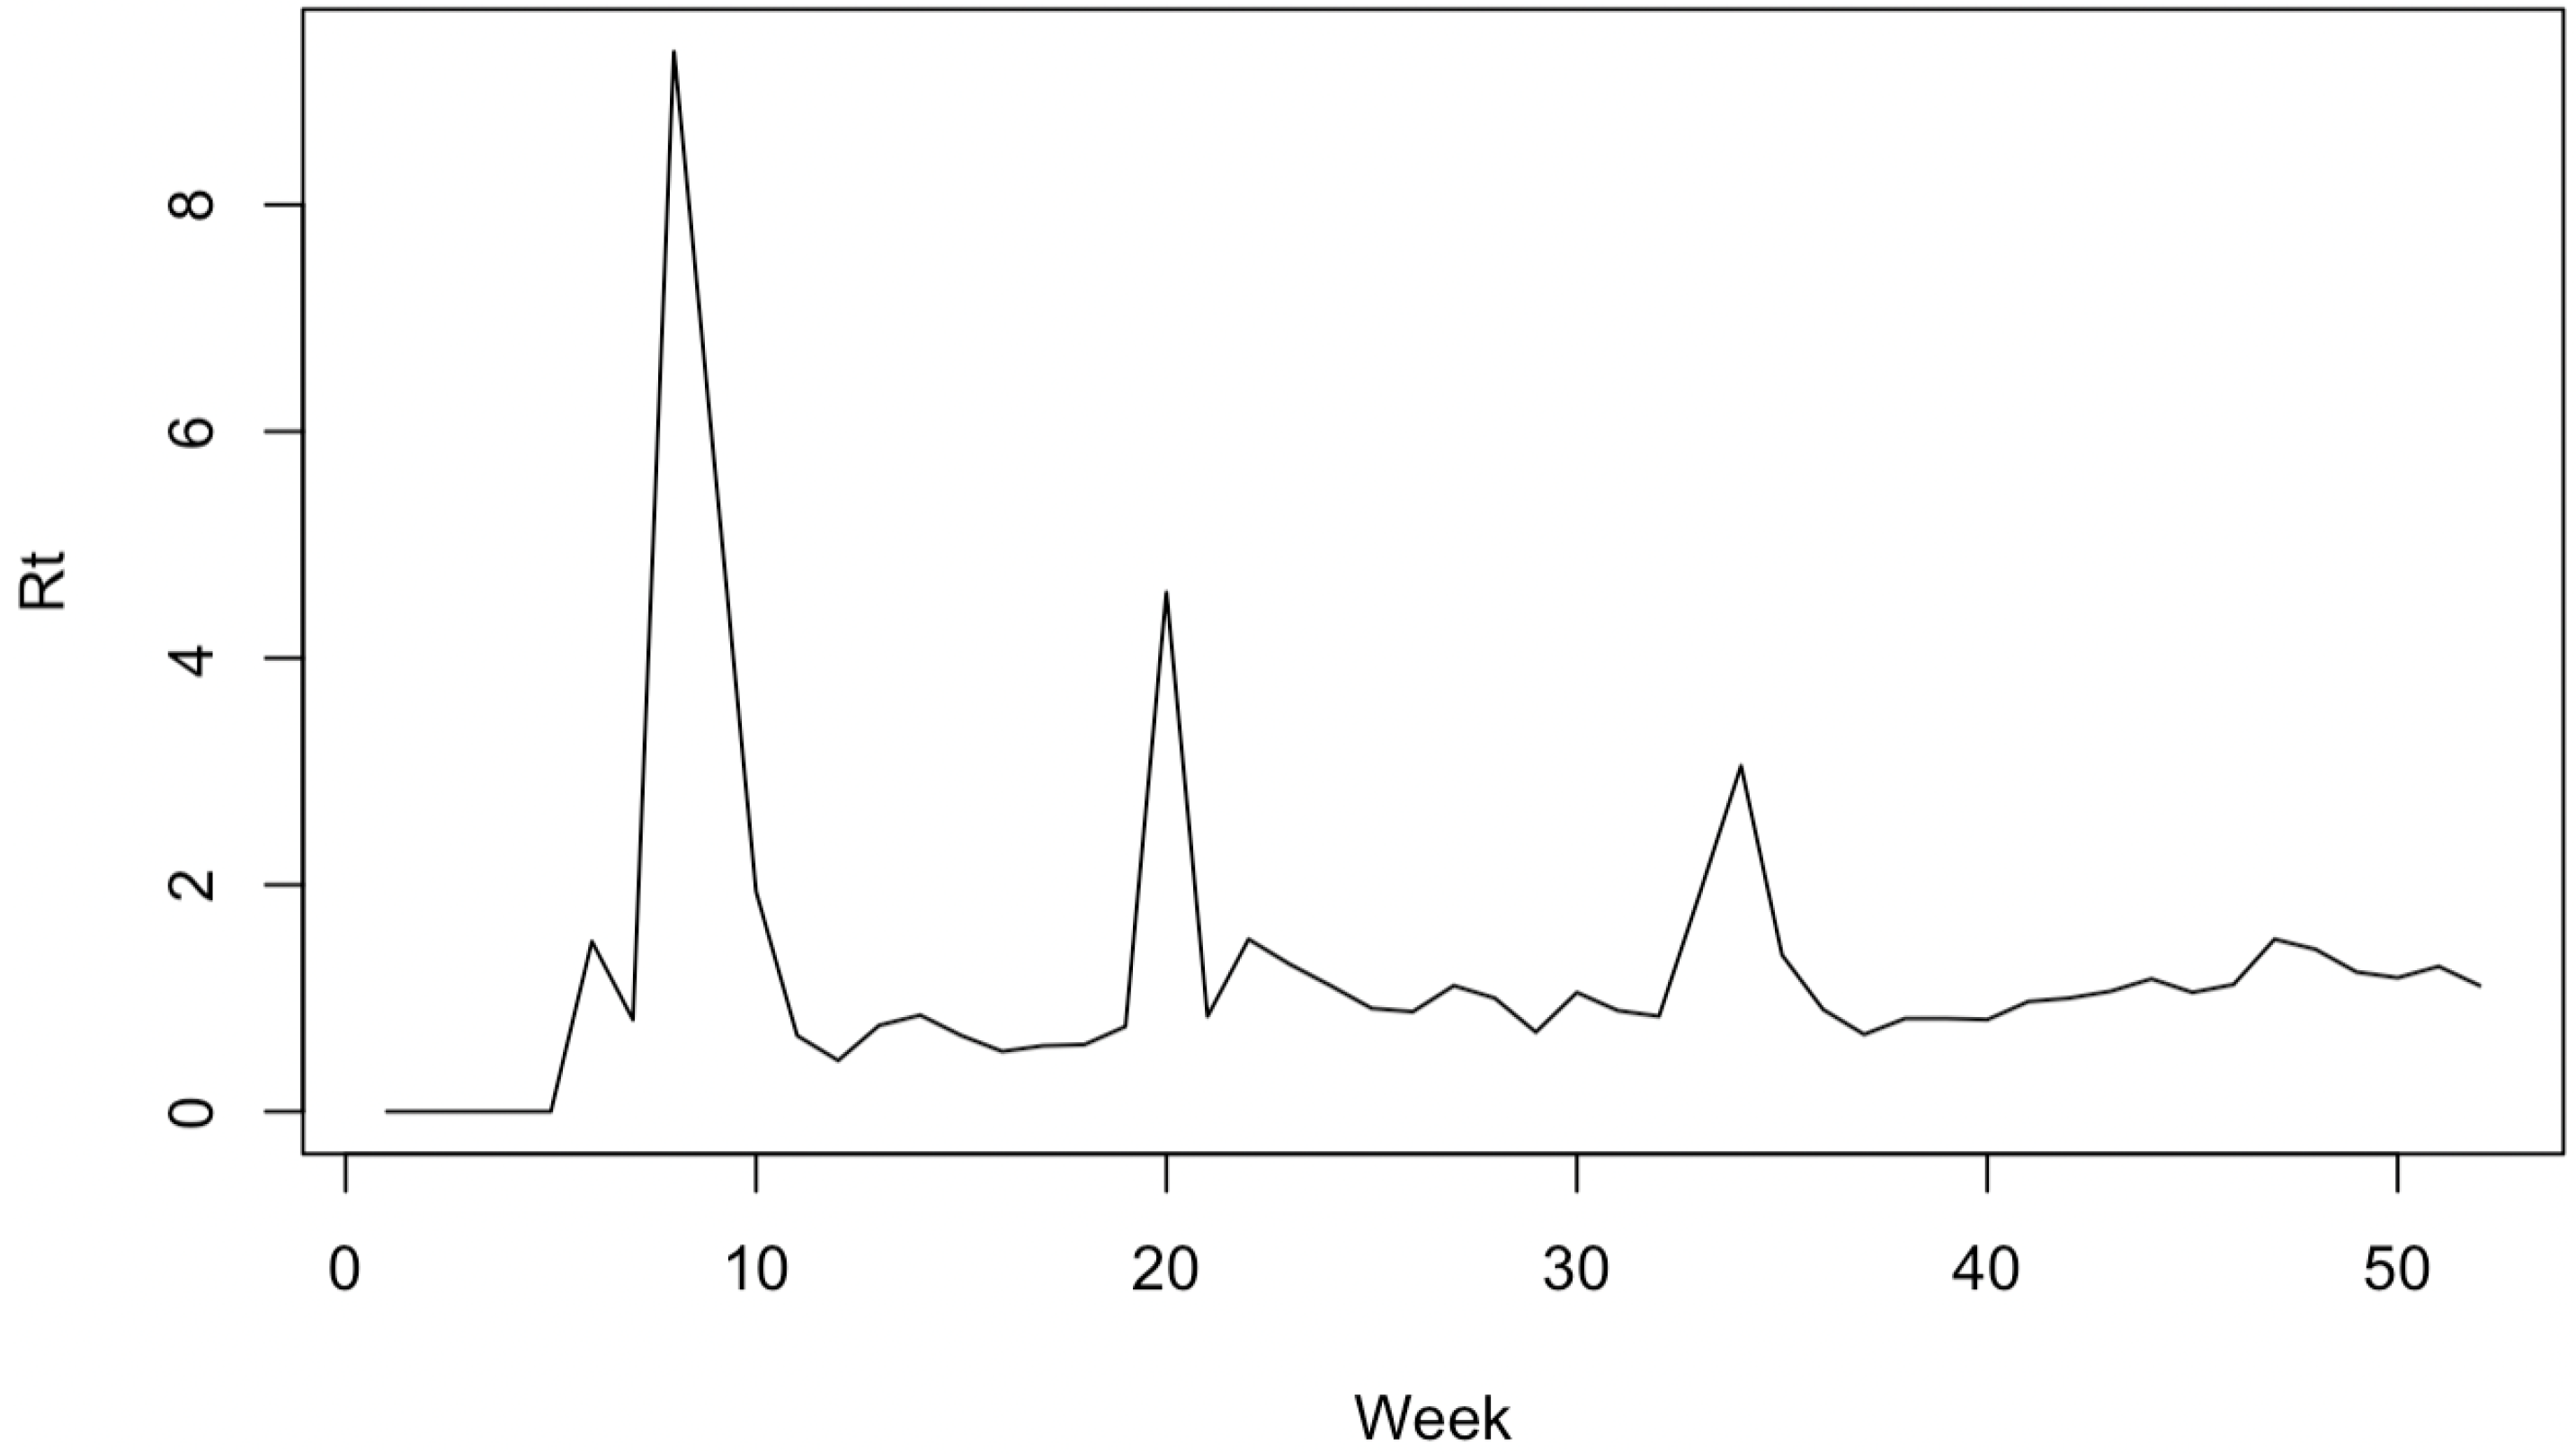
Beagle, the operator of the exercise app “Tranggle” collected big data specialized for outdoor exercise and activities and provides various services and information for the user, for example, a Customized Hiking and Trekking Information Guide [39]. The data used in this study were provided through approval procedures after consulting with the relevant company. The period of the data is from January 2019 to early December 2020. The number of data sets is 142,806 for 2019, 194,698 for 2020, and the total number of data sets is 337,504.

2.3.2. R t (Time-Varying Reproduction Number)

Reproduction number (R) is the average number of people a patient infects during a contagious period. If R > 1, the epidemic continues; if R < 1, the incidence decreases; if R = 1, it means the disease is endemic [40]. R t (time-varying reproduction number) is the average infectivity of the population at a specific point in time and is useful for estimating the number of new infections on a specific day, retrospectively or in real-time [41]. R t is a valuable indicator of whether the disease is spreading or not, and it is used as judgment data for setting the direction of quarantine measures [42]. So, to measure the degree of COVID-19’s spread and compare it with the following infectious circumstance and other national circumstances, we used R t data. These data were obtained from Yoo et al. [41] at the Korea Centers for Disease Control and Prevention. (Figure 2).

2.3.3. The Others

Weather factors affect hiking related to outdoor activity characteristics. To separate before and after hiking exercise differences from COVID-19 effects, it is necessary to compare seasonal atmospheric factors with the degree of COVID-19 spread ( R t ). The Korea Meteorological Agency provided weather observation data such as average temperature, daily precipitation, average wind speed, etc. When implementing the preliminary examination to find appropriate values, the average wind speed was not statistically significant; daily precipitation data had many zero values, so we thought it was not robust to outliers. After discussion, it was decided to remove average wind speed and daily precipitation variables according to the principle of parsimony. Average daily temperature and PM 10 were included as explanatory variables. Particulate matter (PM) is made up of particles (tiny pieces) of solids or liquids that are in the air [43]. PM impacts human health and the climate. The most significant PM which relates to health are particulates of diameter less than or equal to 10 nanometers, usually designated as PM 10 [44].

2.4. Analysis

2.4.1. Data Preprocessing

The data provided have 22 variables, including classification labels, actual movement distance, average speed, maximum speed, the length of time spent hiking, track name, and acquisition date. We used these variables to create derived variables. Hiking was extracted from classification labels. As acquisition dates were divided into the year and day of the week, “Year”, “week”, and “weekdays/weekends” categories were created. In addition, a “Mountain name” variable was created according to each file name provided. Afterward, final data were processed by checking and removing missing values, outliers, and weeks in which data for all 13 mountains were not included. Summary statistics of final data are displayed in Table 1. To analyze the data, we computed the weekly temperature average, PM 10 , exercise data, R t , etc. Moreover, to observe hiking characteristics pattern changes before and after the COVID-19 outbreak, hiking groups in the combined data were rearranged by mountain name, year, weeks, and weekdays or weekends. Weeks without data (weeks 49–52) were excluded.

2.4.2. Modeling

This study was fit to a model using a linear mixed model to find the changing relationship between the exercise characteristics (hiking frequency (HF), actual movement distance (AMD), total exercise time (TET), and average speed (AS)) and the degree of COVID-19 spread. The square root transformation is used for hiking frequency because heteroscedasticity was suspected when analyzing the residuals. The best model is selected based on the Akaike information criterion (AIC), the most popular model selection method. The linear mixed model was analyzed with the gam function of R’s mgcv library [45]. The linear mixed model can be described as
Y i j = β 0 + β 1 R i j + β 2 W i j + β 3 D i j + β 4 P i j + γ 1 j + ϵ i j
where Y i j = hiking exercise characteristics (number of hiking exercise characteristics, actual movement distance, average speed, total exercise time); β 0 = each hiking exercise characteristic’s expected mean; R i j = R t values; β 1 = the fixed R t values effect; W i j = weeks; β 2 = the fixed effect of weeks; D i j = whether the acquisition date is weekends ( D i j = 1)/ weekdays ( D i j = 2); β 3 = the fixed effect of whether the acquisition date is weekdays/weekends; P i j = P M 10 ; β 4 = the fixed PM 10 effect; γ 1 j = the random site (mountain) effect; γ 1 j N ( 0 , σ γ 2 ) , N ( 0 , σ γ 2 ) means a normal distribution with mean zero and variance σ γ 2 ; ϵ i j = independent random error variables, where ϵ σ follows the t-distribution with degree of freedom ν i = 1, …, and Hiking frequency, j = 1, …(number of observations of each mountain). In this model, β 0 , β 1 , β 2 , β 3 , β 4 , σ γ 2 , and μ are parameters to be estimated. After fitting a model for each hike exercise characteristic, the selected parameters could best explain useful variables in the model using AIC.

3. Results

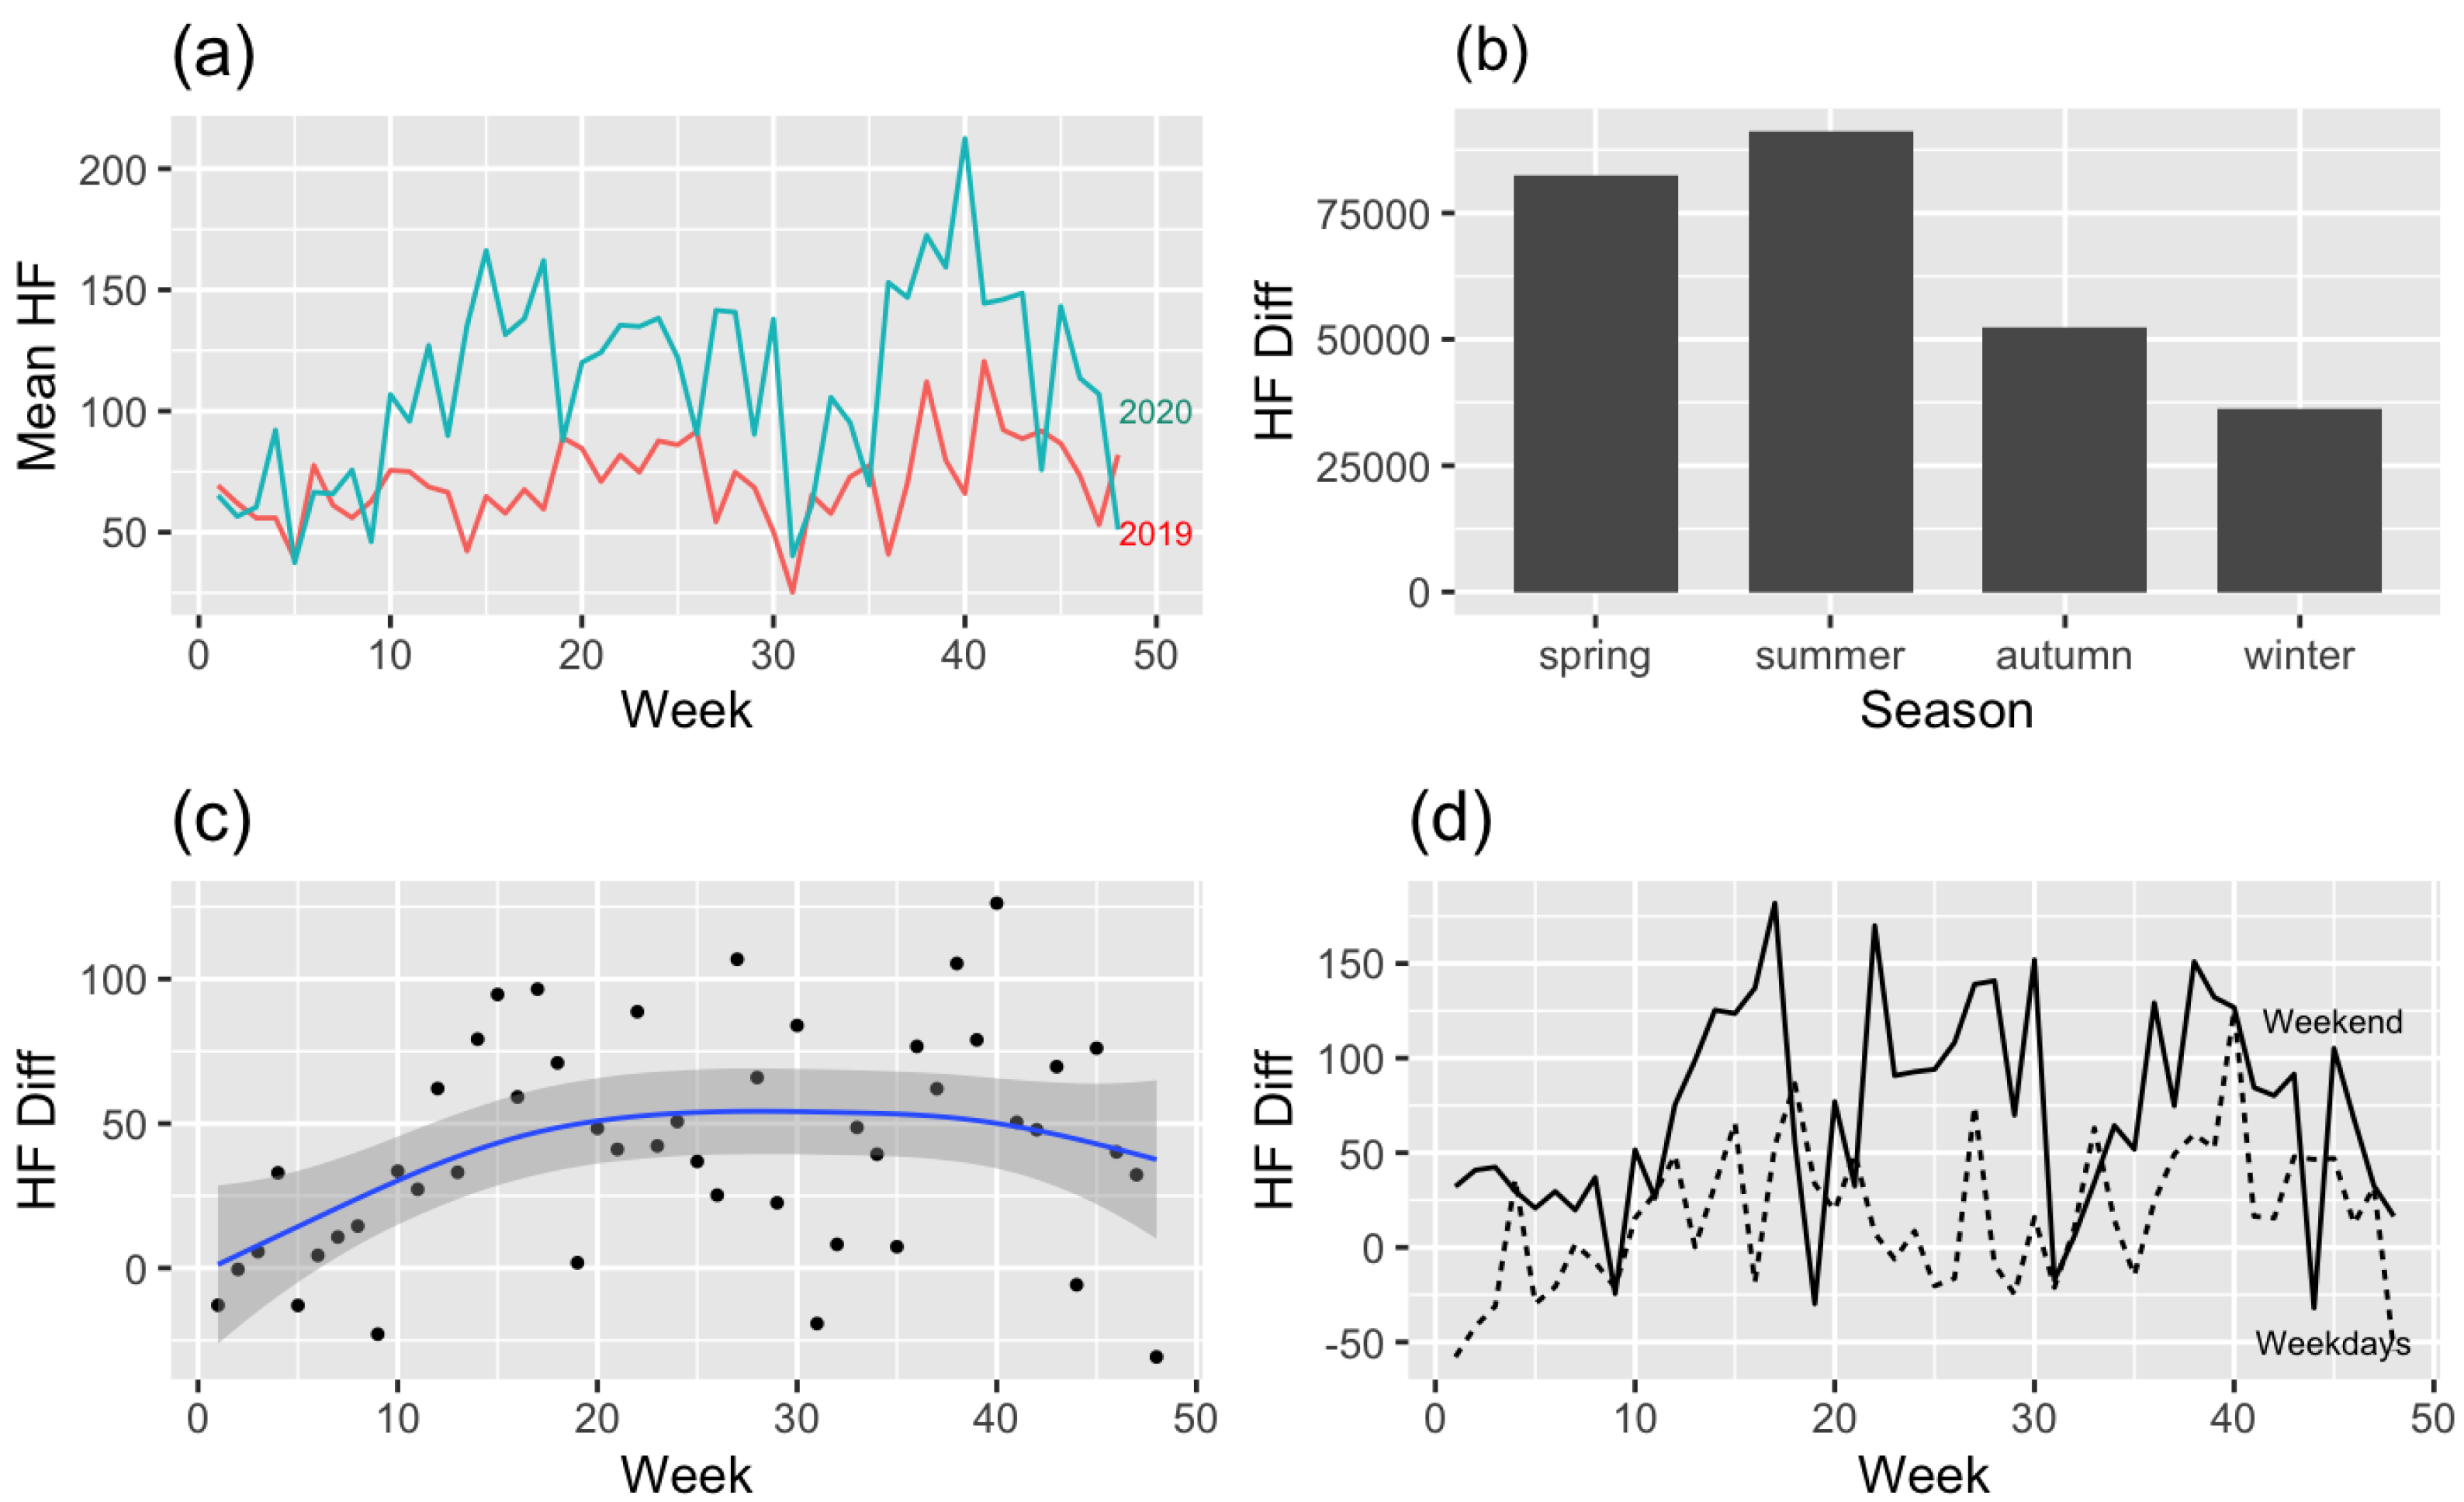
3.1. Hiking Frequency (Figure 3)

Hiking frequency in 2020 compared to 2019 before the COVID-19 outbreak was high in the order of Summer, Spring, Autumn, and Winter (Figure 3a,b). The season criterion refers to [46]. The trend line (Figure 3c) more clearly shows evidence of the above argument. The difference between 2019 and 2020 steadily advanced at 20 weeks and was maintained for 20–40 weeks, and the difference became less pronounced after 40 weeks. Note the difference between weekdays and weekends (Figure 3d), with more hiking on weekends than on weekdays for the extended period. In the modeling of hiking frequency differences within two years, the difference is affected by R t (Parametric coefficients: −0.20, p < 0.001), weekdays or weekends (Parametric coefficients: −2.00, p < 0.001), and PM 10 (Parametric coefficients: −0.02, p < 0.001) (Table 2). For a better understanding, the most common situations can be substituted for the derived model of hiking frequency as follows: Y i j = β 0 + β 1 R i j + β 3 D i j + β 4 P i j + γ 1 j + ϵ i j , where the mean R t is 1.079 and the mean PM 10 is 77.99 from these data. It can be interpreted that the hiking frequency of hikers in their 20s and 30s who climb mountains in the metropolitan area has increased 106.71 times on average since the outbreak of COVID-19, with an R t of 1.079 and a PM 10 of 77.99. Under the same conditions, the frequency was improved by 172.66 times on weekends. The week did not statistically significantly affect the hiking frequency, so it was excluded from this model.
Figure 3. (a) Mean hiking frequency (2019–2020) by week, (b) Hiking difference count by season, (c) regression model (linear mixed model) graph of hiking frequency difference (2019–2020), and (d) difference of hiking frequency between weekdays and weekends (2019–2020).
Ijerph 19 16403 g003

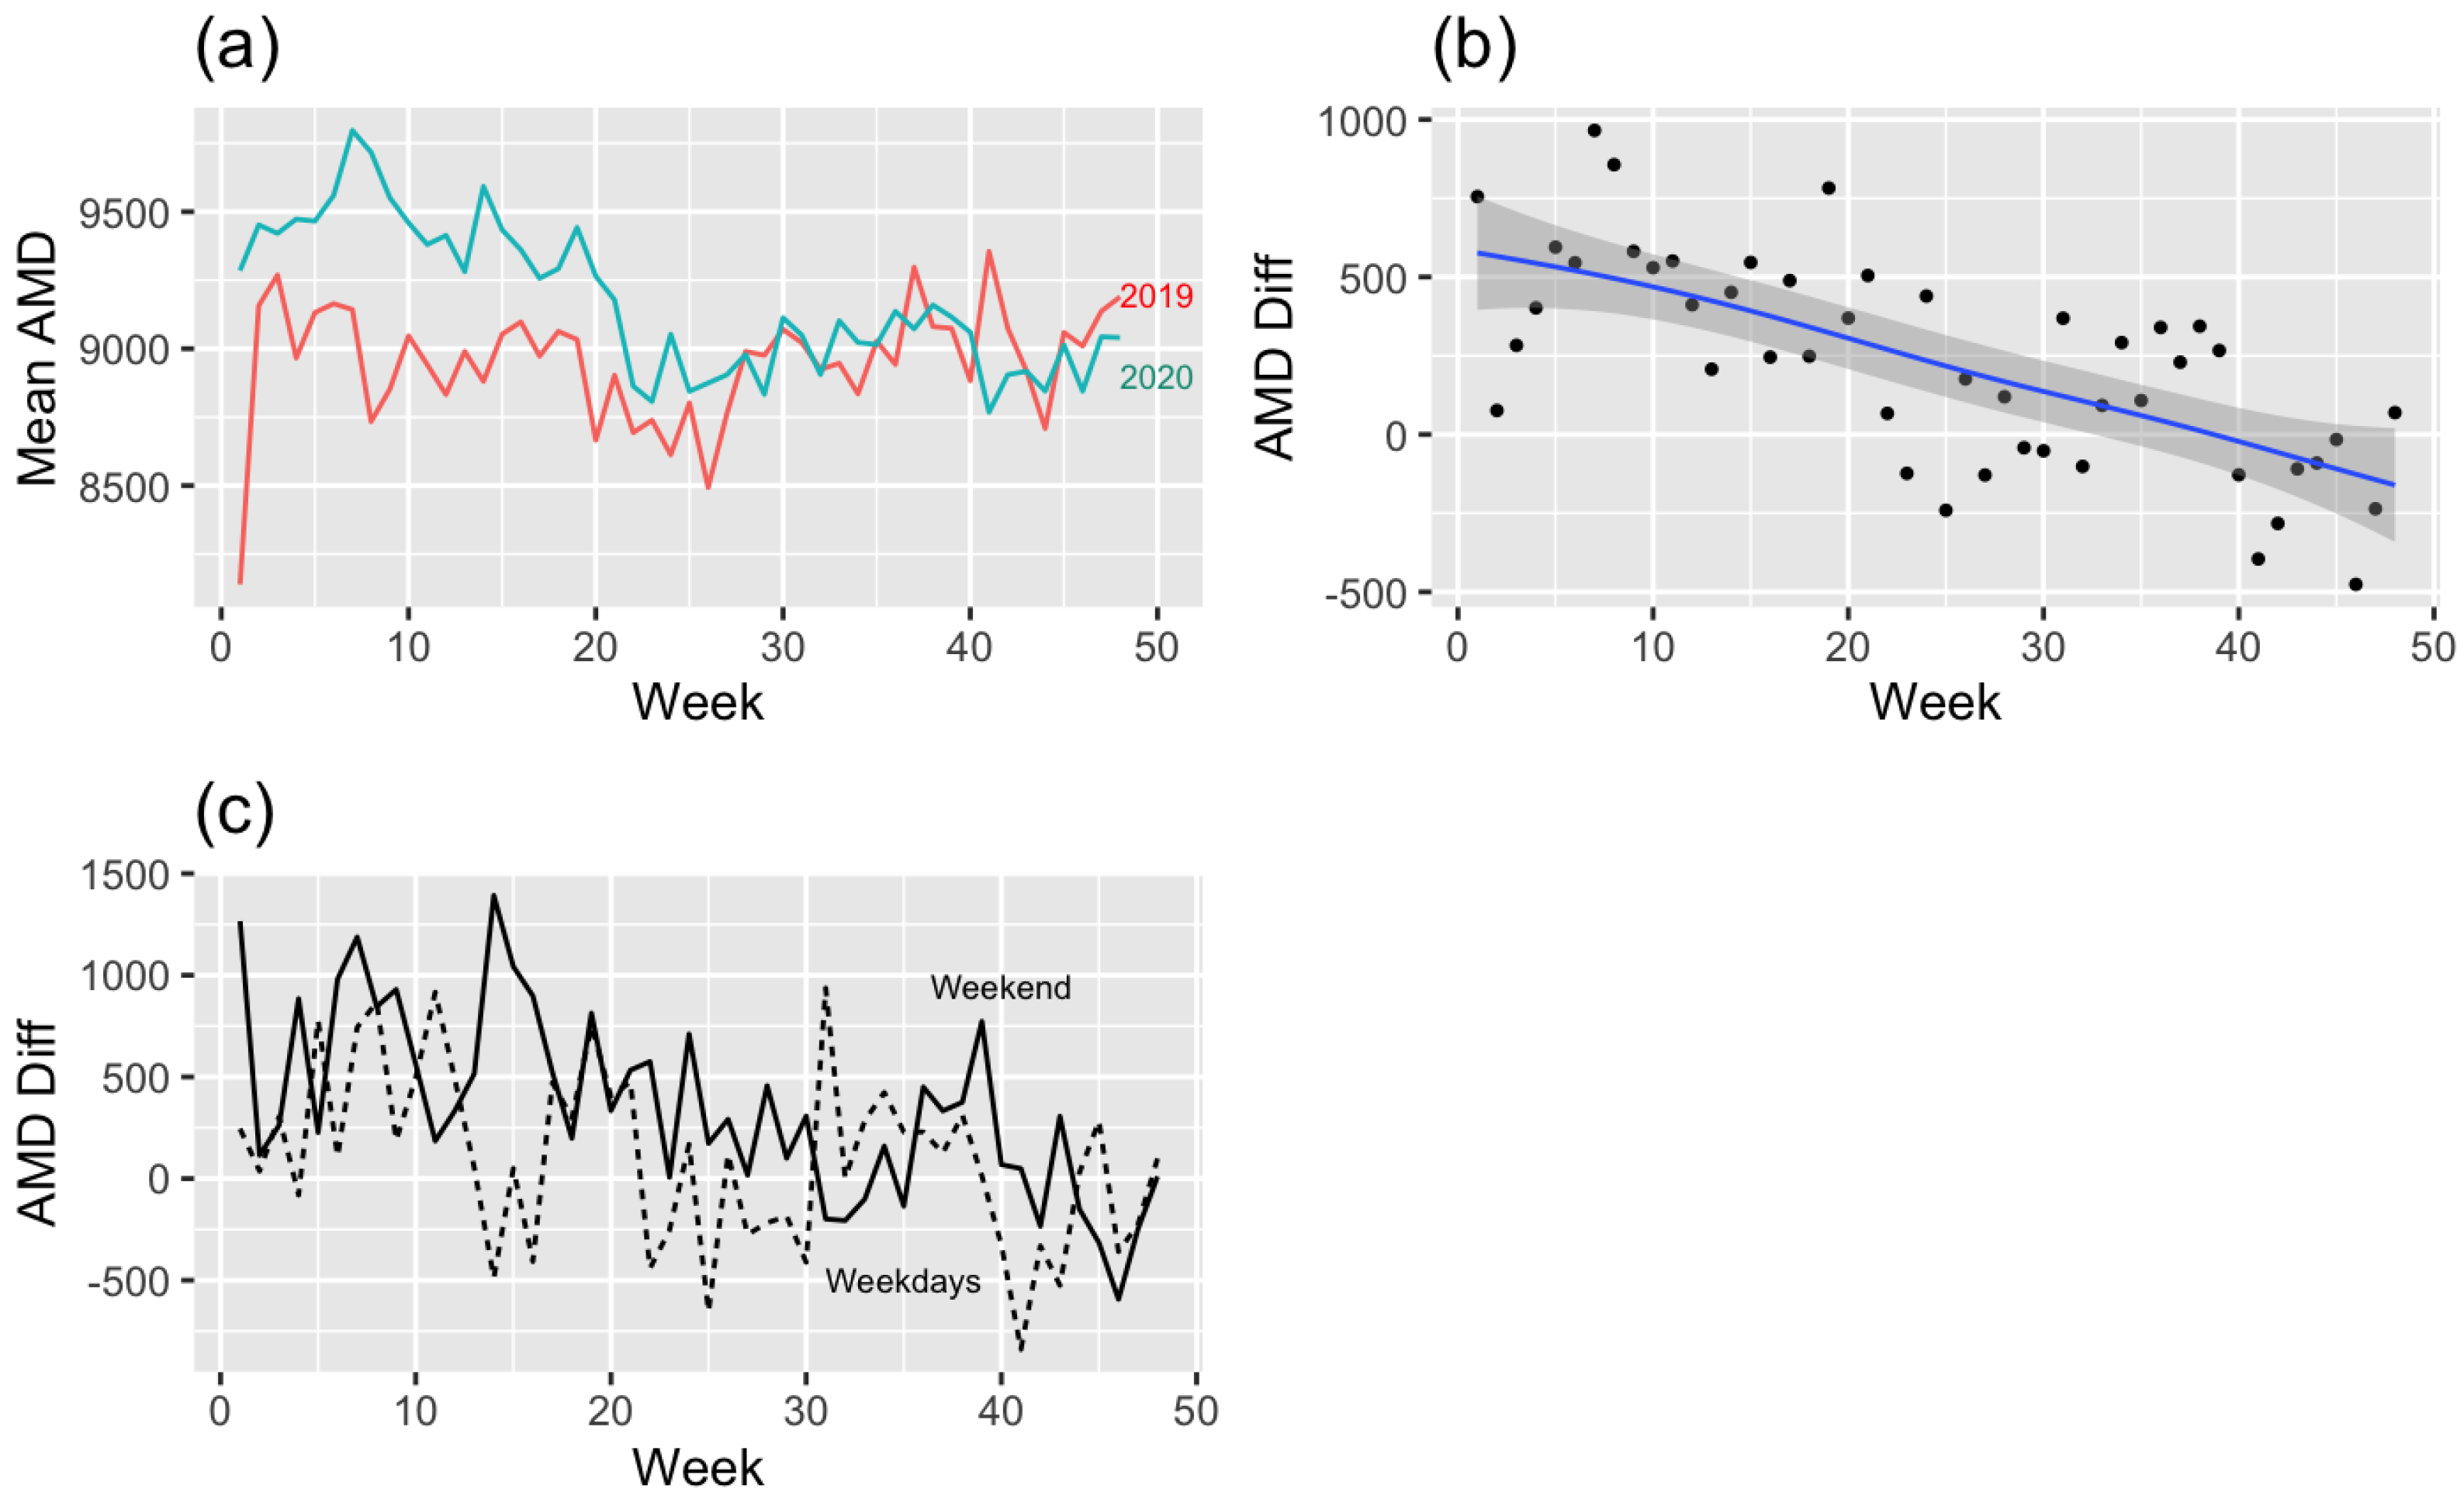
3.2. Actual Movement Distance (Figure 4)

Figure 4a shows actual movement distance differences (2019–2020). It shows an apparent difference between weeks 0 and 30 compared with 2019, before the outbreak of COVID-19. The trend line (Figure 4b) more clearly shows evidence of the above argument. The difference between 2019 and 2020 was prominent in the early days of COVID-19 and, after that, the difference steadily dwindled. Looking at the difference between weekdays and weekends (Figure 4c), the actual movement distance on weekends is longer than on weekdays throughout most periods, except for specific weeks. In the modeling of actual movement distance difference within two years, the difference is affected by week (Parametric coefficients: −17.00, p < 0.001) and weekdays or weekends (Parametric coefficients: −235.00, p < 0.01) (Table 2). For a better understanding, the most common situations can be substituted for the derived model of actual movement distance as follows: Y i j = β 0 + β 2 W i j + β 3 D i j + γ 1 j + ϵ i j . It can be interpreted that the actual movement distance of hikers in their 20s and 30s who climb mountains in the metropolitan area has increased 126.99 m on average since the outbreak of COVID-19, with an R t of 1.079, a PM 10 of 77.99, and a week mean of 24.53 from these data. Under the same conditions, it increased to 361.99 m on the weekend.
Figure 4. (a) Mean actual movement distance (2019–2020) by week, (b) regression model (linear mixed model) graph of actual movement distance difference (2019–2020), and (c) difference of actual movement distance of weekdays or weekends.
Ijerph 19 16403 g004

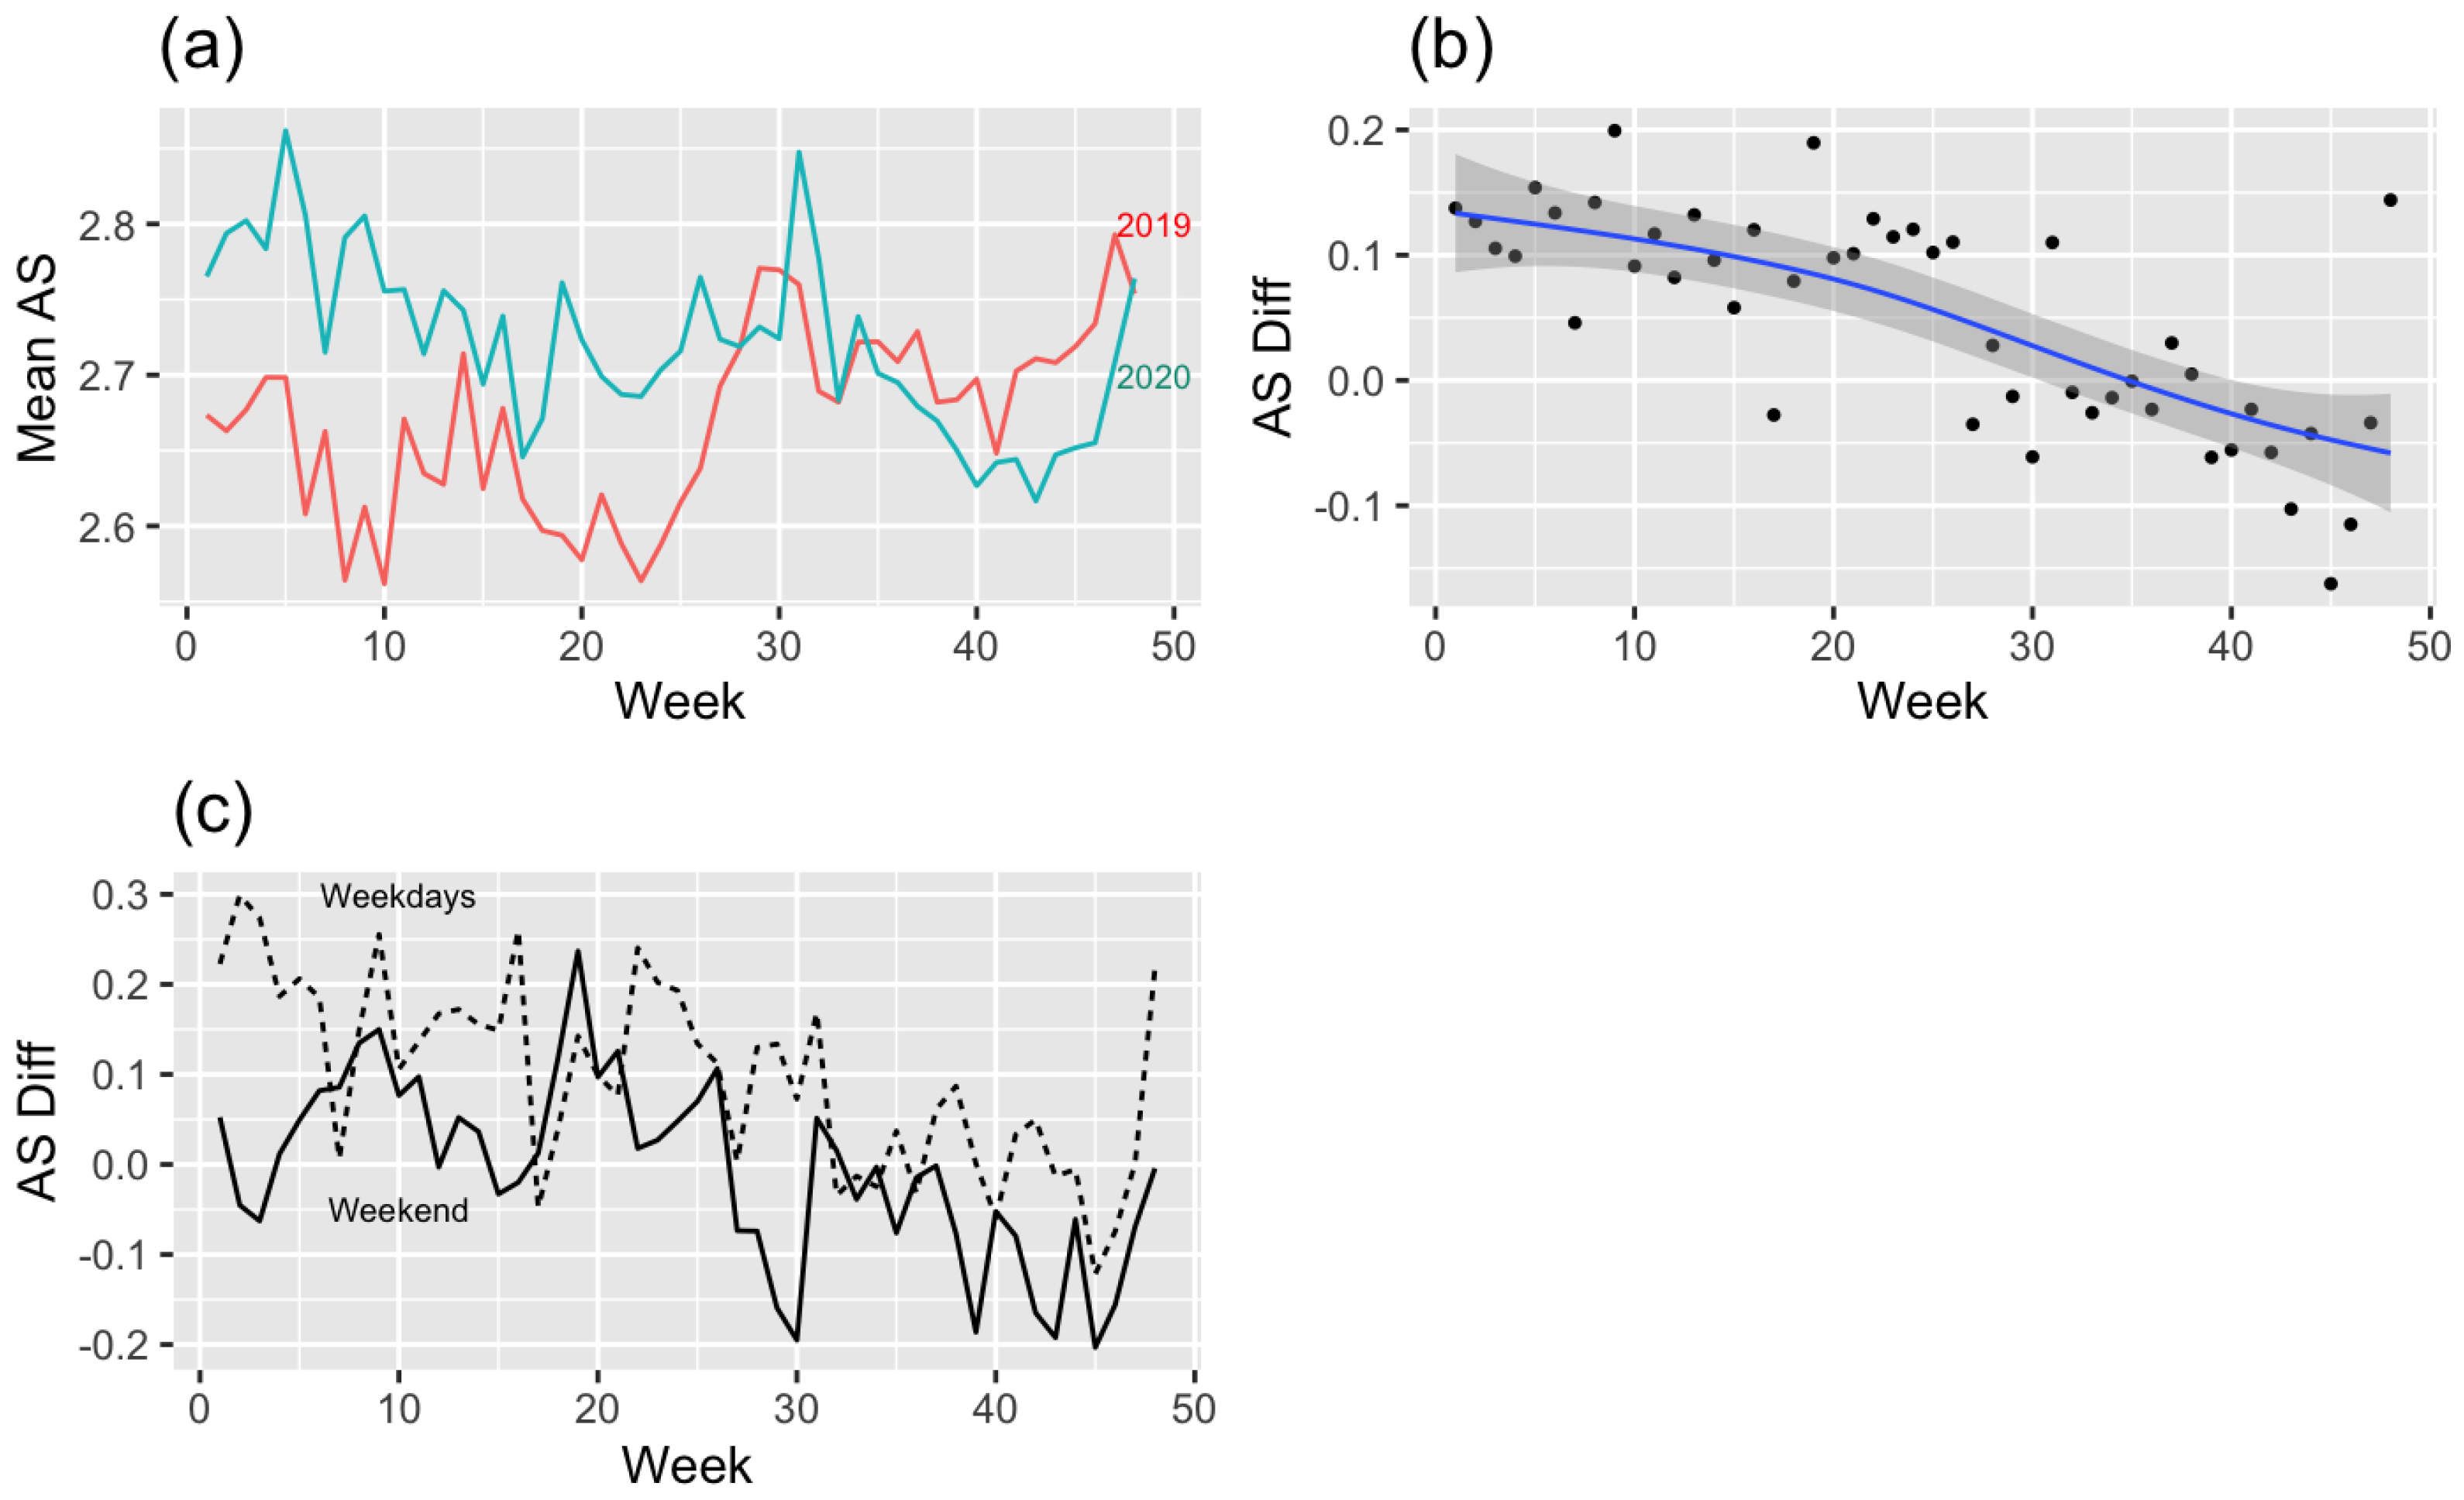
3.3. Average Speed (Figure 5)

Figure 5a shows the average speed difference (2019–2020). The difference has positive values at weeks 0–30, then it is changed to negative values. The trend line (Figure 5b) more clearly shows evidence of the above argument. The difference between 2019 and 2020 was prominent in the early COVID-19 period; after that, the difference steadily reduced and became slower compared to 2019 after 35 weeks. Looking at the difference between weekdays and weekends (Figure 5c), the average speed on weekdays is faster than on weekends throughout most of the period, except for specific weeks. In the modeling of the difference in average speed within two years, the difference is affected by weekdays or weekends (Parametric coefficients: 0.03, p < 0.001) (Table 2). For a better understanding, the most common situations can be substituted for the derived model of average speed as follows: Y i j = β 0 + β 3 D i j + γ 1 j + ϵ i j . It can be interpreted that hikers in their 20s and 30s who climb mountains in the metropolitan area have increased their hikes by 126.99 m on average since the outbreak of COVID-19, with a weekly mean of 24.53. It can be interpreted that after the outbreak of COVID-19, the average speed in the 13 mountains in the Seoul Metropolitan Area which were visited by most people in their 20s and 30s, increased by 0.06 m/s on average. Under the same conditions, the speed increased by 0.03 m/s on the weekend. The week also statistically significantly affected the average speed, but the coefficient estimate was zero, so it was excluded from this model.
Figure 5. (a) Mean average speed (2019–2020) by week, (b) regression model (linear mixed model) graph of average speed difference (2019–2020), and (c) difference in the average speed of weekdays or weekends (2019–2020).
Ijerph 19 16403 g005

3.4. Total Exercise Time (Figure 6)

Figure 6a shows the total exercise time difference (2019–2020). The trend line (Figure 6b) more clearly shows evidence of the above argument. It is observed that there is no difference between 2019 and 2020 in total exercise time. Looking at the difference between weekdays and weekends (Figure 6c), the total exercise time on weekends was high compared to 2019 for the longest period. In the modeling of the total exercise time differences within two years, the difference is affected by weekdays or weekends (Parametric coefficients: −18.59, p < 0.001) (Table 2). For a better understanding, the most common situations can be substituted for the derived model of total exercise time as follows: Y i j = β 0 + β 3 D i j + γ 1 j + ϵ i j . It can be interpreted that hikers in their 20s and 30s who climb mountains in the metropolitan area have increased their exercise time by 7.33 min on average since the outbreak of COVID-19 on weekdays. Under the same conditions, it grew by 25.92 min on the weekend.
Figure 6. (a) Mean total exercise time (2019–2020) by week, (b) regression model (linear mixed model) graph of the total exercise time difference (2019–2020), and (c) difference in total exercise time of weekdays or weekends (2019–2020).
Ijerph 19 16403 g006

4. Discussion

This study aimed to investigate the factors and relationships influencing the hiking exercise characteristics after the COVID-19 outbreak, focusing on people in their 20s and 30s who hiked the mountains in the urban and peri-urban Seoul Metropolitan Area. These results indicate that the degree of COVID-19’s spread ( R t ) affected hiking frequency. It was also found that various factors differently influence the hiking exercise characteristics and the relationships between related factors and hiking exercise characteristics.
Hiking frequency increased until week 40; however, total exercise time has stayed the same since the first year of the pandemic. Actual movement distance and average speed were prominently high in the early pandemic, but a reduction was observed after that. The following were observed: Since COVID-19 occurence, hiking frequency has increased and hiking participation was different depending on the degree of COVID-19’s spread, but time spent hiking remained consistent regardless of spread. Actual movement distance and average speed seemed to be associated with social circumstance; the difference in actual movement distance from the previous year’s was high until about week 20 (Figure 4a). In the case of the increase in average speed, it became more rapid after week 20 (Figure 5b). The high-strength social distancing, such as refraining from going out, was implemented during this period. In addition, the average speed in 2020 soared, overlapping with the time of the curve that confirmed cases increased sharply. Comprehensively, it could be interpreted that the MZ generation was looking for an alternative to lost opportunities for incidental or non-incidental physical activity as anxiety was high as a result of having no information about a new virus. They were flexible, coped with social circumstances, and kept hiking. Hiking was one of the alternative modes of exercise they selected. These changes, such as the kind of exercise and patterns arising from COVID-19, were also seen in the age groups [47,48] and with time, showing that individuals learn to adapt to situations in healthy and positive ways [48].
Di Sebastiano et al. [49] looked at ten weeks before and after COVID-19’s occurrence through the data of the national physical activity tracking app (PAC app) that recorded physical activity strength by heart rate and number of steps walked. They stated that moderate-to-vigorous physical activity, light physical activity, and total steps significantly decreased immediately following the declaration of the pandemic. However, six weeks later, moderate-to-vigorous physical activity had returned to prepandemic levels. A Community Health Survey in Korea [13] reported that low-strength exercise (walking) and moderate physical activity declined after the pandemic outbreak. The results of the Community Health Survey in Daegu (Korea) [50] showed that the people who do not practice moderate to vigorous physical activity, residents in urban areas, those with high health anxiety from COVID-19 infection, and those with perceived depression and obesity had decreased physical activity compared to before the COVID-19 pandemic. In those 20–40 years old, the level of physical activity also relatively significantly decreased; they said it is because they are the generation who engaged in active physical activity prepandemic. Wilke et al. [51] performed a survey in 14 countries and reported that compared to the prerestrictions period, overall self-reported PA declined by 41% (vigorous physical activity) and 42.2% (vigorous physical activity). Reductions were higher for working people, younger and older people, and previously more active people but were similar between men and women. In this context, Jin and Kim [50], Hargreaves et al. [52], and Tornaghi et al. [53] said that intervention in the activity status of individuals prelockdown needs to be taken into account.
Given that COVID-19 presented vulnerabilities in the structure of society [54,55], counteracting COVID-19 was, in addition to managing the virus, moreover about understanding the crucial social-economic crisis arising from infectious diseases and counteracting them [56]. Physical activity has decreased due to restrictions established after the pandemic’s occurrence. The timeline was different in each country, but interest in and usage of green spaces grew in this era evenly. During the pandemic, greater use forestry space, such as urban green space and green infrastructure, could be considered an active, reasonable detour strategy. It shows the possibility of utilization and the importance of forestry space in an epidemic of infectious diseases. Based on our results, policy guidelines for o mitigating physical activity loss to preserve health are the following: First, people are flexibly coping with the degree of COVID-19’s spread. However, providing programs such as self-guided therapeutic programs and app content when the spread of COVID-19 is high is needed to encourage continuous participation. Second, once they start hiking, people take a certain amount of time for exercise regardless of the degree of COVID-19’s spread, so it is necessary to guide participants through the connecting forestry space with other resources in a community to increase ease of access to hiking exercise.
Prior studies of the usage behavior of forests have been surveyed, either focused on parts of regions or peak seasons [27,31,32,33]. However, surveys lacked information such as date from a broad area, time series data on usage behavior, and specific hiking characteristics [57]. We used self-recorded data collected from the exercise app “Tranggle”. We could therefore look at a wider region and over a longer term. However, we still have limitations in the sense that we only looked at two generations and at one metropolitan area due to the policies of the company with regard to sharing research data. It is necessary to follow-up with studies concerning other ages, gender differences, and specific vulnerable groups that showed decreased physical activity and interest.
These results could be provided to individuals and public institutions for better selection of physical and psychological aspects under social-distancing circumstances.

5. Conclusions

We investigated factors and relationships influencing hiking exercise characteristics after the pandemic outbreak. We found that the degree of COVID-19’s spread was affected by certain characteristics and what the relationships were between influencing factors and hiking exercise characteristics. Hiking was one of the alternatives to losing opportunities for physical activity. Moreover, the people who use “Tranggle” in their 20s and 30s actively participated in hiking to cope with the spread of COVID-19. It is necessary to provide the various usage program to prepare for the periods the degree of COVID-19 spread is high for continuous participation. Further, to induce hiking exercise, increase ease of access through various ways such as relating the resources.

Author Contributions

Conceptualization, B.L. and S.P.; methodology, B.L.; software, B.L.; validation, B.L., P.Y. and S.P.; formal analysis, B.L.; investigation, B.L.; resources, B.L.; data curation, B.L.; writing—original draft preparation, B.L.; writing—review and editing, B.L.; visualization, B.L.; supervision, P.Y. and S.P.; project administration, B.L.; funding acquisition, S.P. All authors have read and agreed to the published version of the manuscript.

Funding

This work was supported by the research grant of the Chungbuk National University in 2021. The authors also gratefully acknowledges partial support of this research by the National Research Foundation of Korea (NRF) grant funded by the Korea government (MSIT) (NRF-2021R1F1A1064096).

Data Availability Statement

Not applicable.

Conflicts of Interest

The authors declare no conflict of interest.

References

  1. Pipitone, J.M.; Jović, S. Urban green equity and COVID-19: Effects on park use and sense of belonging in New York City. Urban Urban Green 2021, 65, 127338. [Google Scholar] [CrossRef]
  2. UNWTO World Tourism Barometer. UNWTO World Tourism Barometer and Statistical Annex, December 2020. Available online: https://www.e-unwto.org/doi/epdf/10.18111/wtobarometereng.2020.18.1.7?role=tab (accessed on 28 October 2022).
  3. Vaishar, A.; Šťastná, M. Impact of the COVID-19 pandemic on rural tourism in Czechia Preliminary considerations. Curr. Issues Tour. 2022, 25, 187–191. [Google Scholar] [CrossRef]
  4. Marques, C.P.; Guedes, A.; Bento, R. Rural tourism recovery between two COVID-19 waves: The case of Portugal. Curr. Issues Tour. 2022, 25, 857–863. [Google Scholar] [CrossRef]
  5. Ministry of Culture, Sports and Tourism during the Corona 19, Cultural Life Inside the House, Outdoor Activities Near the House [Press Release]. Available online: https://www.mcst.go.kr/kor/s_notice/press/pressView.jsp?pSeq=18455&pMenuCD=0302000000&pCurrentPage=10&pTypeDept=&pSearchType=01&pSearchWord=%EC%BD%94%EB%A1%9C%EB%82%98 (accessed on 14 October 2022).
  6. Korea Tourism Organization S.A.F.E.T.Y.’s Travel Trend Changed by Safety Awareness [Press Release]. Available online: https://kto.visitkorea.or.kr/kor/notice/news/press/board/view.kto?id=441712&instanceId=42 (accessed on 13 October 2022).
  7. Huang, J.; Floyd, M.; Tateosian, L.; Hipp, J. Exploring public values through Twitter data associated with urban parks pre-and post-COVID-19. Landsc Urban Plan 2022, 227, 104517. [Google Scholar] [CrossRef]
  8. Chae, J.; Cho, M. Changes in the Cultural Trend of Use by Type of Green Infrastructure Before and After COVID-19 Using Blog Text Mining in Seoul. J. People Plants Environ. 2021, 24, 415–427. [Google Scholar] [CrossRef]
  9. Kim, S.; Park, C.; Kim, S.; Oh, J.; Kim, H. Major national quarantine systems due to the spread of Omicron mutation Conversion Trends. Wkly. Health Illn. 2022, 15, 6. [Google Scholar]
  10. Chappell, B. Here’s Why Dr. Fauci Says the U.S. Is ’Out of the Pandemic Phase’. npr. Available online: https://www.npr.org/2022/04/27/1094997608/fauci-us-pandemic-phase-covid-19 (accessed on 27 April 2022).
  11. UN News. ’COVID-19 Is Not Over’. United Nations. Tedros Warns World Health Assembly. Available online: https://news.un.org/en/story/2022/05/1118752 (accessed on 22 May 2022).
  12. Carlson, C.J.; Albery, G.F.; Merow, C.; Trisos, C.H.; Zipfel, C.M.; Eskew, E.A.; Olival, K.J.; Ross, N.; Bansal, S. Climate change increases cross-species viral transmission risk. Nature 2022, 607, 555–562. [Google Scholar] [CrossRef]
  13. Korea Centers for Disease Control and Prevention. 2020 Community Health Survey. Available online: http://125.61.91.238:8080/SynapDocViewServer/viewer/doc.html?key=000000007f2a25c70184ea1e51a16d7d&convType=img&convLocale=ko&contextPath=/SynapDocViewServer (accessed on 28 October 2022).
  14. Violant-Holz, V.; Gallego-Jiménez, M.G.; González-González, C.S.; Muñoz-Violant, S.; Rodríguez, M.J.; Sansano-Nadal, O.; Guerra-Balic, M. Psychological health and physical activity levels during the COVID-19 pandemic: A systematic review. Int. J. Environ. Res. Public Health 2020, 17, 9419. [Google Scholar] [CrossRef]
  15. Lee, D.; Lee, M.; Jeong, Y.; Kim, J.; Yoon, Y.; Shin, W. Influence of Forest Visitors’ Perceived Restorativeness on Social–Psychological Stress. Int. J. Environ. Res. Public Health 2021, 18, 6328. [Google Scholar] [CrossRef]
  16. Clemente-Suárez, V.J.; Beltrán-Velasco, A.I.; Ramos-Campo, D.J.; Mielgo-Ayuso, J.; Nikolaidis, P.A.; Belando, N.; Tornero-Aguilera, J.F. Physical activity and COVID-19. The basis for an efficient intervention in times of COVID-19 pandemic. Physiol. Behav. 2022, 244, 113667. [Google Scholar] [CrossRef]
  17. Ding, Y.; Li, D.; Sang, H. Park Characteristics and Changes in Park Visitation before, during, and after COVID-19 Shelter-in-Place Order. Sustainability 2022, 14, 3579. [Google Scholar] [CrossRef]
  18. Janeczko, E.; Bielinis, E.; Wójcik, R.; Woźnicka, M.; Kędziora, W.; Łukowski, A.; Elsadek, M.; Szyc, K.; Janeczko, K. When Urban Environment Is Restorative: The Effect of Walking in Suburbs and Forests on Psychological and Physiological Relaxation of Young Polish Adults. Forests 2020, 11, 591. [Google Scholar] [CrossRef]
  19. Wortzel, J.D.; Wiebe, D.J.; DiDomenico, G.E.; Visoki, E.; South, E.; Tam, V.; Greenberg, D.M.; Brown, L.A.; Gur, R.C.; Gur, R.E.; et al. Association Between Urban Greenspace and Mental Wellbeing during the COVID-19 Pandemic in a U.S. Cohort. Front. Sustain. Cities 2021, 3, 686159. [Google Scholar] [CrossRef]
  20. Rice, W.L.; Pan, B. Understanding changes in park visitation during the COVID-19 pandemic: A spatial application of big data. Wellbeing Space Soc. 2021, 2, 100037. [Google Scholar] [CrossRef]
  21. Yang, Y.; Lu, Y.; Yang, L.; Gou, Z.; Liu, Y. Urban greenery cushions the decrease in leisure-time physical activity during the COVID-19 pandemic: A natural experimental study. Urban Urban Green 2021, 62, 127136. [Google Scholar] [CrossRef]
  22. Liu, S.; Wang, X. Reexamine the value of urban pocket parks under the impact of the COVID-19. Urban Urban Green 2021, 64, 127294. [Google Scholar] [CrossRef]
  23. Kim, T. The Use and Misuse of the Natural Experiment Analysis; A Case of the Minimum Wage Increase. Korea Assoc. Policy Stud. 1996, 5, 49–69. [Google Scholar]
  24. Zhou, C.; Su, F.; Pei, T.; Zhang, A.; Du, Y.; Luo, B.; Cao, Z.; Wang, J.; Yuan, W.; Zhu, Y. COVID-19: Challenges to GIS with big data. Geogr. Sustain. 2020, 1, 77–87. [Google Scholar] [CrossRef]
  25. University Tomorrow’s 20 Research Institutes. Millennial-Gen Z Trends 2020; Wisdomhouse: Seoul, Korea, 2019; pp. 32–270. [Google Scholar]
  26. Kim, N.; Zeon, M.; Choi, J.; Lee, H.; Lee, J.; Kim, S.; Lee, Y.; Seo, Y.; Kwon, J. Trend Korea 2020; Mirae ŭi Ch’ang: Seoul, Republic of Korea, 2019; pp. 20–400. [Google Scholar]
  27. National Institute of Forest Science. Survey Report on National Forest Leisure Activities. Available online: http://know.nifos.go.kr/book/Mo.file?cid=173554&moi=14705&rid=5 (accessed on 28 October 2022).
  28. Korea Tourism Organization. How Did Walking Travel Change during the Corona Era? [Press Release]. Available online: http://kto.visitkorea.or.kr/kor/notice/news/press/board/view.kto?id=443047&isNotice=false&instanceId=42&rnum=3 (accessed on 3 November 2021).
  29. Chang, C.; Park, S.; Seol, A. Factors Affecting Changes in Forest Recreational Activities During the COVID-19 Pandemic. J. Korean Soc. For. Sci. 2021, 110, 711–723. [Google Scholar]
  30. Venter, Z.S.; Barton, D.N.; Gundersen, V.; Figari, H.; Nowell, M.S. Back to nature: Norwegians sustain increased recreational use of urban green space months after the COVID-19 outbreak. Landsc Urban Plan 2021, 214, 104175. [Google Scholar] [CrossRef]
  31. Joo, J.; Yoon, Y. An Analysis on Utilization of Urban Forest and Awareness of Forest Effect for Urban Heat Island(UHI) Reduction—A Case Study of Chung-ju City. Urban Design 2011, 12, 39–50. [Google Scholar]
  32. Shin, W.; Yeon, P.; Lee, J.; Lee, J.; Kim, K. The Important-Performance Analysis of Urban Recreational Forests. J. KIFR 2010, 14, 17–29. [Google Scholar]
  33. Byun, W.; Lee, J.; Seo, E.; Hong, Y.; Kim, T. A study on Urban Resident’s Preference for Developing Urban Recreational Forest—The Case Study on Seoul. J. KIFR 2003, 7, 19–25. [Google Scholar]
  34. Statistic Korea. Population and Population Density by Region. Available online: https://www.index.go.kr/potal/main/EachDtlPageDetail.do?idx_cd=1007 (accessed on 2 June 2021).
  35. Kim, Y. Do it! R for Data Analysis; EasysPublishing Co., Ltd.: Seoul, Republic of Korea, 2017. [Google Scholar]
  36. Heo, M. (Using R) Exploratory Data Analysis; Freeacademy: Paju, Republic of Korea, 2011; ISBN 9788973389162. [Google Scholar]
  37. Lee, B.; Yeon, P. An EDA Analysis of Seoul Metropolitan Area’s Mountain Usage Patterns of Users in Their 20 30 s after COVID-19 Occurrence. J. People Plants Environ. 2021, 24, 229–244. [Google Scholar] [CrossRef]
  38. Brown, V.A. An Introduction to Linear Mixed-Effects Modeling in R. AMPPS 2021, 4, 2515245920960351. [Google Scholar] [CrossRef]
  39. BEAGLE. Available online: https://www.beaglepeople.com/ (accessed on 22 February 2021).
  40. Baek, S.; Kwon, Y.; Kwon, D.; Ko, Y.; Lee, J.; Jung, E. COVID-19 2020 Forecasts in South Korea Using Mathematical Modeling of Infectious Diseases. Wkly. Health Illn. 2020, 13, 3000–3008. [Google Scholar]
  41. Yoo, M.; Kim, Y.; Back, S.; Kwon, D. The Concept of Reproduction Number and Changes According to Government Response Policies. Wkly. Health Illn. 2021, 14, 282–289. [Google Scholar]
  42. Lee, H.; Kwon, Y. Mathematical Analysis of COVID-19: A Mathematical Model Becomes the Basis for Establishing Quarantine Policies. Available online: https://www.ibs.re.kr/cop/bbs/BBSMSTR_000000001003/selectBoardArticle.do?nttId=20165&pageIndex=1&searchCnd=&searchWrd=# (accessed on 24 October 2021).
  43. CDC. Particle Pollution. Available online: https://www.cdc.gov/air/particulate_matter.html (accessed on 17 November 2022).
  44. IPCC. Climate Change 2014: Mitigation of Climate Change: Working Group III Contribution to the IPCC Fifth Assessment Report; Cambridge University Press: Cambridge, UK, 2015. [Google Scholar]
  45. Wood, S.N. Generalized Additive Models: An Introduction with R, 2nd ed.; Chapman and Hall/CRC: New York, NY, USA, 2006; pp. 59–112. [Google Scholar]
  46. Choi, G.; Kwon, W.; Robinson, D.A. Seasonal onset and duration in South Korea. J. Korean Geogr. Soc. 2006, 41, 435–456. [Google Scholar]
  47. Kwon, O. A Case Study of Changes in the Exercise Behavior of the Elderly by COVID-19. Korean J. Sport Psychol. 2020, 31, 123–134. [Google Scholar] [CrossRef]
  48. Kaur, H.; Singh, T.; Arya, Y.K.; Mittal, S. Physical Fitness and Exercise During the COVID-19 Pandemic: A Qualitative Enquiry. Front. Psychol. 2020, 11, 2943. [Google Scholar] [CrossRef]
  49. Di Sebastiano, K.M.; Chulak-Bozzer, T.; Vanderloo, L.M.; Faulkner, G. Don’t walk so close to me: Physical distancing and adult physical activity in Canada. Front. Psychol. 2020, 11, 1895. [Google Scholar] [CrossRef] [PubMed]
  50. Jin, S.H.; Kim, K.Y. The Association between Changes in Physical Activity and Its Related Factors During the COVID-19 Pandemic-Based on the Data from 2020 Community Health Survey in Daegu. J. Health Inform. Stat. 2021, 46, 393–401. [Google Scholar] [CrossRef]
  51. Wilke, J.; Mohr, L.; Tenforde, A.S.; Edouard, P.; Fossati, C.; González-Gross, M.; Sánchez Ramírez, C.; Laiño, F.; Tan, B.; Pillay, J.D. A pandemic within the pandemic? Physical activity levels substantially decreased in countries affected by COVID-19. Int. J. Environ. Res. Public Health 2021, 18, 2235. [Google Scholar] [CrossRef] [PubMed]
  52. Hargreaves, E.A.; Lee, C.; Jenkins, M.; Calverley, J.R.; Hodge, K.; Houge Mackenzie, S. Changes in physical activity pre-, during and post-lockdown COVID-19 restrictions in New Zealand and the explanatory role of daily hassles. Front. Psychol. 2021, 12, 642954. [Google Scholar] [CrossRef] [PubMed]
  53. Tornaghi, M.; Lovecchio, N.; Vandoni, M.; Chirico, A.; Codella, R. Physical activity levels across COVID-19 outbreak in youngsters of Northwestern Lombardy. J. Sport. Med. Phys. Fit. 2020, 61, 971–976. [Google Scholar] [CrossRef]
  54. Marmot, M.; Allen, J.; Goldblatt, P.; Herd, E.; Morrison, J. Build Back Fairer: The COVID-19 Marmot Review; The Health Foundation: London, UK, 2020. [Google Scholar]
  55. Snowden, F.M. Epidemics and Society: From the Black Death to the Present; Yale University Press: New Haven, UK, 2019; pp. 9–12. [Google Scholar]
  56. Kim, Y. [Corona Response, Going to the Field] How the UK Is Coping with Disaster Inequality. Sisain. Available online: https://www.sisain.co.kr/news/articleView.html?idxno=48728 (accessed on 28 October 2022).
  57. Park, G. Utilization of Big Data in the Field of Cultural Tourism. Available online: https://sti.kostat.go.kr/window/2021a/main/2021_sum_05.html (accessed on 18 November 2022).
Figure 1. The cities in Metropolitan Area (black circles) and the study sites (blue circles).
Ijerph 19 16403 g001
Figure 2. The Korea R t in 2020 by week.
Ijerph 19 16403 g002
Table 1. Comparison of representation values for each characteristic.
YearMeanStd25%50%75%Max
The number of hikers20196951325595394
2020108781225147436
Actual movement distance2019897839116436852610,99132,836
2020915638936606867211,15132,806
Average speed2019312336
2020312336
Total exercise time2019254104177249326793
2020251104174245321798
Table 2. Estimated regression coefficients with their 95% confidence intervals and p-values of the linear mixed model.
Square Root of
Hiking Frequency Difference
Actual Movement
Distance Difference
Average Speed
Difference
Total Exercise
Time Difference
Fixed EffectParameter
Est
(95% CI)
Pr
(>|z|)
Parameter
Est
(95% CI)
Pr
(>|z|)
Parameter
Est
(95% CI)
Pr
(>|z|)
Parameter
Est
(95% CI)
Pr
(>|z|)
Intercept14.09
(13.07, 15.12)
<0.001 ***779
(−141, 1698)
0.100.03
(−0.03, 0.09)
0.3225.92
(−6.07, 57.90)
0.11
R t −0.20
(−0.29, −0.10)
<0.001 ***------
week0.01
(0.00, 0.03)
0.10−17
(−23, −10)
<0.001 ***0<0.001 ***−0.25
(−0.51, 0.00)
0.05
weekdays−2.00
(−2.31, −1.70)
<0.001 ***−235
(−419, −52)
0.01 *0.03
(0.02, 0.04)
<0.001 ***−18.59
(−24.41, −12.78)
<0.001 ***
PM 10 −0.02
(−0.02, −0.01)
<0.001 ***----−0.13
(−0.25, −0.01)
0.39
Random effect95% CIStd.dev95% CIStd.dev95% CIStd.dev95% CIStd.dev
Name0.81, 1.91.21098, 246716460.068, 0.150.135, 7852
*** p < 0.001, * p < 0.05.
Publisher’s Note: MDPI stays neutral with regard to jurisdictional claims in published maps and institutional affiliations.

