
Trends and Determinants of Operative Vaginal Delivery at Two Academic Hospitals in Johannesburg, South Africa 2005–2019


Abstract
1. Introduction
2. Methodology
2.1. Ethical Considerations
2.2. Statistical Analysis
3. Results
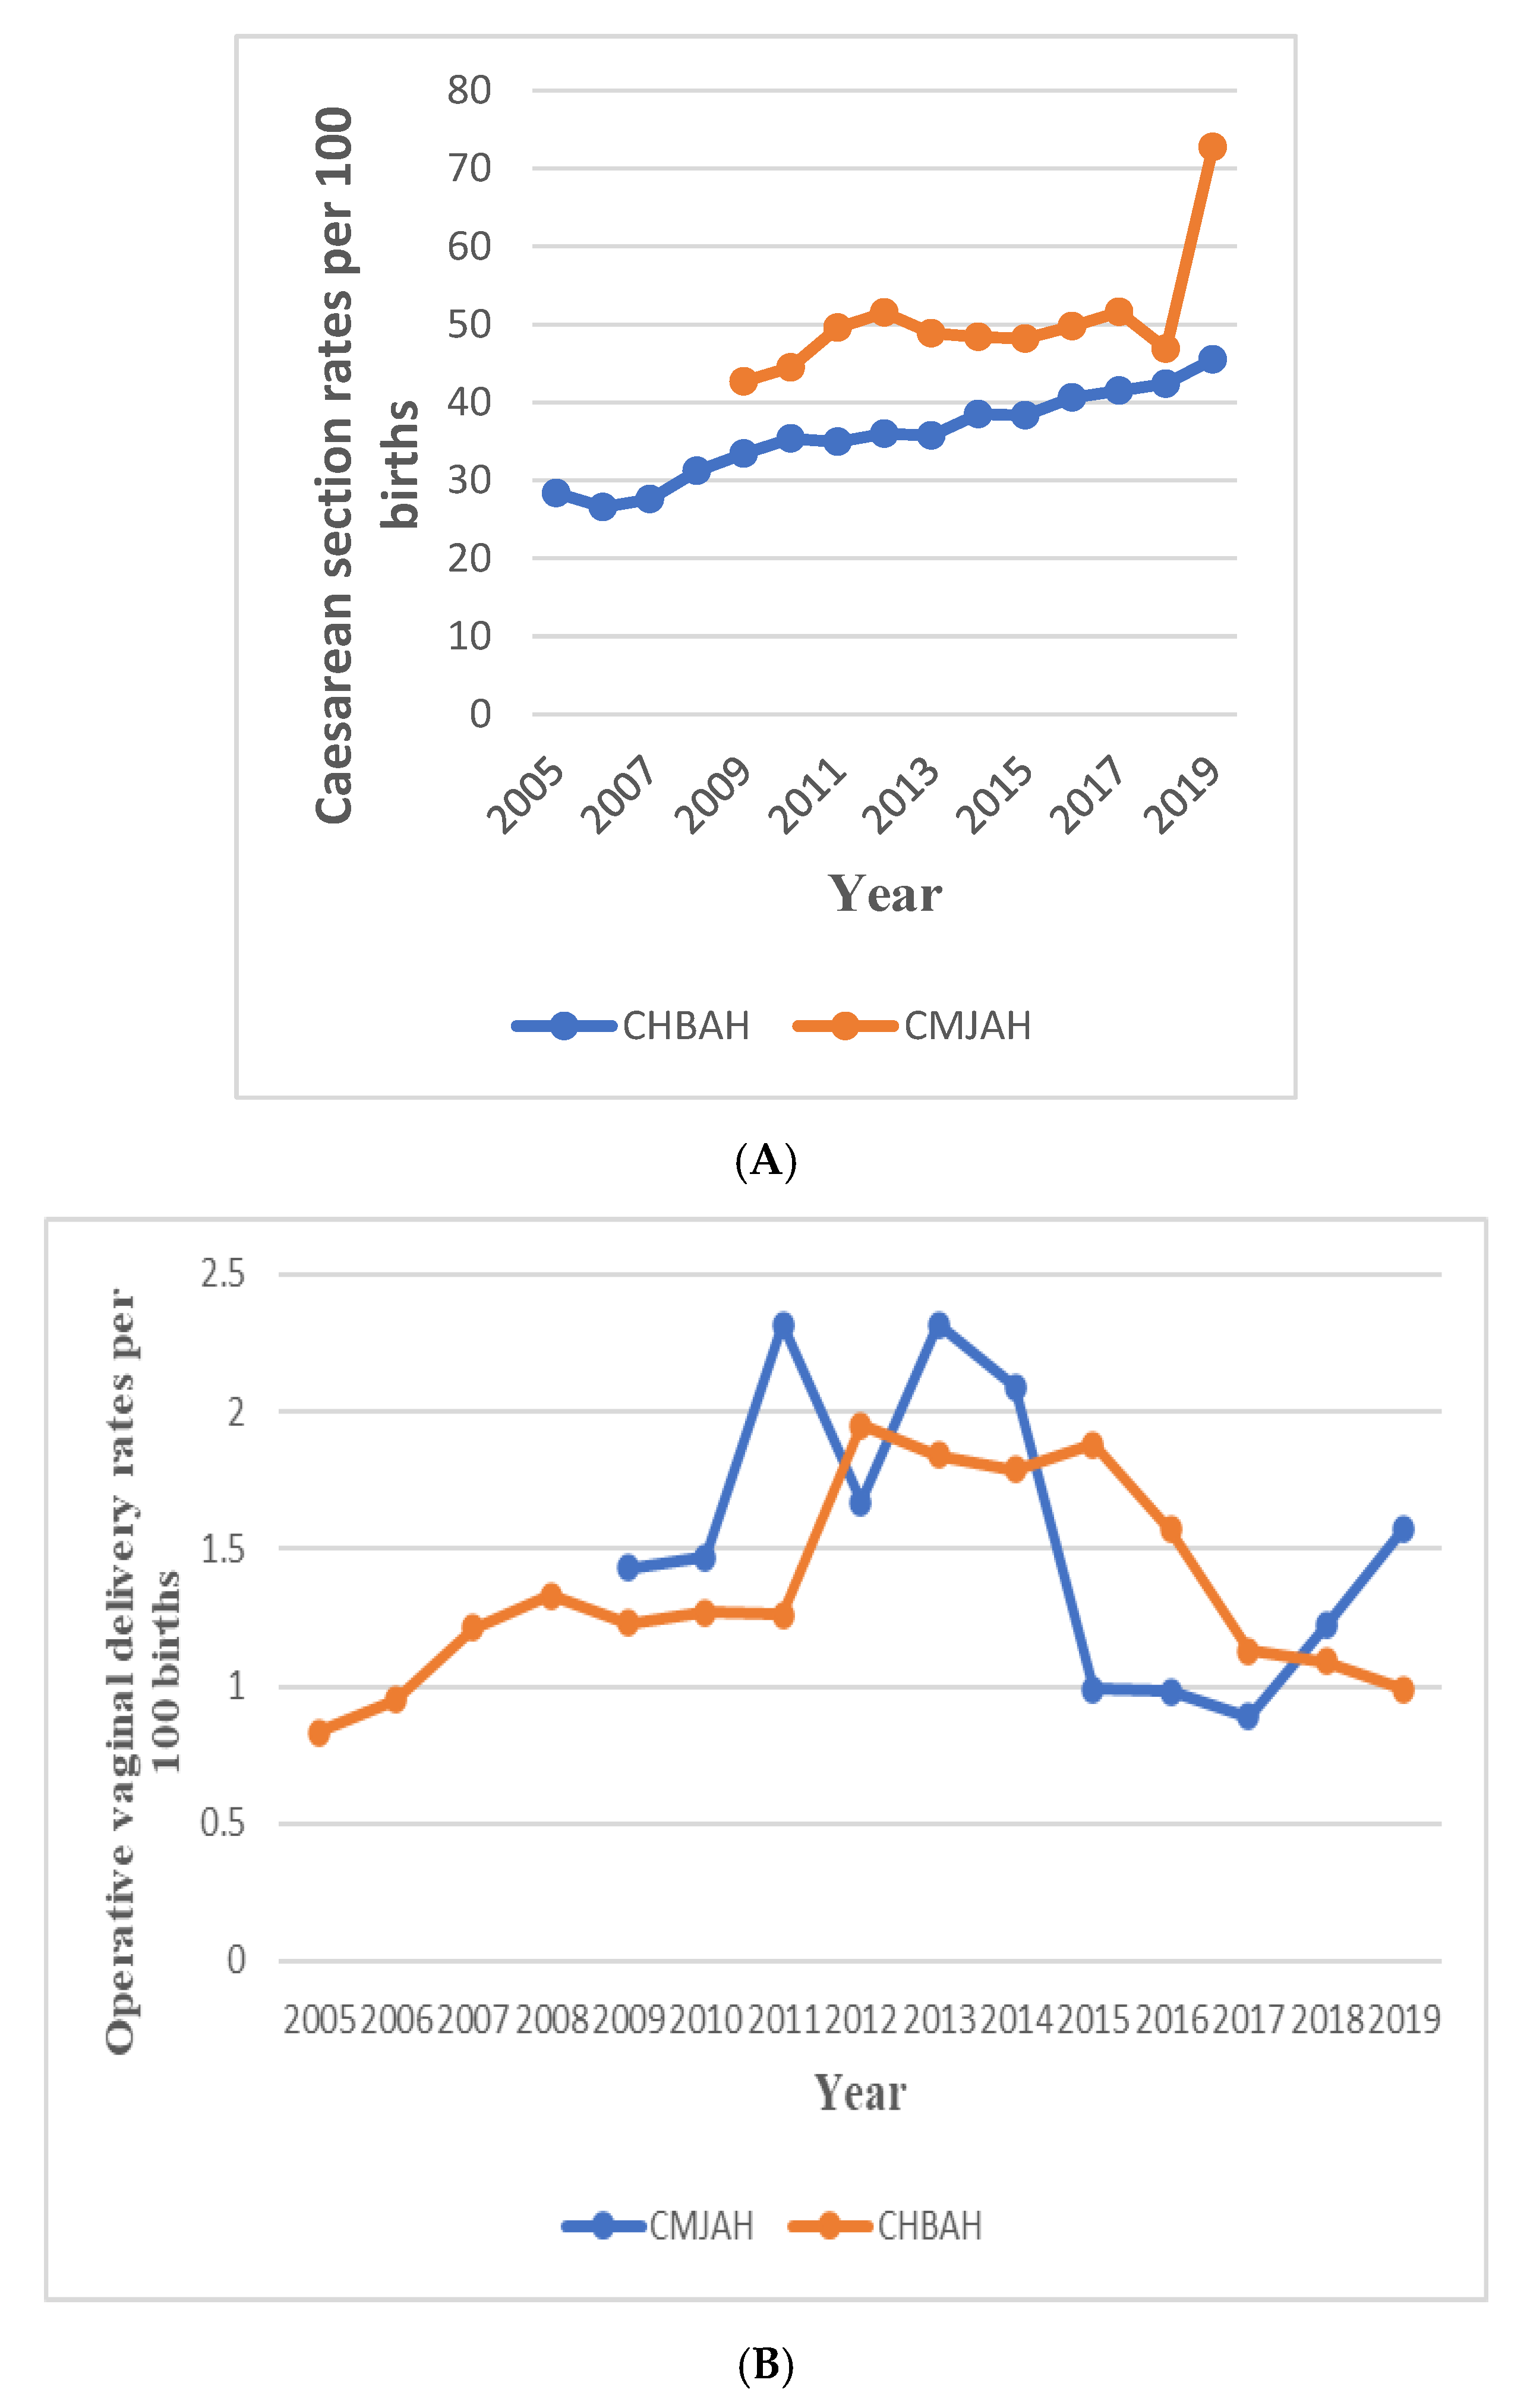
3.1. Trends in Total Births, Caesarean Section and Operative Vaginal Deliveries in CHBAH and CMJAH
3.2. Caesarean Section Trends
3.3. Operative Vaginal Delivery Trends
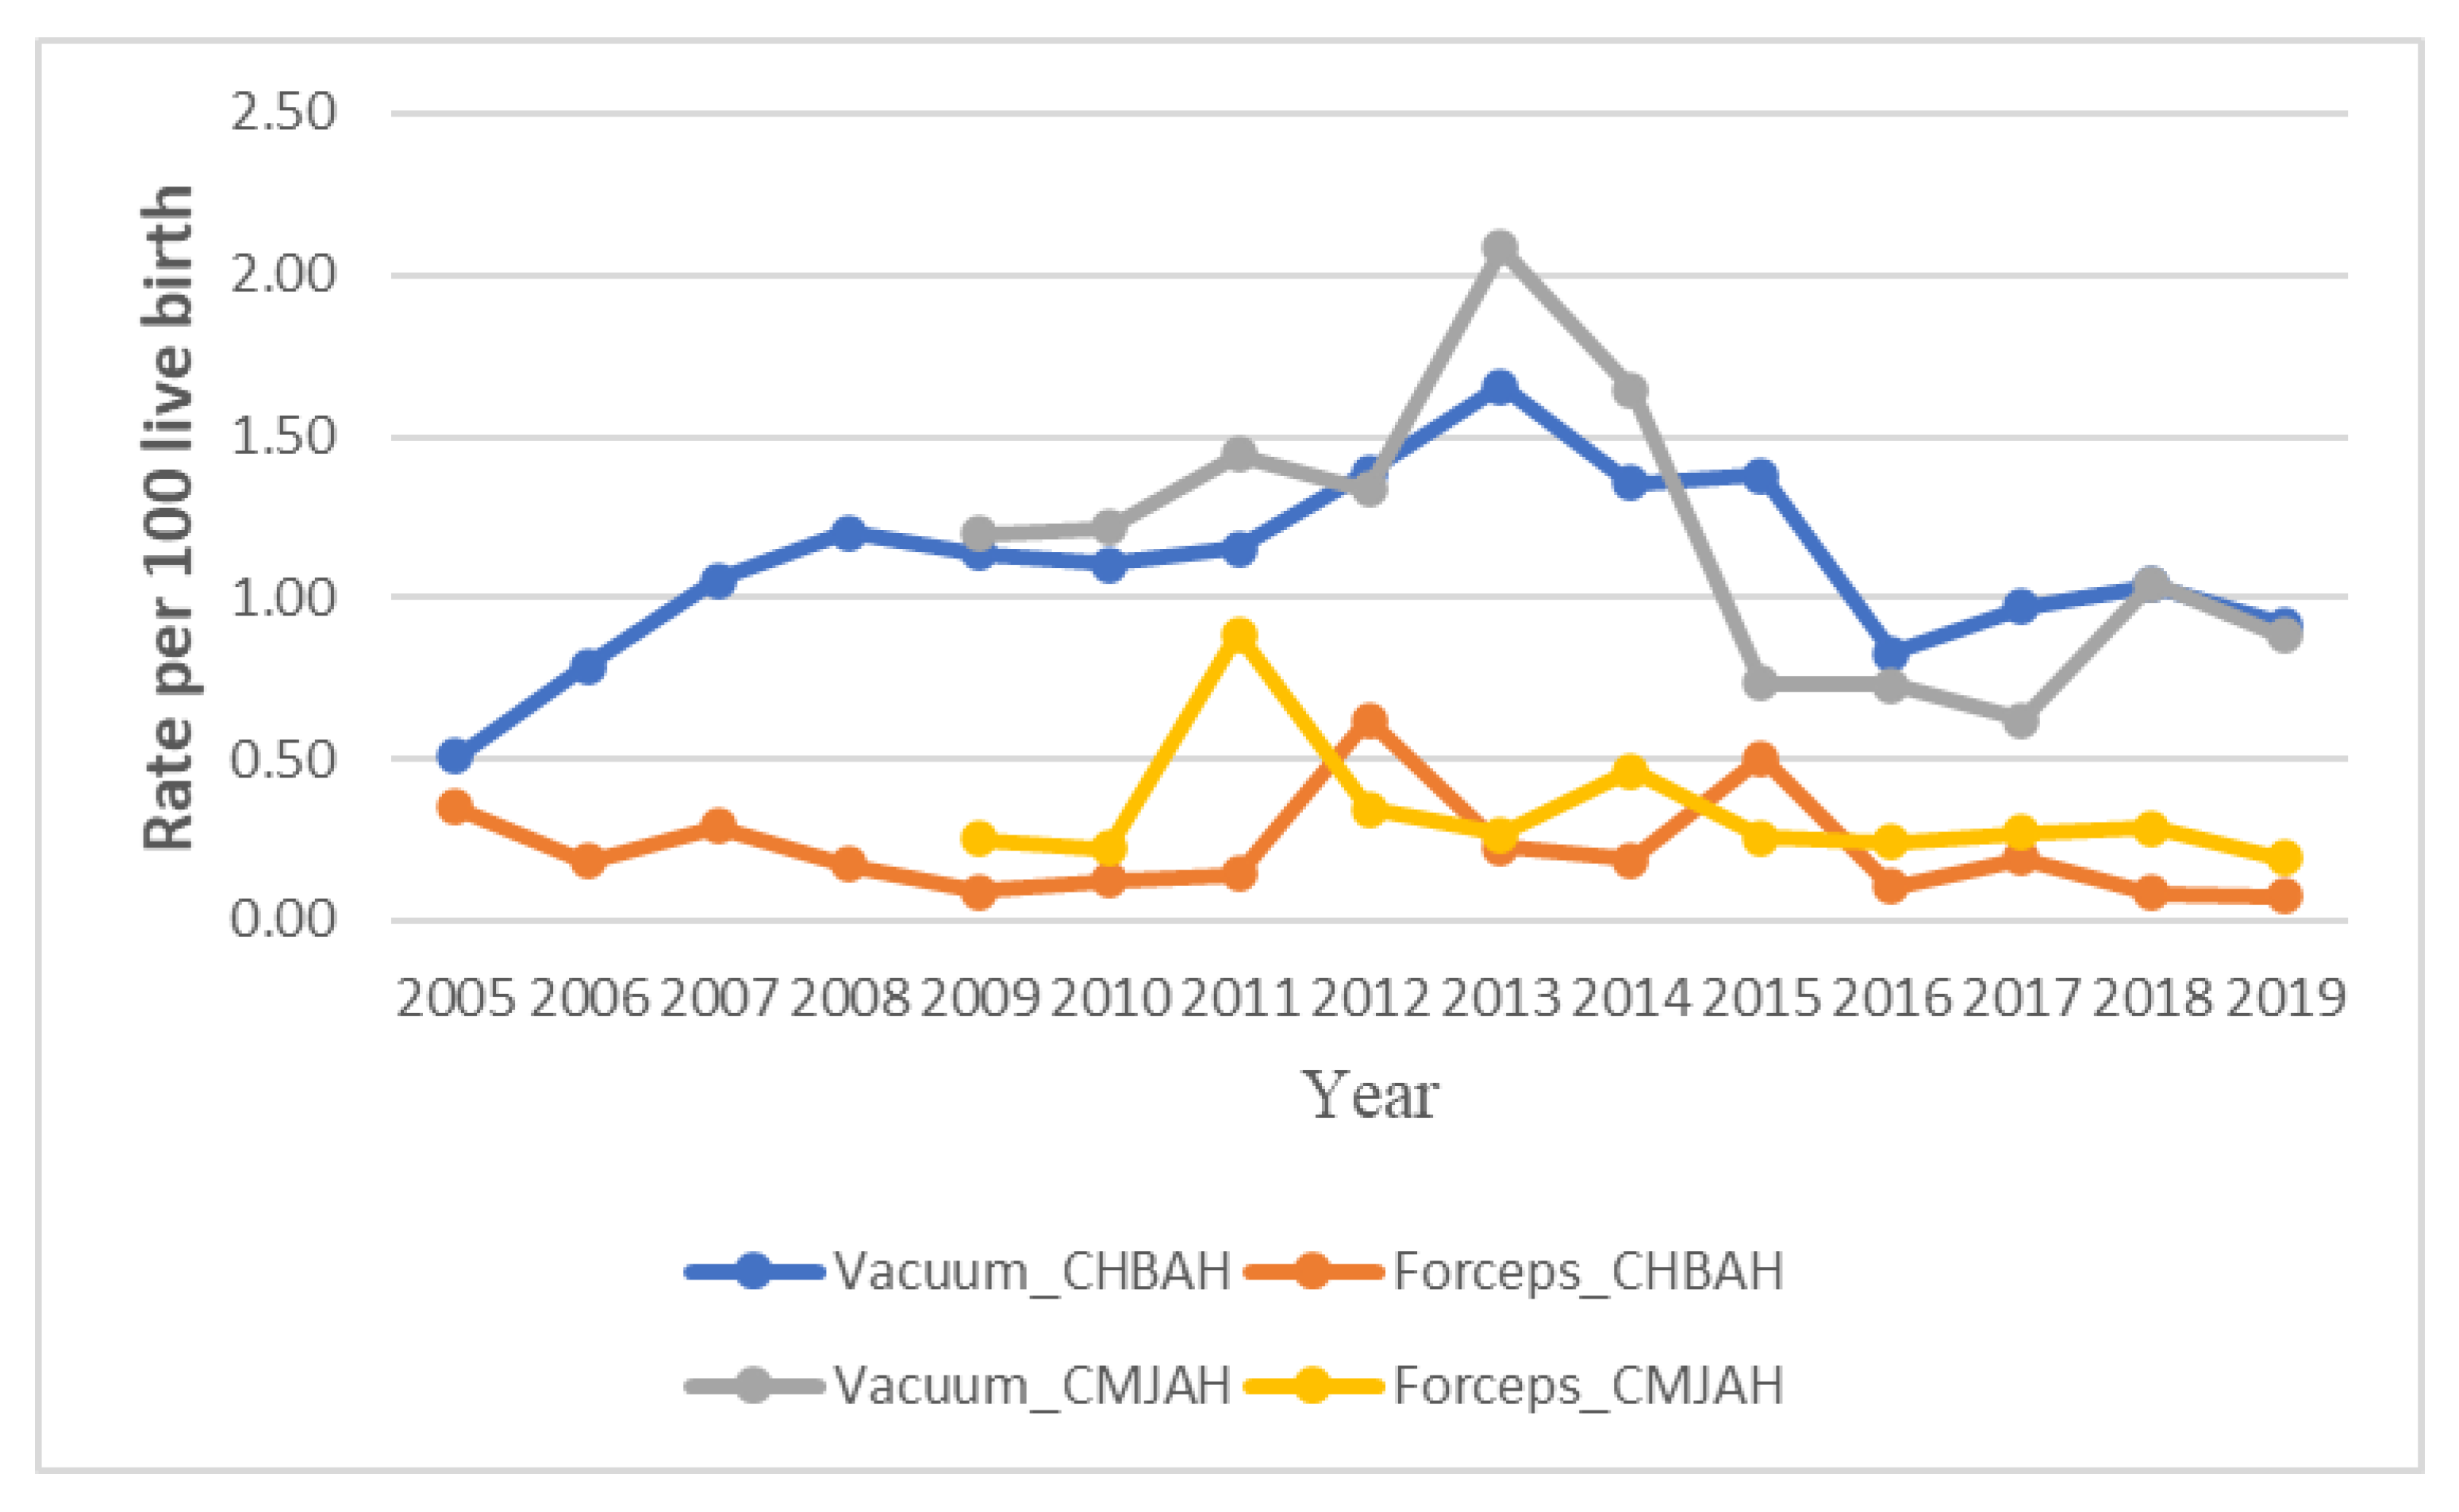
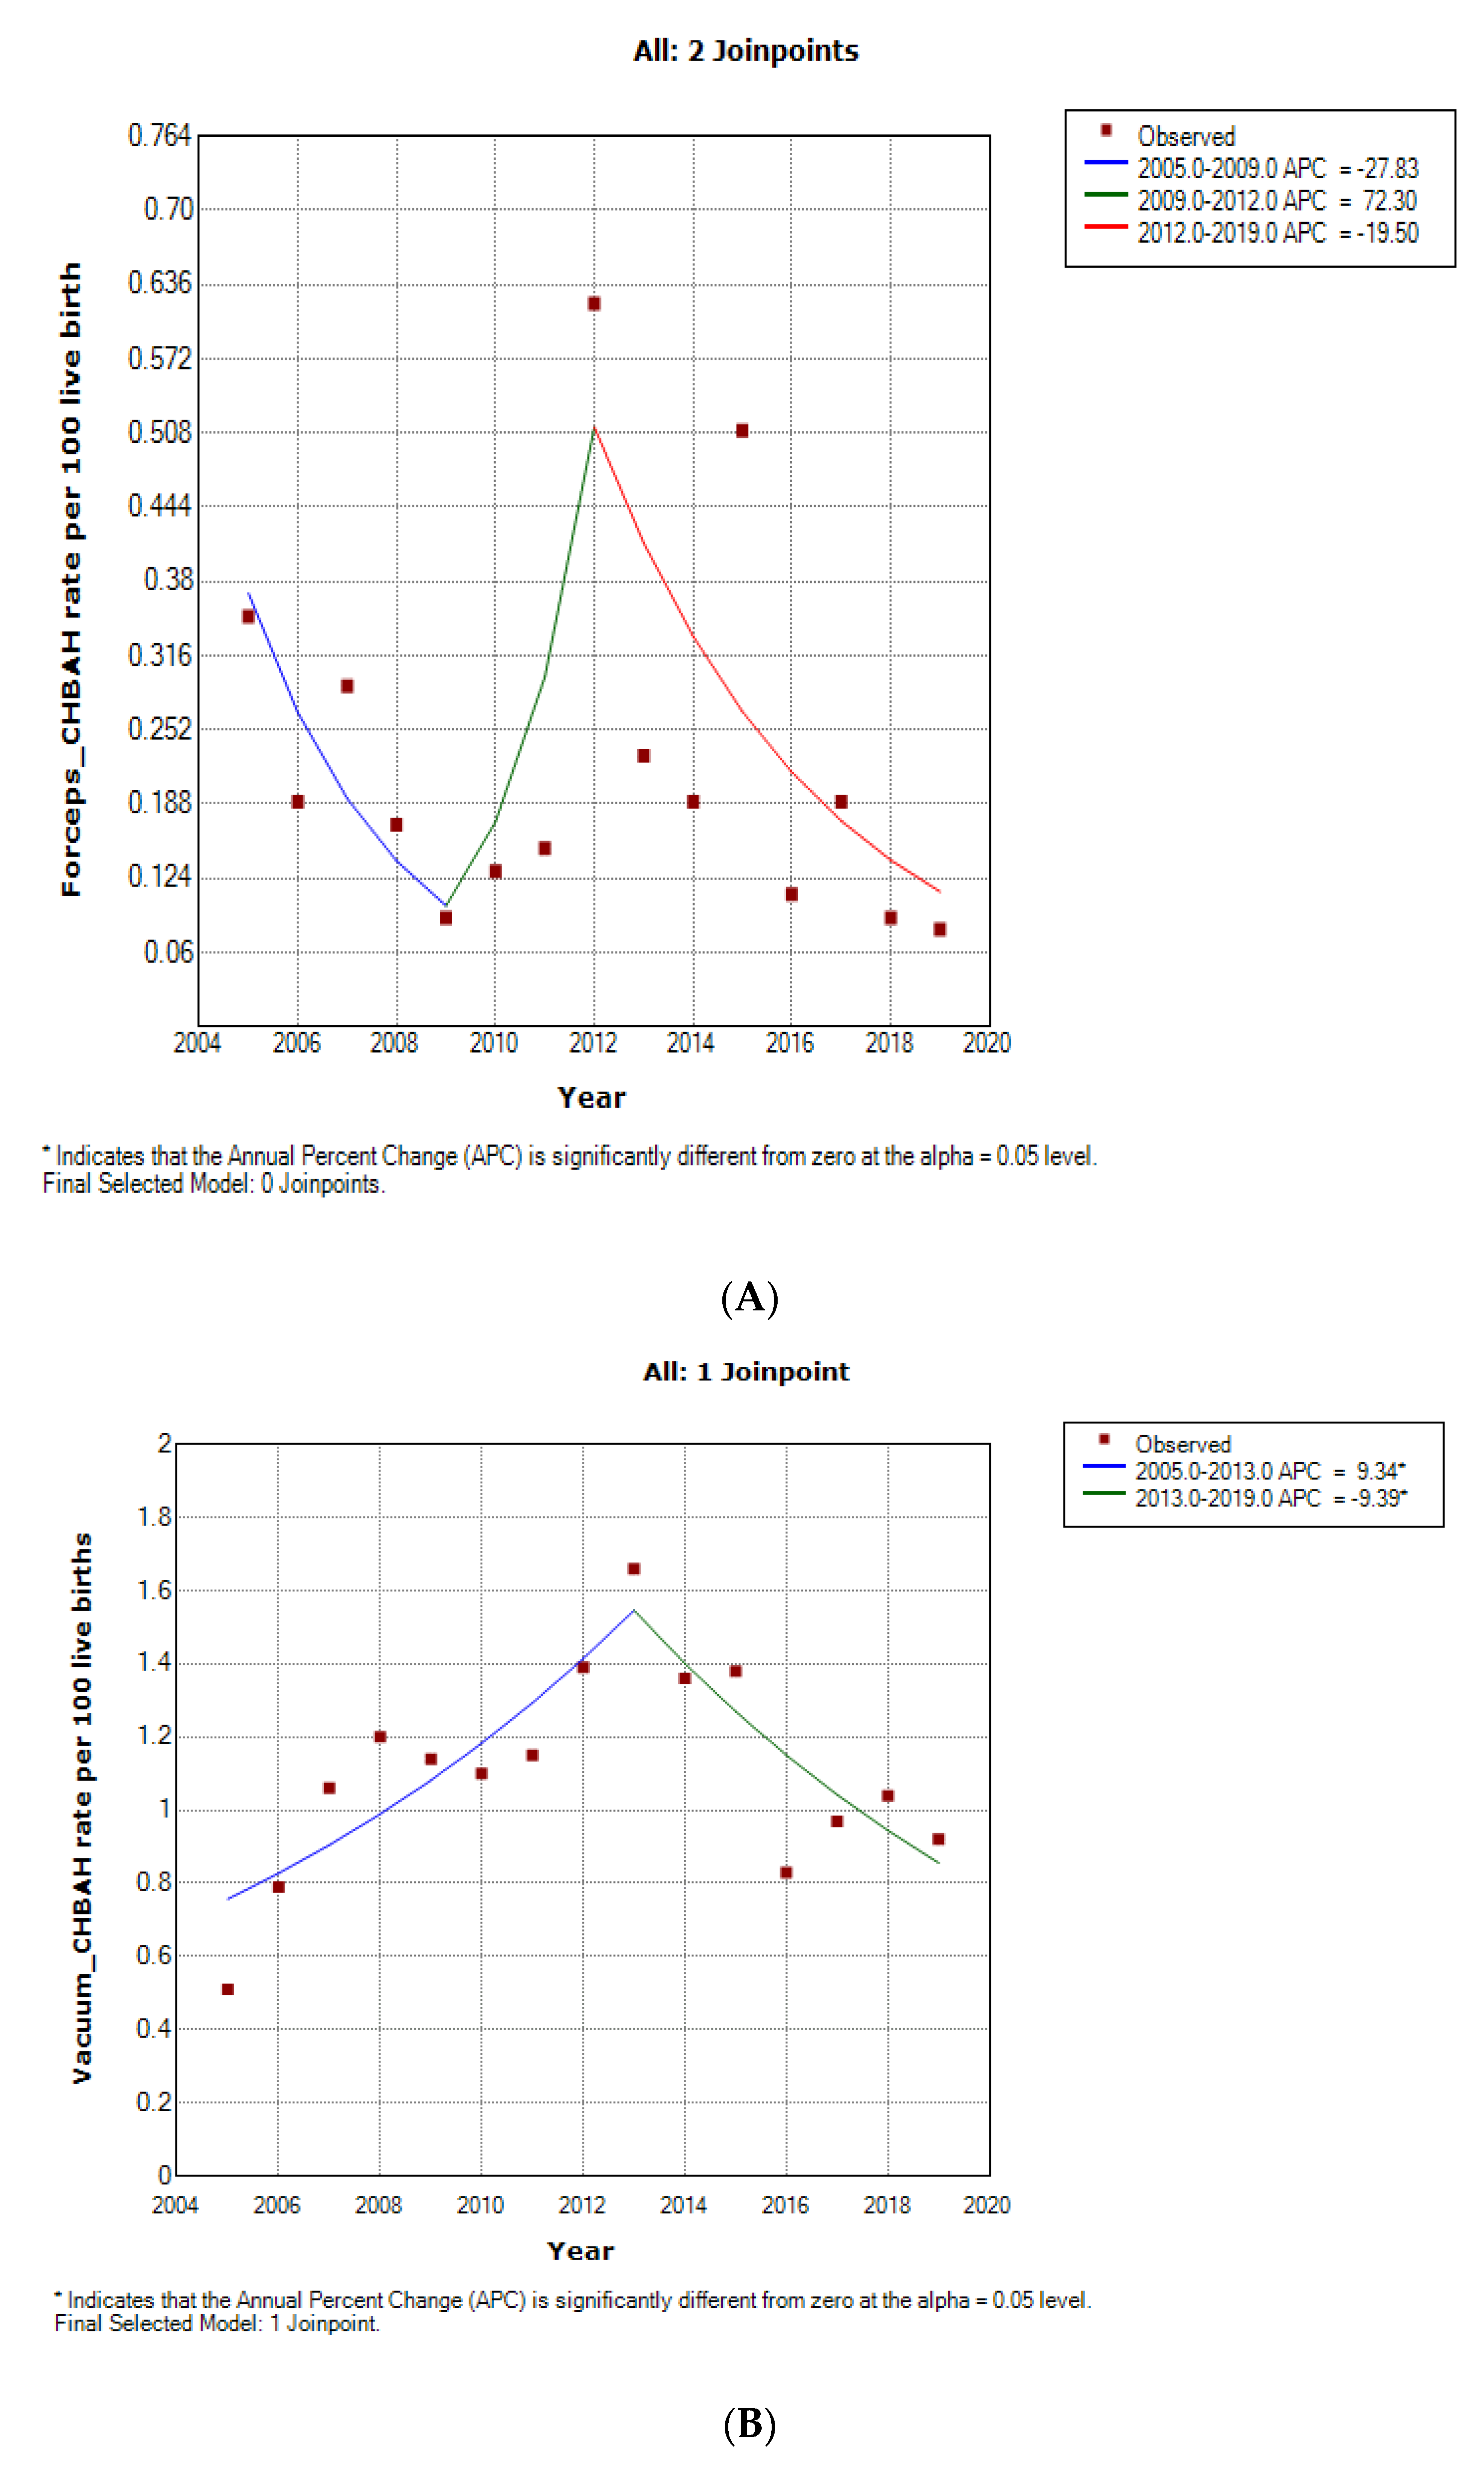
3.4. Forceps Delivery Trends
3.5. Vacuum Delivery Rate
3.6. Relationship between Socio Demographic and Clinical Characteristics and Operative Vaginal Delivery
3.7. Association between Sociodemographic and Clinical Characteristics and Operative Vaginal Deliveries
3.8. Determinants of Operative Vaginal Delivery
3.9. Comparison between Forceps and Vacuum Delivery
Types of Operative Vaginal Delivery
4. Discussion
5. Conclusions
Supplementary Materials
Author Contributions
Funding
Institutional Review Board Statement
Informed Consent Statement
Data Availability Statement
Conflicts of Interest
References
- Hotton, E.; Brien, S.O.; Draycott, T.J. Best Practice & Research Clinical Obstetrics and Gynaecology. Ski. Train. Oper. Vaginal Birth 2019, 56, 11–22. [Google Scholar] [CrossRef]
- Operative Vaginal Birth: ACOG Practice Bulletin Number 219. Obstet. Gynecol. 2020, 135, e149–e159. [CrossRef]
- Pattinson, R.C.; Vannevel, V.; Barnard, D.; Baloyi, S.; Gebhardt, G.S.; Le Roux, K.; Moran, N.; Moodley, J. Failure to perform assisted deliveries is resulting in an increased neonatal and maternal morbidity and mortality: An expert opinion. SAMJ 2018, 108, 75–78. [Google Scholar] [CrossRef] [PubMed]
- Sentilhes, L.; Madar, H.; Ducarme, G.; Hamel, J.; Mattuizzi, A.; Hanf, M. Outcomes of operative vaginal delivery managed by residents under supervision and attending obstetricians: A prospective cross-sectional study. Am. J. Obstet. Gynecol. 2019, 221, 59.e1–59.e15. [Google Scholar] [CrossRef] [PubMed]
- Biru, S.; Addisu, D.; Kassa, S.; Animen, S. Maternal complication related to instrumental delivery at Felege Hiwot Specialized Hospital, Northwest Ethiopia: A retrospective cross—Sectional study. BMC Res. Notes 2019, 12, 482. [Google Scholar] [CrossRef] [PubMed]
- Bailey, P.E.; Roosmalen, J.V.; Mola, G.; Evans, C.; Bernis, L.D.; Dao, B. Assisted vaginal delivery in low and middle income countries: An overview. BJOG 2017, 124, 1335–1344. [Google Scholar] [CrossRef]
- Vannevel, V.; Swanepoel, C.; Pattinson, R.C. Best Practice & Research Clinical Obstetrics and Gynaecology Global perspectives on operative vaginal deliveries. Best Pract. Res. Clin. Obstet. Gynaecol. 2019, 56, 107–113. [Google Scholar] [CrossRef]
- Devjee, J. A survey of health professionals on the current use of forceps/ventouse and skills training for operative vaginal delivery. Obtstetrics Gynaecol. Forum 2015, 25, 37–39. [Google Scholar]
- Ochejele, S.; Musa, J.; Po, E.; Di, A.; Ameh, T.; Daru, P.H.; Ujah, I.A.O. Trends and operators of instrumental vaginal deliveries in Jos, Nigeria: A 7-year study (1997–2003). Trop. J. Obstet. Gynaecol. 2018, 35, 79–83. [Google Scholar]
- Merriam, A.A.; Ananth, C.V.; Wright, J.D.; Siddiq, Z.; Alton, M.E.D.; Friedman, A.M. Trends in operative vaginal delivery, 2005–2013: A population-based study. BJOG 2017, 124, 1365–1372. [Google Scholar] [CrossRef]
- Katherine, R.; Macones, G.A. Operative vaginal delivery: Current trends in obstetrics. Womens Health 2008, 4, 281–290. [Google Scholar]
- Daru, P.H.; Egbodo, C.; Suleiman, M.; Shambe, I.H.; Magaji, A.F.; Ochejele, S. Original Article A decade of instrumental vaginal deliveries in Jos University Teaching Hospital, North Central Nigeria (2007–2016). Trop. J. Obstet. Gynaecol. 2018, 35, 113–117. [Google Scholar] [CrossRef]
- Patel, R.R.; Murphy, D.J. Forceps delivery in modern obstetric practice. BMJ 2004, 328, 1302–1305. [Google Scholar] [CrossRef] [PubMed]
- Murphy, D.J. Best Practice & Research Clinical Obstetrics and Gynaecology Medico-legal considerations and operative vaginal delivery. Best Pract. Res. Clin. Obstet. Gynaecol. 2019, 56, 114–124. [Google Scholar] [CrossRef] [PubMed]
- Bassey, E.A.; Abah, G.M. A 5-year retrospective review of instrumental vaginal deliveries. Trop. J. Obstet. Gynaecol. 2018, 128–132. [Google Scholar] [CrossRef]
- Moodley, J.; Devjee, J.; Khedun, S.M.; Esterhuizen, T. Second-stage primary Caesarean deliveries: Are maternal complications increased? S. Afr. Fam. Pract. 2009, 51, 328–331. [Google Scholar] [CrossRef]
- Ameh, C.A. The role of instrumental vaginal delivery in low resource settings. BJOG 2009, 116, 22–25. [Google Scholar] [CrossRef]
- Ali, U.A.; Norwitz, E.R. Vacuum-Assisted Vaginal Delivery. Rev. Obstet Gynecol. 2009, 2, 5–17. [Google Scholar]
- World Health Organisation. WHOStatement on Caesarean Section Rates; WHO: Geneva, Switzerland, 2015; (WHO/RHR/15.02). [Google Scholar]
- Mph, G.M.M.; Lisonkova, S.; Skoll, A.; Brant, R.; Cundiff, G.W.; Mhsc, Y.S.; Joseph, K.S. Vaginal delivery and obstetric and birth trauma. CMAJ 2018, 190, 734–741. [Google Scholar] [CrossRef]
- Guidozzi, D.F.; Branch, S.; Chauke, L. Maternal and fetal outcomes following delivery in a tertiary hospital in Johannesburg, South Africa. SAJOG 2018, 24, 74–78. [Google Scholar] [CrossRef][Green Version]
- Boatin, A.A.; Ngonzi, J.; Ganyaglo, G.; Mbaye, M.; Wylie, B.J.; Diouf, K. Seminars in Fetal and Neonatal Medicine Cesarean delivery in low- and middle-income countries: A review of quality of care metrics and targets for improvement. Semin. Fetal Neonatal Med. 2021, 26, 101199. [Google Scholar] [CrossRef] [PubMed]
- Hubena, Z.; Workneh, A.; Siraneh, Y. Prevalence and Outcome of Operative Vaginal Jimma University Medical Center, Southwest Ethiopia. J. Pregnancy 2018, 2018, 7423475. [Google Scholar] [CrossRef] [PubMed]
- Maphumulo, W.T.; Bhengu, B.R. Challenges of quality improvement in the healthcare of South Africa post-apartheid: A critical review. Curationis 2019, 42, 1901. [Google Scholar] [CrossRef]
- Fassin, D.; Schneider, H. The politics of AIDS in South Africa: Beyond the controversies. Br. Med. J. 2003, 326, 495–497. [Google Scholar] [CrossRef]
- Van Schalkwyk, C.; Dorrington, R.E.; Seatlhodi, T.; Velasquez, C.; Feizzadeh, A.; Johnson, L.F. Modelling of HIV prevention and treatment progress in five South African metropolitan districts. Sci. Rep. 2021, 11, 5652. [Google Scholar] [CrossRef] [PubMed]
- Mabaso, M.; Makola, L.; Naidoo, I.; Mlangeni, L.L.; Jooste, S.; Simbayi, L. HIV prevalence in South Africa through gender and racial lenses: Results from the 2012 population-based national household survey. Int. J. Equity Health 2019, 18, 167. [Google Scholar] [CrossRef]
- Parish, B.; Vasilie, Y.N. 381-Assisted Vaginal Birth. J. Obstet. Gynaecol. Can. 2020, 2019, 870–882. [Google Scholar] [CrossRef]
- Hillier, C.E.M.; Johanson, R.B. Worldwide survey of assisted vaginal delivery. Int. J. Gynecol. Obstet. 1994, 47, 109–114. [Google Scholar] [CrossRef]
- Betran, A.P.; Ye, J.; Moller, B.; Souza, J.P.; Zhang, J. Trends and projections of caesarean section rates: Global and regional estimates. BMJ Global Health 2021, 6, e005671. [Google Scholar] [CrossRef]
- Tshering, S.; Dorji, N.; Wangden, T. Trend in Instrumental Vaginal Deliveries at the National Referral Hospital in Bhutan: A Review of Hospital Records. J. SAFOG 2021, 13, 431–435. [Google Scholar] [CrossRef]
- Masaru, N.; Mariana, E.; Beth, H.; Krista, M.; Julia, C.; Christian Michael, P. Improvement of Operative Vaginal Delivery Training in Residency: A Single Institution Experience. Obstet. Gynecol. 2020, 135, 75s. [Google Scholar] [CrossRef]
- Short Report. Saving Mothers 2011–2013: Sixth Report on the Confidential Enquiries into Maternal Deaths in South Africa, Department of Health: Pretoria, South Africa, 2013.
- Wessels, J.; Sherman, G.; Bamford, L.; Makua, M.; Ntloana, M.; Nuttal, J.; Pillay, Y.; Goga, A.; Feucht, U. The updated South African National Guideline for the Prevention of Mother to Child Transmission of Communicable Infections (2019). South Afr. J. HIV Med. 2020, 21, a1079. [Google Scholar] [CrossRef]
- Murphy, D.J.; Strachan, B.K.; Bahl, R.; on behalf of the Royal College of Obstetricians Gynaecologists. Assisted Vaginal Birth. BJOG 2020, 127, 70–112. [Google Scholar] [CrossRef] [PubMed]
- Betran, A.P.; Torloni, M.R.; Zhang, J.; Ye, J.; Mikolajczyk, R.; Deneux-Tharaux, C.; Oladapo, O.T.; Souza, J.P.; Tunçalp, Ö.; Vogel, J.P.; et al. What is the optimal rate of caesarean section at population level? A systematic review of ecologic studies. Reprod. Health 2015, 12, 57. [Google Scholar] [CrossRef] [PubMed]
- Al Rifai, R.H. Trend of caesarean deliveries in Egypt and its associated factors: Evidence from national surveys, 2005–2014. BMC Pregnancy Childbirth 2017, 17, 417. [Google Scholar] [CrossRef]
- Naidoo, N.; Moodley, J. Rising rates of Caesarean sections: An audit of Caesarean sections in a specialist private practice. South Afr. J. Fam. Pract. 2009, 51, 254–258. [Google Scholar] [CrossRef][Green Version]
- Unuigbe, J.A.; Ojeme, G.E.A.; Erhatiemwomon, R.A.; Maduako, K.T. Instrumental vaginal deliveries: A review. Trop. J. Obstet. Gynaecol. 2018, 35, 99–107. [Google Scholar] [CrossRef]
- Loudon, J.A.Z.; Groom, K.M.; Hinkson, L.; Harrington, D.; Groom, K.M.; Hinkson, L.; Harrington, D. Changing trends in operative delivery performed at full dilatation over a 10-year period. J. Obstet. Gynaecol. 2010, 30, 3615. [Google Scholar] [CrossRef]
- Mahony, O.F.; Gj, H.; Menon, V. Choice of instruments for assisted vaginal delivery (Review). Cochrane Database Syst. Rev. 2010, 10, CD005455. [Google Scholar] [CrossRef]
- Tan, P.S.; Kah, J.; Tan, H.; Tan, E.L.; Tan, L.K. Comparison of Caesarean sections and instrumental deliveries at full cervical dilatation: A retrospective review. Singap. Med. J. 2019, 60, 75–79. [Google Scholar] [CrossRef]
- Wu, H.; Yue, J. Effects of maternal obesity on the success of assisted vaginal delivery in Chinese women. BMC Pregnancy Childbirth 2018, 18, 509. [Google Scholar] [CrossRef] [PubMed]
- Yang, Q.; Wen, W.; Chen, Y. Occurrence and clinical predictors of operative delivery for the vertex second twin after normal vaginal delivery of the first twin. Am. J. Obstet. Gynecol. 2005, 842, 178–184. [Google Scholar] [CrossRef]
- Jeon, J.; Na, S. Vacuum extraction vaginal delivery: Current trend and safety. Obstet Gynecol. Sci. 2017, 60, 499–505. [Google Scholar] [CrossRef] [PubMed]
- Bjorklund, J.; Wiberg-Itzel, E.; Wallstrom, T. Is there an increased risk of cesarean section in obese women after induction of labor? A retrospective cohort study. PLoS ONE 2022, 17, e0263685. [Google Scholar] [CrossRef] [PubMed]
- Antonakou, A.; Papoutsis, D.; Tzavara, C. Maternal obesity and its association with the mode ofdelivery and the neonatal outcome in induced labour: Implications for midwifery practice. Eur. J. Midwifery 2018, 2, 4. [Google Scholar] [CrossRef] [PubMed]
- Ellekjaer, K.L.; Bergholt, T.; Løkkegaard, E. Maternal obesity and its effect on labour duration in nulliparous women: A retrospective observational cohort study. BMC Pregnancy Childbirth 2017, 17, 222. [Google Scholar] [CrossRef]
- Zipori, Y.; Grunwald, O.; Ginsberg, Y.; Beloosesky, R.; Weiner, Z. The impact of extending the second stage of labor to prevent primary cesarean delivery on maternal and neonatal outcomes. Am. J. Obstet. Gynecol. 2019, 220, 191.e1–191.e7. [Google Scholar] [CrossRef]


| Hospital and Type of Delivery | Year | APC (%) 95%CI | AAPC 95%CI | p-Value | Comment |
|---|---|---|---|---|---|
| Caesarean section | |||||
| CHBAH | |||||
| Overall | 2005–2019 | - | 3.5 (3–4) | <0.001 | Statistically significant increase |
| CMJAH | |||||
| Trends 1 | 2009–2011 | 9.1 (−4.5 to 24.6) | 0.1 | Non-Statistically significant increase | |
| Trends 2 | 2011–2017 | −0.7 (−3.4 to 2.1) | 0.5 | Non-Statistically significant decrease | |
| Trends 3 | 2017–2019 | 19.3 * (6.2 to 34.1) | <0.001 | Statistically significant increase | |
| Overall | 2009–2019 | 4.1 (−10.7 to 2.9) | 0.2 | Non-Statistically significant increase | |
| Operative Vaginal delivery | |||||
| CHBAH | |||||
| Trends 1 | 2005–2014 | 9.1 * (5.4–13.0) | <0.001 | Statistical significant increase | |
| Trends 2 | 2014–2019 | −13.6 * | <0.001 | ||
| Overall | 2005–2019 | - | −0.4 (−2.6 to 3.7) | 0.8 | Non-statistically significant decrease |
| CMJAH | |||||
| Trends 1 | 2009–2013 | 13.6 (54.0 to 1.3) | 0.3 | Non-statistically significant increase | |
| Trends 2 | 2013–2016 | −28.8 (−74.8 to 101.3) | 0.4 | Non-statistically significant decrease | |
| Trends 3 | 2016–2019 | 19.8 (−31.4 to 109.1) | 0.4 | Non-statistical significant icrease | |
| Vacuum delivery | |||||
| CHBAH | |||||
| Trends 1 | 2005–2013 | 9.3 (2.9 to 16.2) | <0.001 | Statistically significant increase | |
| Trends 2 | 2005–2019 | −9.4 (−5.6 to −1.3) | <0.001 | Statistically significant decrease | |
| Overall | 2005–2019 | 0.9 (−3.5 to 5.5) | 0.7 | Non-statistically significant increase | |
| CMJAH | |||||
| Trends 1 | 2009–2013 | 10.4 (−17.2 to 2.9) | 0.4 | Non-statistically sigificant increase | |
| Trends 2 | 2013–2019 | −13.8(−26.8 to 1.5) | 0.1 | Non-statistically significant decrease | |
| Overall | 2009–2019 | −4.8 (−15.7 to 7.4) | 0.4 | Non-statistically Significant decrease | |
| Forceps Delivery | |||||
| CHBAH | |||||
| Trends 1 | 2005–2009 | −27.8 (−58.3 to 47.1) | 0.2 | Non-statistically significant decrease | |
| Trends 2 | 2009–2012 | 72.3 (−83.1 to 16.5) | 0.6 | Non-statistically significant increase | |
| Trends 3 | 2012–2019 | −19.5 (−40.9 to 9.6) | 0.1 | Nons-statistically significant decrease | |
| 2005–2019 | −8.2 (−41.5 to 44.1) | 0.7 | Non-statistically significant decrease | ||
| CMJAH | |||||
| Trends 1 | 2009–2011 | 77.7 (−30.0 to 35.13) | 0.2 | Non-statistically significant increase | |
| Trends 2 | 2011–2019 | −14.4 (−22.0 to −6.0) | <0.001 | Statistically significant decrease | |
| Overall | 2009–2019 | −0.9 (−15.7 to 16.4) | 0.9 | Non-statistically significant decrease | |
| Characteristics | Vaginal Delivery n = 179, (%) | OVD n = 179, (%) | Total n = 358, (%) | p-Value |
|---|---|---|---|---|
| Hospital | ||||
| CHBAH | 92 (51.39) | 92 (51.39) | 184 (51.39) | 1.000 |
| CMJAH | 87 (48.60) | 87 (48.60) | 174 (48.60) | |
| Age (Years) Mean, SD | 28.68 ± 6.78 | 24.92 ± 5.74 | 26.80 ± 6.55 | <0.0001 |
| <20 | 15 (8.38) | 26 (14.53) | 41 (11.45) | <0.0001 |
| 20–24 | 35 (19.55) | 79 (44.13) | 114 (31.84) | |
| 25–29 | 51 (28.49) | 35 (19.55) | 86 (24.02) | |
| 30–34 | 38 (21.23) | 25 (13.97) | 63 (17.60) | |
| ≥35 | 40 (22.35) | 14 (7.82) | 54 (15.08) | |
| Age (Years) | ||||
| <35 | 139 (77.65) | 165 (92.18) | 304 (84.92) | <0.0001 |
| ≥35 | 40 (22.35) | 14 (7.82) | 54 (15.08) | |
| Ethnic group | ||||
| Black | 171 (95.50) | 167 (93.29) | 338 (94.41) | 0.803 |
| Coloured | 4 (2.23) | 5 (2.79) | 9 (2.51) | |
| Indian | 3 (1.67) | 5 (2.79) | 8 (2.23) | |
| White | 1 (0.55) | 2 (1.11) | 3 (0.84) | |
| Ethnic group | ||||
| Blacks | 171 (95.53) | 167 (93.29) | 338 (94.41) | 0.357 |
| Others | 8 (4.47) | 12 (6.70) | 20 (11.17) | |
| Employment status | ||||
| Employed | 42 (23.46) | 27 (15.08) | 69 (38.55) | 0.046 |
| Unemployed | 118 (65.92) | 121 (67.59) | 239 (66.76) | |
| Student | 19 (10.61) | 31 (17.32) | 50 (13.97) | |
| Marital status | ||||
| Married | 17 (9.49) | 17 (9.49) | 34 (9.49) | 1.000 |
| Single | 162 (90.50) | 162 (90.50) | 324 (90.50 | |
| Gestational age | 39 (38–40) | 39 (38–40) | 39 (38–40) | 0.8689 |
| 27 | 0 (0.00) | 2 (1.12) | 2 (0.56) | 0.756 |
| 34 | 1 (0.56) | 0 (0.00) | 1 (0.28) | |
| 35 | 2 (1.12) | 2 (1.12) | 4 (1.12) | |
| 36 | 5 (2.79) | 3 (1.68) | 8 (2.23) | |
| 37 | 13 (7.26) | 15 (8.38) | 28 (7.82) | |
| 38 | 39 (21.79) | 35 (19.55) | 74 (20.67) | |
| 39 | 48 (26.82) | 49 (27.37) | 97 (27.09) | |
| 40 | 39 (21.79) | 44 (24.58) | 83 (23.18) | |
| 41 | 28 (15.64) | 21 (11.73) | 49 (13.69) | |
| 42 | 4 (2.23) | 8 (4.47) | 12 (3.35) | |
| Gestational age (weeks) | ||||
| <37 | 8 (4.47) | 7 (3.91) | 15 (4.19) | 0.792 |
| ≥37 | 171 (95.53) | 172 (96.09) | 343 (95.81) | |
| Parity (median, IQR) | 1 (0–2) | 0 (0–1) | 1 (0–2) | <0.001 |
| 0 | 51 (28.49) | 108 (60.33) | 159 (44.41) | <0.001 |
| 1 | 48 (26.81) | 57 (31.84) | 105 (29.33) | |
| 2 | 41 (22.90) | 6 (3.35) | 47 (13.13) | |
| 3 | 27 (15.08) | 6 (3.35) | 33 (9.22) | |
| 4 | 5 (2.79) | 2 (0.11) | 7 (1.95) | |
| 5 | 5 (2.79) | 0 (0) | 5 (1.39) | |
| 6 | 2 (0.11) | 0 (0) | 2 (0.55) | |
| Parity Category | ||||
| 0 | 51 (28.49) | 108 (60.34) | 159 (44.41) | <0.001 |
| 1–3 | 116 (64.80) | 69 (38.55) | 185 (51.68) | |
| ≥4 | 12 (6.70) | 2 (1.12) | 14 (3.91) | |
| Body Mass Index (kg/m2) | ||||
| Underweight (<18.5) | 1 (0.55) | 5 (2.79) | 6 (1.68) | 0.001 |
| Normal (18.5–24.9) | 63 (35.19) | 86 (48.04) | 149 (41.62) | |
| Overweight (25–29.9) | 45 (25.14) | 51 (28.49) | 96 (26.82) | |
| Obese (≥30) | 70 (39.10) | 37 (20.67) | 107 (29.89) | |
| Booking status | ||||
| Unbooked | 6 (3.35) | 4 (2.23) | 10 (2.79) | 0.521 |
| Booked | 173 (96.65) | 175 (97.77) | 348 (97.20) | |
| Number of antenatal visits Median, IQR | 5 (4–6) | 5 (4–7) | 5 (4–7) | 0.2746 |
| HIV status | ||||
| Negative | 137 (76.54) | 154 (86.03) | 291 (81.28) | 0.021 |
| Positive | 42 (23.46%) | 25 (13.97%) | 67 (18.72) | |
| HIV positive participants only | ||||
| CD4 count median, IQR (cells/mL) | 413 (325–527) | 329.5 (250–447) | 387 (292–506) | 0.0598 |
| <250 | 6 (13.95) | 6 (23.08) | 12 (17.39) | 0.122 |
| 250–349 | 8 (18.60) | 10 (38.46) | 18 (26.09) | |
| 350–499 | 15 (34.88) | 6 (23.08) | 21 (30.43) | |
| ≥500 | 14 (32.56) | 4 (15.38) | 18 (26.09) | |
| Medical morbidity | ||||
| Yes | 29 (16.20) | 30 (16.76) | 59 (16.48) | 0.887 |
| No | 150 (83.80) | 149 (83.24) | 299 (83.52) | |
| Induction of labor | ||||
| yes | 32 | 20 | 52 (14.53) | 0.072 |
| no | 147 | 159 | 306 (85.47) | |
| Duration of labor | ||||
| Median, IQR | 7 (5–9) | 9 (6–11) | 8 (6–10) | <0.001 |
| Cadre of the accoucheur | ||||
| Midwife | 179 (100.00) | 0 (0.00) | 179 (50.00) | <0.001 |
| Medical officer | 0 (0.00) | 16 (8.94) | 16 (4.47) | |
| Registrar | 0 (0.00) | 154 (86.03) | 154 (43.02) | |
| Consultant | 0 (0.00) | 9 (5.03) | 9 (2.51) |
| Factor | Univariable | Multivariable | ||||
|---|---|---|---|---|---|---|
| COR | 95%CI | p-Value | Ad OR | 95%CI | p-Value | |
| Hospital | ||||||
| CHBAH | 1.00 | Reference | Reference | |||
| CMJAH | 1.00 | 0.66–1.51 | 1.00 | 1.10 | 0.69–1.74 | 0.694 |
| Age (Years) | ||||||
| <20 | 1.00 | Reference | Reference | 1.00 | Reference | Reference |
| 20–24 | 1.30 | 0.61–2.76 | 0.491 | 1.95 | 0.89–4.28 | 0.097 |
| 25–29 | 0.40 | 0.18–0.85 | 0.018 | 0.77 | 0.33–1.79 | 0.548 |
| 30–34 | 0.38 | 0.17–0.86 | 0.019 | 0.97 | 0.36–2.60 | 0.953 |
| ≥35 | 0.20 | 0.08–0.49 | <0.001 | 0.61 | 0.22–1.72 | 0.354 |
| Age (Years) | ||||||
| <35 | 1.00 | Reference | Reference | - | - | - |
| ≥35 | 0.29 | 0.15–0.56 | <0.001 | - | - | --- |
| Gestational age (weeks) | ||||||
| <37 | 1.00 | Reference | Reference | |||
| ≥37 | 1.15 | 0.41–3.24 | 0.792 | |||
| Parity | 0.43 | 0.33–0.56 | <0.001 | |||
| Parity Category | ||||||
| 0 | 1.00 | Reference | Reference | 1.00 | Reference | Reference |
| 1–3 | 0.28 | 0.18–0.44 | <0.001 | 0.42 | 0.24–0.74 | 0.002 |
| ≥4 | 0.08 | 0.02–0.37 | 0.001 | 0.13 | 0.02–0.81 | 0.029 |
| Body Mass Index | 0.94 | 0.91–0.98 | 0.002 | |||
| Underweight (<18.5) | 1.00 | Reference | Reference | 1.00 | Reference | Reference |
| Normal (18.5–24.9) | 0.27 | 0.03–2.40 | 0.242 | 0.19 | 0.04–0.91 | 0.037 |
| Overweight (25–29.9) | 0.23 | 0.03–2.02 | 0.183 | 0.19 | 0.04–0.96 | 0.045 |
| Obese (≥30) | 0.11 | 0.01–0.94 | 0.044 | 0.11 | 0.02–0.54 | 0.007 |
| Ethnic group | ||||||
| Black | 1.00 | Reference | Reference | - | - | - |
| Coloured | 1.28 | 0.34–4.86 | 0.717 | - | - | --- |
| Indian/Asian | 1.71 | 0.40–7.27 | 0.470 | - | - | - |
| White | 2.05 | 0.18–22.88 | 0.560 | - | - | --- |
| Ethnic groups | ||||||
| Others | 1.00 | Reference | Reference | - | - | - |
| Blacks | 0.65 | 0.26–1.64 | 0.361 | - | - | --- |
| Employment status | ||||||
| Employed | 1.00 | Reference | Reference | - | - | - |
| Unemployed | 1.60 | 0.92–2.76 | 0.094 | - | - | --- |
| Student | 2.54 | 1.20–5.37 | 0.015 | |||
| Marital status | ||||||
| Married | 1.00 | Reference | Reference | - | - | - |
| Single | 1.00 | 0.49–2.03 | 1.000 | - | - | --- |
| Booking status | ||||||
| Unbooked | 1.00 | Reference | Reference | |||
| Booked | 1.52 | 0.42–5.48 | 0.525 | - | - | - |
| HV status | - | - | --- | |||
| Positive | 1.00 | Reference | Reference | |||
| Negative | 1.89 | 1.85–1.93 | <0.001 | |||
| Medical co-morbidity | ||||||
| Yes | 1.00 | Reference | Reference | |||
| No | 0.96 | 0.89–1.04 | 0.321 | |||
| Induction of labor | ||||||
| Yes | 1.00 | Reference | Reference | |||
| No | 0.58 | 0.32–1.06 | 0.075 | |||
| Duration of labor | 1.17 | 1.10–1.25 | <0.001 | 1.11 ^ | 0.004 | 1.03–1.20 |
| Characteristics | Forceps n = 11 (%) | Vacuum n = 166 (%) | Total n = 177 (%) | p-Value |
|---|---|---|---|---|
| Hospital | ||||
| CHBAH | 9 (81.82) | 83 (50.00) | 92 (51.98) | 0.060 |
| CMJAH | 2 (18.18) | 83 (50.00) | 85 (48.02) | |
| Age mean ± SD (Years) | 23.91 ± 6.46 | 24.99 ± 5.73 | 24.93 ± 5.77 | 0.547 |
| <20 | 3 (27.27) | 23 (13.86) | 26 (14.69) | 0.252 |
| 20–24 | 4 (36.36) | 74 (44.58) | 78 (44.07) | |
| 25–29 | 2 (18.18) | 32 (19.28) | 34 (19.21) | |
| 30–34 | 0 (0.00) | 25 (15.06) | 25 (14.12) | |
| ≥35 | 2 (18.18) | 12 (7.23) | 14 (7.91) | |
| Age (Years) | ||||
| <35 | 9 (81.82) | 154 (92.77) | 163 (92.09) | 0.212 |
| ≥35 | 2 (18.18) | 12 (7.23) | 14 (7.91) | |
| Ethnic group | ||||
| Black | 11 (0.00) | 154 (3.01) | 165 (2.82) | 1.000 |
| Coloured | 0 (0.00) | 5 (3.01) | 5 (2.82) | |
| Indian | 0 (0.00) | 5 (1.20) | 5 (1.13) | |
| White | 0 (100.00) | 2 (92.77) | 2 (93.22) | |
| Ethnic group | ||||
| Blacks | 11 (100.00) | 154 (92.77) | 165 (93.22) | 1.000 |
| Others | 0 (0.00) | 12 (7.23) | 12 (6.78) | |
| Employment status | ||||
| Employed | 1 (9.09) | 26 (15.66) | 27 (15.25) | 0.055 |
| Unemployed | 5 (45.45) | 114 (68.67) | 119 (67.23) | |
| Student | 5 (45.45) | 26 (15.66) | 31 (17.51) | |
| Marital status | ||||
| Married | 0 (0.00) | 17 (10.24) | 17 (9.60) | 0.603 |
| Single | 11 (100.00) | 149 (89.76) | 160 (90.40) | |
| Gestational age (median, IQR) weeks | 39 (37–40) | 39 (38–40) | 39 (38–40) | 0.2905 |
| 27 | 2 (18.18) | 0 (0.00) | 2 (1.13) | 0.027 |
| 35 | 0 (0.00) | 2 (1.20) | 2 (1.13) | |
| 36 | 0 (0.00) | 3 (1.81) | 3 (1.69) | |
| 37 | 1 (9.09) | 14 (8.43) | 15 (8.47) | |
| 38 | 1 (9.09) | 33 (19.88) | 34 (19.21) | |
| 39 | 4 (36.36) | 45 (27.11) | 49 (27.68) | |
| 40 | 2 (18.18) | 41 (24.70) | 43 (24.29) | |
| 41 | 0 (0.00) | 21 (12.65) | 21 (11.86) | |
| 42 | 1 (9.09) | 7 (4.22) | 8 (4.52) | |
| Gestational age | ||||
| <37 | 2 (18.18) | 5 (3.01) | 7 (3.95) | 0.062 0.012 |
| ≥37 | 9 (81.82) | 161(96.99) | 170 (96.05) | |
| Parity | 0 (0–0) | 0 (0–1) | 0.111 | |
| 0 | 9 (81.82) | 97 (58.43) | 106 (59.89) | 0.737 |
| 1 | 2(18.18) | 55(33.13) | 57 (32.20) | |
| 2 | 0 (0.00) | 6 (3.61) | 6 (3.39) | |
| 3 | 0 (0.00) | 6 (3.61) | 6 (3.39) | |
| 4 | 0 (0.00) | 2 (1.20) | 2 (1.13) | |
| 5 | 0 (0.00) | 0 (0.00) | 0 (0.00) | |
| 6 | 0 (0.00) | 0 (0.00) | 0 (0.00) | |
| Parity Category | ||||
| 0 | 9 (81.82) | 97 (58.43) | 106 (59.89) | 0.305 |
| 1–3 | 2 (18.18) | 67 (40.36) | 69 (38.98) | |
| ≥4 | 0 (0.00) | 2 (1.20) | 2 (1.13) | |
| Body Mass Index | 23.1 (21.8–28.5) | 24.95 (22.7–28.9) | 26.1 (23.1–31.2) | 0.716 |
| Underweight (<18.5) | 0 (0.00) | 5 (3.01) | 5 (2.82) | 1.000 |
| Normal (18.5–24.9) | 6 (54.55) | 78 (46.99) | 84 (47.46) | |
| Overweight (25–29.9) | 3 (27.27) | 48 (28.92) | 51 (28.81) | |
| Obese (≥30) | 2 (18.18) | 35 (21.08) | 37 (20.90) | |
| Booking status | ||||
| Unbooked | 0 (0.00) | 4 (2.41) | 4 (2.26) | 1.000 |
| Booked | 11 (100.00) | 162 (97.59) | 173 (97.74) | |
| HV status | ||||
| Negative | 10 (90.91) | 142 (85.54) | 152 (85.88) | 1.000 |
| Positive | 1 (9.09) | 24 (14.46) | 25 (14.12) | |
| Accoucheur | ||||
| Medical officer | 0 (0.00) | 16 (9.64) | 16 (9.04) | 0.020 |
| Registrar | 8 (72.73) | 144 (86.75) | 152 (85.88) | |
| Consultant | 3 (27.27) | 6 (3.61) | 9 (5.08) | |
| Indication | ||||
| Maternal | 7 (63.64) | 94 (56.63) | 101 (57.06) | 0.677 |
| Fetal | 2 (18.18) | 50 (30.12) | 52 (29.38) | |
| Both | 2 (18.18) | 22 (13.25) | 24 (13.56) | |
| Maternal Indication | ||||
| Delayed second stage | 5 (62.50) | 63 (54.31) | 68 (54.84) | 0.198 |
| Poor maternal effort | 0 (0.00) | 30 (25.86) | 30 (24.19) | |
| Delayed 2nd stage and poor maternal effort | 3 (37.50) | 23 (19.83) | 26 (20.97) | |
| Fetal indication | ||||
| Fetal distress | 3 (75.00) | 73 (100.00) | 76 (98.70) | 0.052 |
| Preterm/prematurity | 1 (25.00) | 0 (0.00) | 1 (1.30) | |
| Induction of labor | ||||
| Yes | 1 (9.09) | 19 (11.45) | 20 (11.30) | 1.000 |
| No | 10 (90.91) | 147 (88.55) | 157 (88.70) | |
| Duration of labor (median, IQR) hours | 10 (6–11) | 9 (6–11) | 9 (6–11) | 0.913 |
| Position of the presenting part | ||||
| ROA | 3 (27.27) | 63 (37.95) | 66 (37.29) | 0.331 |
| ROP | 1 (9.09) | 2 (1.20) | 3 (1.69) | |
| ROT | 7 (63.64) | 91 (54.82) | 98 (55.37) | |
| LOA | 0 (0.00) | 9 (5.42) | 9 (5.08) | |
| LOP | 0 (0.00) | 1 (0.60) | 1 (0.56) | |
| Analgesia | ||||
| Epidural | 0 (0.00) | 1 (0.60) | 1 (0.56) | |
| Local anesthetic | 5 (45.45) | 75 (45.18) | 80 (45.20) | 0.441 |
| Pethidine only | 1 (9.09) | 5 (3.01) | 6 (3.39) | |
| Local anesthetics and Pethidine | 5 (45.45) | 85 (51.20) | 90 (50.85) |
| Factor | Univariable | Multivariable | ||||
|---|---|---|---|---|---|---|
| OR | 95%CI | p-Value | Ad OR | 95%CI | p-Value | |
| Hospital | ||||||
| CHBAH | 1.00 | Reference | Reference | 1.00 | Reference | Reference |
| CMJAH | 4.5 | 0.94–21.46 | 0.059 | 2.90 | 0.61–13.77 | 0.18 |
| Age (Years) | ||||||
| <20 | 1.00 | Reference | Reference | 1.00 | Reference | Reference |
| 20–24 | 2.41 | 0.50–11.64 | 0.273 | |||
| 25–29 | 2.09 | 0.32–13.59 | 0.442 | |||
| 30–34 | 1.00 | - | - | |||
| ≥35 | 0.78 | 0.11–5.37 | 0.803 | |||
| Age (Years) | ||||||
| <35 | 1.00 | Reference | Reference | 1.00 | Reference | Reference |
| ≥35 | 0.35 | 0.07–1.82 | 0.212 | 0.14 | 0.02–0.81 | 0.029 |
| Gestational age | ||||||
| ≥37 | 1.00 | Reference | Reference | 1.00 | Reference | Reference |
| <37 | 0.14 | 0.02–0.82 | 0.030 | 0.36 | 0.09–1.43 | 0.146 |
| Parity | 2.91 | 0.78–10.83 | 0.112 | |||
| Parity Category | ||||||
| 0 | 1.00 | Reference | Reference | 1.00 | Reference | Reference |
| ≥1 | 3.20 | 0.67–15.35 | 0.146 | 7.51 | 1.99–28.32 | 0.003 |
| Accoucheur | ||||||
| Consultant | 1.00 | Reference | Reference | 1.00 | Reference | Reference |
| Registrar/Medical officer | 10 | 2.10–47.67 | 0.004 | 7.11 | 1.29–39.02 | 0.024 |
| Body Mass Index | ||||||
| Underweight (<18.5) | ||||||
| Normal (18.5–24.9) | 1.00 | Reference | Reference | |||
| Overweight (25–29.9) | 1.23 | 0.29–5.17 | 0.777 | |||
| Obese (≥30) | 1.35 | 0.26–7.04 | 0.725 | |||
| HV status | ||||||
| Negative | 1.00 | Reference | Reference | |||
| Positive | 1.69 | 0.21–13.89 | 0.625 | |||
| Indication | ||||||
| Both | 1.00 | Reference | Reference | |||
| Maternal | 1.22 | 0.24–6.28 | 0.811 | |||
| Fetal | 2.27 | 0.30–17.19 | 0.426 | |||
| Employment status | ||||||
| Employed | 1.00 | Reference | Reference | |||
| Unemployed | 0.88 | 0.10–7.88 | 0.907 | |||
| Student | 0.20 | 0.02–1.84 | 0.156 | |||
Publisher’s Note: MDPI stays neutral with regard to jurisdictional claims in published maps and institutional affiliations. |
© 2022 by the authors. Licensee MDPI, Basel, Switzerland. This article is an open access article distributed under the terms and conditions of the Creative Commons Attribution (CC BY) license (https://creativecommons.org/licenses/by/4.0/).
Share and Cite
Dutywa, A.; Olorunfemi, G.; Mbodi, L. Trends and Determinants of Operative Vaginal Delivery at Two Academic Hospitals in Johannesburg, South Africa 2005–2019. Int. J. Environ. Res. Public Health 2022, 19, 16182. https://doi.org/10.3390/ijerph192316182
Dutywa A, Olorunfemi G, Mbodi L. Trends and Determinants of Operative Vaginal Delivery at Two Academic Hospitals in Johannesburg, South Africa 2005–2019. International Journal of Environmental Research and Public Health. 2022; 19(23):16182. https://doi.org/10.3390/ijerph192316182
Chicago/Turabian StyleDutywa, Afikile, Gbenga Olorunfemi, and Langanani Mbodi. 2022. "Trends and Determinants of Operative Vaginal Delivery at Two Academic Hospitals in Johannesburg, South Africa 2005–2019" International Journal of Environmental Research and Public Health 19, no. 23: 16182. https://doi.org/10.3390/ijerph192316182
APA StyleDutywa, A., Olorunfemi, G., & Mbodi, L. (2022). Trends and Determinants of Operative Vaginal Delivery at Two Academic Hospitals in Johannesburg, South Africa 2005–2019. International Journal of Environmental Research and Public Health, 19(23), 16182. https://doi.org/10.3390/ijerph192316182