


A Comprehensive Evaluation System for the Stabilization Effect of Heavy Metal-Contaminated Soil Based on Analytic Hierarchy Process
Abstract
1. Introduction
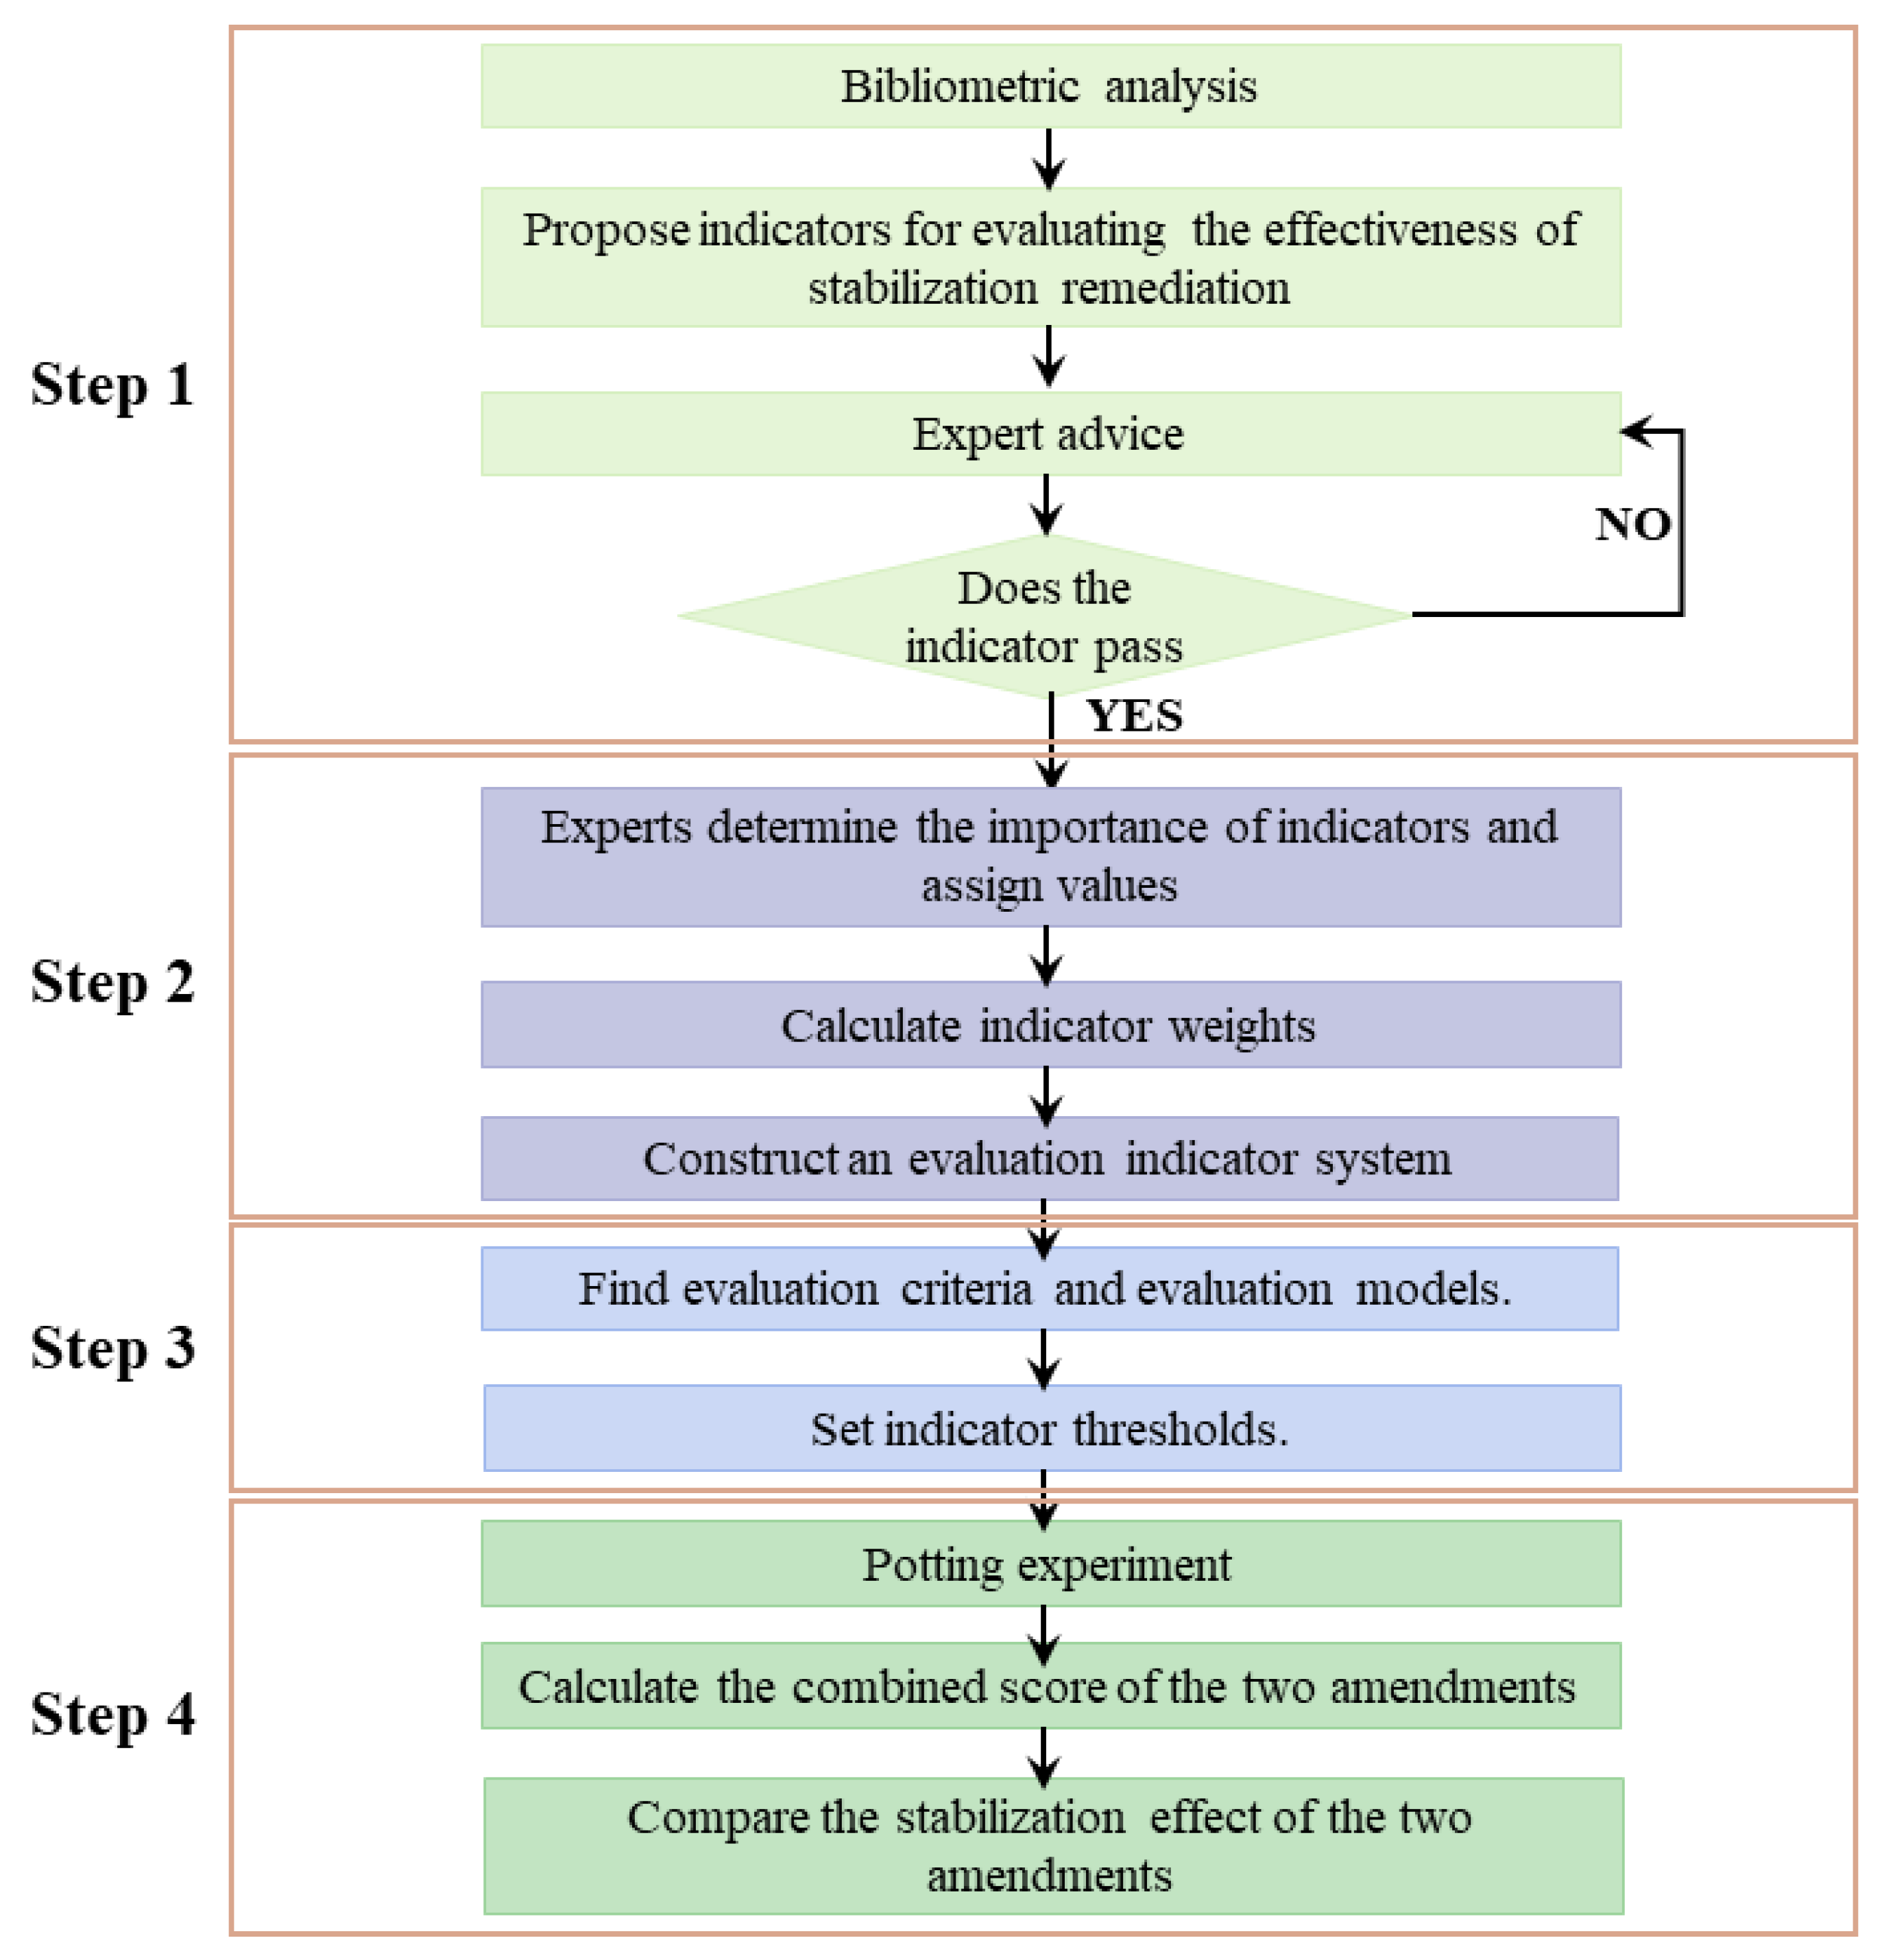
2. Research Methods
2.1. Literature Analysis Method
2.2. Delphi Method
2.3. Analytic Hierarchy Process
2.3.1. Construction of Judgment Matrix
2.3.2. Calculate the Maximum Eigenvalue of the Judgement Matrix Using the Sum-Product Method [26]
2.3.3. Consistency Test
3. Results
3.1. Evaluation Principles
- Comprehensive. The selection of the evaluation of the indicators should reflect the changes in all aspects of the soil–plant system.
- Objectivity. The selected indicators should reflect the remediation effect to the greatest extent possible, of which the quantitative analysis indicators should be the main focus.
- Stability. Highly stable indicators should be selected to ensure the relative stability of the evaluation results.
- Ease of evaluation. The indicators used to evaluate the stabilization effect should be easily measured or measurable with the available technical means, so that a numerical transformation and statistics can be performed during the evaluation process.
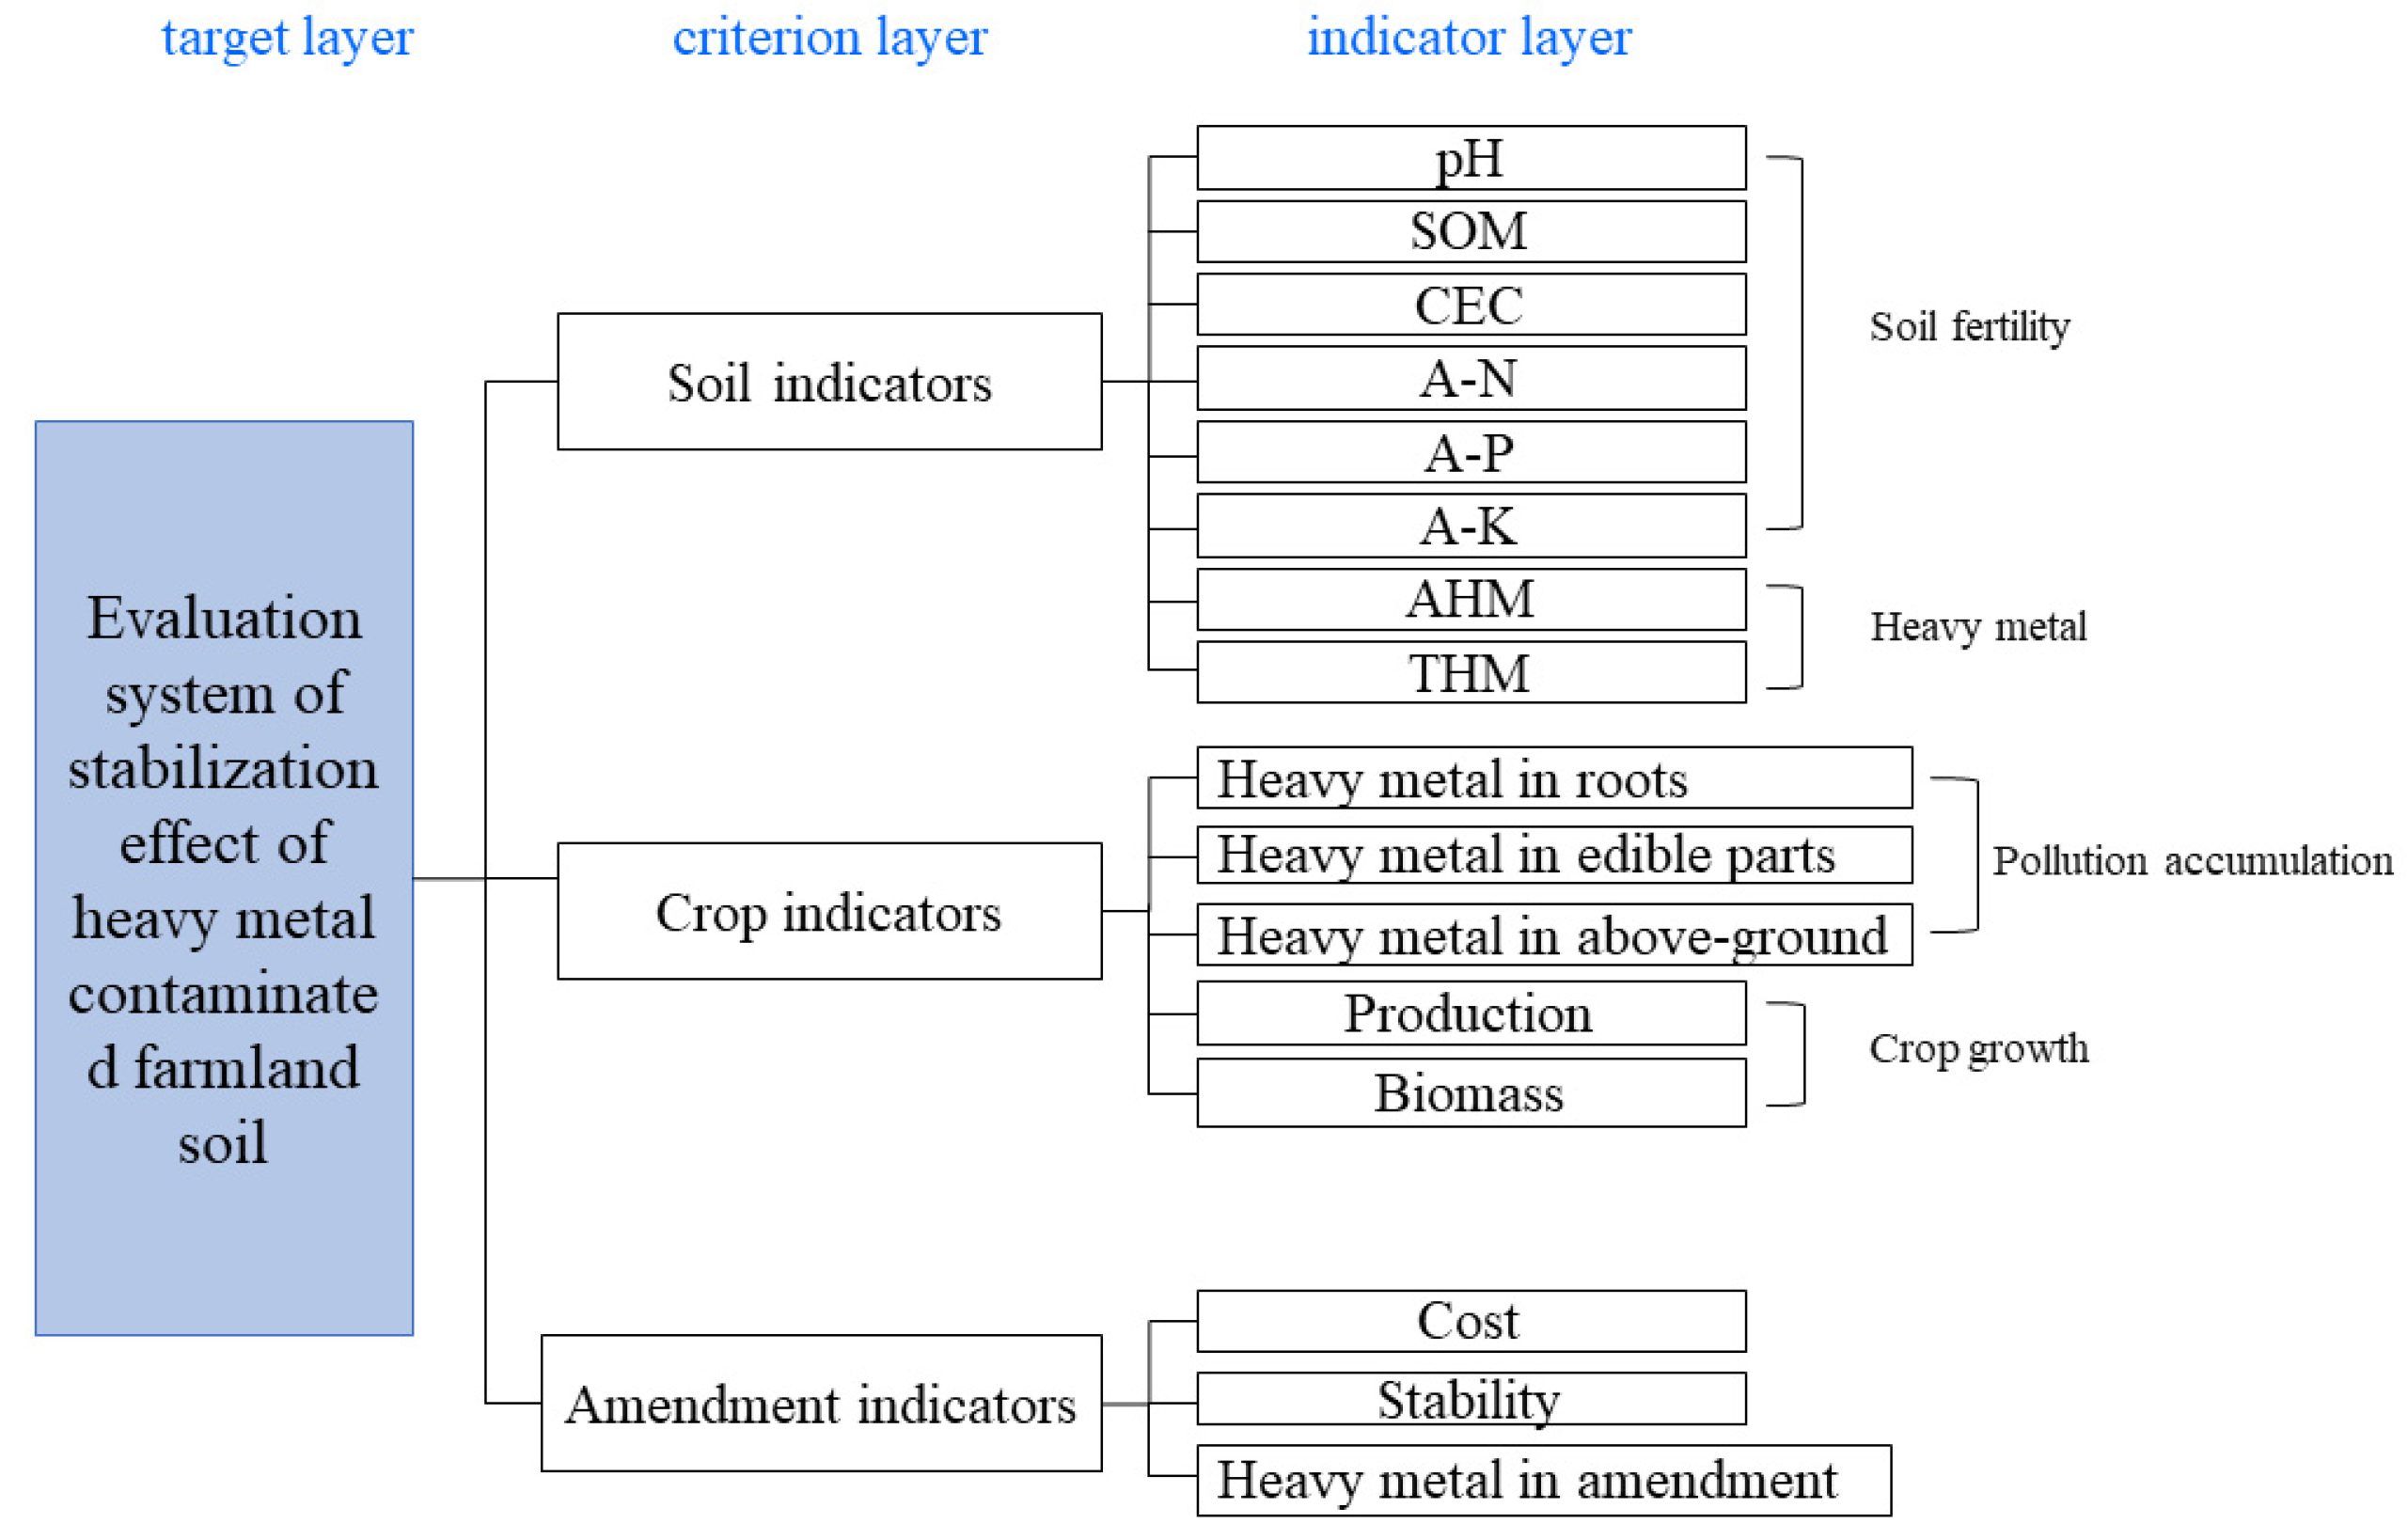
3.2. Evaluation Index Selection Analysis
3.2.1. Soil Indicators
- (1)
- Fertility Indicators
- (2)
- Heavy metal indicators
- (3)
- Microbiological indicators
3.2.2. Crop Indicators
3.2.3. Amendment Indicators
3.3. Evaluation Index System Determination
3.4. Weight Analysis
3.5. Classification of Indicators and Evaluation Standards
3.5.1. Indicators I
3.5.2. Indicators II
3.5.3. Indicator III
3.6. Comprehensive Evaluation Model
3.7. Laboratory Applications
4. Discussion
4.1. Evaluation Index
4.2. Deficiencies in the Evaluation Method
4.3. Analysis of Changes in AHM
5. Conclusions
Author Contributions
Funding
Institutional Review Board Statement
Informed Consent Statement
Data Availability Statement
Conflicts of Interest
References
- Gholizadeh, M.; Hu, X. Removal of Heavy Metals from Soil with Biochar Composite: A Critical Review of the Mechanism. J. Environ. Chem. Eng. 2021, 9, 105830. [Google Scholar] [CrossRef]
- Wan, X.; Yang, J.; Song, W. Pollution Status of Agricultural Land in China: Impact of Land Use and Geographical Position. Soil Water Res. 2018, 13, 234–242. [Google Scholar]
- Kavitha, B.; Reddy, P.V.L.; Kim, B.; Lee, S.S.; Pandey, S.K.; Kim, K.H. Benefits and Limitations of Biochar Amendment in Agricultural Soils: A Review. J. Environ. Manag. 2018, 227, 146–154. [Google Scholar] [CrossRef]
- Yang, J.; Wang, J.; Qiao, P.; Zheng, Y.; Yang, J.; Chen, T.; Lei, M.; Wan, X.; Zhou, X. Identifying Factors That Influence Soil Heavy Metals by Using Categorical Regression Analysis: A Case Study in Beijing, China. Front. Environ. Sci. Eng. 2020, 14, 37. [Google Scholar] [CrossRef]
- Zhao, K.; Yang, Y.; Zhang, L.; Zhang, J.; Zhou, Y.; Huang, H.; Luo, S.; Luo, L. Silicon-Based Additive on Heavy Metal Remediation in Soils: Toxicological Effects, Remediation Techniques, and Perspectives. Environ. Res. 2022, 205, 112244. [Google Scholar] [CrossRef] [PubMed]
- Seneviratne, M.; Weerasundara, L.; Ok, Y.S.; Rinklebe, J.; Vithanage, M. Phytotoxicity Attenuation in Vigna Radiata under Heavy Metal Stress at the Presence of Biochar and N Fixing Bacteria. J. Environ. Manag. 2017, 186, 293–300. [Google Scholar] [CrossRef]
- Wang, Y.; Zhong, B.; Shafi, M.; Ma, J.; Guo, J.; Wu, J.; Ye, Z.; Liu, D.; Jin, H. Effects of Biochar on Growth, and Heavy Metals Accumulation of Moso Bamboo (Phyllostachy pubescens), Soil Physical Properties, and Heavy Metals Solubility in Soil. Chemosphere 2019, 219, 510–516. [Google Scholar] [CrossRef]
- Li, X. Technical Solutions for the Safe Utilization of Heavy Metal-Contaminated Farmland in China: A Critical Review. Land Degrad. Dev. 2019, 30, 1773–1784. [Google Scholar] [CrossRef]
- Li, L.; Mao, K.; Ippolito, J.A.; Xing, W.; Chen, X.; Zhu, W.; Cheng, Y. Calcium Amendments Affect Heavy Metal Bioavailability in Acidic and Calcareous Soils. Int. J. Environ. Sci. Technol. 2022, 19, 10067–10076. [Google Scholar] [CrossRef]
- Su, R.; Ou, Q.; Wang, H.; Luo, Y.; Dai, X.; Wang, Y.; Chen, Y.; Shi, L. Comparison of Phytoremediation Potential of Nerium Indicum with Inorganic Modifier Calcium Carbonate and Organic Modifier Mushroom Residue to Lead–Zinc Tailings. Int. J. Environ. Res. Public Health 2022, 19, 10353. [Google Scholar] [CrossRef]
- Hu, X.; Huang, X.; Zhao, H.; Liu, F.; Wang, L.; Zhao, X.; Gao, P.; Li, X.; Ji, P. Possibility of Using Modified Fly Ash and Organic Fertilizers for Remediation of Heavy-Metal-Contaminated Soils. J. Clean. Prod. 2021, 284, 124713. [Google Scholar] [CrossRef]
- Cui, H.; Shi, Y.; Zhou, J.; Chu, H.; Cang, L.; Zhou, D. Effect of Different Grain Sizes of Hydroxyapatite on Soil Heavy Metal Bioavailability and Microbial Community Composition. Agric. Ecosyst. Environ. 2018, 267, 165–173. [Google Scholar] [CrossRef]
- Palansooriya, K.N.; Li, J.; Dissanayake, P.D.; Suvarna, M.; Li, L.; Yuan, X.; Sarkar, B.; Tsang, D.C.W.; Rinklebe, J.; Wang, X.; et al. Prediction of Soil Heavy Metal Immobilization by Biochar Using Machine Learning. Environ. Sci. Technol. 2022, 56, 4187–4198. [Google Scholar] [CrossRef] [PubMed]
- Ma, Y.; Cheng, L.; Zhang, D.; Zhang, F.; Zhou, S.; Ma, Y.; Guo, J.; Zhang, Y.; Xing, B. Stabilization of Pb, Cd, and Zn in Soil by Modified-Zeolite: Mechanisms and Evaluation of Effectiveness. Sci. Total Environ. 2022, 814, 152746. [Google Scholar] [CrossRef]
- Liu, X.; Wang, W.; Xiao, J.; Zhang, H.; Zhang, Y.; Xiao, W. Effects of Magnetic Hydroxyapatite Loaded Biochar on Cd Removal and Passivation in Paddy Soil and Its Accumulation in Rice: A 2-Year Field Study. Environ. Sci. Pollut. Res. 2022. [Google Scholar] [CrossRef]
- Liu, G.; Dai, Z.; Tang, C.; Xu, J. The Immobilization, Plant Uptake and Translocation of Cadmium in a Soil-Pakchoi (Brassica chinensis L.) System Amended with Various Sugarcane Bagasse-Based Materials. Environ. Pollut. 2022, 311, 119946. [Google Scholar] [CrossRef] [PubMed]
- Derakhshan Nejad, Z.; Jung, M.C.; Kim, K.-H. Remediation of Soils Contaminated with Heavy Metals with an Emphasis on Immobilization Technology. Environ. Geochem. Health 2018, 40, 927–953. [Google Scholar] [CrossRef]
- Rizwan, M.; Ali, S.; Qayyum, M.F.; Ok, Y.S.; Adrees, M.; Ibrahim, M.; Zia-ur-Rehman, M.; Farid, M.; Abbas, F. Effect of Metal and Metal Oxide Nanoparticles on Growth and Physiology of Globally Important Food Crops: A Critical Review. J. Hazard. Mater. 2017, 322, 2–16. [Google Scholar] [CrossRef]
- Zhao, H.; Du, L.; Wu, Y.; Wu, X.; Han, W. Numerical Assessment of the Passivator Effectiveness for Cd-Contaminated Soil Remediation. Sci. Total Environ. 2021, 779, 146485. [Google Scholar] [CrossRef]
- Chaplygin, V.A.; Rajput, V.D.; Mandzhieva, S.S.; Minkina, T.M.; Nevidomskaya, D.G.; Nazarenko, O.G.; Kalinitchenko, V.P.; Singh, R.; Maksimov, A.Y.; Popova, V.A. Comparison of Heavy Metal Content in Artemisia austriaca in Various Impact Zones. ACS Omega 2020, 5, 23393–23400. [Google Scholar] [CrossRef]
- Wu, S.; Lu, C. Evaluation of Applying an Alkaline Green Tea/Ferrous Iron System to Lindane Remediation Impacts to Soil and Plant Growth-Promoting Microbial Community. Sci. Total Environ. 2021, 786, 147511. [Google Scholar] [CrossRef]
- Wang, X.; Yan, X.; Li, X. Environmental Risks for Application of Magnesium Slag to Soils in China. J. Integr. Agric. 2020, 19, 1671–1679. [Google Scholar] [CrossRef]
- Dweiri, F.; Kumar, S.; Khan, S.A.; Jain, V. Designing an Integrated AHP Based Decision Support System for Supplier Selection in Automotive Industry. Expert Syst. Appl. 2016, 62, 273–283. [Google Scholar] [CrossRef]
- Jiang, Z.; Wei, Z. Grassland Resource Evaluation Based on Improved Bp Network Model and Analytic Hierarchy Process. IFS 2021, 40, 7109–7120. [Google Scholar] [CrossRef]
- Hu, Y.; Zhang, P.; Yang, M.; Liu, Y.; Zhang, X.; Feng, S.; Guo, D.; Dang, X. Biochar Is an Effective Amendment to Remediate Cd-Contaminated Soils—A Meta-Analysis. J. Soils Sediments 2020, 20, 3884–3895. [Google Scholar] [CrossRef]
- Zupic, I.; Cater, T. Bibliometric Methods in Management and Organization. Organ. Res. Methods 2015, 18, 429–472. [Google Scholar] [CrossRef]
- Li, X.; Li, J.; Sui, H.; He, L.; Cao, X.; Li, Y. Evaluation and Determination of Soil Remediation Schemes Using a Modified AHP Model and Its Application in a Contaminated Coking Plant. J. Hazard. Mater. 2018, 353, 300–311. [Google Scholar] [CrossRef]
- Lyu, H.M.; Zhou, W.H.; Shen, S.L.; Zhou, A.N. Inundation Risk Assessment of Metro System Using AHP and TFN-AHP in Shenzhen. Sustain. Cities Soc. 2020, 56, 102103. [Google Scholar] [CrossRef]
- Balesdent, J.; Chenu, C.; Balabane, M. Relationship of Soil Organic Matter Dynamics to Physical Protection and Tillage. Soil Tillage Res. 2000, 53, 215–230. [Google Scholar] [CrossRef]
- Razzaghi, F.; Arthur, E.; Moosavi, A.A. Evaluating Models to Estimate Cation Exchange Capacity of Calcareous Soils. Geoderma 2021, 400, 115221. [Google Scholar] [CrossRef]
- Hong, J.; Wang, X.; Wu, J. Effects of Soil Fertility on the N: P Stoichiometry of Herbaceous Plants on a Nutrient-Limited Alpine Steppe on the Northern Tibetan Plateau. Plant Soil 2015, 391, 179–194. [Google Scholar] [CrossRef]
- Di Palo, F.; Fornara, D. Soil Fertility and the Carbon: Nutrient Stoichiometry of Herbaceous Plant Species. Ecosphere 2015, 6, 273. [Google Scholar] [CrossRef]
- Ma, B.; Wang, Z.; Yuan, X.; Cen, K.; Li, J.; Yang, N.; Zhu, X. In Situ Stabilization of Heavy Metals in a Tailing Pond with a New Method for the Addition of Mineral Stabilizers-High-Pressure Rotary Jet Technology. Environ. Sci. Pollut. Res. 2020, 27, 15388–15400. [Google Scholar] [CrossRef] [PubMed]
- He, L.; Su, R.; Chen, Y.; Zeng, P.; Du, L.; Cai, B.; Zhang, A.; Zhu, H. Integration of Manganese Accumulation, Subcellular Distribution, Chemical Forms, and Physiological Responses to Understand Manganese Tolerance in Macleaya cordata. Environ. Sci. Pollut. Res. 2022, 29, 39017–39026. [Google Scholar] [CrossRef]
- Cheng, J.; Yu, L.; Li, T.; Liu, Y.; Lu, C.; Li, T.; Wang, H. Effects of Nanoscale Carbon Black Modified by HNO3 on Immobilization and Phytoavailability of Ni in Contaminated Soil. J. Chem. 2015, 2015, 839069. [Google Scholar] [CrossRef]
- Zhu, Y.; Yu, H.; Wang, J.; Fang, W.; Yuan, J.; Yang, Z. Heavy Metal Accumulations of 24 Asparagus Bean Cultivars Grown in Soil Contaminated with Cd Alone and with Multiple Metals (Cd, Pb, and Zn). J. Agric. Food Chem. 2007, 55, 1045–1052. [Google Scholar] [CrossRef] [PubMed]
- Fan, Y.; Zhang, Y.; Chen, Z.; Wang, X.; Huang, B. Comprehensive Assessments of Soil Fertility and Environmental Quality in Plastic Greenhouse Production Systems. Geoderma 2021, 385, 114899. [Google Scholar] [CrossRef]
- Zou, J.; Liu, X.; Dai, W.; Luan, Y. Pollution Assessment of Heavy Metal Accumulation in the Farmland Soils of Beijing’s Suburbs. Environ. Sci. Pollut. Res. 2018, 25, 27483–27492. [Google Scholar] [CrossRef]
- Wang, Y.; Wen, Y.; Li, J.J.; He, J.; Qin, W.C.; Su, L.M.; Zhao, Y.H. Investigation on the Relationship between Bioconcentration Factor and Distribution Coefficient Based on Class-Based Compounds: The Factors that Affect Bioconcentration. Environ. Toxicol. Pharmacol. 2014, 38, 388–396. [Google Scholar] [CrossRef]
- Soubasakou, G.; Cavoura, O.; Damikouka, I. Phytoremediation of Cadmium-Contaminated Soils: A Review of New Cadmium Hyperaccumulators and Factors Affecting their Efficiency. Bull. Environ. Contam. Toxicol. 2022, 109, 783–787. [Google Scholar] [CrossRef]
- Ramana, S.; Tripathi, A.K.; Kumar, A.; Dey, P.; Saha, J.K.; Patra, A.K. Evaluation of Furcraea foetida (L.) Haw. for Phytoremediation of Cadmium Contaminated Soils. Environ. Sci. Pollut. Res. 2021, 28, 14177–14181. [Google Scholar] [CrossRef] [PubMed]
- Jin, Y.; Wang, L.; Song, Y.; Zhu, J.; Qin, M.; Wu, L.; Hu, P.; Li, F.; Fang, L.; Chen, C.; et al. Integrated Life Cycle Assessment for Sustainable Remediation of Contaminated Agricultural Soil in China. Environ. Sci. Technol. 2021, 55, 12032–12042. [Google Scholar] [CrossRef] [PubMed]
- Wang, D.; Bai, J.; Wang, W.; Zhang, G.; Cui, B.; Liu, X.; Li, X. Comprehensive Assessment of Soil Quality for Different Wetlands in a Chinese Delta. Land Degrad. Dev. 2018, 29, 3783–3794. [Google Scholar] [CrossRef]
- Zhang, D.; Ding, A.; Li, T.; Wu, X.; Liu, Y.; Naidu, R. Immobilization of Cd and Pb in a Contaminated Acidic Soil Amended with Hydroxyapatite, Bentonite, and Biochar. J. Soils Sediments 2021, 21, 2262–2272. [Google Scholar] [CrossRef]
- Staff, T.P.O. Correction: Method and Application for Dynamic Comprehensive Evaluation with Subjective and Objective Information. PLoS ONE 2014, 9, e90260. [Google Scholar]


| Element | Scale | Meaning |
|---|---|---|
| bij | 1 | Factor i is of equal importance compared to factor j |
| 3 | Factor i is slightly more important than factor j | |
| 5 | Factor i is significantly more important than factor j | |
| 7 | Factor i is strongly more important than j compared to factor j | |
| 9 | Factor i is extremely more important than j compared to factor j |
| n | 1 | 2 | 3 | 4 | 5 | 6 | 7 | 8 | 9 |
|---|---|---|---|---|---|---|---|---|---|
| RI | 0 | 0 | 0.58 | 0.90 | 1.12 | 1.24 | 1.32 | 1.41 | 1.45 |
| Target Layer | Criterion Layer | Weight | Sub-Criteria Layer | Relative Weight | Indicator Layer | Comprehensive Weight |
|---|---|---|---|---|---|---|
| Stabilization effect evaluation system (A) | Soil (B1) | 0.544 | Soil fertility (B11) | 0.295 | pH | 0.052 |
| SOM | 0.021 | |||||
| CEC | 0.017 | |||||
| A-N | 0.021 | |||||
| A-P | 0.022 | |||||
| A-K | 0.022 | |||||
| Heavy metal (B12) | 0.705 | AHM | 0.300 | |||
| THM | 0.091 | |||||
| Crop (B2) | 0.316 | Crop growth (B21) | 0.265 | Biomass | 0.025 | |
| Production | 0.060 | |||||
| Pollution accumulation (B22) | 0.735 | Heavy metal in edible parts | 0.150 | |||
| Heavy metal in above-ground parts | 0.028 | |||||
| Heavy metal in roots | 0.054 | |||||
| Amendment (B3) | 0.140 | Cost | 0.042 | |||
| Heavy metal in amendment | 0.045 | |||||
| Stability | 0.053 |
| Indicator | Evaluation Standard |
|---|---|
| THM in soil | Soil environmental quality soil contamination risk control standards for agricultural land (for trial implementation) (GB 15618-2018) |
| Heavy metal in edible parts | National Food Safety Standards Limits for Contaminants in Food (GB2762-2017) |
| Heavy metals in amendment | Limit requirements for toxic and hazardous substances in fertilizers (GB 38400-2019) |
| Indicator | Level 1 | Level 2 | Level 3 | Level 4 | Level 5 | Level 6 |
|---|---|---|---|---|---|---|
| pH | 5~7 | 4~5 or 7~8 | 3~4 or 8~9 | 2.5~3 | ||
| SOM(g·kg−1) | >40 | 30~40 | 20~30 | 10~20 | 6~10 | <6 |
| CEC(c mol (+)·kg−1) | >20 | 10~20 | <10 | |||
| A-P (mg·kg−1) | >40 | 20~40 | 10~20 | 5~10 | 3~5 | <3 |
| A-K (mg·kg−1) | >200 | 150~200 | 100~150 | 50~100 | 30~50 | <30 |
| A-N (mg·kg−1) | >150 | 120~150 | 90~120 | 60~90 | 30~60 | <30 |
| Production | >0.9 | 0.8~0.9 | 0.7~0.8 | <0.7 | ||
| Biomass | >0.8 | 0.7~0.8 | 0.5~0.7 | <0.5 | ||
| Cost | <0.5 | 0.5~0.6 | 0.6~0.7 | >0.7 |
| Indicators | L | H | L1 | H1 | Function Type | Formula |
|---|---|---|---|---|---|---|
| SOM | 6 | 40 | “S” type | |||
| CEC | 10 | 20 | ||||
| A-N | 30 | 150 | ||||
| A-P | 3 | 40 | ||||
| A-K | 30 | 200 | ||||
| Production | 0.9 | |||||
| Stability | 3 | |||||
| Biomass | 0.8 | |||||
| AHM | 75% | Inverse “S” type | ||||
| THM | 0.6 | 3.0 | ||||
| Heavy metal in edible part | 0.2 | |||||
| Heavy metal in above-ground | 10% | 100% | ||||
| Heavy metal in roots | 10% | 100% | ||||
| Heavy metal in amendment | 10 | |||||
| Cost | 0.5 | 0.7 | ||||
| pH | 5 | 7 | 3 | 9 | Parabolic or midpoint type |
| Grade | I | II | III | IV | V |
|---|---|---|---|---|---|
| S | (0.8,1] | (0.6,0.8] | (0.4,0.6] | (0.2,0.4] | (0,0.2] |
| S = Sb − Sa | Passivation Results | Meaning |
|---|---|---|
| >1 | Excellent | The comprehensive score increased by more than one grade after remediation |
| =1 | Good | The comprehensive score increased by one grade after remediation |
| =0 | Qualified | No change in comprehensive score after remediation |
| =−1 | Poor | The comprehensive score decreased by one grade after remediation |
| <−1 | Very poor | The comprehensive score decreased by more than one grade after remediation |
| Physicochemical Properties | Measured Values | |
|---|---|---|
| pH | 8.026 | |
| Electrical conductivity(mS·m−1) | 221 | |
| SOM(g·Kg−1) | 4.469 | |
| Soil separate(mg·Kg−1) | <2 μm | 59.88 |
| 2~10 μm | 32.11 | |
| 20~200 μm | 8.01 | |
| Cd(mg·Kg−1) | 0.18 | |
| Indicator | Control | RBC | HAP | |||
|---|---|---|---|---|---|---|
| Measured Values | Score | Measured Values | Score | Measured Values | Score | |
| pH | 7.27 ± 0.05 | 0.87 | 7.22 ± 0.02 | 0.89 | 7.11 ± 0.02 | 0.95 |
| SOM (g·kg−1) | 18.21 ± 1.02 | 0.36 | 21.86 ± 0.83 | 0.47 | 19.37 ± 0.76 | 0.39 |
| CEC (c mol (+)·kg−1) | 13.4 ± 0.85 | 0.34 | 13.4 ± 0.41 | 0.34 | 12.1 ± 0.32 | 0.21 |
| A-N (mg·kg−1) | 29.40 ± 4.49 | 0 | 33.92 ± 3.93 | 0.03 | 25.66 ± 5.77 | 0 |
| A-P (mg·kg−1) | 75.39 ± 25.50 | 1 | 79.01 ± 17.13 | 1 | 47.31 ± 13.13 | 1 |
| A-K (mg·kg−1) | 40.56 ± 11.13 | 0.06 | 47.78 ± 11.28 | 0.10 | 127.81 ± 12.52 | 0.58 |
| AHM (mg·kg−1) | 2.85 ± 0.07 | 0 | 2.14 ± 0.03 | 0.33 | 1.50 ± 0.03 | 0.63 |
| Biomass (g) | 1.16 ± 0.11 | 0.91 | 1.26 ± 0.14 | 0.99 | 1.66 ± 0.45 | 1 |
| Above-ground (mg·kg−1) | 0.60 | 0.98 | 0.40 | 1 | 0.35 | 1 |
| Roots (mg·kg−1) | 2.30 | 0.60 | 1.95 | 0.68 | 1.80 | 0.71 |
| PHM (mg·kg−1) | 0 | 1 | 0 | 1 | ||
| Stability (a) | >3 | 1 | >3 | 1 | ||
| Score (Si) | 0.165 | 0.371 | 0.471 | |||
Publisher’s Note: MDPI stays neutral with regard to jurisdictional claims in published maps and institutional affiliations. |
© 2022 by the authors. Licensee MDPI, Basel, Switzerland. This article is an open access article distributed under the terms and conditions of the Creative Commons Attribution (CC BY) license (https://creativecommons.org/licenses/by/4.0/).
Share and Cite
Zhang, S.; Hu, C.; Cheng, J. A Comprehensive Evaluation System for the Stabilization Effect of Heavy Metal-Contaminated Soil Based on Analytic Hierarchy Process. Int. J. Environ. Res. Public Health 2022, 19, 15296. https://doi.org/10.3390/ijerph192215296
Zhang S, Hu C, Cheng J. A Comprehensive Evaluation System for the Stabilization Effect of Heavy Metal-Contaminated Soil Based on Analytic Hierarchy Process. International Journal of Environmental Research and Public Health. 2022; 19(22):15296. https://doi.org/10.3390/ijerph192215296
Chicago/Turabian StyleZhang, Suxin, Cheng Hu, and Jiemin Cheng. 2022. "A Comprehensive Evaluation System for the Stabilization Effect of Heavy Metal-Contaminated Soil Based on Analytic Hierarchy Process" International Journal of Environmental Research and Public Health 19, no. 22: 15296. https://doi.org/10.3390/ijerph192215296
APA StyleZhang, S., Hu, C., & Cheng, J. (2022). A Comprehensive Evaluation System for the Stabilization Effect of Heavy Metal-Contaminated Soil Based on Analytic Hierarchy Process. International Journal of Environmental Research and Public Health, 19(22), 15296. https://doi.org/10.3390/ijerph192215296