
Evaluation of Neuromuscular Fatigue in a Repeat Sprint Ability, Countermovement Jump and Hamstring Test in Elite Female Soccer Players

 ,
,  ,
,  and
and 
Abstract
1. Introduction
2. Materials and Methods
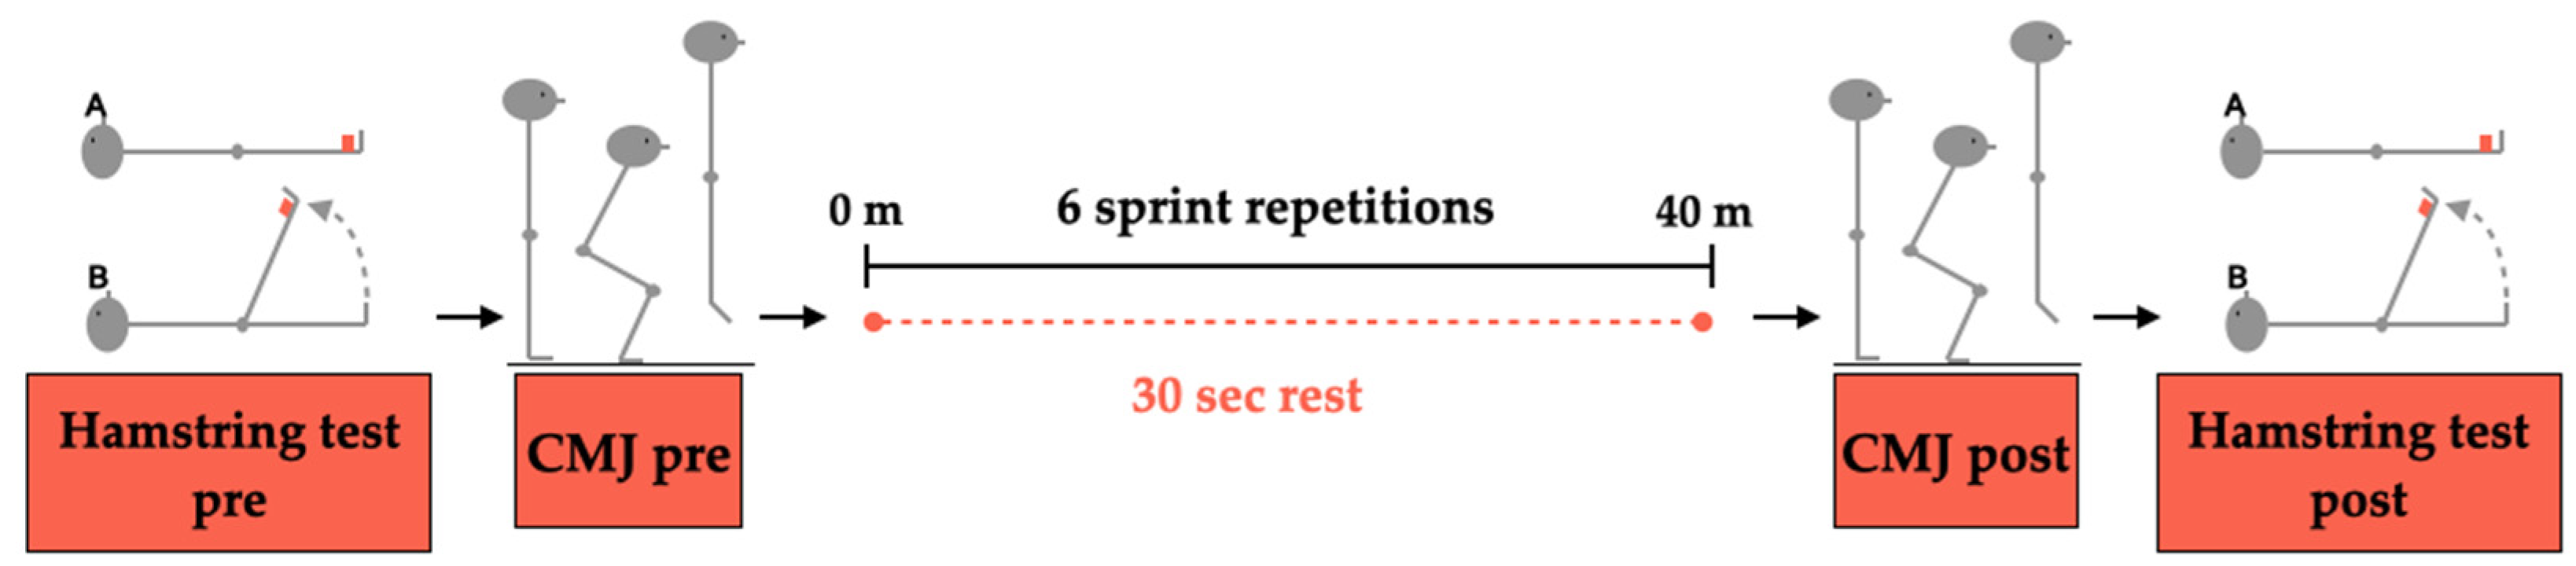
2.1. Experimental Approach to the Problem
2.2. Subjects
2.3. Procedures
2.3.1. Hamstring Test
2.3.2. CMJ Test
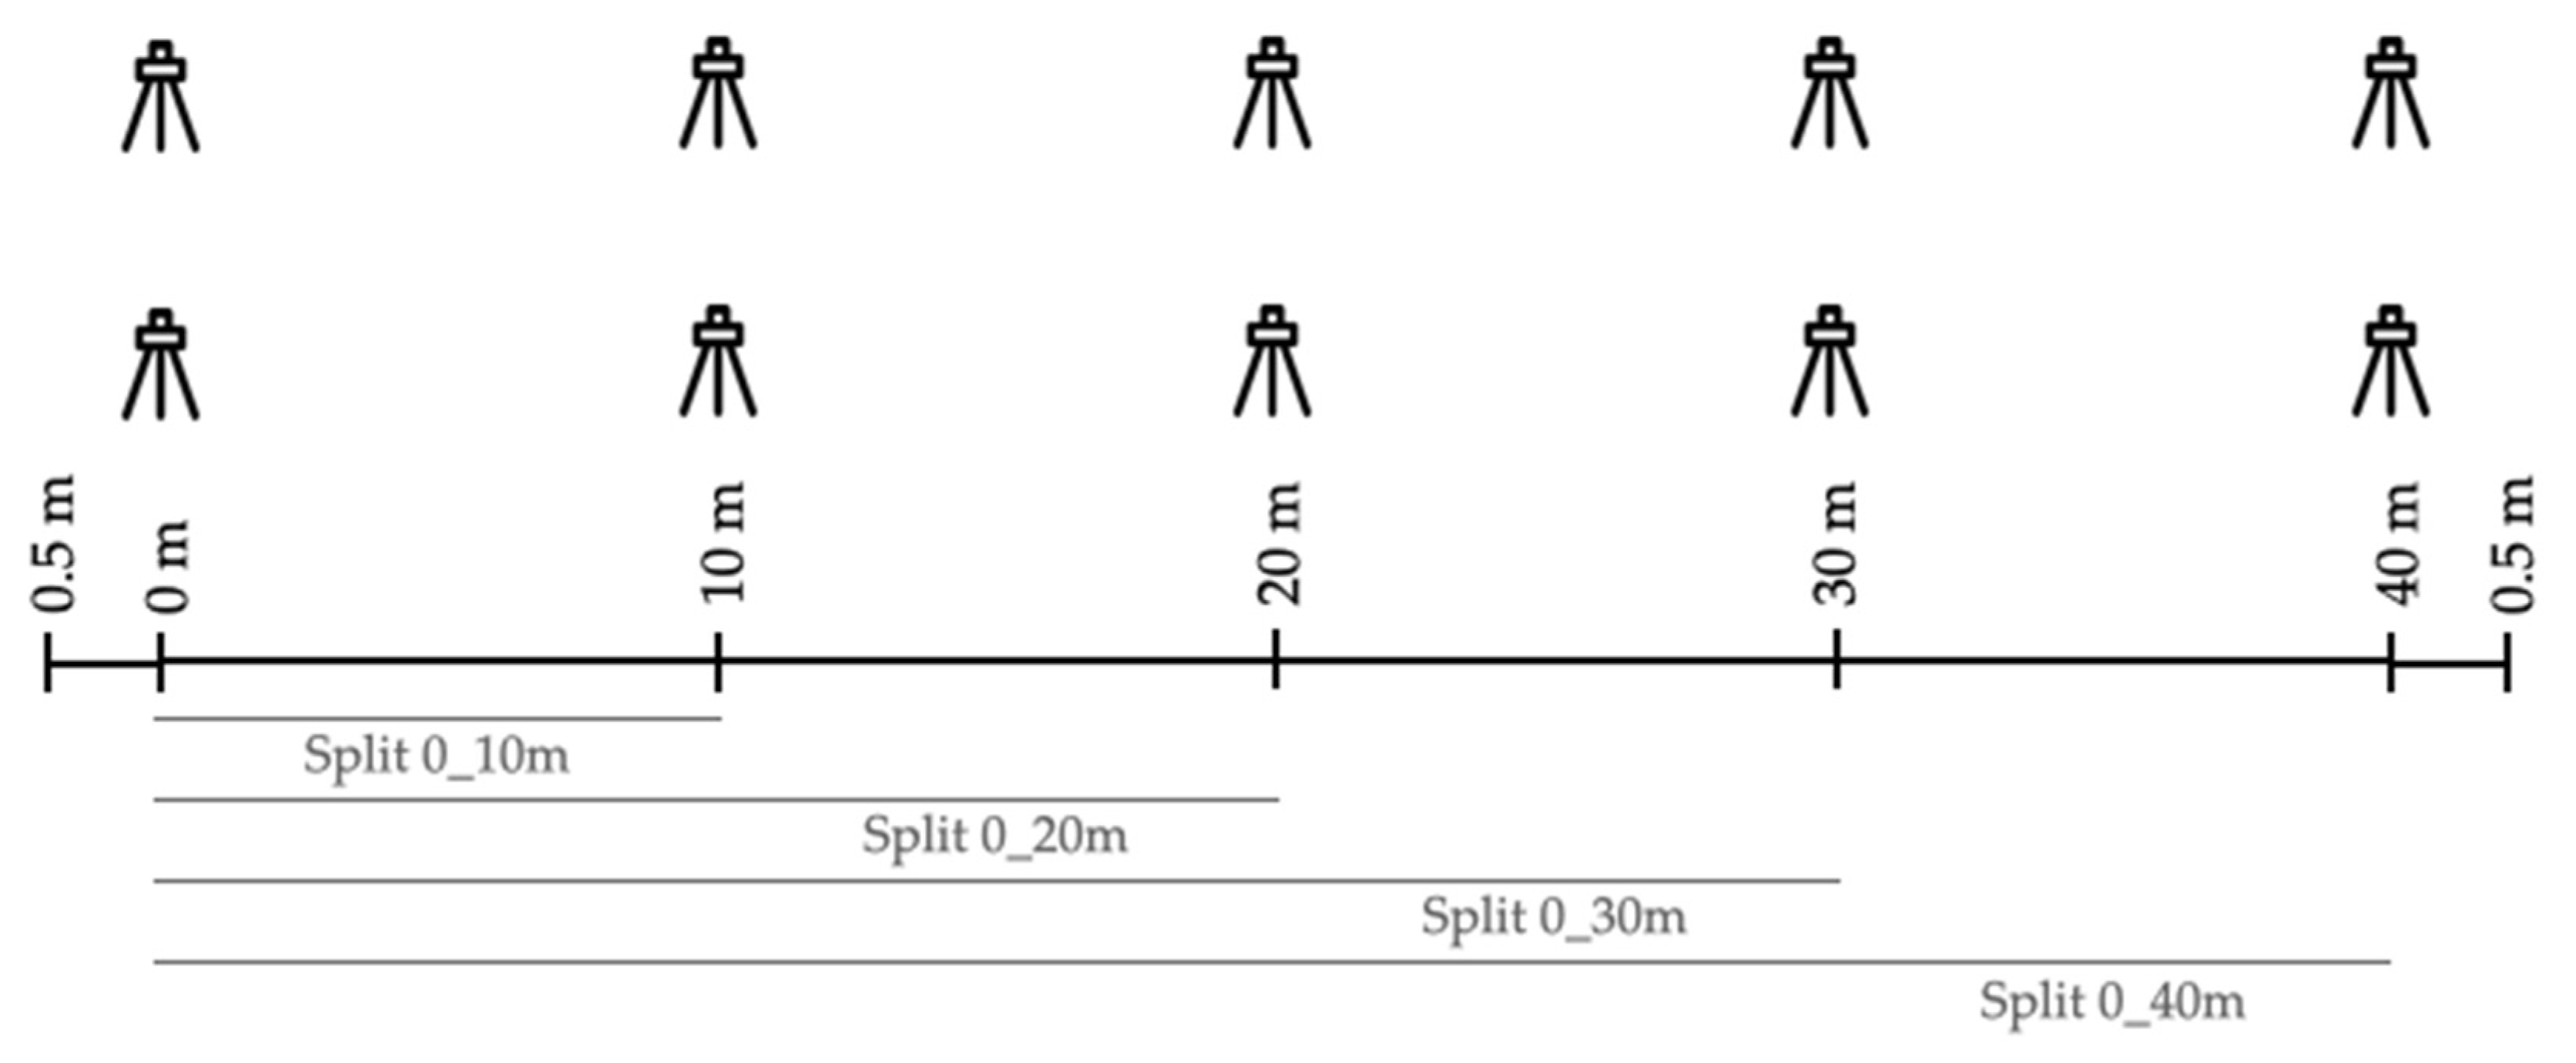
2.3.3. RSA Test
2.4. Statistical Analysis
3. Results
3.1. Hamstring Test
3.2. CMJ Test
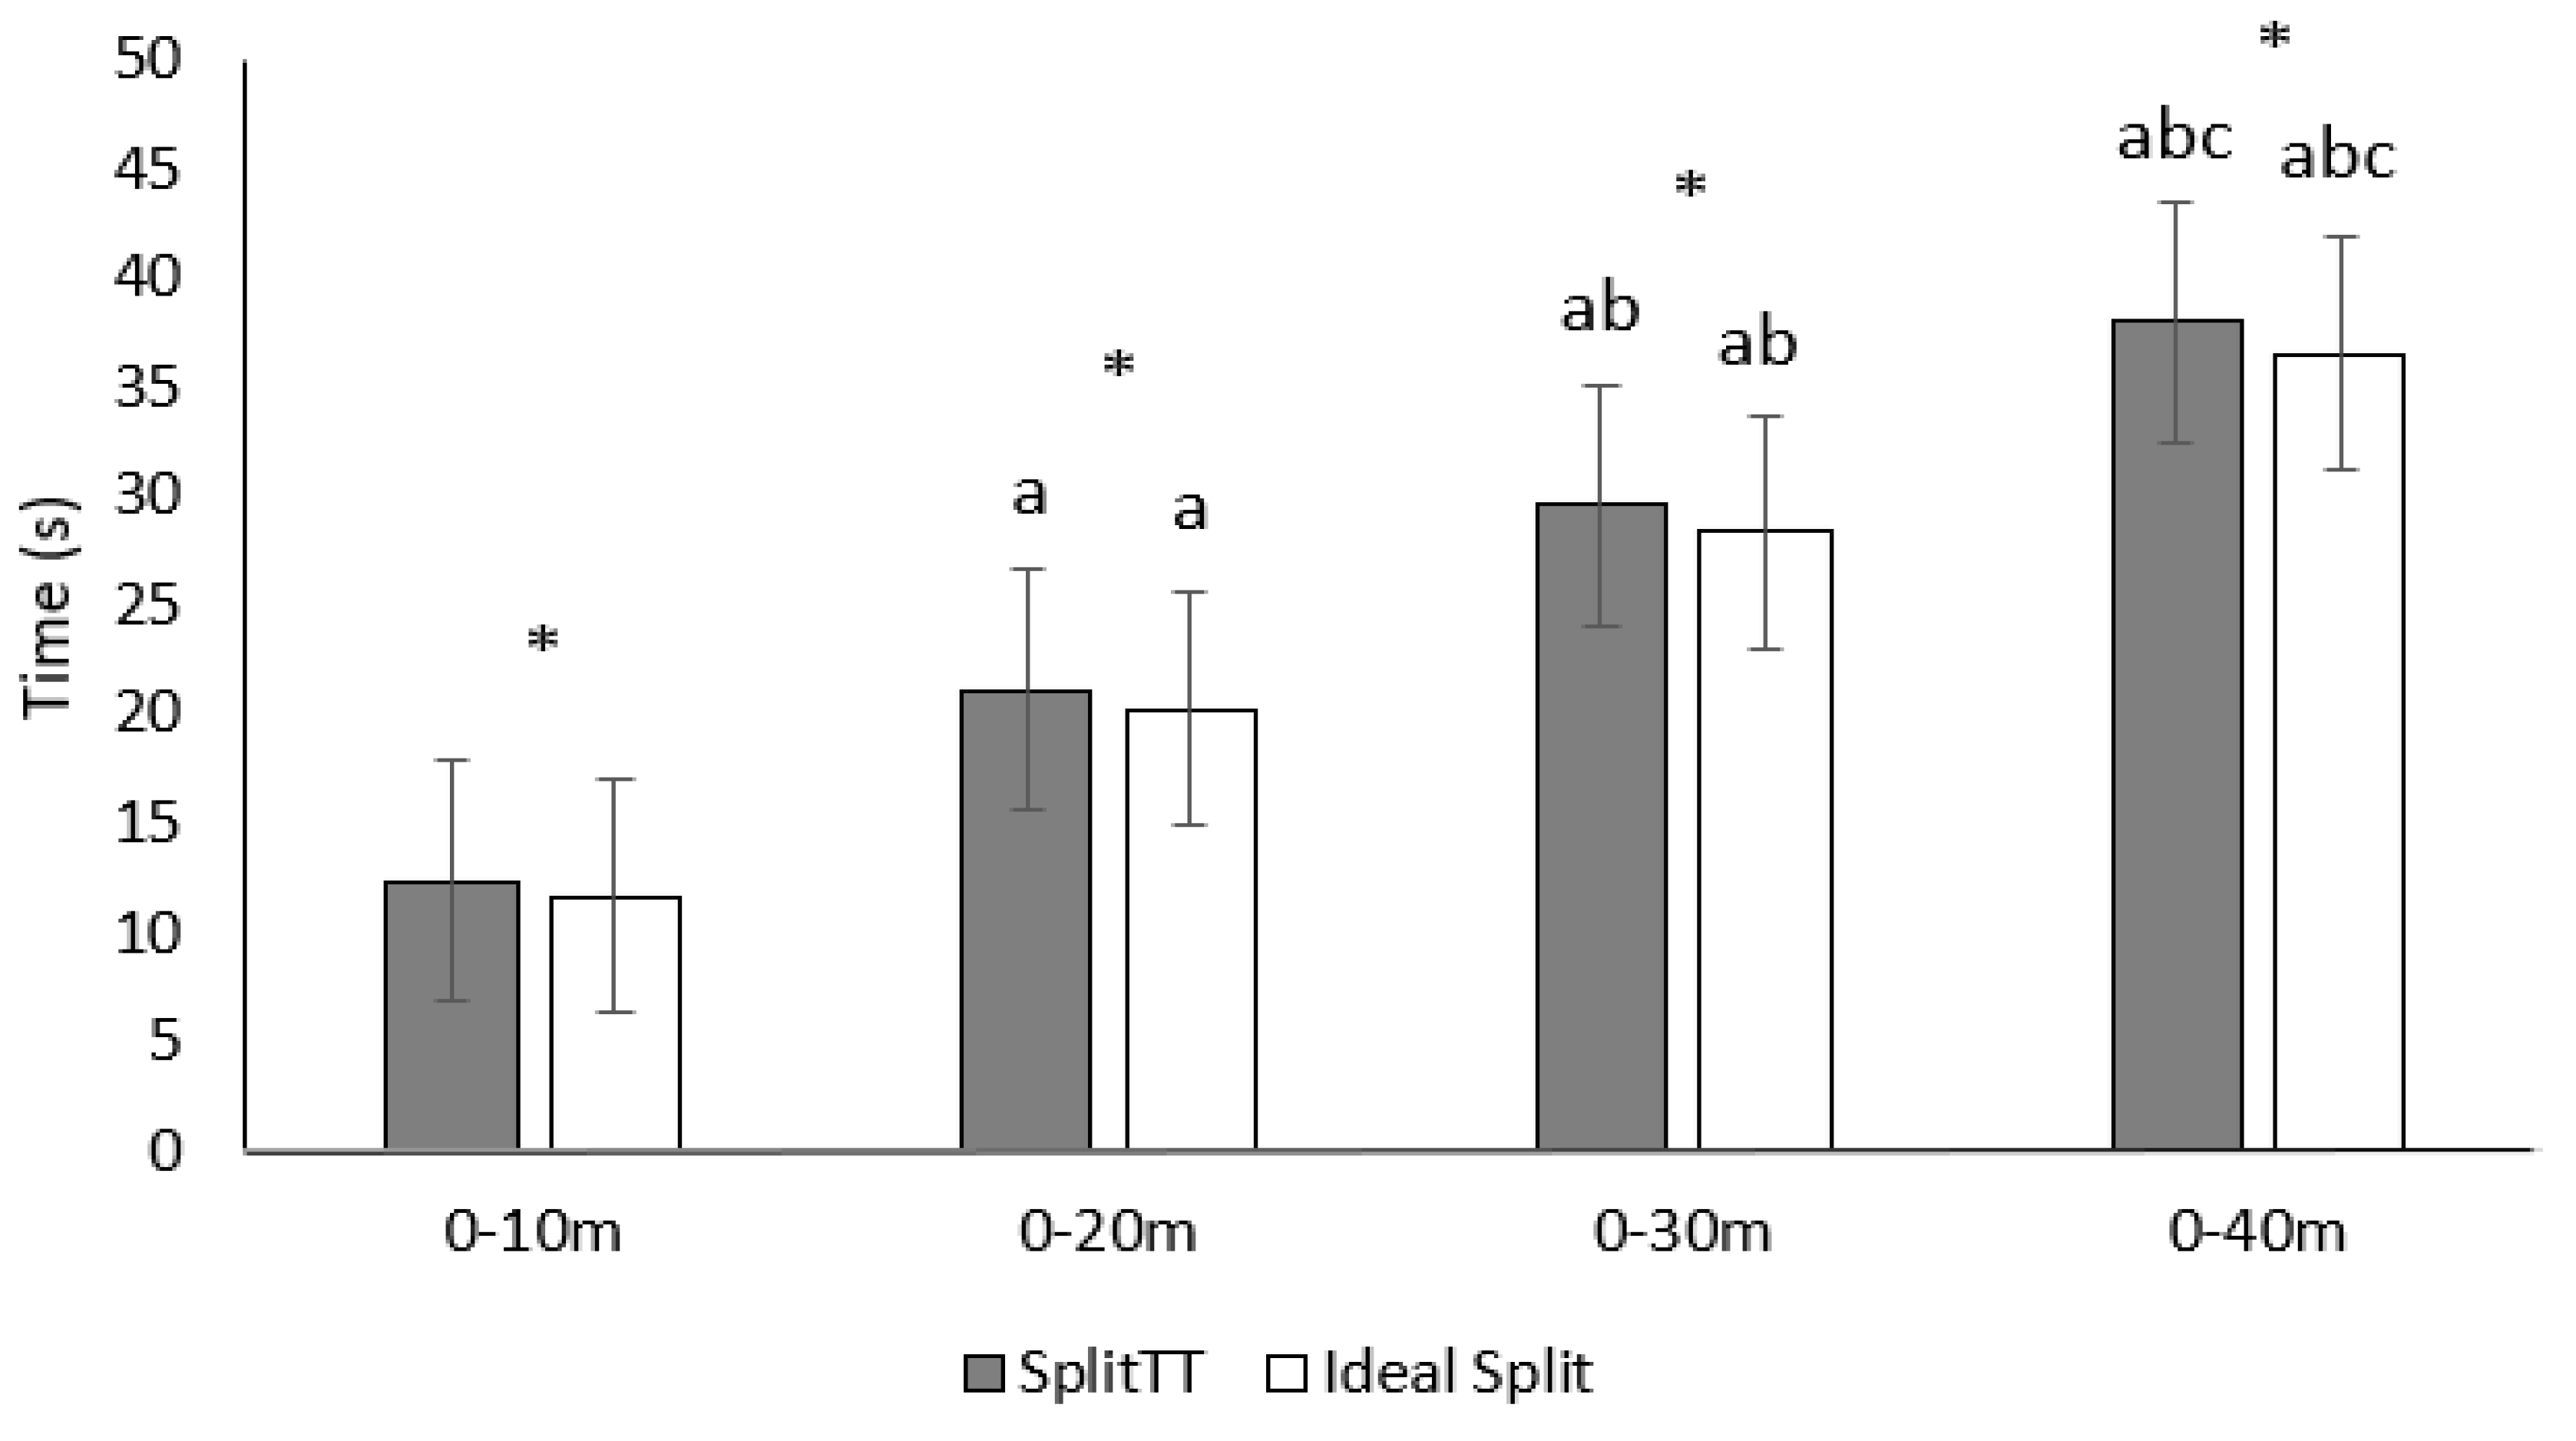
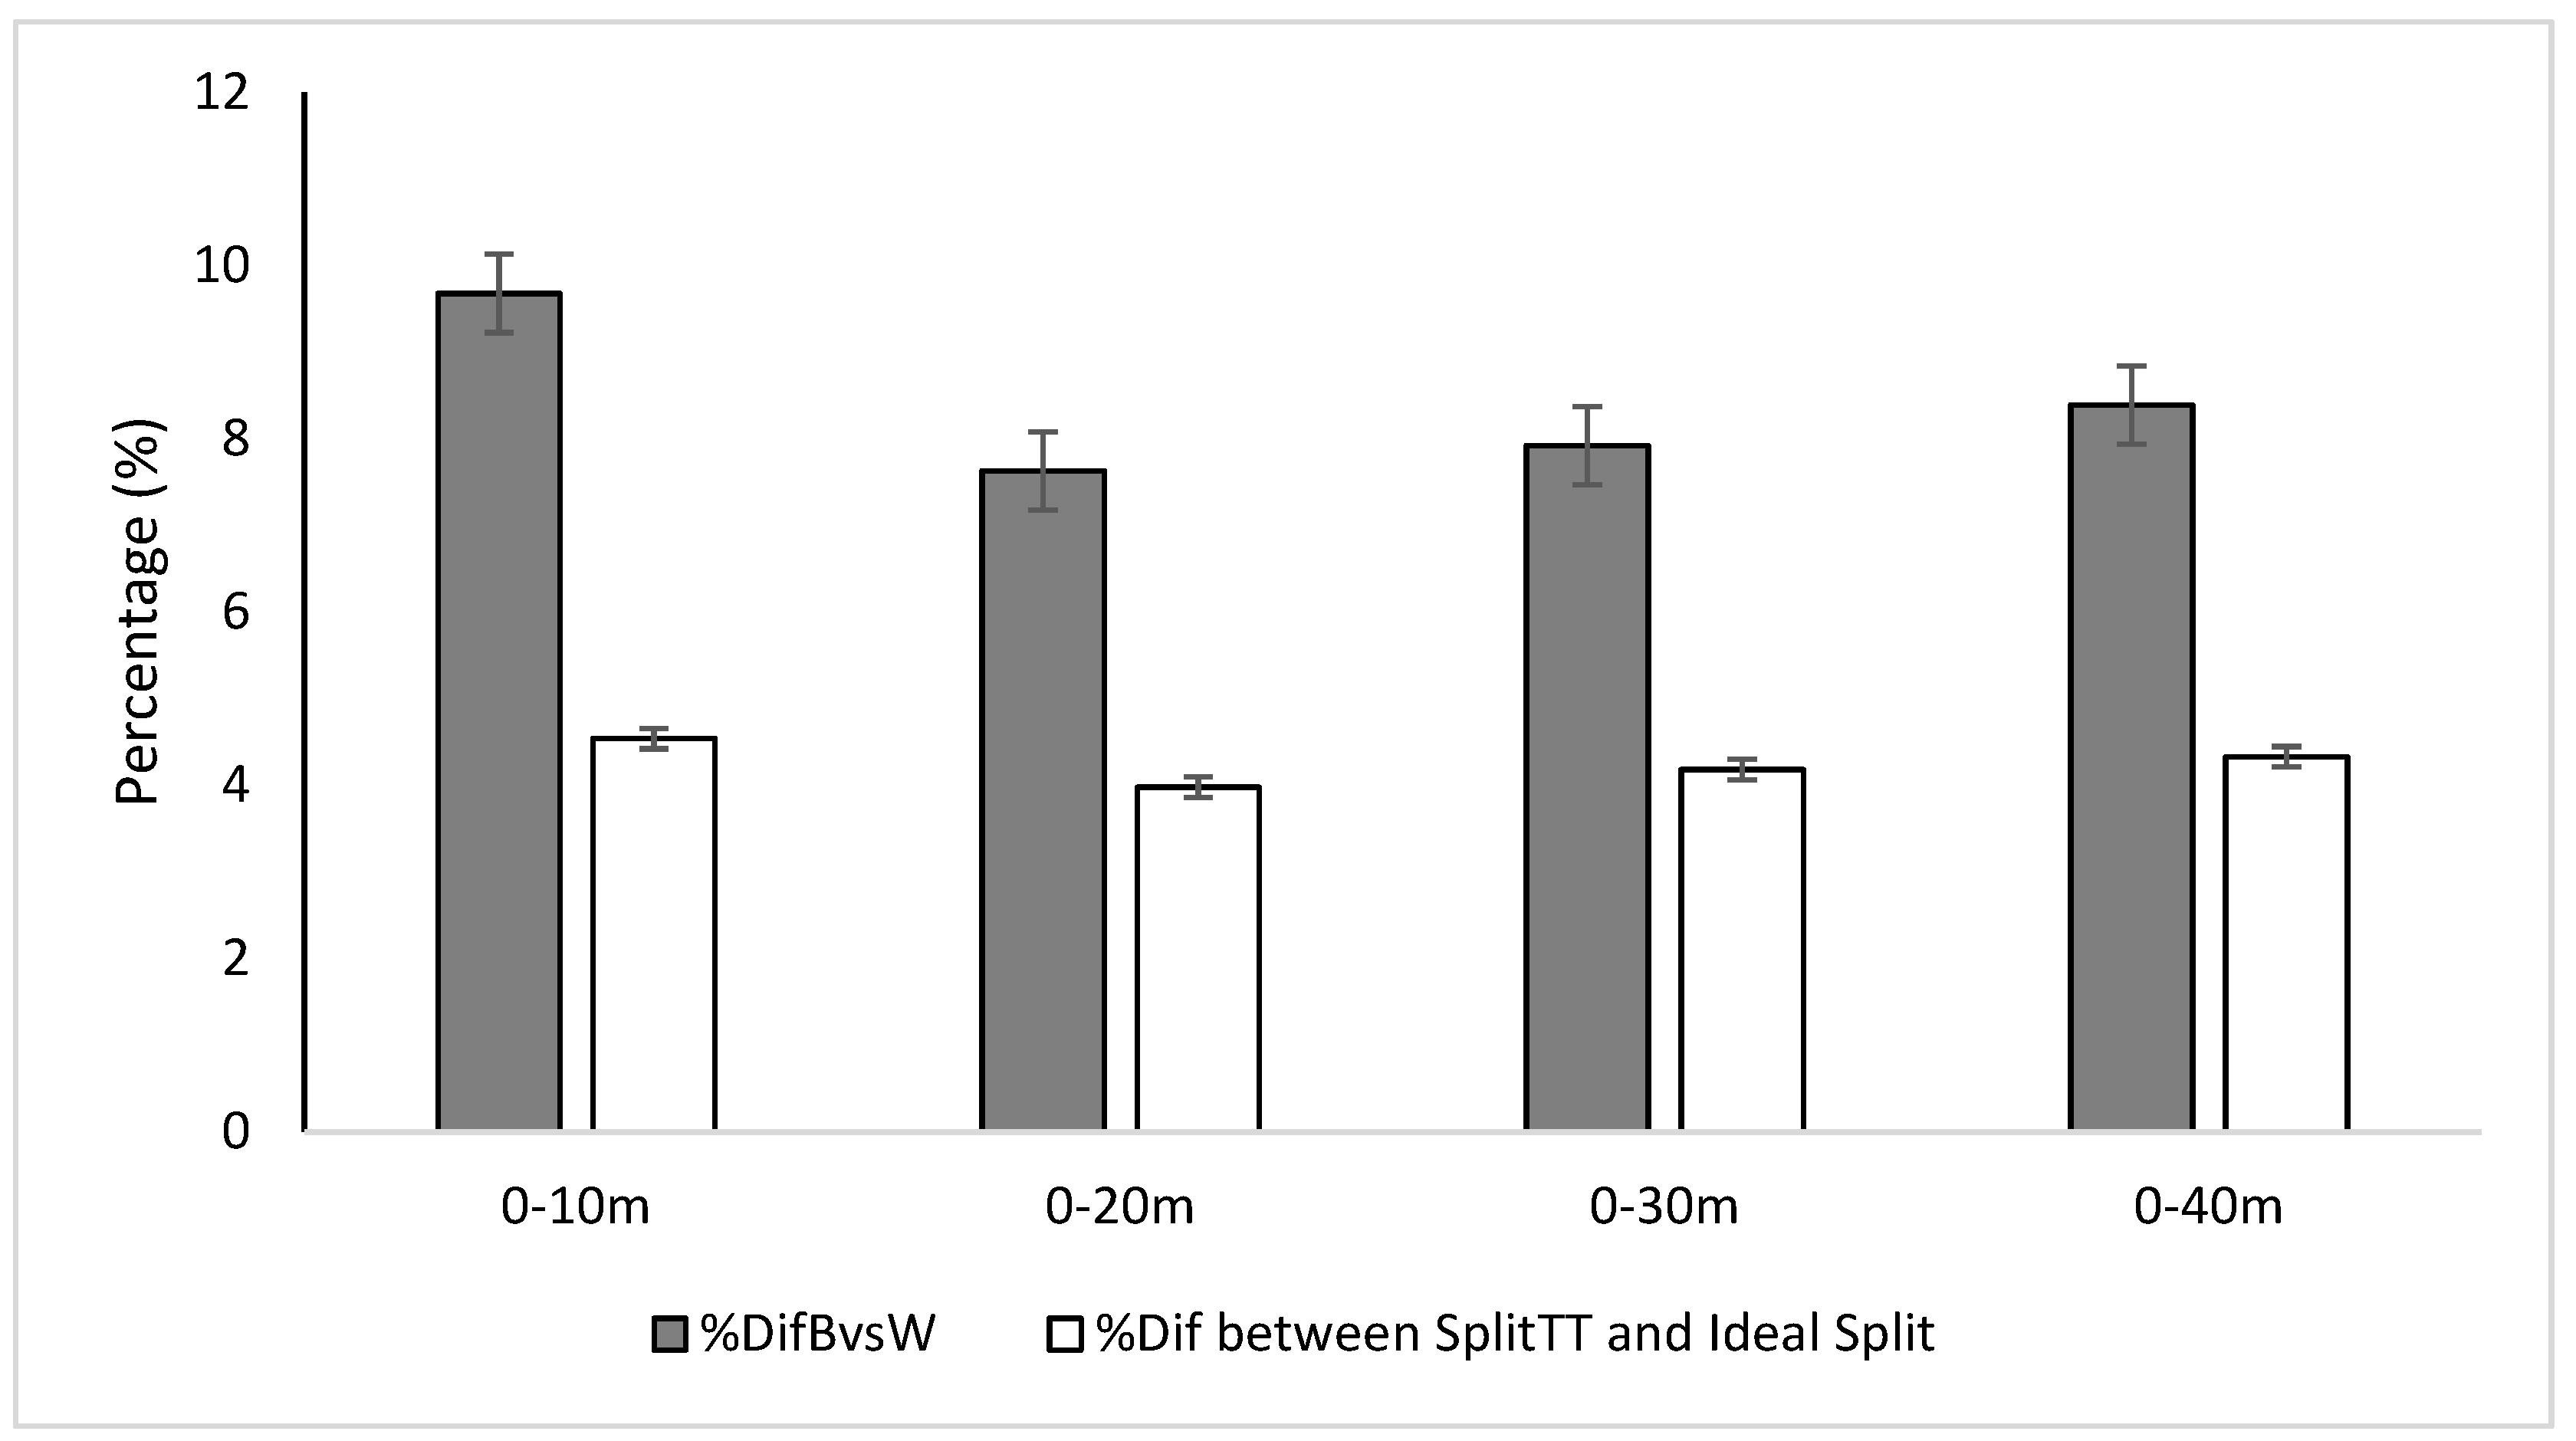
3.3. RSA Test
4. Discussion
5. Conclusions
6. Practical Applications
Author Contributions
Funding
Institutional Review Board Statement
Informed Consent Statement
Acknowledgments
Conflicts of Interest
References
- Ingebrigtsen, J.; Dalen, T.; Hjelde, G.H.; Drust, B.; Wisløff, U. Acceleration and sprint profiles of a professional elite football team in match play. Eur. J. Sport Sci. 2015, 15, 101–110. [Google Scholar] [CrossRef]
- Haugen, T.A.; Breitschädel, F.; Seiler, S. Sprint mechanical properties in soccer players according to playing standard, position, age and sex. J. Sports Sci. 2020, 38, 1070–1076. [Google Scholar] [CrossRef]
- Faude, O.; Koch, T.; Meyer, T. Straight sprinting is the most frequent action in goal situations in professional football. J. Sports Sci. 2012, 30, 625–631. [Google Scholar] [CrossRef]
- Morin, J.B.; Gimenez, P.; Edouard, P.; Arnal, P.; Jiménez-Reyes, P.; Samozino, P.; Brughelli, M.; Mendiguchia, J. Sprint acceleration mechanics: The major role of hamstrings in horizontal force production. Front. Physiol. 2015, 6, 404. [Google Scholar] [CrossRef]
- Small, K.; McNaughton, L.R.; Greig, M.; Lohkamp, M.; Lovell, R. Soccer fatigue, sprinting and hamstring strain injury risk. Int. J. Sports Med. 2009, 30, 573–578. [Google Scholar] [CrossRef]
- Bishop, D.J.; Spencer, M. Determinants of repeated-sprint ability in well-trained team-sport athletes and endurance-trained athletes. J. Sports Med. Phys. Fit. 2004, 44, 1–7. [Google Scholar] [PubMed]
- Dawson, B.; Goodman, C.; Lawrence, S.; Preen, D.; Polglaze, T.; Fitzsimons, M.; Fournier, P. Muscle phosphocreatine repletion following single and repeated short sprint efforts. Scand. J. Med. Sci. Sports 1997, 7, 206–213. [Google Scholar] [CrossRef]
- Copland, S.T.; Tipton, J.S.; Fields, K.B. Evidence-based treatment of hamstring tears. Curr. Sports Med. Rep. 2009, 8, 308–314. [Google Scholar] [CrossRef]
- Prior, M.; Guerin, M.; Grimmer, K. An evidence-based approach to hamstring strain injury: A systematic review of the literature. Sports Health. 2009, 1, 154–164. [Google Scholar] [CrossRef]
- Worrell, T.W. Factors associated with hamstring injuries: An approach to treatment and preventative measures. Sports Med. 1994, 17, 338–345. [Google Scholar] [CrossRef]
- Padulo, J.; Attene, G.; Ardigò, L.P.; Bragazzi, N.L.; Maffulli, N.; Zagatto, A.M.; dello Iacono, A. Can a Repeated Sprint Ability Test Help Clear a Previously Injured Soccer Player for Fully Functional Return to Activity? A Pilot Study. Clin. J. Sport Med. 2017, 27, 361–368. [Google Scholar] [CrossRef]
- Woods, C.; Hawkins, R.D.; Maltby, S.; Hulse, M.; Thomas, A.; Hodson, A. The Football Association Medical Research Programme: An audit of injuries in professional football—Analysis of hamstring injuries. Br. J. Sports Med. 2004, 38, 36–41. [Google Scholar] [CrossRef]
- Ekstrand, J.; Hägglund, M.; Waldén, M. Injury incidence and injury patterns in professional football: The UEFA injury study. Br. J. Sports Med. 2011, 45, 553–558. [Google Scholar] [CrossRef]
- Small, K.; McNaughton, L.; Greig, M.; Lovell, R. Effect of timing of eccentric hamstring strengthening exercises during soccer training: Implications for muscle fatigability. J. Strength Cond. Res. 2009, 23, 1077–1083. [Google Scholar] [CrossRef]
- Croisier, J.L.; Ganteaume, S.; Binet, J.; Genty, M.; Ferret, J.M. Strength imbalances and prevention of hamstring strain injury in professional soccer players: A prospective study. Am. J. Sports Med. 2008, 36, 1469–1475. [Google Scholar] [CrossRef]
- Cabello, E.N.; Hernández, D.C.; Márquez, G.T.; González, C.G.; Navander, A.; González, S.V. A review of risk factors for hamstring strain injury in soccer: A biomechanical approach. Eur. J. Hum. Mov. 2015, 34, 52–74. [Google Scholar]
- Hauge Engebretsen, A.; Myklebust, G.; Holme, I.; Engebretsen, L.; Bahr, R. Intrinsic risk factors for hamstring injuries among male soccer players: A prospective cohort study. Am. J. Sports Med. 2010, 38, 1147–1153. [Google Scholar] [CrossRef]
- McCall, A.; Carling, C.; Davison, M.; Nedelec, M.; Le Gall, F.; Berthoin, S.; Dupont, G. Injury risk factors, screening tests and preventative strategies: A systematic review of the evidence that underpins the perceptions and practices of 44 football (soccer) teams from various premier leagues. Br. J. Sports Med. 2015, 49, 583–589. [Google Scholar] [CrossRef]
- Cameron, M.; Adams, R.; Maher, C. Motor control and strength as predictors of hamstring strain injury in elite players of Australian football. Phys. Ther. Sport 2003, 4, 159–166. [Google Scholar] [CrossRef]
- Greco, C.C.; da Silva, W.L.; Camarda, S.R.A.; Denadai, B.S. Fatigue and rapid hamstring/quadriceps force capacity in professional soccer players. Clin. Physiol. Funct. Imaging 2013, 33, 18–23. [Google Scholar] [CrossRef]
- Nandlall, N.; Rivaz, H.; Rizk, A.; Frenette, S.; Boily, M.; Fortin, M. The effect of low back pain and lower limb injury on lumbar multifidus muscle morphology and function in university soccer players. BMC Musculoskelet. Disord. 2020, 21, 96. [Google Scholar] [CrossRef]
- Silva, R.S.; Nakagawa, T.H.; Ferreira, A.L.G.; Garcia, L.C.; Santos, J.E.M.; Serrão, F.V. Lower limb strength and flexibility in athletes with and without patellar tendinopathy. Phys. Ther. Sport 2016, 20, 19–25. [Google Scholar] [CrossRef] [PubMed]
- Askling, C.M.; Nilsson, J.; Thorstensson, A. A new hamstring test to complement the common clinical examination before return to sport after injury. Knee Surg. Sports Traumatol. Arthrosc. 2010, 18, 1798–1803. [Google Scholar] [CrossRef] [PubMed]
- Claudino, J.G.; Cronin, J.; Mezêncio, B.; McMaster, D.T.; McGuigan, M.; Tricoli, V.; Amadio, A.C.; Serrao, J.C. The countermovement jump to monitor neuromuscular status: A meta-analysis. Sci. Med. Sport 2017, 20, 397–402. [Google Scholar] [CrossRef] [PubMed]
- Jiménez-Reyes, P.; Pareja-Blanco, F.; Cuadrado-Peñafiel, V.; Ortega-Becerra, M.; Párraga, J.; González-Badillo, J.J. Jump height loss as an indicator of fatigue during sprint training. J. Sports Sci. 2019, 37, 1029–1037. [Google Scholar] [CrossRef]
- Armada-Cortés, E.; Benítez-Muñoz, J.A.; Sánchez-Sánchez, J.; San Juan, A.F. Evaluation of Neuromuscular Fatigue According to Injury History in a Repeat Sprint Ability Test, Countermovement Jump and Hamstring Test in Elite Female Soccer Players. Appl. Sci. 2022, 12, 2970. [Google Scholar] [CrossRef]
- Bishop, D.; Girard, O.; Mendez-Villanueva, A. Repeated-sprint ability—Part II. Sports Med. 2011, 41, 741–756. [Google Scholar] [CrossRef]
- Drust, B.; Waterhouse, J.; Atkinson, G.; Edwards, B.; Reilly, T. Circadian rhythms in sports performance—An update. Chronobiol. Int. 2005, 22, 21–44. [Google Scholar] [CrossRef]
- Di Cagno, A.; Baldari, C.; Battaglia, C.; Monteiro, M.D.; Pappalardo, A.; Piazza, M.; Guidetti, L. Factors influencing performance of competitive and amateur rhythmic gymnastics—Gender differences. J. Sci. Med. Sport 2009, 12, 411–416. [Google Scholar] [CrossRef]
- Muyor, J.M. Validity and reliability of a new device (WIMU®) for measuring hamstring muscle extensibility. Int. J. Sports Med. 2017, 38, 691–695. [Google Scholar] [CrossRef]
- Bosco, C. La Fuerza Muscular. Aspectos Metodológicos; INO Reproducciones, S.A.: Barcelona, Spain, 2000; pp. 75–80. [Google Scholar]
- Jiménez-Reyes, P.; Cuadrado-Peñafiel, V.; González-Badillo, J. Analysis of variables measured in vertical jump related to athletic performance and its application to training. Cult. Cienc. Y Deporte. 2011, 6, 113–119. [Google Scholar] [CrossRef]
- Glatthorn, J.F.; Gouge, S.; Nussbaumer, S.; Stauffacher, S.; Impellizzeri, F.M.; Maffiuletti, N.A. Validity and reliability of Optojump photoelectric cells for estimating vertical jump height. J. Strength Cond. Res. 2011, 25, 556–560. [Google Scholar] [CrossRef] [PubMed]
- Henderson, G.; Barnes, C.A.; Portas, M.D. Factors associated with increased propensity for hamstring strain injury in English Premier League soccer players. J. Sci. Med. Sport 2010, 13, 397–402. [Google Scholar] [CrossRef] [PubMed]
- Witvrouw, E.; Danneels, L.; Asselman, P.; D’Have, T.; Cambier, D. Muscle flexibility as a risk factor for developing muscle injuries in male professional soccer players: A prospective study. Am. J. Sports Med. 2003, 31, 41–46. [Google Scholar] [CrossRef] [PubMed]
- Chaouachi, A.; Manzi, V.; Wong, D.P.; Chaalali, A.; Laurencelle, L.; Chamari, K.; Castagna, C. Intermittent endurance and repeated sprint ability in soccer players. J. Strength Cond. Res. 2010, 24, 2663–2669. [Google Scholar] [CrossRef] [PubMed]
- Opar, D.A.; Williams, M.D.; Shield, A.J. Hamstring strain injuries: Factors that lead to injury and re-injury. Sports Med. 2012, 42, 209–226. [Google Scholar] [CrossRef]
- Hojat, M.; Xu, G. A visitor’s guide to effect sizes: Statistical significance versus practical (clinical) importance of research findings. Adv. Health Sci. Educ. Theory Pract. 2004, 9, 241–249. [Google Scholar] [CrossRef]
- Cohen, J. Statistical Power Analysis for the Behavioral Science Second Edition; Lawrence Erlbaum Associates, Publishers: New York, NY, USA, 1988; ISBN 0-8058-0283-5. [Google Scholar]
- Hader, K.; Rumpf, M.C.; Hertzog, M.; Kilduff, L.P.; Girard, O.; Silva, J.R. Monitoring the Athlete Match Response: Can External Load Variables Predict Post-match Acute and Residual Fatigue in Soccer? A Systematic Review with Meta-analysis. Sports Med. Open. 2019, 5, 48. [Google Scholar] [CrossRef]
- Goulart, K.N.O.; Coimbra, C.C.; Campos, H.O.; Drummond, L.R.; Ogando, P.H.M.; Brown, G.; Couto, B.P.; Duffield, R.; Wanner, S.P. Fatigue and Recovery Time Course After Female Soccer Matches: A Systematic Review and Meta-analysis. Sports Med. Open. 2022, 8, 2. [Google Scholar] [CrossRef]
- Doeven, S.H.; Brink, M.S.; Kosse, S.J.; Lemmink, K.A.P.M. Postmatch recovery of physical performance and biochemical markers in team ball sports: A systematic review. BMJ Open Sport Exerc. Med. 2018, 4, 264. [Google Scholar] [CrossRef]
- San Juan, A.F.; López-Samanes, Á.; Jodra, P.; Valenzuela, P.L.; Rueda, J.; Veiga-Herreros, P.; Pérez-López, A.; Domínguez, R. Caffeine Supplementation Improves Anaerobic Performance and Neuromuscular Efficiency and Fatigue in Olympic-Level Boxers. Nutrients 2019, 11, 2120. [Google Scholar] [CrossRef] [PubMed]
- Esola, M.; McClure, P.W.; Fitzgerald, G.K.; Siegler, S. Analysis of lumbar spine and hip motion during forward bending in subjects with and without a history of low back pain. Spine 1996, 21, 71–78. [Google Scholar] [CrossRef] [PubMed]
- Goodnite, E.A. Strength around the hip and flexibility of soft tissues in individuals with and without patellofemoral pain syndrome. J. Orthop. Sports Phys. Ther. 2005, 35, 793–801. [Google Scholar] [CrossRef]
- Russell, M.; Sparkes, W.; Northeast, J.; Cook, C.J.; Love, T.D.; Bracken, R.M.; Kilduff, L.P. Changes in acceleration and deceleration capacity throughout professional soccer match-play. J. Strength Cond. Res. 2016, 30, 2839–2844. [Google Scholar] [CrossRef] [PubMed]


| Sprint Total Time (SprintTT) | Defined as the Time to Run a Specific Distance of the Sprint | |
|---|---|---|
| Ideal Sprint [37] | Defined as the SprintTT if all the sprints were run as the best of them. | Where X is the number of a specific sprint |
| Split Total Time (SplitTT) [37] | Defined as the time spent to complete a specific distance during the six sprints. | Where X is the distance of a specific split |
| Ideal Split [37] | Defined as the SplitTT if all the splits were run as the best of them. | Where X is the distance of a specific split |
| Percentage difference 1 vs. X (%Dif1vsX). | Defined as percentage difference between the first sprint and another specific sprint. | Where X is the number of a specific sprint |
| Percentage difference between SprintTT 0–40 m and Ideal Sprint [27]. | Defined as percentage difference between the time to run a specific number of sprints and the time if these sprints were run as the best of them. | Where X is the number of a specific sprint |
| Percentage difference between the best time vs. worst time of a split (%DifBvsW) [27]. | Percentage difference between the best time compared to the worst time to run a split. | Where X is the distance of a specific split |
| Percentage difference between SplitTT and Ideal Split (modified from [27]). | Percentage difference between the time to run a specific number of splits and the time if these splits were run as the best of them. | Where X is the distance of a specific split |
| CMJ | PRE | POST | ||||
|---|---|---|---|---|---|---|
| Height (cm) | 27.56 ± 5.09 | 25.56 ± 5.01 * | ||||
| Hamstring test | R | L | Avg | R | L | Avg |
| ROMmax (deg) | 91.19 ± 13.7 | 89.2 ± 14.6 | 90.25 ± 13.43 | 87.55 ± 13.07 * | 91.41 ± 17.12 # | 89.5 ± 14.7 |
| Vmax (deg/s) | 430.49 ± 98.82 | 365.9 ± 48.32 # | 398.36 ± 64.99 | 417.9 ± 76.86 | 383.83 ± 55.59 *# | 406.64 ± 67.21 |
| Vavg (deg/s) | 256.91 ± 49.51 | 238.29 ± 39.13 # | 248.33 ± 42.14 | 264.52 ± 42.99 | 247.62 ± 51.38 | 256.07 ± 40.48 |
| T to Vmax (ms) | 98.13 ± 54.35 | 123.71 ± 57.84 # | 109.73 ± 49.72 | 86.7 ± 50.03 | 113.07 ± 59.11 | 106.14 ± 57.69 |
| ROM at Vmax (deg) | 38.79 ± 13.2 | 42.17 ± 14.63 | 40.50 ± 12.78 | 35.39 ± 13.59 | 42.29 ± 15.09 | 38.84 ± 11.55 |
| Sprint 1 | Sprint 2 | Sprint 3 | Sprint 4 | Sprint 5 | Sprint 6 | |
|---|---|---|---|---|---|---|
| SprintTT 0−10 m | 2 ± 0.12 | 2.05 ± 0.14 1 | 2.03 ± 0.14 | 2.1 ± 0.14 1,2,3 | 2.09 ± 0.14 1 | 2.1 ± 0.14 1 |
| SprintTT 0−20 m | 3.41 ± 0.17 | 3.5 ± 0.19 1 | 3.48 ± 0.21 1 | 3.57 ± 0.2 1,2,3 | 3.57 ± 0.2 1,3 | 3.58 ± 0.25 1 |
| SprintTT 0−30 m | 4.76 ± 0.23 | 4.87 ± 0.25 1 | 4.87 ± 0.29 1 | 5 ± 0.29 1,2,3 | 5 ± 0.29 1,2,3 | 5.04 ± 0.31 1,2,3 |
| SprintTT 0−40 m | 6.13 ± 0.31 | 6.29 ± 0.34 1 | 6.31 ± 0.4 1 | 6.47 ± 0.37 1,2,3 | 6.5 ± 0.39 1,2,3 | 6.6 ± 0.4 1,2,3,4 |
| Sprint 1 vs. 2 | Sprint 1 vs. 3 | Sprint 1 vs. 4 | Sprint 1 vs. 5 | Sprint 1 vs. 6 | ||
| %Dif | 2.64 ± 1.47 | 3.05 ± 2.45 | 5.61 ± 2.58 a,b | 5.398 ± 3.64 a,b | 7.73 ± 4.7 a,b,d | |
| Sprint 1−2 | Sprint 1−3 | Sprint 1−4 | Sprint 1−5 | Sprint 1−6 | ||
| %Dif between SprintTT 0–40 m and Ideal Sprint | 1.32 ± 0.74 | 2.03 ± 0.91 a | 2.96 ± 1.2 a,b | 3.59 ± 1.55 a,b,c | 4.33 ± 1.9 a,b,c,d |
Publisher’s Note: MDPI stays neutral with regard to jurisdictional claims in published maps and institutional affiliations. |
© 2022 by the authors. Licensee MDPI, Basel, Switzerland. This article is an open access article distributed under the terms and conditions of the Creative Commons Attribution (CC BY) license (https://creativecommons.org/licenses/by/4.0/).
Share and Cite
Armada-Cortés, E.; Benítez-Muñoz, J.A.; San Juan, A.F.; Sánchez-Sánchez, J. Evaluation of Neuromuscular Fatigue in a Repeat Sprint Ability, Countermovement Jump and Hamstring Test in Elite Female Soccer Players. Int. J. Environ. Res. Public Health 2022, 19, 15069. https://doi.org/10.3390/ijerph192215069
Armada-Cortés E, Benítez-Muñoz JA, San Juan AF, Sánchez-Sánchez J. Evaluation of Neuromuscular Fatigue in a Repeat Sprint Ability, Countermovement Jump and Hamstring Test in Elite Female Soccer Players. International Journal of Environmental Research and Public Health. 2022; 19(22):15069. https://doi.org/10.3390/ijerph192215069
Chicago/Turabian StyleArmada-Cortés, Estrella, José A. Benítez-Muñoz, Alejandro F. San Juan, and Javier Sánchez-Sánchez. 2022. "Evaluation of Neuromuscular Fatigue in a Repeat Sprint Ability, Countermovement Jump and Hamstring Test in Elite Female Soccer Players" International Journal of Environmental Research and Public Health 19, no. 22: 15069. https://doi.org/10.3390/ijerph192215069
APA StyleArmada-Cortés, E., Benítez-Muñoz, J. A., San Juan, A. F., & Sánchez-Sánchez, J. (2022). Evaluation of Neuromuscular Fatigue in a Repeat Sprint Ability, Countermovement Jump and Hamstring Test in Elite Female Soccer Players. International Journal of Environmental Research and Public Health, 19(22), 15069. https://doi.org/10.3390/ijerph192215069