Article

Co-Benefit Assessment of Active Transportation in Delhi, Estimating the Willingness to Use Nonmotorized Mode and Near-Roadway-Avoided PM2.5 Exposure

by
Tavoos Hassan Bhat
1,
Hooman Farzaneh
1,2,* and
Nishat Tasnim Toosty
1,3
1
Interdisciplinary Graduate School of Engineering Sciences, Kyushu University, Fukuoka 816-8580, Japan
2
Transdisciplinary Research and Education Center for Green Technologies, Kyushu University, Fukuoka 816-8580, Japan
3
Department of Statistics, University of Dhaka, Dhaka 1000, Bangladesh
*
Author to whom correspondence should be addressed.
Int. J. Environ. Res. Public Health 2022, 19(22), 14974; https://doi.org/10.3390/ijerph192214974
Submission received: 18 October 2022 / Revised: 10 November 2022 / Accepted: 11 November 2022 / Published: 14 November 2022
(This article belongs to the Special Issue 2nd Edition: Occupational & Environmental Health Risk Assessment)

Abstract

:
This study aims to estimate the avoided mortalities and morbidities and related economic impacts due to adopting the nonmotorized transportation (NMT) policy in Delhi, India. To this aim, an integrated quantitative assessment framework is developed to estimate the expected environmental, health, and economic co-benefits from replacing personal motorized transport with NMT in Delhi, taking into account the inhabitants’ willingness to use NMT (walking and cycling) mode. The willingness to accept NMT is estimated by conducting a cross-sectional survey in Delhi, which is further used to estimate the expected health benefits from both increased physical activity and near-roadway-avoided PM2.5 exposure in selected traffic areas in 11 major districts in Delhi. The value of a statistical life (VSL) and cost of illness methods are used to calculate the economic benefits of the avoided mortalities and morbidities from NMT in Delhi. The willingness assessment indicates that the average per capita time spent walking and cycling in Delhi is 11.054 and 2.255 min, respectively. The results from the application of the NMT in Delhi show the annual reduction in CO2 and PM2.5 to be 121.5 kilotons and 138.9 tons, respectively. The model estimates the expected co-benefits from increased physical activities and reduced PM2.5 exposure at 17,529 avoided cases of mortality with an associated savings of about USD 4870 million in Delhi.

1. Introduction

1.1. Physical Inactivity and Health Impacts

Physical inactivity and air pollution are two major public health issues currently being faced in India. Nonmotorized transport (NMT) especially walking and cycling, can reduce air pollution and physical inactivity, save lives, and lessen the effects of climate change. Physical inactivity is responsible for about 5 million annual deaths, while motorized transportation-related emissions are responsible for 74 thousand premature deaths, and Delhi has the highest transportation-related death rates among India’s major cities [1,2]. Sedentary lifestyles are one of the main factors increasing the risk of mortality from noncommunicable diseases (NCDs), as 71% of all deaths worldwide, 41 million per year, are caused by NCDs. Cardiovascular diseases (17.9 million), cancers (9.3 million), respiratory diseases (4.1 million), and diabetes (1.2 million) are major NCD-related mortalities each year [3]. Studies have shown that being physically inactive raises the risk of psychological disorders, colon cancer, breast cancer, type 2 diabetes, coronary heart disease, and musculoskeletal conditions by about 15% to 20% [4].
Physical activity (PA) has been shown in numerous studies to significantly reduce mortality. Being overweight, obesity, type 2 diabetes, coronary heart disease, depression, and fracture risk can all be decreased by PA. According to studies, sedentary lifestyles correspond to higher all-cause mortality [4]. About 1.6 million deaths have explicitly been linked to insufficient physical activity [3]. On a global scale, an increase in physical activity can prevent 3.9 million premature deaths, which equals 15% of all premature deaths [5]. It has been established that regular exercise can aid in preventing and treating NCDs, such as breast and colon cancer, diabetes, heart disease, and stroke. PA can also enhance mental health, quality of life, and well-being while preventing hypertension, obesity, and overweight [6,7,8]. Regardless of sex or age, PA is considered to have a preventative effect against depression and a beneficial impact on treating depression in nonclinical and clinical populations [9,10,11]. Walking for 30 min or bicycling for 20 min on most days lowers the mortality risk by at least 10%, also 10% reduction in the risk of cardiovascular disease and a 30% reduction in the risk of type 2 diabetes, as well as a 30% reduction in the mortality rate from cancer [12]. In India, 20% of the population is not active, and 37% is just moderately active, failing to meet the WHO physical activity guidelines, leading to the risk of developing various NCDs in a large portion of the Indian population [13]. The prevalence of NCDs in India, including breast and colon cancer, diabetes, coronary artery disease, and hypertension, are mainly related to physical inactivity [4]. Regular PA can help prevent and treat many NCDs [13].

1.2. Nonmotorized Transport in Delhi

The urban transportation system endangers human health through accidents, air pollution, and physical inactivity. Such health issues have demanded significant health impact analyses in order to facilitate the creation of walking and bicycling-friendly infrastructure to improve public health. India’s urbanization rate has led to substantial increases in the nation’s energy consumption, travel demand, and transportation-related emissions. Due to rising ambient air pollution in highly populated megacities such as Delhi, most Indian cities struggle to keep their inhabitants’ air livable. In the past three decades, Delhi’s population has grown by a factor of four, but the city’s motor vehicle population has increased by 28 [14]. There are currently more than 11.4 million registered automobiles in Delhi [15,16]. Transportation emissions have recently drawn much attention since many people are exposed to exhaust gases and other particles from moving vehicles. The contribution of transportation is believed to be as high as 45 percent in Delhi’s air pollution [17]. Private cars and two-wheelers make up most of the Delhi transportation sector’s emissions [18]. PM2.5 concentrations in Delhi vary throughout the day, with the highest levels during the evening rush hours and night [19]. The average contribution of the transportation sector to PM2.5 concentrations ranges from 17 to 28 percent, making it the main contributor to the city’s poor air quality [20]. Studies have indicated that the mortality burden of PM2.5 in Delhi can significantly decrease if exposure levels are reduced below the present levels [21]. Several sustainable national policies have been implemented to reduce transportation sector emissions and Delhi-specific pollution control measures [22]. However, Delhi’s air quality has not improved and has become a severe public health concern. Sustainable urban transportation policies may decrease ambient air pollution in New Delhi by putting it in place [23].
The commuters in Delhi are forced to use individualized modes of transportation due to the lack of a satisfactory alternative public transportation system [14]. As a result, the vast majority of adults were physically sedentary. The total physical activity in Delhi is estimated to be about 400.3 min per week for men and 265.3 min per week for women [4]. Being a low-emission and space-efficient mode of transportation, active transportation (mostly walking and bicycling) has grown in popularity in the transportation and environmental sectors in India. NMT or active transportation can provide both transportation (access to goods and activities) and recreation, while users may view a specific journey to serve both aims.

1.3. Co-Benefits of Nonmotorized and Active Transport

Co-benefits have been widely advocated in tandem with mitigation measures for greenhouse gas (GHG) reduction. Especially in developing nations such as India, where urbanization and climate change adaptation are all significant challenges, the health and economic co-benefits of nonmotorized transportation become particularly important [24]. Given its long-term benefits, NMT appears to be a feasible alternative to traditional fossil-fuel-based modes of public transportation in Indian cities. Walking and bicycling for transportation provide significant health benefits to users by increasing physical activity [25]. Benefits include improved accessibility, more affordable travel, less congestion, cheaper infrastructure costs for parking lots and roads, energy conservation, decreased air and noise pollution, and decreased accidents for other drivers [26]. Additionally, it is an affordable form of transportation for millions of people with low incomes, particularly in Delhi.
The quantification of the co-benefits from climate change mitigation in the transportation sector has been investigated in previous studies, introducing the A–S–I (avoid–shift–improve) approach, assessing not just the avoided local air pollution and carbon emissions but also the advantages of improved air quality and its influence on public health. The results indicated a considerable decrease in CO2 and other local air pollutant emissions by 12.9 and 1.4 million tonnes, respectively, the prevention of almost 10,000 mortality cases, and a savings of more than USD 35 million by 2030 [27]. Pathak et al. assessed the sustainable and low-carbon mobility in India and quantified co-benefits, using the scenario analysis method, under different scenarios, including fuel transition, decarbonized electricity, modal change, and travel demand substitution, indicating that low-carbon transportation measures can offer significant development co-benefits that include a 74% reduction in NOx and an 83% reduction in PM2.5 from the passenger transportation sector compared with BAU in 2035 [28].
A review of thirty health impact assessment studies from Europe, the United States, Australia, and New Zealand concluded that health benefits from increased PA outweighed the adverse effects of traffic accidents and exposure to air pollution by a large margin. It is estimated that an increase in the median daily walking and bicycling time from 4 to 22 min can reduce 14% of GHG emissions in California, which results in decreasing the corresponding burden of cardiovascular disease and diabetes and could avoid 32,466 disability-adjusted life years (DALYs) [29]. Increased physical activity and reduced local air pollution from vehicle emissions can save 122 lives and net savings of about USD 200 million annually in New Zealand [30]. A study in Adelaide, Australia [31], showed that increased cycling, public, and active transportation could reduce road traffic-related CO2 emissions annually, ranging from 191,313 to 954,503 million tons and 160 to 542 deaths. Therefore, 2113 to 7674 DALYs could be avoided due to improved air quality, increased physical activity, and avoided traffic injury. Another study conducted in six European cities has shown that increases in cycling and walking trips to 35% and 50% of total city trips, respectively, will cut GHG emissions in the six cities by 1139 to 26,423 metric tons per year, including varying degrees of health benefits [32]. A recent study has indicated cost savings of 15 billion euros per year in Europe for a 10% shift to active mobility modes [33].
As transportation-related emissions rise in Delhi, NMT is becoming increasingly popular among policymakers and environmentalists as a practical substitute for motorized transportation. Studies have addressed the significant impacts of improving bicycle and bus infrastructure on lowering CO2 emissions [34] and increasing PA in 5% of the population [35]. Using the travel demand and health impact modeling approach, a study showed that active transportation can reduce the annual health burden (90,000 DALYs) in India [36]. Another study in India assessed alternative scenarios, including increased active travel, lower-carbon-emission motor vehicles, and a combination of the two, utilizing comparative risk assessment techniques [37]. The results indicated that the most significant advantages would come from combining active transportation with low-emission motor vehicles, which can reduce 12,995 DALYs in Delhi.

1.4. What Will Be Elucidated in This Research: Model Development

While there are inadequate studies in India conducted to estimate the co-benefits of NMT transportation, most of these studies have mainly focused on traffic injuries and air pollution and associated health benefits rather than the benefits of extra PA [38]. By developing an integrated quantitative assessment modeling framework of environmental–health–economic benefits (Figure 1), this paper seeks to quantify the expected health and economic co-benefits of both increased PA and improved air quality resulting from implementing the NMT policy in Delhi, India. As shown in Figure 1, the willingness-based trip demand model is used to estimate the total kilometers and time the inhabitants are willing to spend on NMT due to choosing to walk and bike instead of driving cars and motorized two-wheelers. The impact of the potential factors such as age, gender, education, income, and travel distance on the probability of the willingness to use NMT is analyzed, utilizing a logistic regression model on the collected data from a cross-sectional interview with 250 inhabitants in Delhi. The results of the trip demand model are used in two sub-models: (1) The physical activity sub-model converts the extra daily minutes of walking and cycling to metabolic equivalents (METs), which is further used in a health risk assessment to estimate the relationship between physical activity and the beneficial impact of lowering the occurrence of specific health outcomes in the selected traffic areas. (2) The near-road air pollution sub-model is used to calculate the potential reduction in motorized vehicle kilometers due to travel distance covered by walking and cycling and also its associated near-roadway-avoided PM2.5 exposure in 11 major districts in Delhi. The relationship between changes in PM2.5 concentrations and the occurrence of specific health outcomes in the chosen traffic areas is estimated, using the concentration–response function (CRF) for several diseases in order to establish a connection between the avoided exposure of PM2.5 and health benefits. The relative risk (RR) level, which predicts the likelihood of an adverse health outcome among the population exposed to a higher level of ambient air pollution than a lower level of ambient air pollution, served as the basis for the CRF coefficient values used in this study. The values of the RR used in the study were taken from a thorough meta-analysis of earlier research. In order to achieve this, a meta-analysis and a review of articles were carried out to determine the correlation between alterations in PM2.5 concentrations and alterations in the incidence of each health endpoint. The data for the avoided mortalities and morbidities from both sub-models are finally used to calculate the economic value of the avoided health burden from both the avoided emissions and increase in physical activity using the value of a statistical life (VSL) and cost of illness methods. The findings are generalized to the whole city of Delhi.

2. Materials and Methods (Model Development)

2.1. PA Estimation Model: Estimation of the Weekly Time Spent Walking and Cycling for Transportation

The counting model is first used to calculate the number of walks and bike trips an individual makes throughout an average day in order to estimate the weekly time spent walking and bicycling for transportation, which is expressed as follows [39]:
M c , i = N c , i × P r c , i × t c , i
where M c , i is the daily minutes spent traveling using mode c (walking or bicycle) for individual i; N c , i is the expected daily number of trips taken using mode c for individual i; P r c , i is the probability that a trip taken by individual i using mode c and t c , i is the trip duration for a trip taken by individual i using mode c. P r c , i expresses the willingness to adopt active transport (walking and bicycling), which can be further estimated by developing the following logistic regression model:
P r . ( Y i = 1 | X i ) = e X i T β 1 + e X i T β ,       i = 1 , 2 , , n
In the above equation, Y i is the willingness to adopt active transport of the i t h ( i = 1 , 2 , , n ) individual. X i = ( x i 1 , x i 2 , , x i j , , x i p ) T is the p × 1 vector of covariates corresponding to the i t h individual. X i represents the vector of independent regressors, including age, gender, education, income, and travel distance, which affect the individual’s willingness to use a walking or bicycle mode for transport purposes. Furthermore, β = ( β 1 , β 2 , , β j , , β p ) T is the corresponding p × 1 vector of regression coefficients, which can be estimated through the maximum likelihood estimation approach. The likelihood function of interest takes the following form:
L ( β | Y , X ) = i = 1 n   ( P r . ( Y i = 1 | X i ) ) Y i   ( 1 P r . ( Y i = 1 | X i ) ) 1 Y i .
The estimated coefficients of the above model are interpreted through odds ratios (ORs). The OR for the covariate x i j can be estimated from the estimates of regression coefficients as given below.
O R ( x i j ) = e β j
The daily PA can be calculated by combining the time spent cycling and walking multiplied by the intensity of each activity, as determined by metabolic equivalents (METs), which is explained as follows [39]:
D P A i = ( M C w a l k i n g   , i × 3.5 ) + ( M c b i k i n g ,   i × 6.8 ) 60 min / h
where DPAi is the daily physical activity (from walking and cycling) for individual i in MET hours. For transportation, the MET values for walking and cycling are 3.5 and 6.8, respectively [40].

2.2. Near-Roadway-Avoided PM2.5 Exposure Model

The concentrations of air pollutants at particular locations are believed to represent population exposure levels. It is estimated that 55% of the population living within 500 m of major roads in Delhi are exposed to hazardous emissions from transportation, where PM2.5 is primarily produced by vehicle emissions [1]. It is crucial to use appropriate models with the vehicle and meteorological data to estimate near-roadway PM2.5 exposure, since monitoring PM2.5 concentrations cannot be achieved for all near-roadway regions. This research uses an air dispersion modeling tool called CALRoads View 6.5 (Lakes Environmental Software) to forecast how mobile sources affect air quality near roads and intersections. The CALINE-4 model is a fourth-generation line source air quality dispersion model that uses a mixing zone concept to characterize pollutant dispersion near roadways. Using the Gaussian dispersion methodology, the model predicts pollutant concentrations for receptors located within 150 m on either side of the roadways using input parameters such as site geometry and characteristics:
C ( x , y ) = q τ π σ z u y 1 y y 2 y exp ( y 2 2 σ y 2 ) d y
where C is the concentration (g/m3), y1 and y2 are the finite line source endpoint y coordinates (m), u is the wind speed (m/s), σ y and σ z are the horizontal and vertical Gaussian dispersion parameters which are a function of downwind distance x (m), q is the avoided PM2.5 emissions from replacing the distance traveled of the vehicle category τ (g/s), which can be calculated, as follows:
q τ = ( M C w a l k i n g K w a l k i n g + M C b i k i n g K b i k i n g ) E F τ
where M C w a l k i n g , M C b i k i n g , K w a l k i n g and K b i k i n g are the yearly time spent walking and cycling (s) and the average distance covered by walking and cycling in Delhi (km/s), respectively. E F τ is the PM2.5 emission factor of the vehicle category τ (g/km) M C w a l k i n g , M C b i k i n g are calculated by Equation (1) and K w a l k i n g and K b i k i n g are given values.

2.3. Health Impact Assessment Model

Excess deaths or illnesses (EDI) caused by an increase in PM2.5 concentration can be estimated as follows [41]:
E D I = P A F   ×   I   ×   P
where I is the annual baseline mortality rate, P is the total population, and PAF (population attributable fraction) indicates the percentage of illness burden attributable to pollution. The PAF can then be calculated using the formula below [42]:
P A F = p ( R R 1 ) p ( R R 1 ) + 1
where P represents the population’s exposure rate. The values of RR for physical activity and near-roadway PM2.5 exposure are estimated in different ways. In order to accurately assess the correct values of RR, the health impact assessment requires highly aggregated epidemiological data. To this aim, in this study, a comprehensive meta-analysis was carried out based on a systematic quantitative review, where all directly relevant empirical data that satisfy the eligibility standards and criteria were gathered, combined, and statistically analyzed to produce a pooled estimate that was as close as possible to the RR values specified by Delhi. The following equation is used to estimate the final RR of willingness-based physical activity [39]:
R R P A = R R m ( D P A α   M E T   )
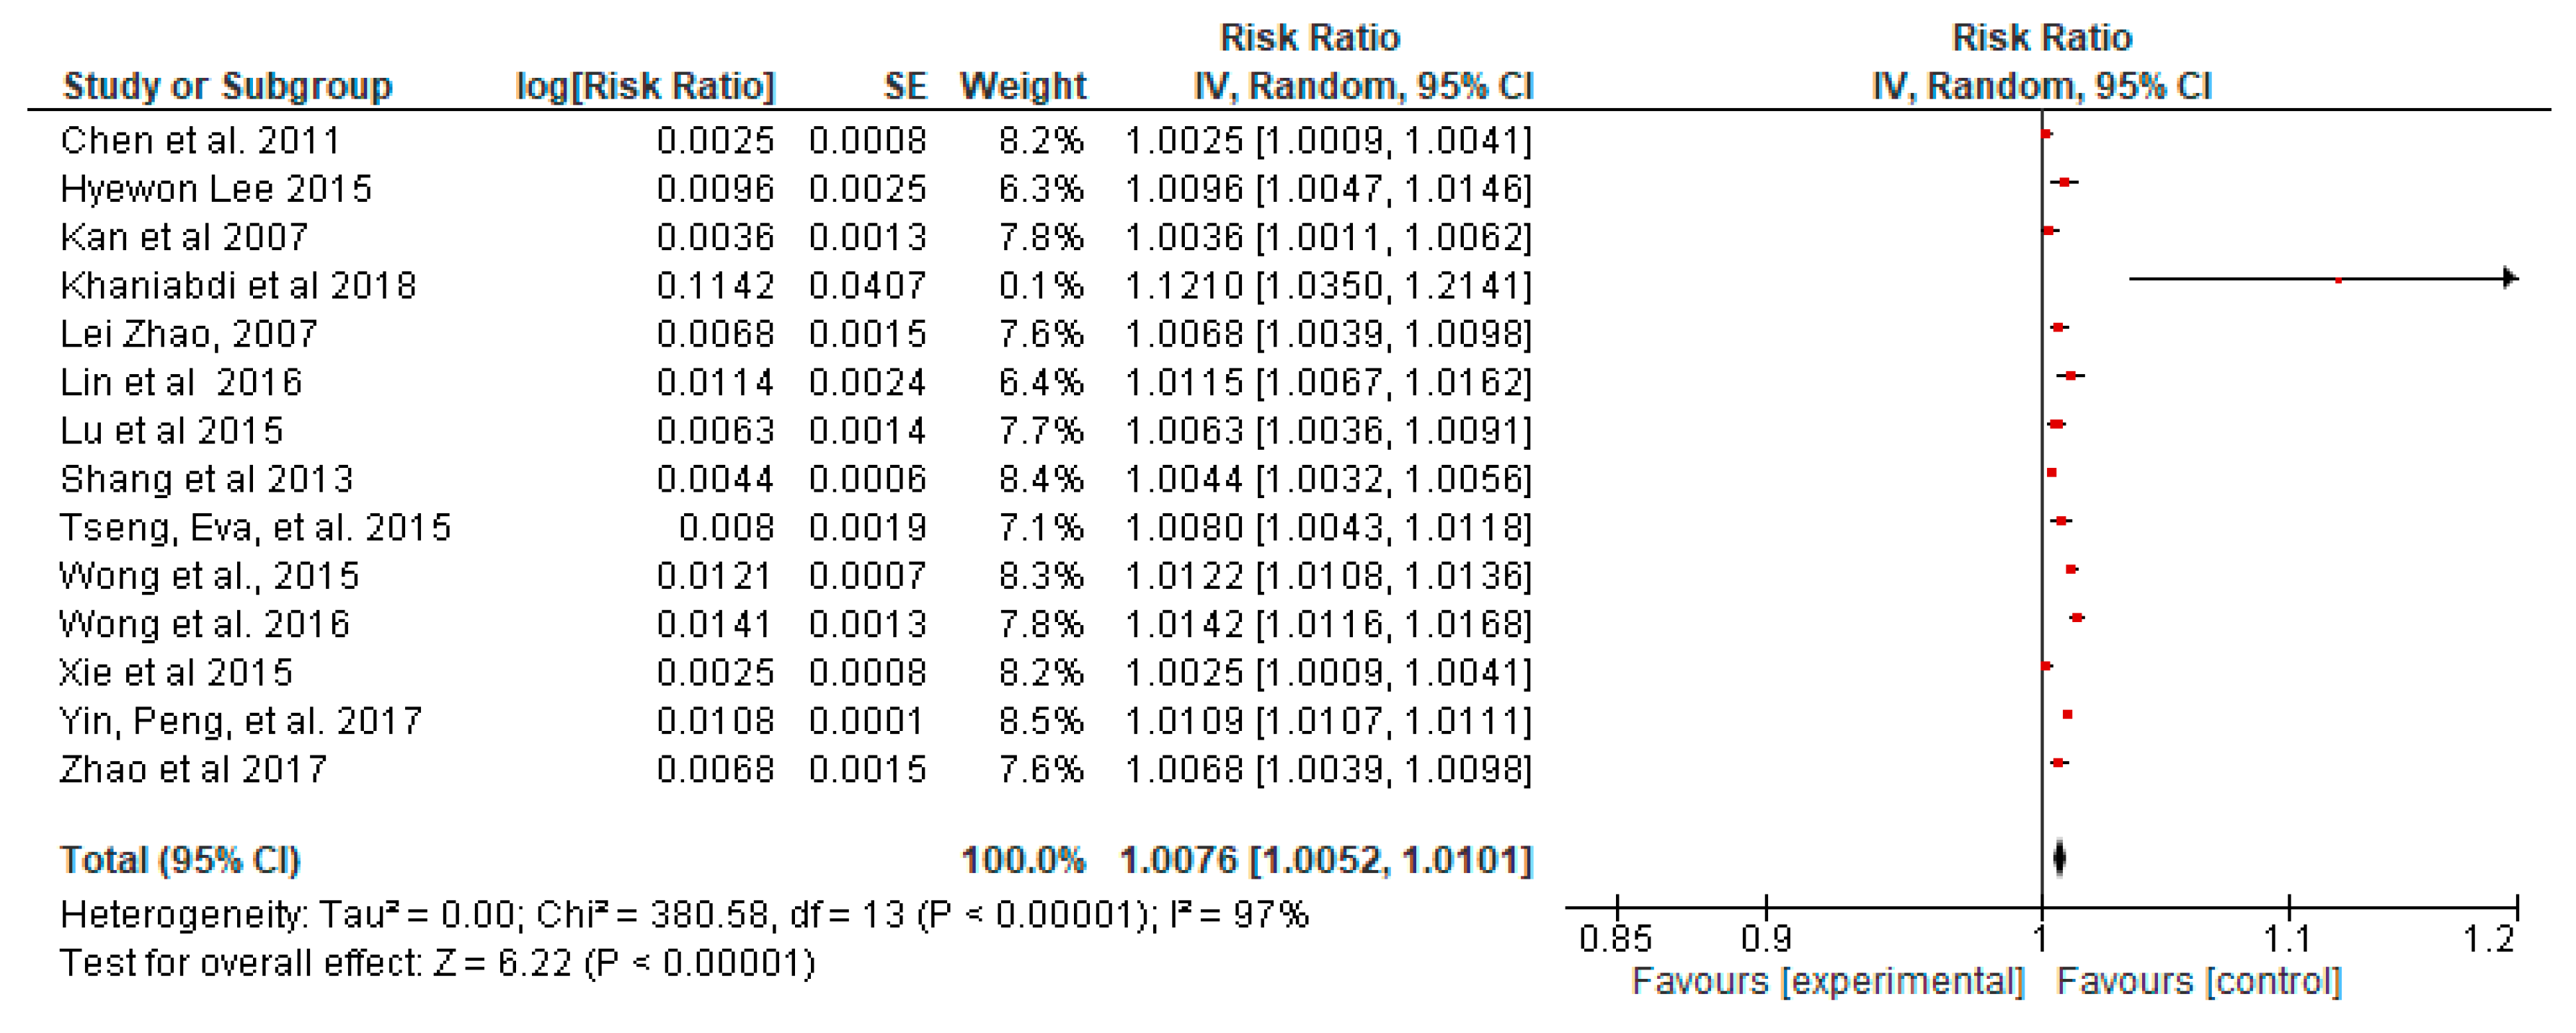
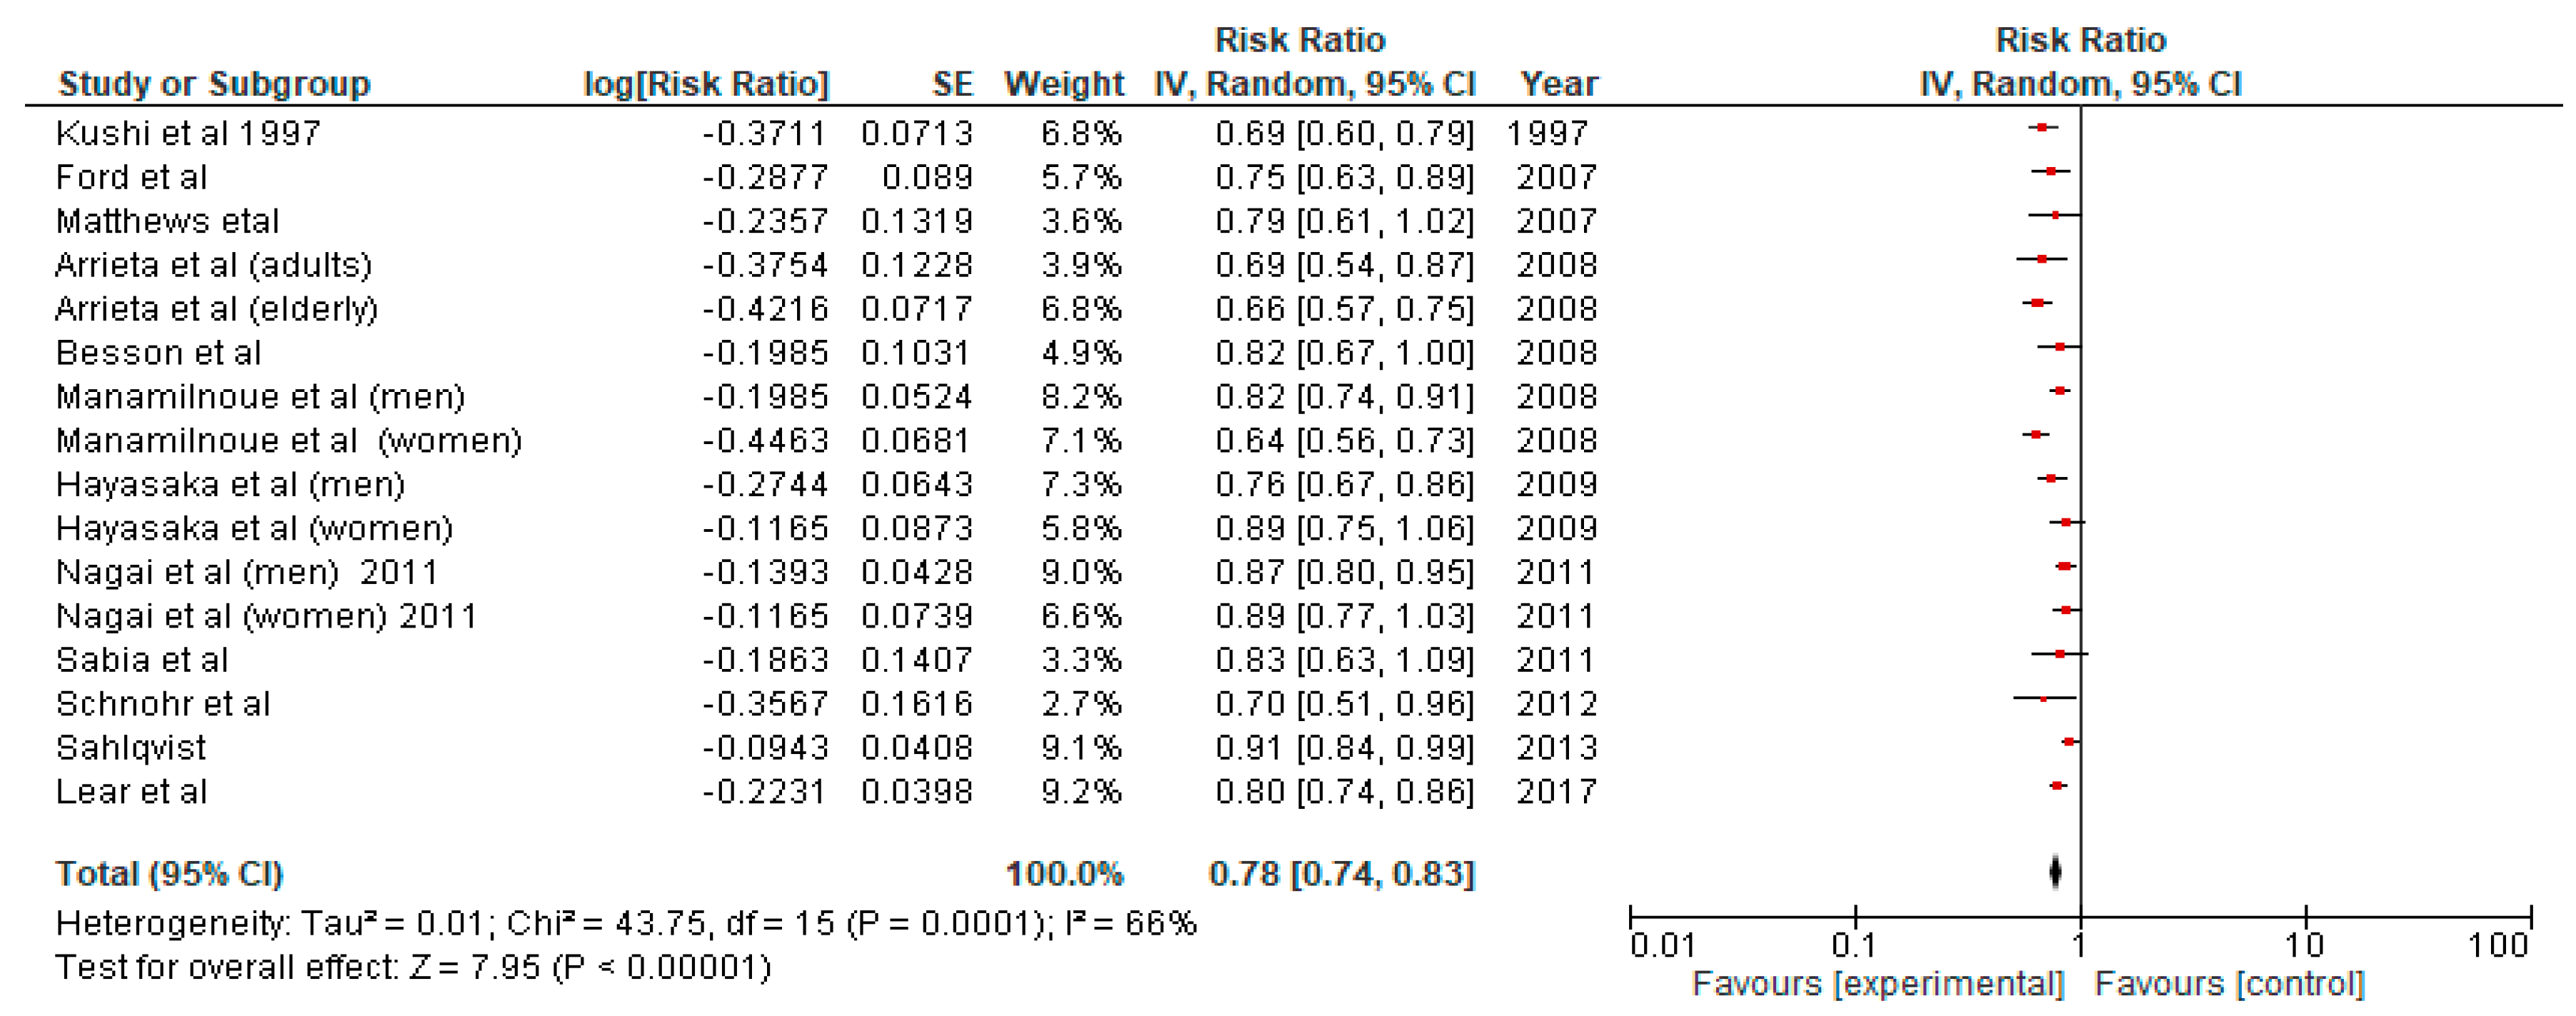
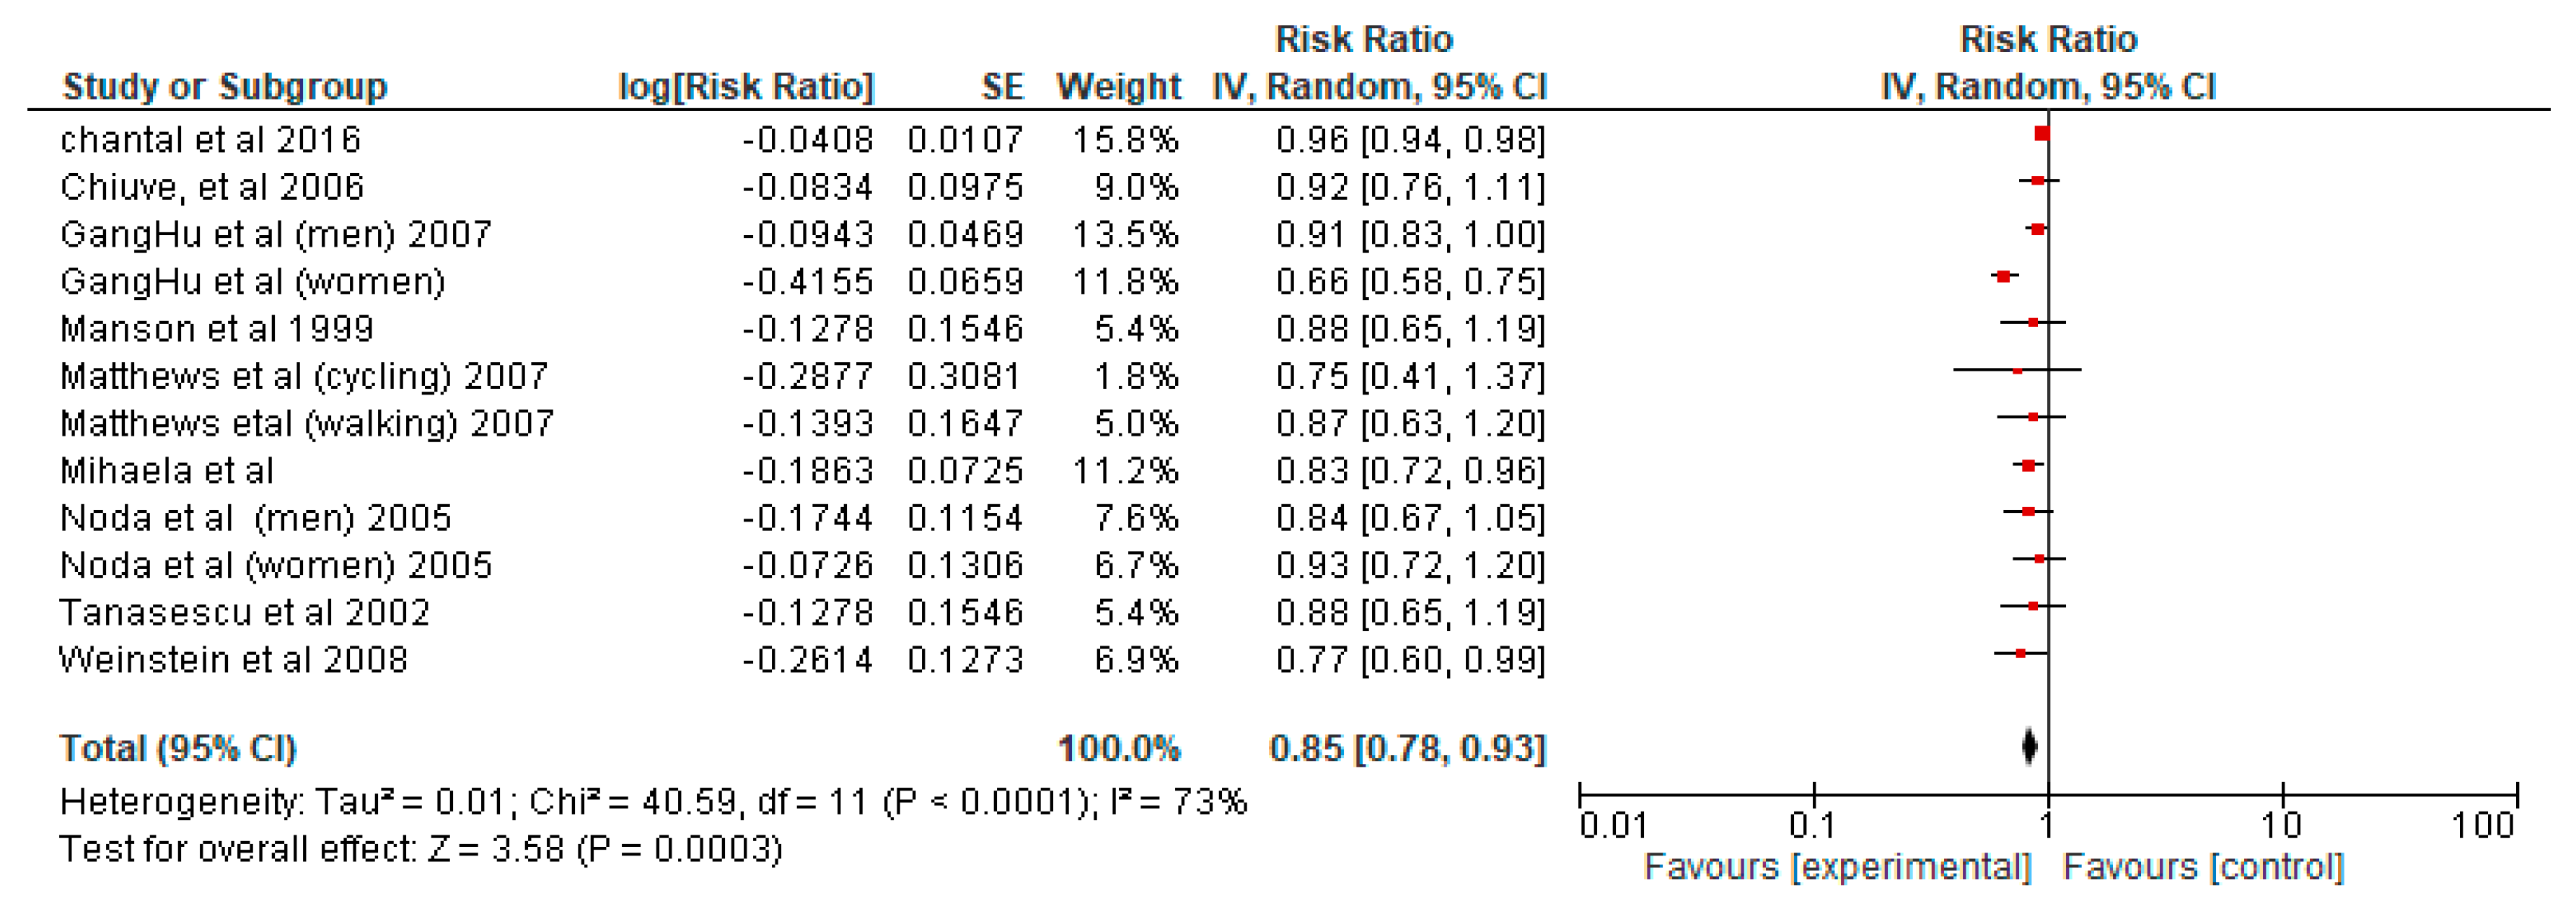
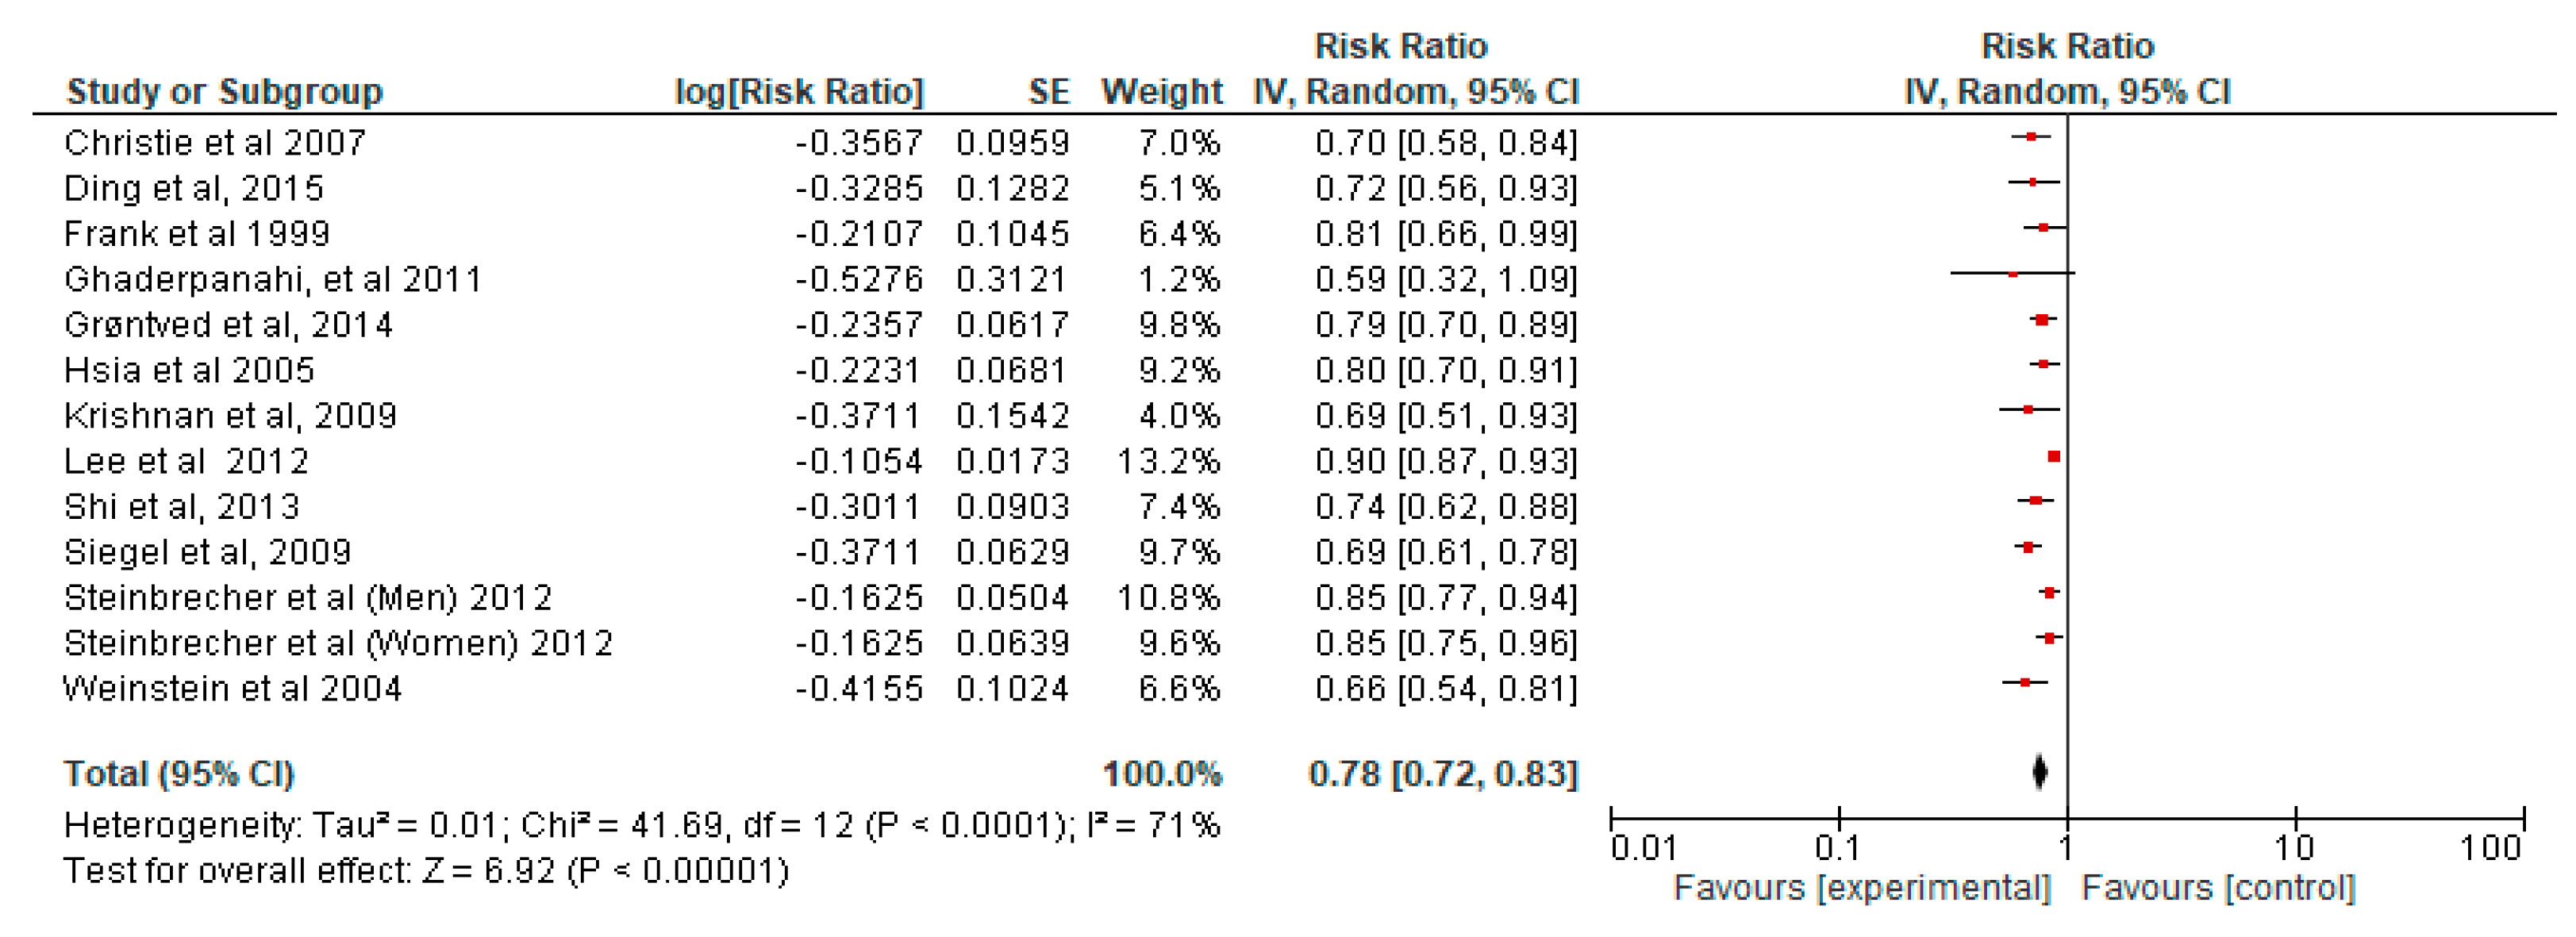
where R R P A is relative risk estimated from walking and bicycling physical activity; R R m is the relative risk estimated from the meta-analysis of the collected data from 61 studies on 5 physical activity-related health outcomes (all-cause mortalities, type 2 diabetes, coronary heart diseases, cancers, and depressive disorders) to estimate the dose–response function and PA-related morbidities and mortalities as the functions of physical transportation activity (Appendix A, Figure A2, Figure A3, Figure A4, Figure A5, Figure A6, Figure A7, Figure A8, Figure A9, Figure A10, Figure A11 and Figure A12). The meta-analysis was based on collecting data from selected studies with reported values of RR of moderate-intensity PA ( α ranges from 3 to 6 h). The current global recommendation for adults’ physical activity is 150 min ( α = 2.5 h) of moderate-intensity aerobic physical activity per week [43]. The pooled values of the RR collected from 64 studies related to total mortality, COPD, cardiovascular mortality, respiratory mortality, morbidity, and related hospital admission were used to calculate the relationship between a change in air pollutant concentration (in this study, PM2.5) and a change in health effects, i.e., concentration–response functions (CRFs):
R R A P = exp [ β ( C C 0 ) ]
where R R A P is the relative risk estimated from the near-roadway-avoided PM2.5 exposure, and β is a coefficient that evaluates the response of a health outcome to a change in pollutant concentration. C and Co are the pollutant concentrations in the baseline and intervention scenarios. Table 1 represents the baseline incident rates of diseases in Delhi used in this study.

2.4. Economic Impact Assessment Model

The value of a statistical life (VSL) approach and the cost of an emergency room visit (ERV) were used in this study to calculate the mortality cost of PM2.M exposure [41]. The cost of illness (COI) approach was used to determine the cost of treatment of coronary heart diseases, type 2 diabetes, cancer and depressive disorders, and hospital admissions due to respiratory diseases, COPD, respiratory mortality, cardiovascular mortality, and LC [44,45,46,47,48,49,50]. The values for the various health endpoints considered in this study are shown in Table 2.

3. Results and Discussion

3.1. Willingness of People in Delhi to Use NMT

A cross-sectional survey was conducted from 2 July to 8 July 2022, in Delhi, India, to estimate peoples’ willingness to accept active transportation as their usual travel mode. The survey encompassed different areas of Delhi, namely Ashok Vihar, Nand Nagri, Dilshad Garden, Jhilmil, and Seema Puri. About 250 inhabitants were physically interviewed during the survey, while 50 responses were collected online. People were physically approached and were asked questions during morning hours while leaving for work and during evening hours while returning, especially near bus stops, public parks, and pedestrian crossings. For the online survey, the questionnaires were shared with only those currently living in Delhi. The detailed questionnaire used in this research is described in Appendix B, Table A2.
The questionnaire, consisting of 11 questions, initiated the most important survey inquiry, whether the respondent was willing to use active transport in Delhi. Then, separate questions were asked for walking and bicycling. The later part of the questionnaire asked about the mandatory and nonmandatory travel modes of the inhabitants of Delhi, India, along with their preferable distance to be covered by walking and bicycling. Finally, the survey enquired about the respondents’ socio-economic condition (income and education) and demographic characteristics (age and gender). After discarding all the missing and erroneous data, a total of 283 respondents’ information was finally analyzed. All these variables are described in Appendix B, Table A1, which depicts that 30.35% and 38.52% of the respondents were willing to use walking and bicycling, respectively, as their regular transportation modes. All the selected covariates were categorized to distinguish the probability of willingness for the different categories of the corresponding predictors. Among the set of covariates, regular travel mode, monthly income, education level, and age were categorized into more than two categories. Such categorical variables require special attention, unlike continuous and binary predictors, which can be incorporated into the regression model without any modification. In the case of the covariates with more than two categories, one category needs to be considered as a reference category with which the remaining categories can be compared. This reference category is selected based on the purpose of comparison. Then, the remaining categories are transformed into binary variables and compared with the reference category of interest. The results of the model are presented in Table 3.
Regular travel mode, monthly income, and education level were found to be significant factors in the willingness to walk in Delhi, India. On the other hand, the LR model for the willingness to bicycle revealed significant associations between this willingness and regular travel mode, distance to cover, education level, gender, and age group, which are depicted in Table 3. The OR for private car users was 0.241, which is less than one. Hence, those who used private cars as their regular travel mode in Delhi had significantly ( 1 0.241 ) × 100 % = 75.9 % lower odds of preferring to walk than public transport users. Similarly, motorcycle users had 57.4% lower odds of willingness to walk regularly as a travel mode, compared with those who used public transport. A lower likelihood of bicycling was observed for both the regular users of private cars and motorcycles than those of public transport. Distance to cover could significantly influence only the willingness to bicycle. For longer distances (more than 2 km), people preferred (OR = 3.228 > 1 and p < 0.10) to use bicycling as a regular travel mode more than for shorter distances. Compared with the medium-income group, people with high incomes showed more tendency to choose walking as their travel mode in daily life. Both illiterate and highly educated people preferred walking more than those who completed their primary or secondary education. On the other hand, only illiterate people were more likely to bicycle than primary-to-secondary-educated ones. Both middle-aged and older people had a lower preference for bicycling than the younger group. On the other hand, compared with their female counterparts, males had a higher willingness to use bicycles in their daily lives. The p-values of the Hosmer–Lemeshow test for both the LR models were greater than 0.05, which indicates that the corresponding models did not provide a poor fit to the data [59].
Based on the NMT willingness analysis findings, the average per capita time spent on walking and bicycling were estimated as 11.1 and 2.3 min, respectively, which is equal to covering an extra walking and cycling distance of 1.18 km per day based on the average walking and cycling speed in Delhi. These results were further analyzed to evaluate the environmental and health impacts achieved by improving the infrastructure so that people in Delhi can adopt active transport as per their willingness.

3.2. Near-Roadway-Avoided PM2.5 Exposure from Replacing the Distance Traveled by Private Vehicles with Walking and Cycling in Delhi

The near-roadway concentration model described in Section 2.2 was applied to selected traffic zones (0.2 × 1 km2 area) in all 11 districts of Delhi while considering the population density in each district, in order to evaluate the impact of the avoided PM2.5 exposure from replacing the distance traveled by private vehicles with walking and cycling. The PM2.5 concentration was estimated by using the CalRoads software and was found to be 0.2 km downwind from vehicles to the near-roadway passengers. The heatmaps of the avoided PM2.5 exposure in the selected traffic zones in different districts in Delhi are shown in Figure 2. The per-hour-avoided vehicle kilometers (VKM) due to an increase in NMT and the average near-roadway-avoided PM2.5 exposure in the different districts in Delhi are shown in Table 4.

3.3. Public Health and Economic Co-Benefits from Replacing Distance Traveled by Private Vehicles with Walking and Cycling in Delhi

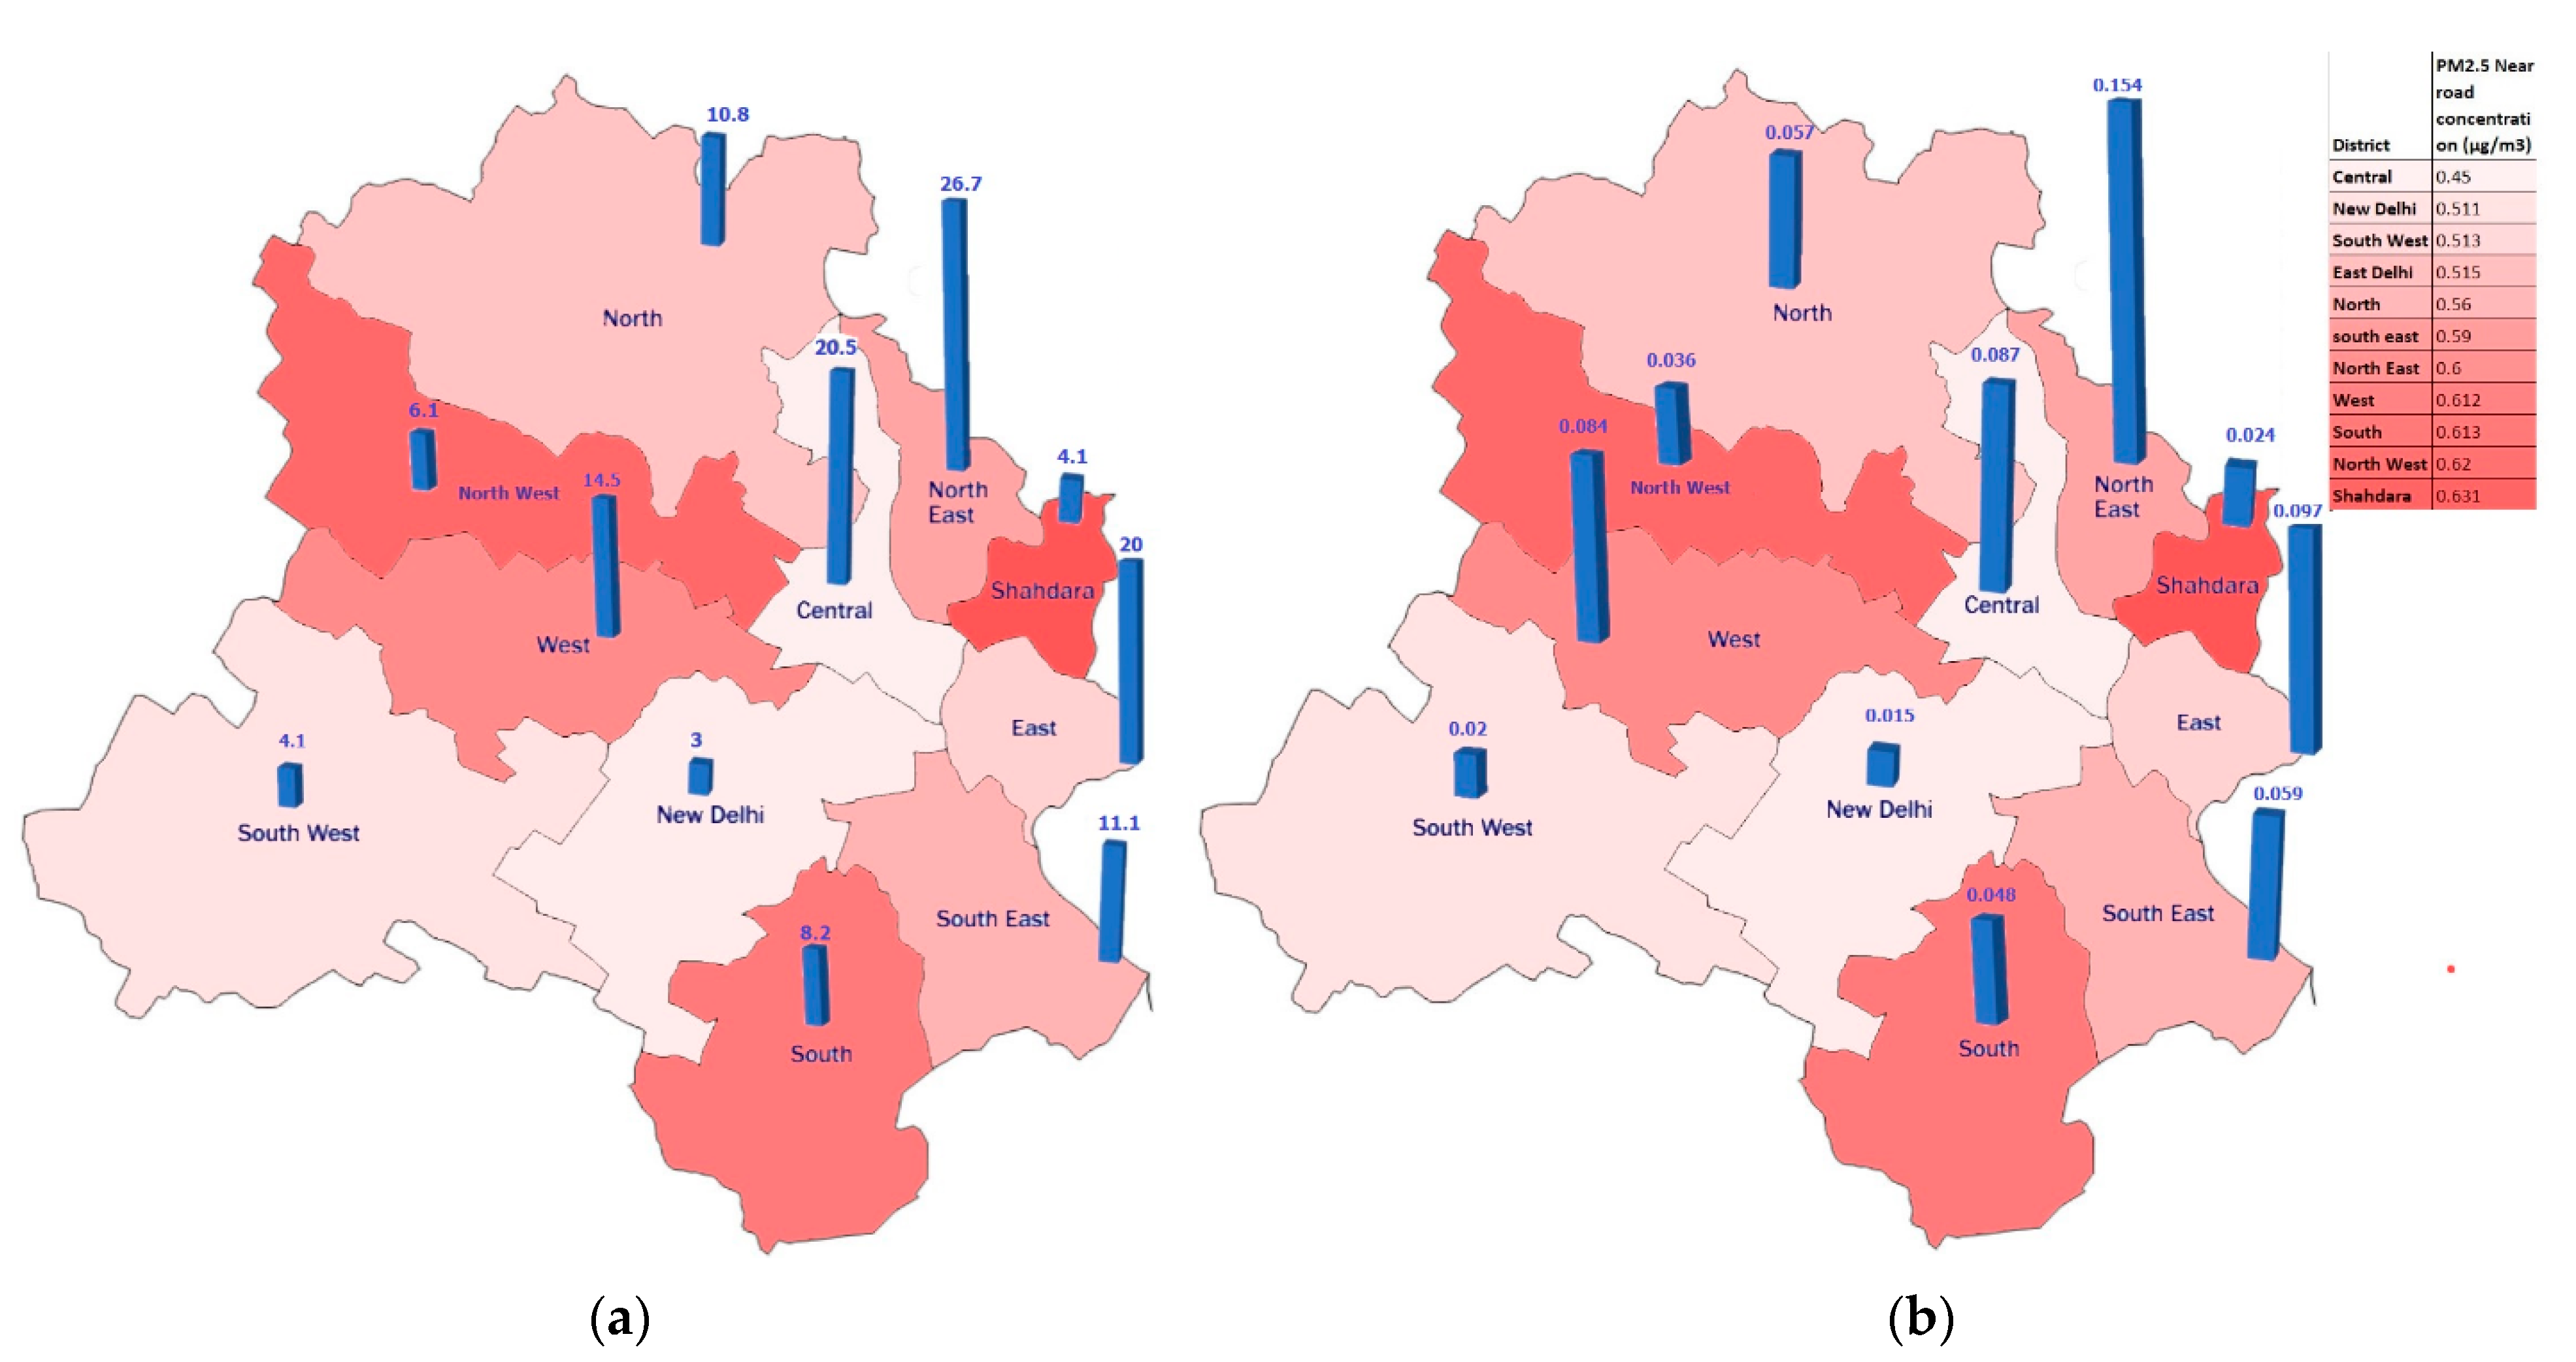
Figure 3a shows the avoided mortalities and morbidities related to increased PA per km2 in the different districts of Delhi. Northeast Delhi had the highest health benefits due to high population density, while the New Delhi district had the lowest health benefits due to less population density. More specifically, the NMT (walking and bicycling) use in areas with high population density, such as the northeast (36,155 people per kilometer), led to a more significant reduction in the number of morbidity and mortality cases. Figure 3b shows the avoided mortalities related to avoiding PM2.5 exposure near roadways in the various districts. The pooled values of the RR used in health impact assessment for both PA and near-roadway-avoided PM2.5 exposure are reported in Table 5 and Table 6. Table 7 includes the detailed avoided morbidities per km2 in the different districts of Delhi. As previously stated, the avoided health burden in each district depends on both traffic and the population density along the nearest roadway. Therefore, despite the fact that the southeast, Shahdara, and north districts had the highest avoided PM2.5 emission and exposure due to their heavy traffic conditions, the northeast and central districts had the highest expected avoided health cases due to higher near-roadway population densities.
These findings were then generalized to the entire Delhi, taking into account the total area of the route network length of 16,200 km in Delhi [58,59,60,61,62,63]. The total avoided CO2 emissions and PM2.5 exposure were estimated at 121.5 kilotons per year and 138.9 tons per year, respectively (the emission factors and avoided VKM are given in Appendix C, Table A3). Finally, the total avoided health and economic impacts of physical activity and the associated reduction in near-roadway PM2.5 exposure are given in Table 8.
The results indicate that compared with the near-roadway-avoided PM2.5 exposure, increased PA had a higher impact on preventing annual mortalities and morbidities in the different districts of Delhi. This can be attributed to the higher values of the relative risks of PA, leading to higher health impacts. In addition, health benefits were seen as more prominent in the districts where the population density is higher, both in terms of increased PA and decreased air pollution. These results emphasize that an increase of 11.2 min of physical activity or 1.18 km of extra distance walked per day can significantly reduce noncommunicable diseases related to mortalities and morbidities in Delhi. The findings from this study are comparable with those of previous studies, which have predicted significant health and economic benefits of NMT policy implementation in India and other countries, emphasizing that the health benefits of active transport can outweigh the costs of NMT infrastructure requirements [63]. Similar studies in India have shown that active transportation can lower India’s health burden by 90,000 DALYs annually [35], and integrating active transportation with low-emission vehicles can save 12,995 DALYs in Delhi [36]. While considering economic impacts, a 10% shift to active mobility options has been indicated to save 15 billion euros annually in Europe [32].

4. Conclusions

Sustainable transportation can be integrated with development objectives such as health and well-being, clean energy, and sustainable cities. Climate change strategies are crucial, especially in developing nations such as India. In order to support the actions to mitigate climate change and other human development goals, it is essential to identify concrete co-benefits. Due to their lower carbon footprint and significant economic advantages in terms of preventing health effects, NMT can be a crucial part of such a strategy in Delhi. It can lower individual healthcare and transportation costs while enhancing public health and the environment. To this aim, this study introduced the integrated environmental, health, and economic benefits of implementing the NMT scenario in Delhi based on the willingness to walk and bike.
The results revealed that increased physical activity and avoiding exposure to PM2.5 near roadways are expected to reduce the mortality rate by 40,018 cases in addition to reducing other morbidities, as indicated in this study, while physical activity was revealed to play a significant role in reducing mortalities and morbidities. The associated cost savings from morbidities and mortalities were estimated to be approximately USD 4869.8 million annually, which will positively impact Delhi’s local government’s finances. On the other hand, the local government may face difficulties and high costs when creating NMT facilities in Delhi due to the need to build and improve bike lanes, paths, and crosswalks as well as design safer roads for NMT transportation. However, massive savings in annual health costs may outweigh investments in infrastructure in just a few years.

Author Contributions

Conceptualization and methodology, T.H.B. and H.F.; investigation, T.H.B., N.T.T. and H.F.; writing—original draft preparation, T.H.B., N.T.T. and H.F.; writing—review and editing, H.F., supervision, H.F. All authors have read and agreed to the published version of the manuscript.

Funding

This research was financially supported by the young re- searcher program of the Kyushu University Platform of Inter-/Transdisciplinary Energy Research.

Institutional Review Board Statement

Not applicable.

Informed Consent Statement

Not applicable.

Data Availability Statement

Not applicable.

Acknowledgments

The authors would like to thank the Energy and Environmental Systems Laboratory, Kyushu University, for providing the scientific background of this research.

Conflicts of Interest

The authors declare no conflict of interest.

Appendix A

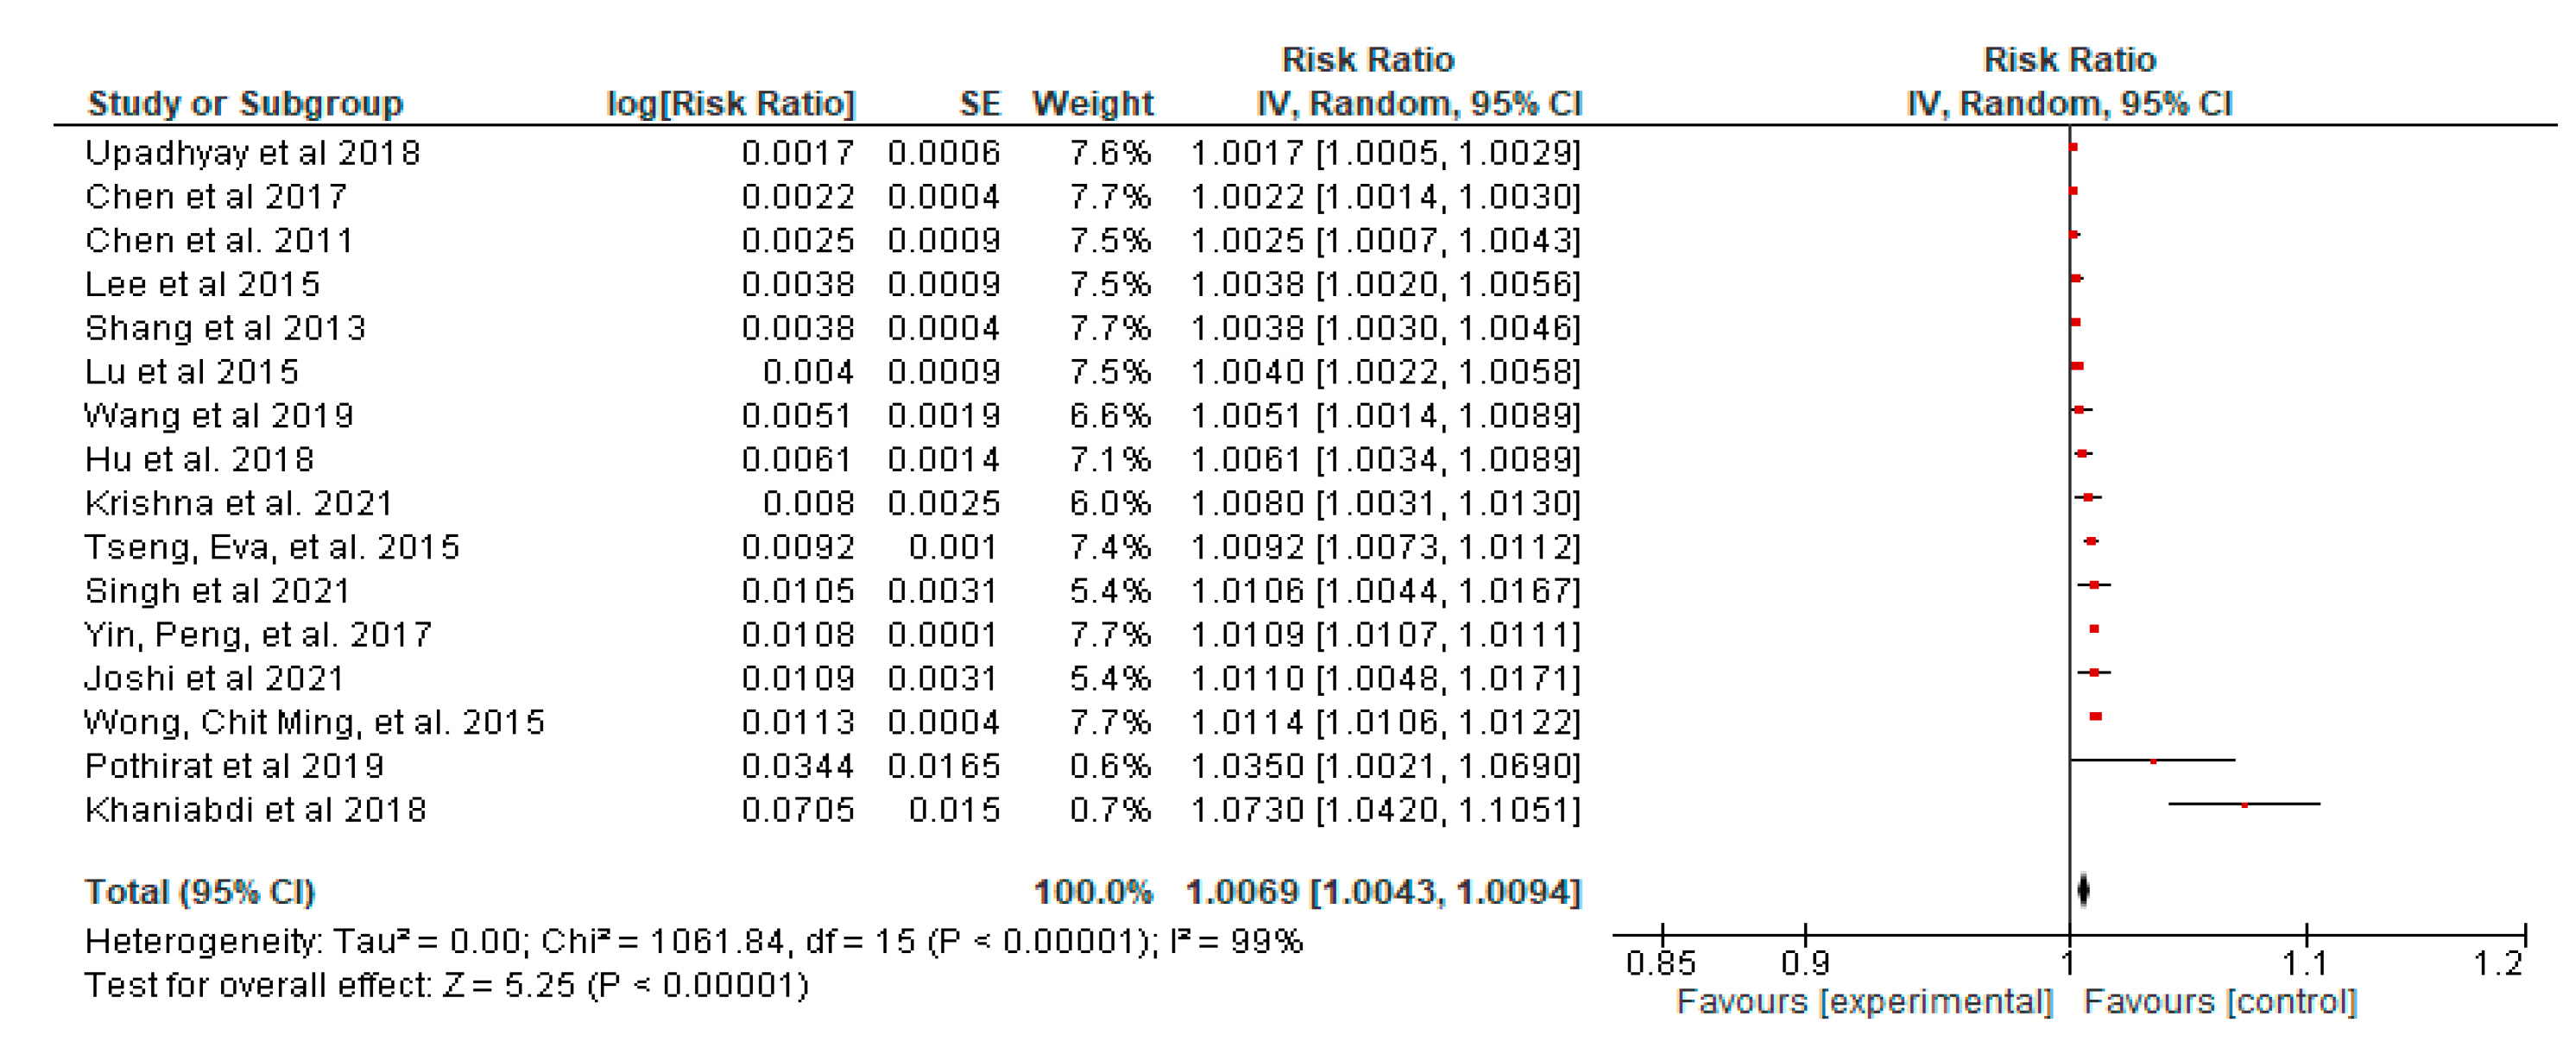
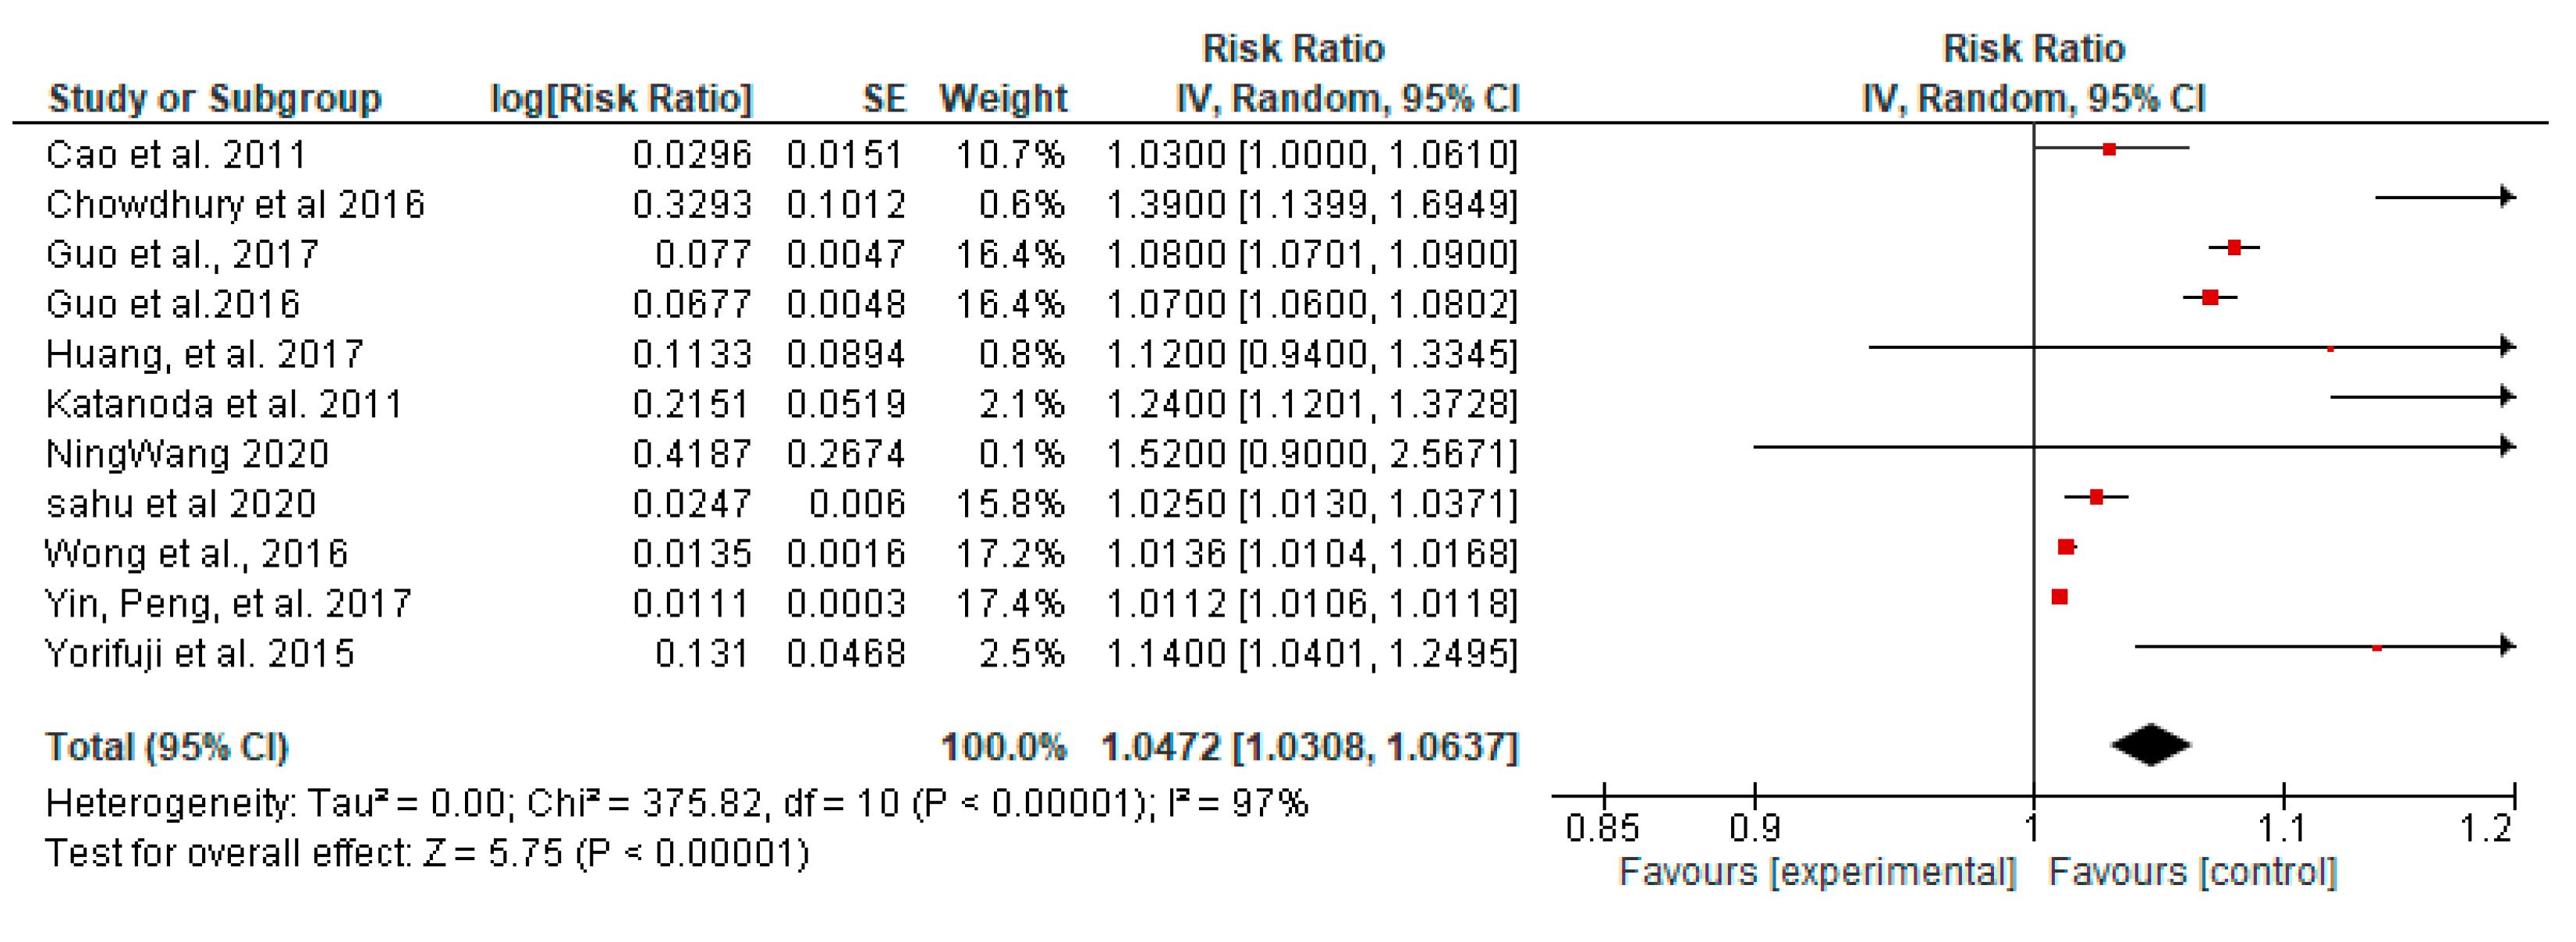
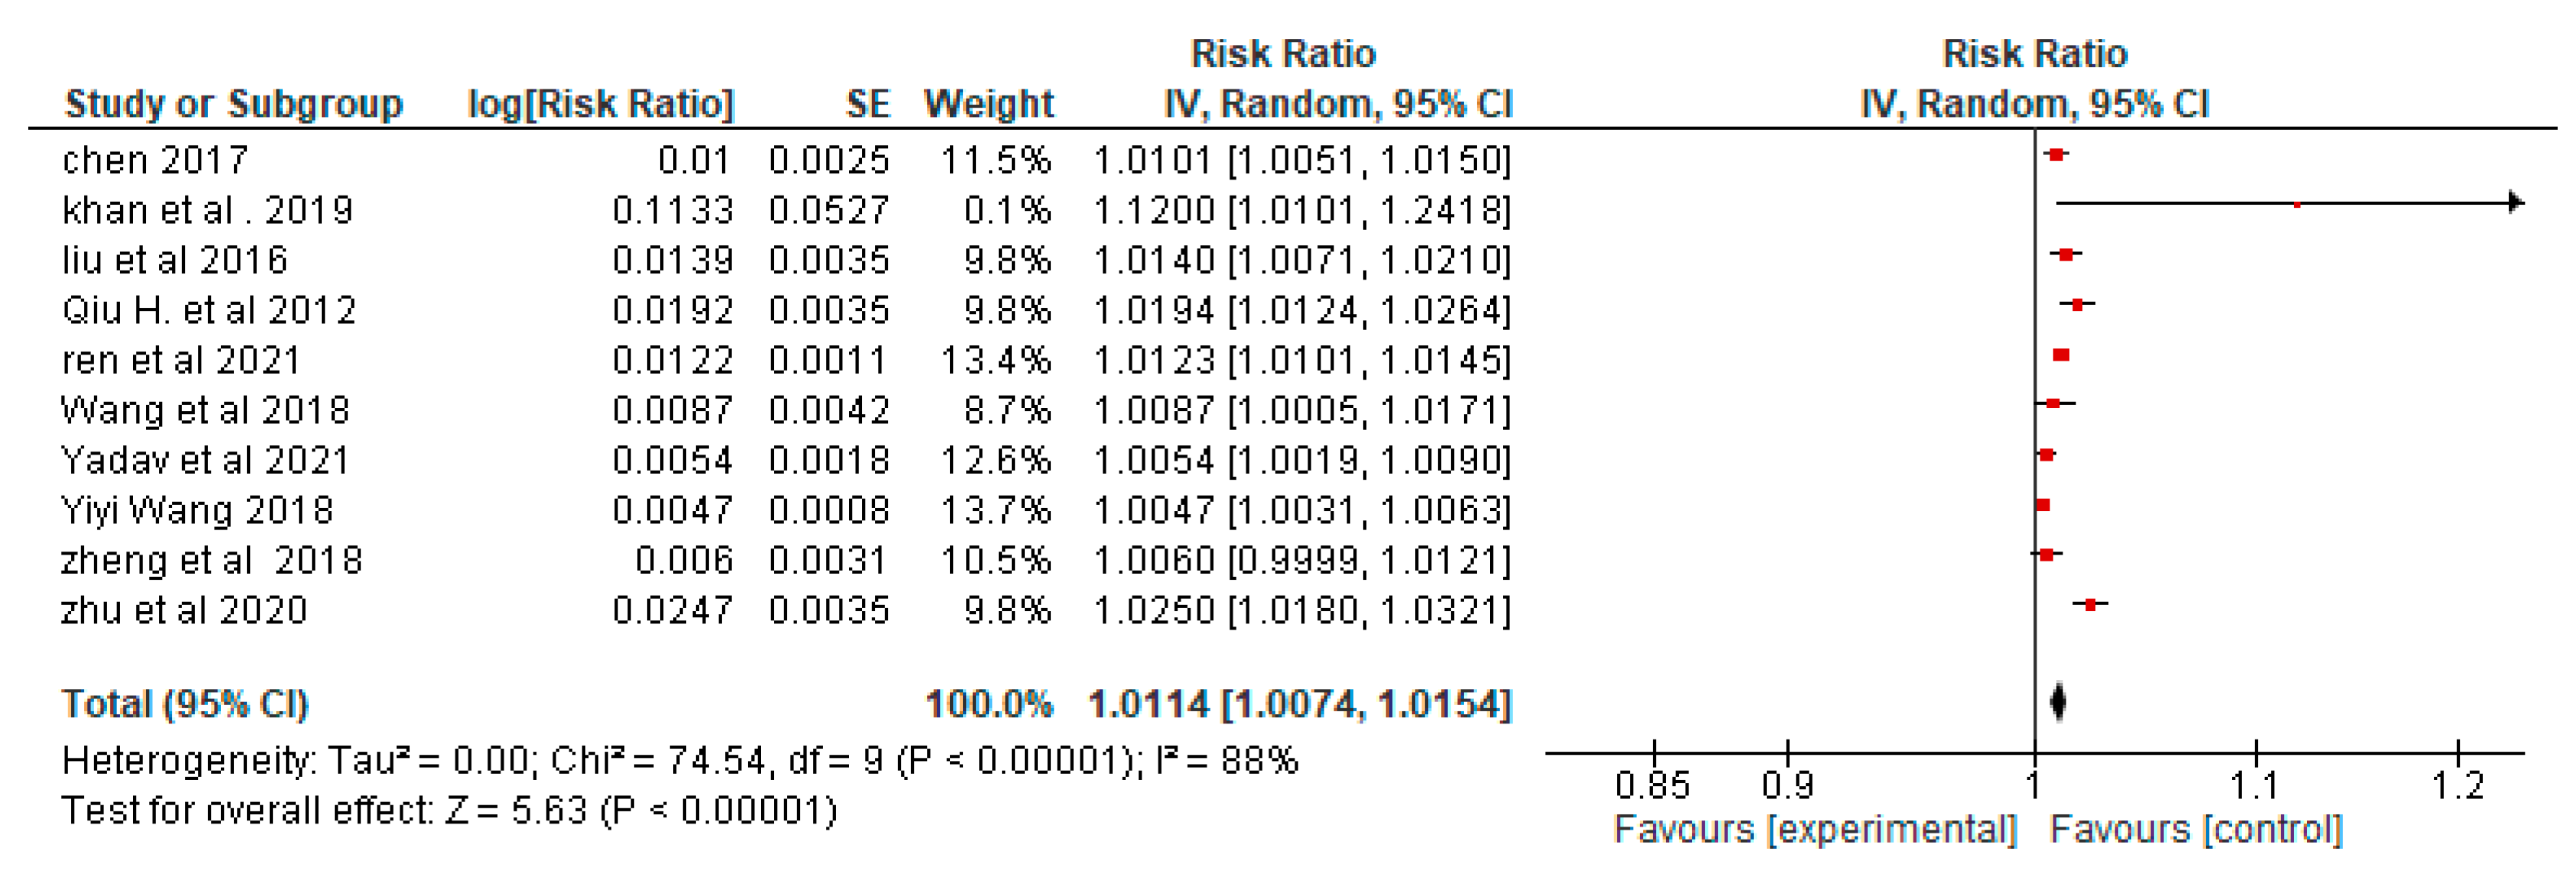
This meta-analysis included 64 + 61 studies based on the inclusion criteria using the RAVMAN (5.4.1 version) software. The following tables show the pooled risk ratio (RR) for total mortality (PM2.5), COPD, cardiovascular mortality, respiratory mortality, LC, and respiratory morbidities related to hospital admissions, cancer, type 2 diabetes, depression, total mortalities (PA), and coronary heart diseases from 64 studies related to PM2.5 and health impacts, and 61 studies that were included in the meta-analysis.
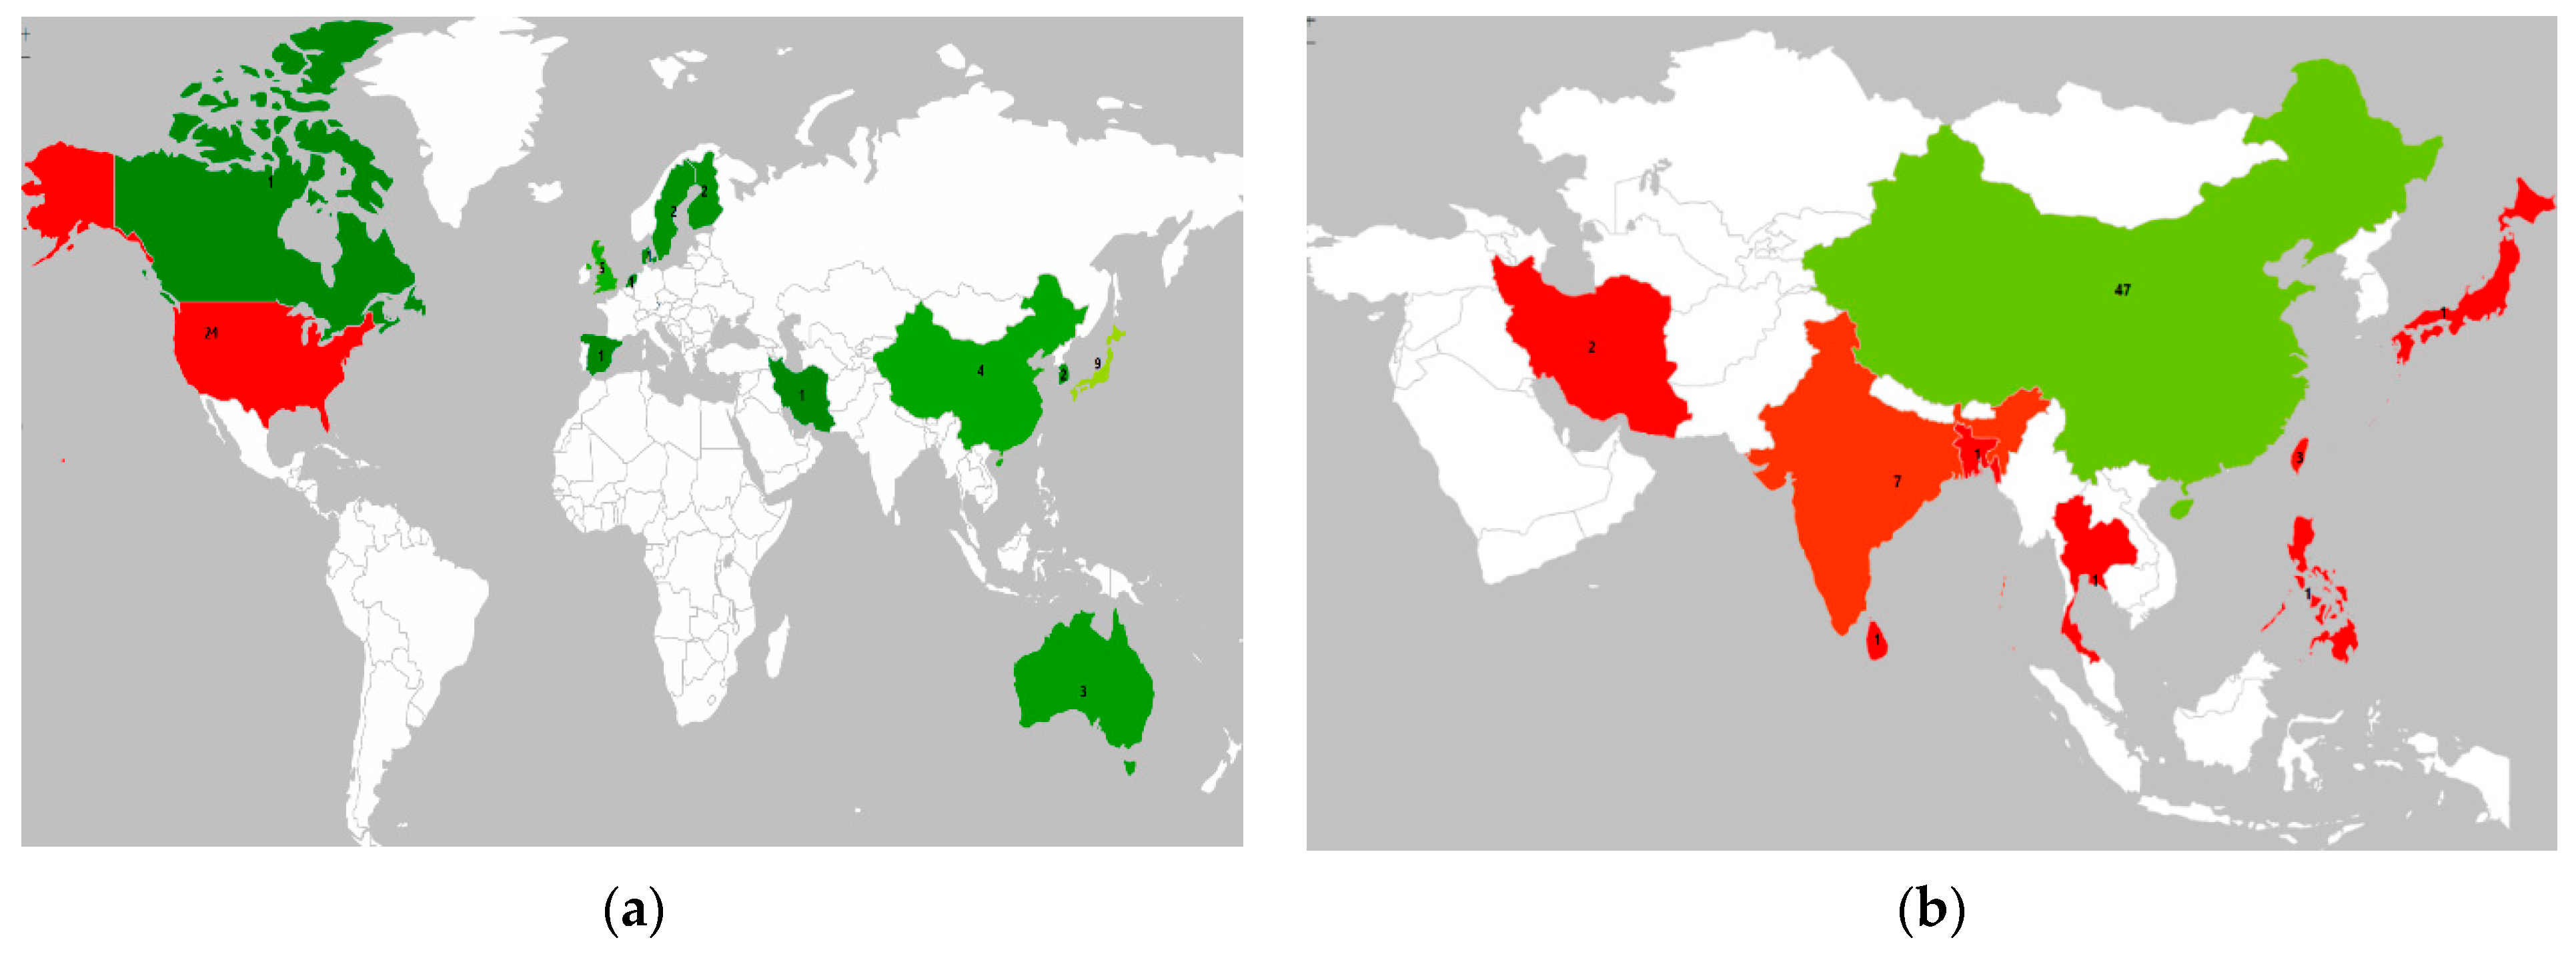
Figure A1. The geographical distribution of the studies that were chosen for the RR meta-analysis: (a) physical activity and health impacts; (b) PM2.5 and health impacts.
Ijerph 19 14974 g0a1
Figure A2. PM2.5-related all-cause mortality.
Ijerph 19 14974 g0a2
Figure A3. PM2.5-related COPD.
Ijerph 19 14974 g0a3
Figure A4. PM2.5-related lung cancer.
Ijerph 19 14974 g0a4
Figure A5. PM2.5-related respiratory-disease-related hospital admissions.
Ijerph 19 14974 g0a5
Figure A6. PM2.5-related respiratory mortality.
Ijerph 19 14974 g0a6
Figure A7. PM2.5-related cardiovascular mortality.
Ijerph 19 14974 g0a7
Figure A8. PA-related all-cause mortality.
Ijerph 19 14974 g0a8
Figure A9. PA-related coronary heart diseases.
Ijerph 19 14974 g0a9
Figure A10. PA-related depression.
Ijerph 19 14974 g0a10
Figure A11. PA-related type 2 diabetes.
Ijerph 19 14974 g0a11
Figure A12. PA-related cancer.
Ijerph 19 14974 g0a12

Appendix B

The questionnaire used for the estimation of willingness for NMT in Delhi.
Table A1. Characterization of selected variables along with descriptive statistics.
Variables CategoriesCharacteristicsFrequencies (%)
Willingness to walk Yes
No
Willed to use walking as a regular travel mode
Unwilled to use walking as a regular travel mode
85 (30.35%)
198 (69.95%)
Willingness to bicycle Yes
No
Willed to use bicycling as a regular travel mode
Unwilled to use bicycling as a regular travel mode
109 (38.52%)
174 (68.48%)
Regular travel modePublic transport
Private car
Motorcycle
Used public transport as a mandatory travel mode
Used private car as a mandatory travel mode
Used motorcycle as a mandatory travel mode
99 (34.98%)
96 (33.92%)
88 (31.10%)
Distance to cover by walkingShort distance
Long distance
Preferred to walk for 1–2 km of distance
Preferred to walk for more than 2 km of distance
96 (33.92%)
187 (66.08%)
Distance to cover by bicyclingShort distance
Long distance
Preferred to use the bicycle for 1–2 km of distance
Preferred to use the bicycle for more than 2 km of distance
19 (6.71%)
264 (93.29%)
Monthly incomeLow income
Medium income
High income
Monthly income of below 15,000 INR
Monthly income of between 15,000 and 75,000 INR
Monthly income of above 75,000 INR
90 (31.80%)
172 (60.78%)
21 (7.42%)
Education levelIlliterate
Primary to secondary
High
No education
Studied up to school
Graduated or higher studies
25 (8.83%)
91 (32.16%)
167 (59.01%)
Age groupYoung
Middle-aged
Old
Aged between 10 and 18 years
Aged between 18 and 45 years
Aged above 45 years
18 (6.36%)
224 (79.15%)
41 (14.49%)
GenderMale
Female
Male respondents
Female respondents
200 (70.67%)
83 (29.33%)
Table A2. Detailed questionnaire used in this survey.
QuestionResponse
1. Willing to use NM modes (bicycle)
  • Yes
  • No
  • Already using NM modes
2. Willing to use NM modes (walking)
  • Yes
  • No
  • Already using NM modes
3. Mandatory travel mode to work, school, business
  • (Walk/Bicycle)
  • motorcycle
  • personal vehicle/car
  • Public transport
4. Nonmandatory travel mode to shopping, personal, family, etc.
  • (Walk/Bicycle)
  • motorcycle
  • personal vehicle/car
  • Public transport
5. Age-wise distribution
  • Below 18years
  • 18–25 years
  • 25–45 years
  • 45–55 years
  • 55–65 years
6. Gender-wise distribution
  • Female
  • Male
7. Occupation level
  • Student
  • Support
  • Middle
  • Higher
8. Monthly income level
  • below 15 k
  • 15k to 30 k
  • 30k to 50 k
  • 50k to 75 k
  • 75k to 100 K
  • above 100 K
9. Education level
  • Nil
  • Only school
  • Graduation or Higher.
10. For which distance you prefer bicycles/walking as your transport mode?
  • 1–2 Km
  • 2–3 Km
  • 3–4 km
  • 4–5 Km
  • 5–6 Km
Personal vehicle ownership
  • motorcycle
  • personal vehicle/car
  • Personal cycle
  • None
11. What are the main barriers towards walking and cycling in urban area?
  • Few cycle lanes and bike parking areas
  • Safety: no separate road space for cycling and walking.
  • Inadequate bicycle rental and bike-sharing systems
  • No combination of cycling and rapid bus transit or rail systems)
  • No cycling/Walking culture
  • Other

Appendix C

Table A3. Total annual avoided PM2.5 and CO2 in Delhi based on reduced VKM [17,62,63,64,65,66,67].
Vehicle TypeTotal VKM Per Year (Millions)Reduced VKM (Millions)Reduced PM2.5 (Tons)Reduced CO2 (Kio Tons)
Car6358.93426.6964.0173.8
Motorcycle (2-wheeler)11,624.63780.0256.9535.6
Three wheelers2430.98163.1217.9512.1
Total20,414.531369.82138.9121.5

References

  1. Ramamoorthy, T.; Kulothungan, V.; Mathur, P. Prevalence and Correlates of Insufficient Physical Activity among Adults Aged 18–69 Years in India: Findings from the National Noncommunicable Disease Monitoring Survey. J. Phys. Act. Health 2022, 19, 150–159. [Google Scholar] [CrossRef] [PubMed]
  2. ICCT. Health Impacts of Air Pollution from Transportation Sources in Delhi. 2019. Available online: https://theicct.org/wp-content/uploads/2022/01/ICCT_factsheet_health_impact_airpollution_Delhi_20190705.pdf (accessed on 26 September 2022).
  3. WHO. Noncommunicable Diseases. 2022. Available online: https://www.who.int/news-room/fact-sheets/detail/noncommunicable-diseases (accessed on 26 September 2022).
  4. Devi, K.S.; Nilupher; Gupta, U.; Dhall, M.; Kapoor, S. Incidence of obesity, adiposity and physical activity pattern as risk factor in adults of Delhi, India. Clin. Epidemiol. Glob. Health 2020, 8, 8–12. [Google Scholar] [CrossRef] [Green Version]
  5. Strain, T.; Brage, S.; Sharp, S.J.; Richards, J.; Tainio, M.; Ding, D.; Benichou, J.; Kelly, P. Use of the prevented fraction for the population to determine deaths averted by existing prevalence of physical activity: A descriptive study. Lancet Glob. Health 2020, 8, e920–e930. [Google Scholar] [CrossRef]
  6. WHO. More Active People for a Healthier World. 2018. Available online: https://apps.who.int/iris/bitstream/handle/10665/272722/9789241514187-eng.pdf?ua=1 (accessed on 26 September 2022).
  7. Prasad, D.; Das, B. Physical Inactivity: A Cardiovascular Risk Factor. Indian J. Med. Sci. 2009, 63, 33–42. [Google Scholar] [CrossRef] [Green Version]
  8. Ogilvie, D.; Egan, M.; Hamilton, V.; Petticrew, M. Promoting walking and cycling as an alternative to using cars: Systematic review. BMJ 2004, 329, 763. [Google Scholar] [CrossRef] [Green Version]
  9. Ohta, M.; Mizoue, T.; Mishima, N.; Ikeda, M. Effect of the Physical Activities in Leisure Time and Commuting to Work on Mental Health. J. Occup. Health 2007, 49, 46–52. [Google Scholar] [CrossRef] [Green Version]
  10. Schuch, F.B.; Vancampfort, D.; Firth, J.; Rosenbaum, S.; Ward, P.B.; Silva, E.S.; Hallgren, M.; De Leon, A.P.; Dunn, A.L.; Deslandes, A.C.; et al. Physical activity and incident depression: A meta-analysis of prospective cohort studies. Am. J. Psychiatry 2018, 175, 631–648. [Google Scholar] [CrossRef]
  11. Rebar, A.L.; Stanton, R.; Geard, D.; Short, C.; Duncan, M.J.; Vandelanotte, C. A meta-meta-analysis of the effect of physical activity on depression and anxiety in non-clinical adult populations. Health Psychol. Rev. 2015, 9, 366–378. [Google Scholar] [CrossRef]
  12. WHO. Cycling and Walking can Help Reduce Physical Inactivity and Air Pollution, Save Lives and Mitigate Climate Change. 2022. Available online: https://www.who.int/europe/news/item/07-06-2022-cycling-and-walking-can-help-reduce-physical-inactivity-and-air-pollution--save-lives-and-mitigate-climate-change (accessed on 26 September 2022).
  13. Podder, V.; Nagarathna, R.; Anand, A.; Patil, S.S.; Singh, A.K.; Nagendra, H.R. Physical Activity Patterns in India Stratified by Zones, Age, Region, BMI and Implications for COVID-19: A Nationwide Study. Ann. Neurosci. 2021, 27, 193–203. [Google Scholar] [CrossRef]
  14. DTP. Vehicle Registration and Accident Statistics. 2018. Available online: https://delhitrafficpolice.nic.in/sites/default/files/uploads/2019/08/Chapter-2 Vehicle Registration and accident statistics.pdf (accessed on 25 September 2022).
  15. Department of Directorate of Economics & Statistics. Delhi Statistical Hand Book. 2020. Available online: http://des.delhigovt.nic.in/wps/wcm/connect/doit_des/DES/Our+Services/Statistical+Hand+Book/ (accessed on 2 October 2021).
  16. Government of NCT of Delhi. Delhi Electric Vehicles Policy. 2020. Available online: https://transport.delhi.gov.in/sites/default/files/All-PDF/Delhi_Electric_Vehicles_Policy_2020.pdf (accessed on 21 September 2021).
  17. Sahu, S.K.; Beig, G.; Parkhi, N.S. Emissions inventory of anthropogenic PM2.5 and PM10 in Delhi during Commonwealth Games 2010. Atmos. Environ. 2011, 45, 6180–6190. [Google Scholar] [CrossRef]
  18. Nagpure, A.S.; Gurjar, B.R.; Kumar, V.; Kumar, P. Estimation of exhaust and non-exhaust gaseous, particulate matter and air toxics emissions from on-road vehicles in Delhi. Atmos. Environ. 2016, 127, 118–124. [Google Scholar] [CrossRef]
  19. Murthy, B.S.; Latha, R.; Tiwari, A.; Rathod, A.; Singh, S.; Beig, G. Impact of mixing layer height on air quality in winter. J. Atmos. Solar-Terr. Phys. 2020, 197, 105157. [Google Scholar] [CrossRef]
  20. Arpan, C. Air Pollution in Delhi: Filling the Policy Gaps|ORF. 2020. Available online: https://www.orfonline.org/research/air-pollution-delhi-filling-policy-gaps/ (accessed on 30 September 2021).
  21. Krishna, B.; Mandal, S.; Madhipatla, K.; Reddy, K.S.; Prabhakaran, D.; Schwartz, J.D. Daily nonaccidental mortality associated with short-term PM2.5 exposures in Delhi, India. Environ. Epidemiol. 2021, 5, e167. [Google Scholar] [CrossRef] [PubMed]
  22. Dhar, S.; Pathak, M.; Shukla, P.R. Electric vehicles and India’s low carbon passenger transport: A long-term co-benefits assessment. J. Clean. Prod. 2017, 146, 139–148. [Google Scholar] [CrossRef] [Green Version]
  23. Gulia, S.; Mittal, A.; Khare, M. Quantitative evaluation of source interventions for urban air quality improvement—A case study of Delhi city. Atmos. Pollut. Res. 2018, 9, 577–583. [Google Scholar] [CrossRef]
  24. Farzaneh, H. Devising a Clean Energy Strategy for Asian Cities; Springer: Berlin/Heidelberg, Germany, 2018; pp. 1–222. [Google Scholar] [CrossRef]
  25. Biggar, M. Non-Motorized Transport: Walking and Cycling. In Sustainable Cities and Communities; Springer: Berlin/Heidelberg, Germany, 2020; pp. 1–10. [Google Scholar] [CrossRef]
  26. Lawson, A.R.; McMorrow, K.; Ghosh, B. Analysis of the non-motorized commuter journeys in major Irish cities. Transp. Policy 2013, 27, 179–188. [Google Scholar] [CrossRef]
  27. Farzaneh, H.; de Oliveira, J.A.P.; McLellan, B.; Ohgaki, H. Towards a Low Emission Transport System: Evaluating the Public Health and Environmental Benefits. Energies 2019, 12, 3747. [Google Scholar] [CrossRef] [Green Version]
  28. Pathak, M.; Shukla, P.R. Co-benefits of low carbon passenger transport actions in Indian cities: Case study of Ahmedabad. Transp. Res. Part D Transp. Environ. 2016, 44, 303–316. [Google Scholar] [CrossRef]
  29. Maizlish, N.; Woodcock, J.; Co, S.; Ostro, B.; Fanai, A.; Fairley, D. Health cobenefits and transportation-related reductions in greenhouse gas emissions in the San Francisco Bay Area. Am. J. Public Health 2013, 103, 703–709. [Google Scholar] [CrossRef]
  30. Lindsay, G.; Macmillan, A.; Woodward, A. Moving urban trips from cars to bicycles: Impact on health and emissions. Aust. N. Z. J. Public Health 2011, 35, 54–60. [Google Scholar] [CrossRef]
  31. Xia, T.; Nitschke, M.; Zhang, Y.; Shah, P.; Crabb, S.; Hansen, A. Traffic-related air pollution and health co-benefits of alternative transport in Adelaide, South Australia. Environ. Int. 2015, 74, 281–290. [Google Scholar] [CrossRef] [PubMed]
  32. Rojas-Rueda, D.; De Nazelle, A.; Andersen, Z.J.; Braun-Fahrländer, C.; Bruha, J.; Bruhova-Foltynova, H.; Desqueyroux, H.; Praznoczy, C.; Ragettli, M.S.; Tainio, M.; et al. Health Impacts of Active Transportation in Europe. PLoS ONE 2016, 11, e0149990. [Google Scholar] [CrossRef] [PubMed]
  33. Pisoni, E.; Christidis, P.; Navajas Cawood, E. Active mobility versus motorized transport? User choices and benefits for the society. Sci. Total Environ. 2022, 806, 150627. [Google Scholar] [CrossRef] [PubMed]
  34. Jain, D.; Tiwari, G. How the present would have looked like? Impact of non-motorized transport and public transport infrastructure on travel behavior, energy consumption and CO2 emissions—Delhi, Pune and Patna. Sustain. Cities Soc. 2016, 22, 1–10. [Google Scholar] [CrossRef]
  35. Allirani, H.; Verma, A.; Sasidharan, S. Benefits from Active Transportation—A Case Study of Bangalore Metropolitan Region. In Proceedings of the Sixth International Conference of Transportation Research Group of India, Tiruchirappalli, Tamil Nadu, 14–17 December 2021; pp. 19–29. [Google Scholar] [CrossRef]
  36. Goel, R.; Guttikunda, S.; Tiwari, G.; Goel, R.; Guttikunda, S.; Tiwari, G. Health modelling of transport in low-and-middle income countries: A case study of New Delhi, India. Act. Travel Stud. 2022, 2. [Google Scholar] [CrossRef]
  37. Woodcock, J.; Edwards, P.; Tonne, C.; Armstrong, B.G.; Ashiru, O.; Banister, D.; Beevers, S.; Chalabi, Z.; Chowdhury, Z.; Cohen, A.; et al. Public health benefits of strategies to reduce greenhouse-gas emissions: Urban land transport. Lancet 2009, 374, 1930–1943. [Google Scholar] [CrossRef]
  38. Thondoo, M.; Goel, R.; Tatah, L.; Naraynen, N.; Woodcock, J.; Nieuwenhuijsen, M. The Built Environment and Health in Low- and Middle-Income Countries: A Review on Quantitative Health Impact Assessments. Curr. Environ. Health Rep. 2021, 9, 90–103. [Google Scholar] [CrossRef]
  39. Mansfield, T.J.; Gibson, J.M.D. Estimating Active Transportation Behaviors to Support Health Impact Assessment in the United States. Front. Public Health 2016, 4, 63. [Google Scholar] [CrossRef] [Green Version]
  40. Ainsworth, B.E.; Haskell, W.L.; Herrmann, S.D.; Meckes, N.; Bassett, D.R.; Tudor-Locke, C.; Greer, J.L.; Vezina, J.; Whitt-Glover, M.C.; Leon, A.S. 2011 Compendium of Physical Activities: A second update of codes and MET values. Med. Sci. Sports Exerc. 2011, 43, 1575–1581. [Google Scholar] [CrossRef] [Green Version]
  41. Bhat, T.H.; Farzaneh, H. Quantifying the multiple environmental, health, and economic benefits from the electrification of the Delhi public transport bus fleet, estimating a district-wise near roadway avoided PM2.5 exposure. J. Environ. Manag. 2022, 321, 116027. [Google Scholar] [CrossRef]
  42. Ostro, B.; Prüss-üstün, A.; Campbell-lendrum, D.; Corvalán, C.; Woodward, A. Outdoor Air Pollution: Assessing the Environmental Burden of Disease at National and Local Levels; World Health Organization: Geneva, Switzerland, 2004. [Google Scholar]
  43. WHO. Global Recommendations on Physical Activity for Health; World Health Organization: Geneva, Switzerland, 2010; pp. 1–58. [Google Scholar]
  44. ICMR. India: Health of the Nation’s States The India State-Level Disease Burden Initiative (P55). 2017. Available online: https://www.healthdata.org/sites/default/files/files/policy_report/2017/India_Health_of_the_Nation%27s_States_Report_2017.pdf (accessed on 5 October 2022).
  45. Malhotra, R.K.; Manoharan, N.; Nair, O.; Deo, S.; Rath, G.K. Trends in Lung Cancer Incidence in Delhi, India 1988–2012: Age-Period-Cohort and Joinpoint Analyses. Asian Pac. J. Cancer Prev. 2018, 19, 1647. [Google Scholar] [CrossRef] [PubMed]
  46. Mathur, P.; Sathishkumar, K.; Chaturvedi, M.; Das, P.; Sudarshan, K.L.; Santhappan, S.; Nallasamy, V.; John, A.; Narasimhan, S.; Roselind, F.S. Cancer Statistics, 2020: Report From National Cancer Registry Programme, India. JCO Glob. Oncol. 2020, 6, 1063–1075. [Google Scholar] [CrossRef] [PubMed]
  47. Maji, K.J.; Dikshit, A.K.; Chaudhary, R. Human health risk assessment due to air pollution in the megacity Mumbai in India. Asian J. Atmos. Environ. 2017, 11, 61–70. [Google Scholar] [CrossRef]
  48. Maji, K.J.; Dikshit, A.K.; Deshpande, A. Disability-adjusted life years and economic cost assessment of the health effects related to PM2.5 and PM10 pollution in Mumbai and Delhi, in India from 1991 to 2015. Environ. Sci. Pollut. Res. 2017, 24, 4709–4730. [Google Scholar] [CrossRef] [PubMed]
  49. Prabhakaran, D.; Jeemon, P.; Roy, A. Cardiovascular Diseases in India. Circulation 2016, 133, 1605–1620. [Google Scholar] [CrossRef] [PubMed]
  50. Sreeniwas Kumar, A.; Sinha, N. Cardiovascular disease in India: A 360 degree overview. Med. J. Armed Forces India 2020, 76, 1–3. [Google Scholar] [CrossRef]
  51. Patankar, A.M.; Trivedi, P.L. Monetary burden of health impacts of air pollution in Mumbai, India: Implications for public health policy. Public Health 2011, 125, 157–164. [Google Scholar] [CrossRef]
  52. Singh, P.K. What Is the Cost of Cancer Care in India?—The Week. The Week. 2020. Available online: https://www.theweek.in/news/health/2020/02/26/what-is-the-cost-of-cancer-care-in-india.html (accessed on 30 November 2021).
  53. Srivastava, A.; Kumar, R. Economic valuation of health impacts of air pollution in Mumbai. Environ. Monit. Assess. 2002, 75, 135–143. [Google Scholar] [CrossRef]
  54. Tharkar, S.; Devarajan, A.; Kumpatla, S.; Viswanathan, V. The socioeconomics of diabetes from a developing country: A population based cost of illness study. Diabetes Res. Clin. Pract. 2010, 89, 334–340. [Google Scholar] [CrossRef]
  55. Kumar, A.; Siddharth, V.; Singh, S.I.; Narang, R. Cost analysis of treating cardiovascular diseases in a super-specialty hospital. PLoS ONE 2022, 17, e0262190. [Google Scholar] [CrossRef]
  56. Nagarathna, R.; Madhava, M.; Patil, S.S.; Singh, A.; Perumal, K.; Ningombam, G.; Nagendra, A.H.R. Cost of Management of Diabetes Mellitus: A Pan India Study. Ann. Neurosci. 2021, 27, 190–192. [Google Scholar] [CrossRef] [PubMed]
  57. Sarkar, S.; Mathan, K.; Sakey, S.; Shaik, S.; Subramanian, K.; Kattimani, S. Cost-of-treatment of clinically stable severe mental lilnesses in India. Indian J. Soc. Psychiatry 2017, 33, 262. [Google Scholar] [CrossRef]
  58. Nair, K.S.; Raj, S.; Tiwari, V.K.; Piang, L.K. Cost of Treatment for Cancer: Experiences of Patients in Public Hospitals in India. 2013. Available online: https://koreascience.kr/article/JAKO201305981337094.pdf (accessed on 27 September 2022).
  59. Hosmer, D.W.; Lemeshow, S.; Sturdivant, R.X. Applied Logistic Regression, 3rd ed.; John Wiley & Sons: Hoboken, NJ, USA, 2013; pp. 1–510. [Google Scholar] [CrossRef]
  60. Gum, A.M.; Areán, P.A.; Hunkeler, E.; Tang, L.; Katon, W.; Hitchcock, P.; Steffens, D.C.; Dickens, J.; Unützer, J. Depression Treatment Preferences in Older Primary Care Patients. Gerontologist 2006, 46, 14–22. [Google Scholar] [CrossRef] [PubMed]
  61. Angelucci, M.; Bennett, D. The Economic Impact of Depression Treatment in India. 2021. Available online: www.iza.org (accessed on 27 September 2022).
  62. DES. Profile of Delhi: National Capital Territory—DELHI. 2021. Available online: http://des.delhigovt.nic.in/DoIT/DOIT_DM/district profile.pdf (accessed on 15 October 2022).
  63. CEIC. Length of Roads: Delhi|Economic Indicators | CEIC. 2019. Available online: https://www.ceicdata.com/en/india/roads-and-highways-statistics-length-of-roads-by-state/length-of-roads-delhi (accessed on 4 October 2022).
  64. Gupta, S.; Dameniya, S. Rapid Assessment of Travel Patterns in Delhi—Horizon Year 2030 & 2050. 2017. Available online: https://www.toi.no/getfile.php/1348336-1530707950/Publikasjoner/DELHI_%20Revised%20Rapid_Demand_Estimation.pdf (accessed on 10 October 2022).
  65. ARAI. Air Quality Monitoring Project-Indian Clean Air Programme (ICAP). 2008. Available online: https://cpcb.nic.in/displaypdf.php?id=RW1pc3Npb25fRmFjdG9yc19WZWhpY2xlcy5wZGY= (accessed on 2 October 2022).
  66. NHTS. Average Vehicle Occupancy by Mode and Purpose. 2009. Available online: https://nhts.ornl.gov/tables09/fatcat/2009/avo_TRPTRANS_WHYTRP1S.html (accessed on 2 October 2022).
  67. Mohan, D. Seat Belt Law and Road Traffic Injuries in Delhi, India. In Proceedings of the 8th International Conference of Eastern Asia Society for Transportation Studies 2009, Surabaya, Indonesia, 16–18 November 2009. [Google Scholar]
Figure 1. Integrated quantitative approach used in this study.
Ijerph 19 14974 g001
Figure 2. The heatmaps of avoided PM2.5 exposure in the selected traffic zones in different districts in Delhi.
Ijerph 19 14974 g002
Figure 3. Estimated annual mortalities per km2 from (a) increased physical activity and (b) near-roadway-avoided PM2.5 exposure.
Ijerph 19 14974 g003
Table 1. Baseline incident rates of diseases in India (Delhi).
Mortality/MorbidityBaseline Incidence per 100,000
Total mortality 11013
COPD prevalence rate 2818
Type 2 diabetes prevalence rate 2784
Respiratory disease rate 2608
Depressive disorder rate 2633
Diabetes mortality rate 218
Ischemic/Coronary heart disease prevalence rate 22321
Cardiovascular mortality 1497
Respiratory mortality 166
Cancer prevalence rate 498.8
Lung cancer prevalence rate (LC) 39.06
1 From [38,39]. 2 Form [44]. 3 From [45]. 4 From [46].
Table 2. Values of the health endpoints used in this study.
Health EndpointValuation (USD) with a Yearly 10% Increase in the Cost of TreatmentMethod of Cost Calculation
Total mortality279,411VSL approach [41]
COPD hospital admissions345CoI approach [51]
Respiratory disease hospital admissions80CoI approach [51]
LC1886CoI approach [52]
Type 2 diabetes23,862[52,53,54]
Coronary heart diseases3842[55]
Depression110[55,56,57]
Cancer1065[58]
Table 3. Estimated coefficients β ^ obtained from LR models along with OR and p-value 1.
CovariatesWillingness to WalkWillingness to Use Bicycle
β ^ ORp-Value β ^ ORp-Value
Intercept−0.3280.7200.6370.3421.4080.696
Regular travel mode
   Public transport(RC 2)(RC)(RC)(RC)(RC)(RC)
   Private car−1.4210.241<0.001−0.7400.4770.035
   Motorcycle−0.8530.4260.018−0.6920.5010.042
Distance to cover
   Short distance(RC)(RC)(RC)(RC)(RC)(RC)
   Long distance0.1021.1070.7411.1723.2280.066
Monthly Income
   Low0.1471.1580.716−0.0170.9830.963
   Medium(RC)(RC)(RC)(RC)(RC)(RC)
   High1.4824.4020.0050.6031.8280.242
Education level
   Illiterate1.2613.5290.0231.0892.9710.041
   Primary to secondary(RC)(RC)(RC)(RC)(RC)(RC)
   Higher education0.7792.1790.0510.3211.3790.351
Age group
   Young(RC)(RC)(RC)(RC)(RC)(RC)
   Middle-aged−1.0110.3640.102−2.2330.1070.002
   Old−0.9610.3830.193−2.9250.054<0.001
Gender
   Male0.3711.4490.2640.5571.7450.076
   Female(RC)(RC)(RC)(RC)(RC)(RC)
McFadden s   R 2 0.1120.100
Cox - Snell   R 2 0.1280.120
Tjur s   R 2 0.1400.124
p-value of the Hosmer–Lemeshow test0.66 (>0.05)0.19 (>0.05)
1 Obtained from the Wald test; 2 reference category.
Table 4. Per-hour-avoided VKM and average near-roadway-avoided PM2.5 exposure in different districts in Delhi.
DistrictTraffic
Zone
Per-Hour-Avoided VKMNear-Roadway-Avoided Concentration (µg/m3)
1. Northwest Rohtak Road261.30.62
2. South Aurbindo Marg235.30.62
3. West Mahatma Gandhi Marg232.90.62
4. Southwest Azad Hind Fauz Marg172.20.52
5. Northeast Wazirabad Road226.30.60
6. East Vikas Marg167.70.52
7. North GT Karnal Road200.90.56
8. Central Bahadur Shah Zafar Marg69.60.45
9. New DelhiVandemataram Marg173.10.52
10. Southeast Mathura Road291.70.59
11. Shahdara Chaudhary Charan Singh Marg (AV)322.80.64
Table 5. RR values per moderate PA extracted from the meta-analysis.
Avoided All-Cause MortalityCoronary Heart DiseasesDepressionDiabetesCancer
Pooled value of RR with 95% CI0.780.850.810.810.88
Table 6. RR values per 10 μg reduction in PM2.5 concentration extracted from the meta-analysis.
Avoided All-Cause MortalityRespiratory
Mortality
Respiratory-Disease-Related Hospital AdmissionsCOPDCardiovascular
Mortality
LC
Pooled value of RR with 95% CI1.00691.00771.01141.01731.00761.0472
Table 7. Avoided morbidities (1 km2) with increased physical activity decreased near-roadway PM2.5 exposure.
DistrictCVD DepressionType 2 DiabetesCancerCOPDLCHARMCVM
Northwest 13.934.986.160.460.0040.0010.0450.0030.018
South 18.676.678.260.620.0050.0010.0590.0040.024
West 33.0311.814.621.090.0090.0010.1040.0060.041
Southwest 9.193.284.070.30.0020.0010.0250.0020.01
Northeast 61.0521.8227.022.020.0160.0020.1920.0110.076
East 45.8116.3720.281.520.010.0010.1210.0070.048
North 24.588.7810.880.810.0060.0010.0710.0040.028
Central 46.8216.7320.721.550.0090.0010.1090.0060.043
New Delhi6.852.443.030.220.0020.0010.0180.0010.008
Southeast 25.339.0511.210.840.0060.0010.0730.0040.029
Shahdara 9.193.284.070.30.0030.0010.030.0020.012
Table 8. Total avoided mortality, morbidity, and economic impacts of improved PA and near-roadway-avoided PM2.5 exposure resulting from implementing NMT in Delhi.
MortalityMorbiditiesEconomic Impacts
All-Cause Mortality (PA and AP)CHDDepressionType 2 DiabetesCancerCOPDLCHAAvoided Cost (Million USD)
1752939,70714,19017,5751319201.82484869.8
Publisher’s Note: MDPI stays neutral with regard to jurisdictional claims in published maps and institutional affiliations.