

Nationwide Long-Term Evaluation of Polypharmacy Reduction Policies Focusing on Older Adults in Japan

Abstract
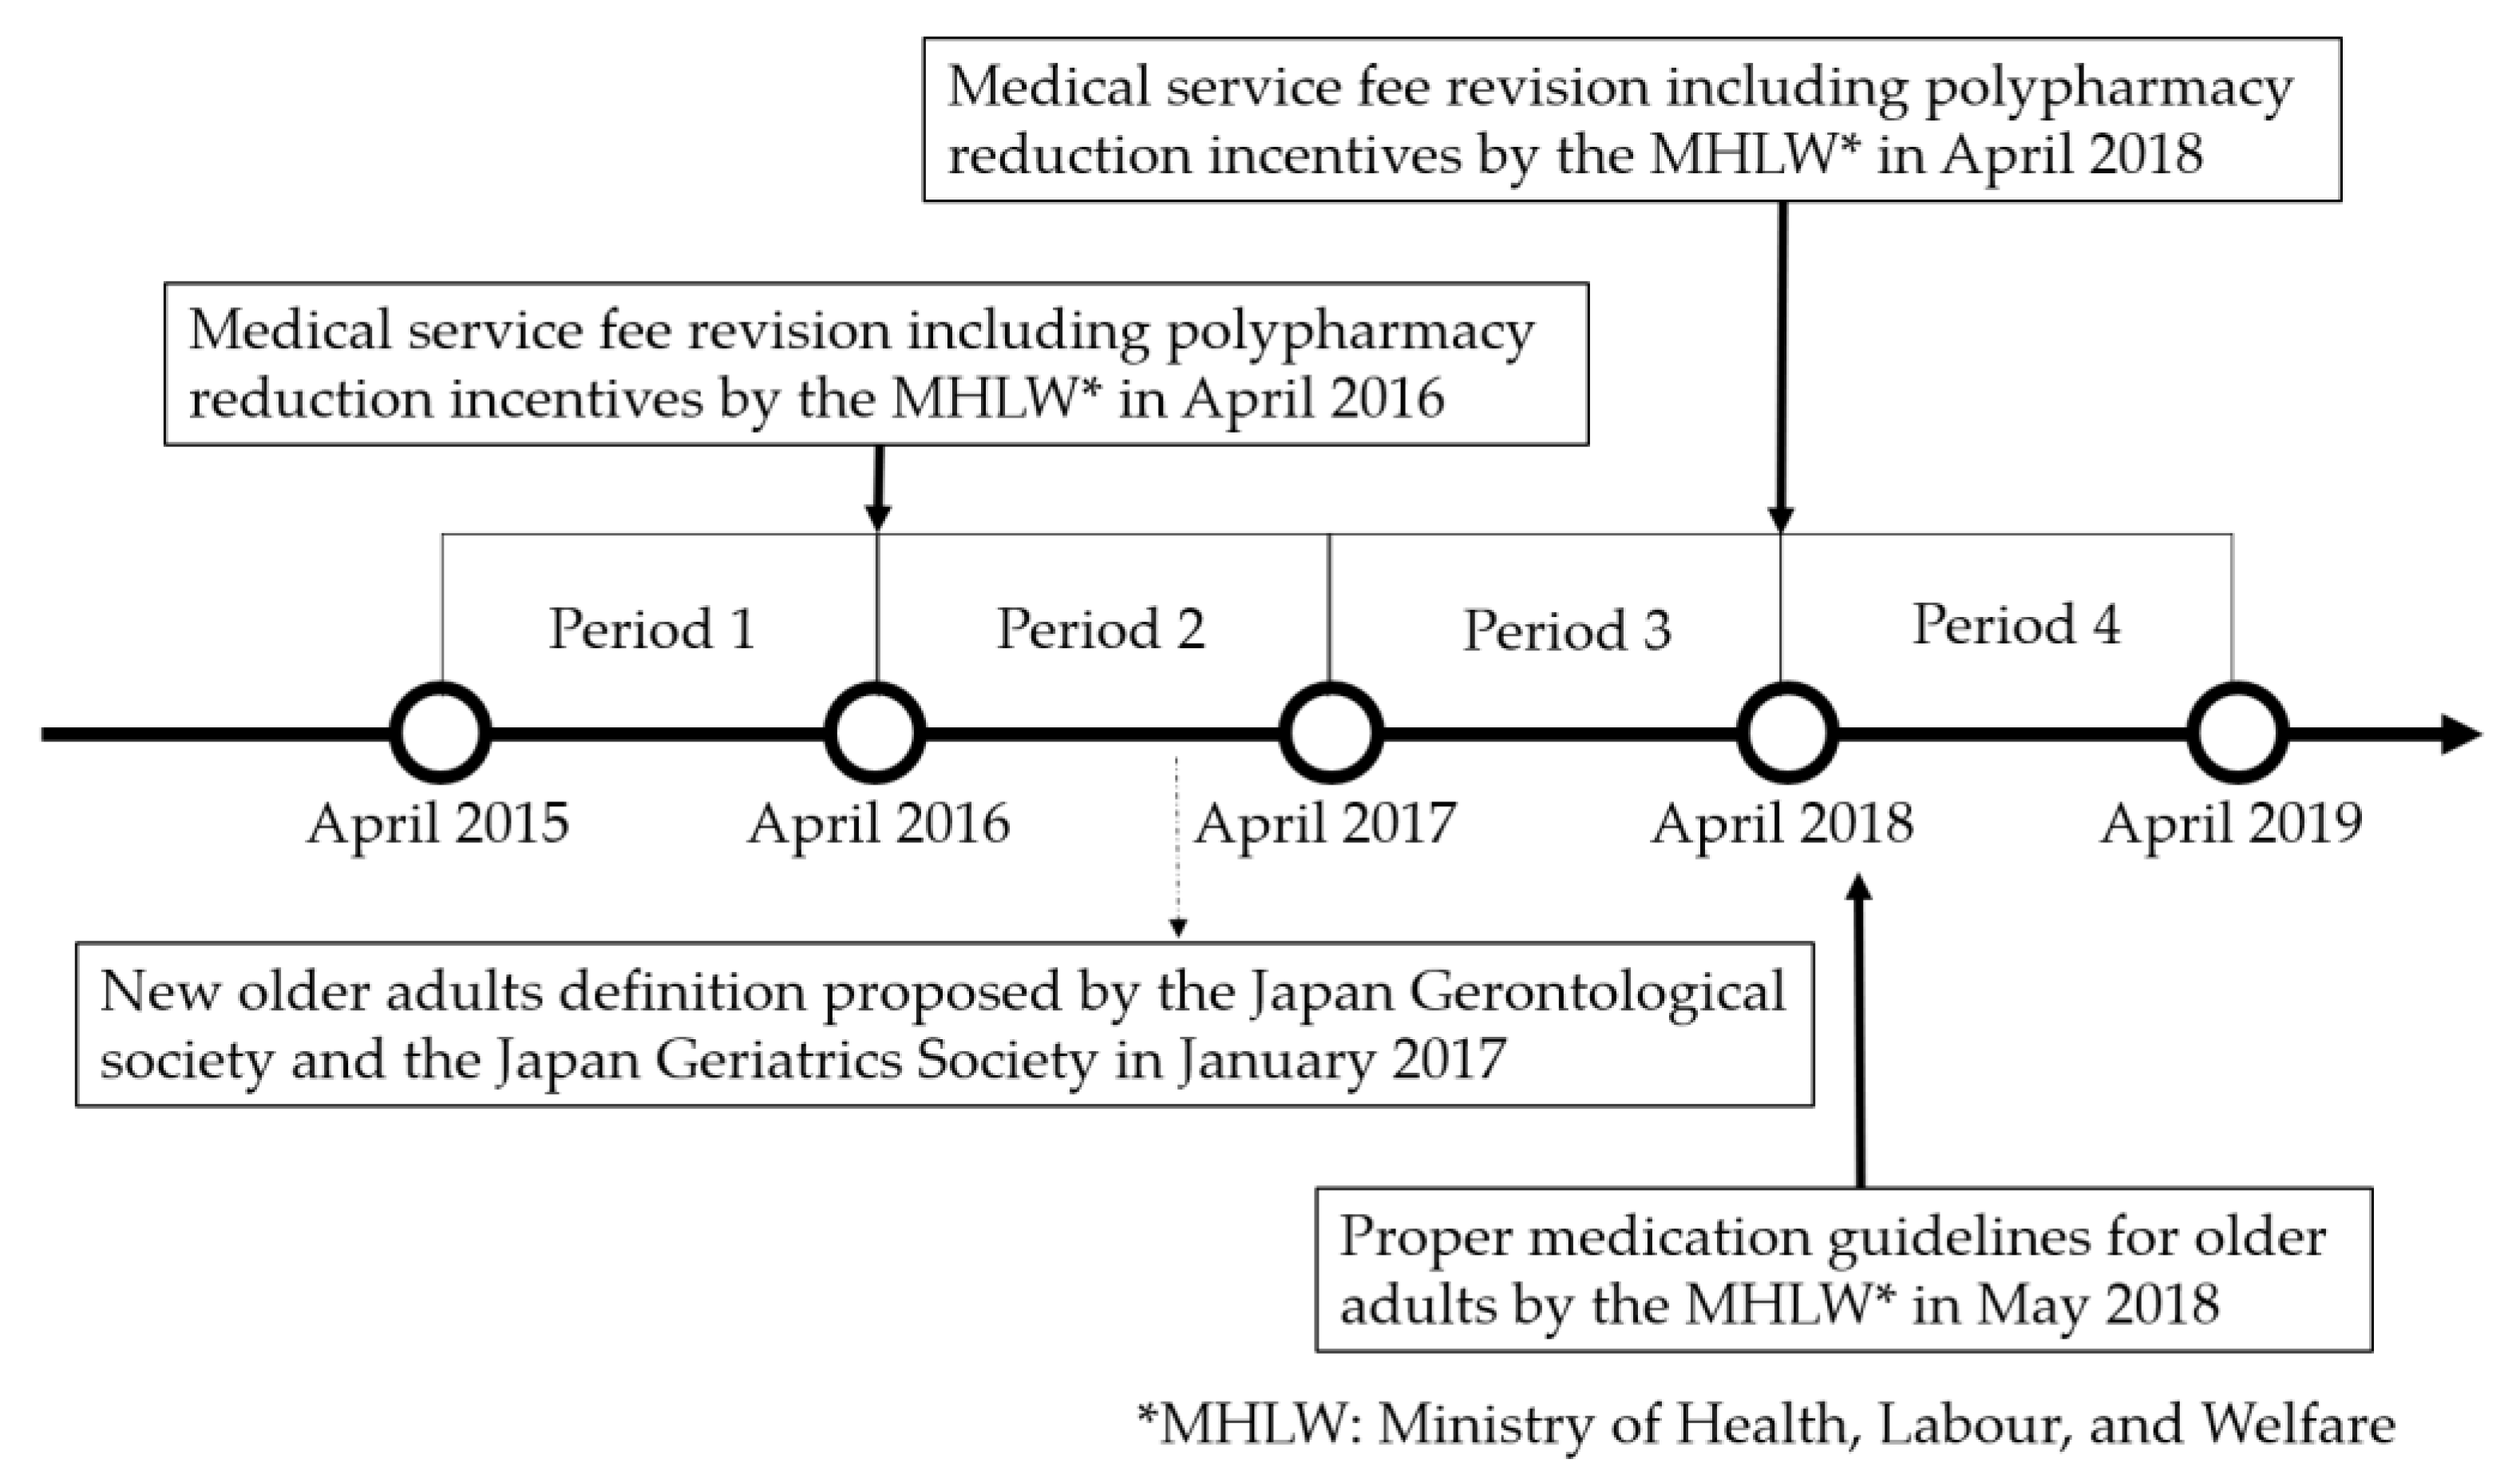
1. Introduction
2. Methods
2.1. Study Design and Primary Data Source
2.2. Data Selection
2.3. Outcome Variable
2.4. Independent Variables
2.5. Statistical Analysis
2.6. Ethical Statement
3. Results
3.1. PP Trends (April 2015–March 2019)
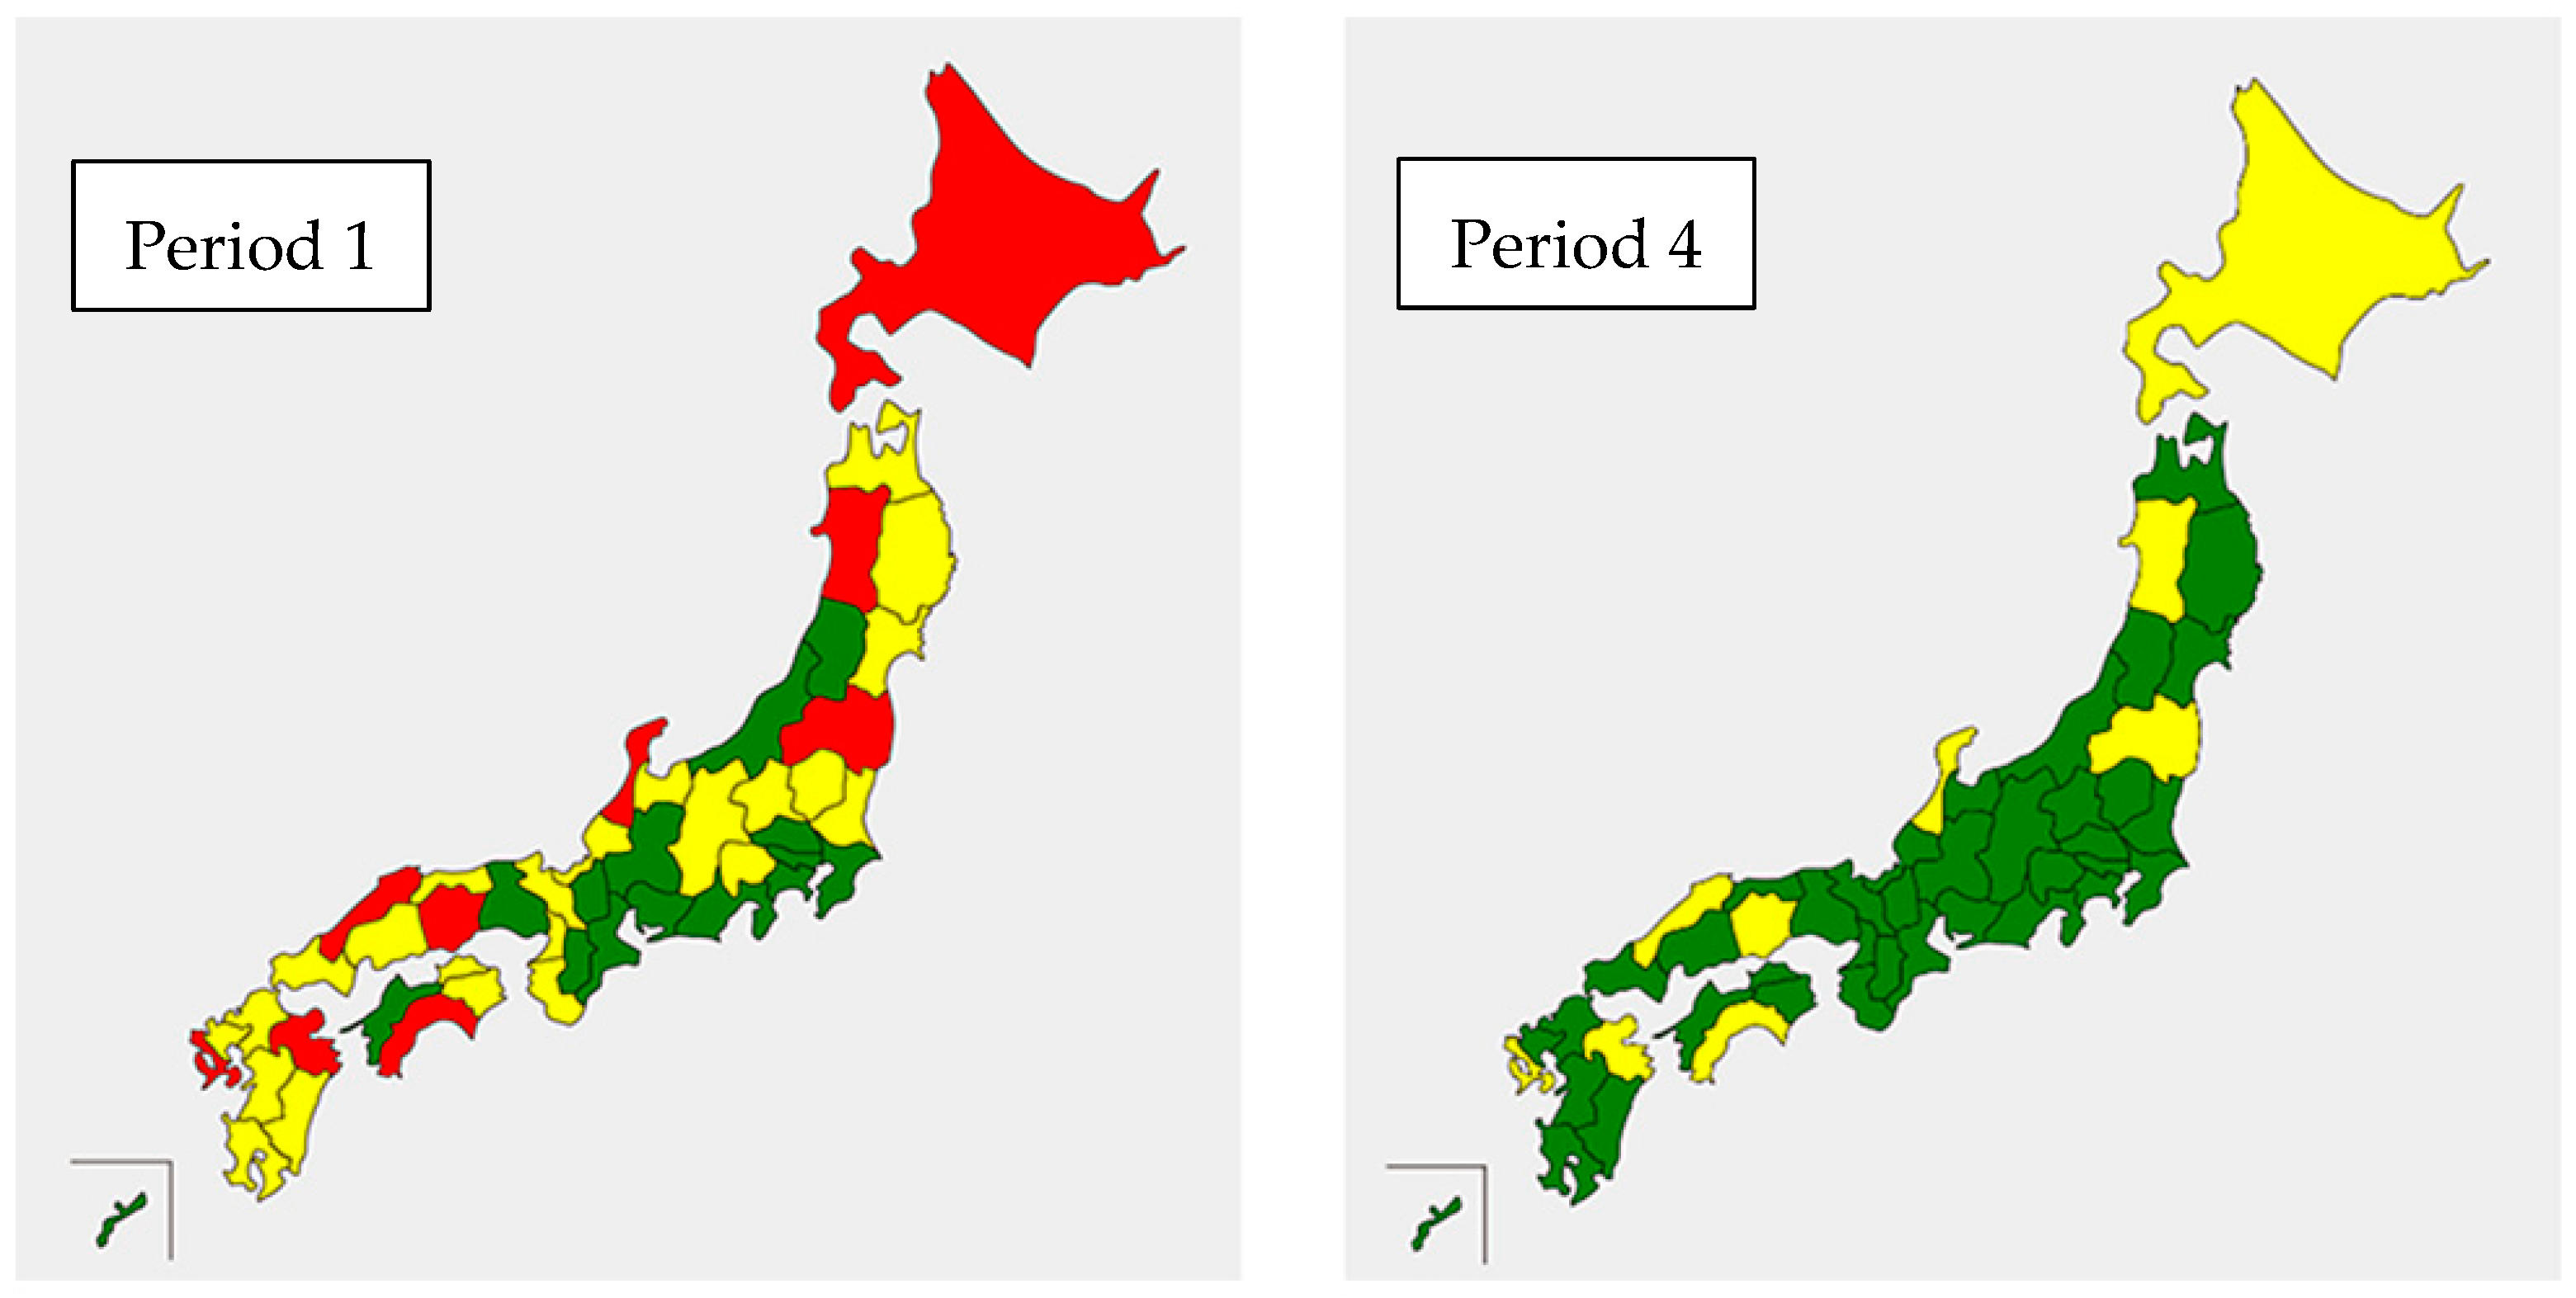
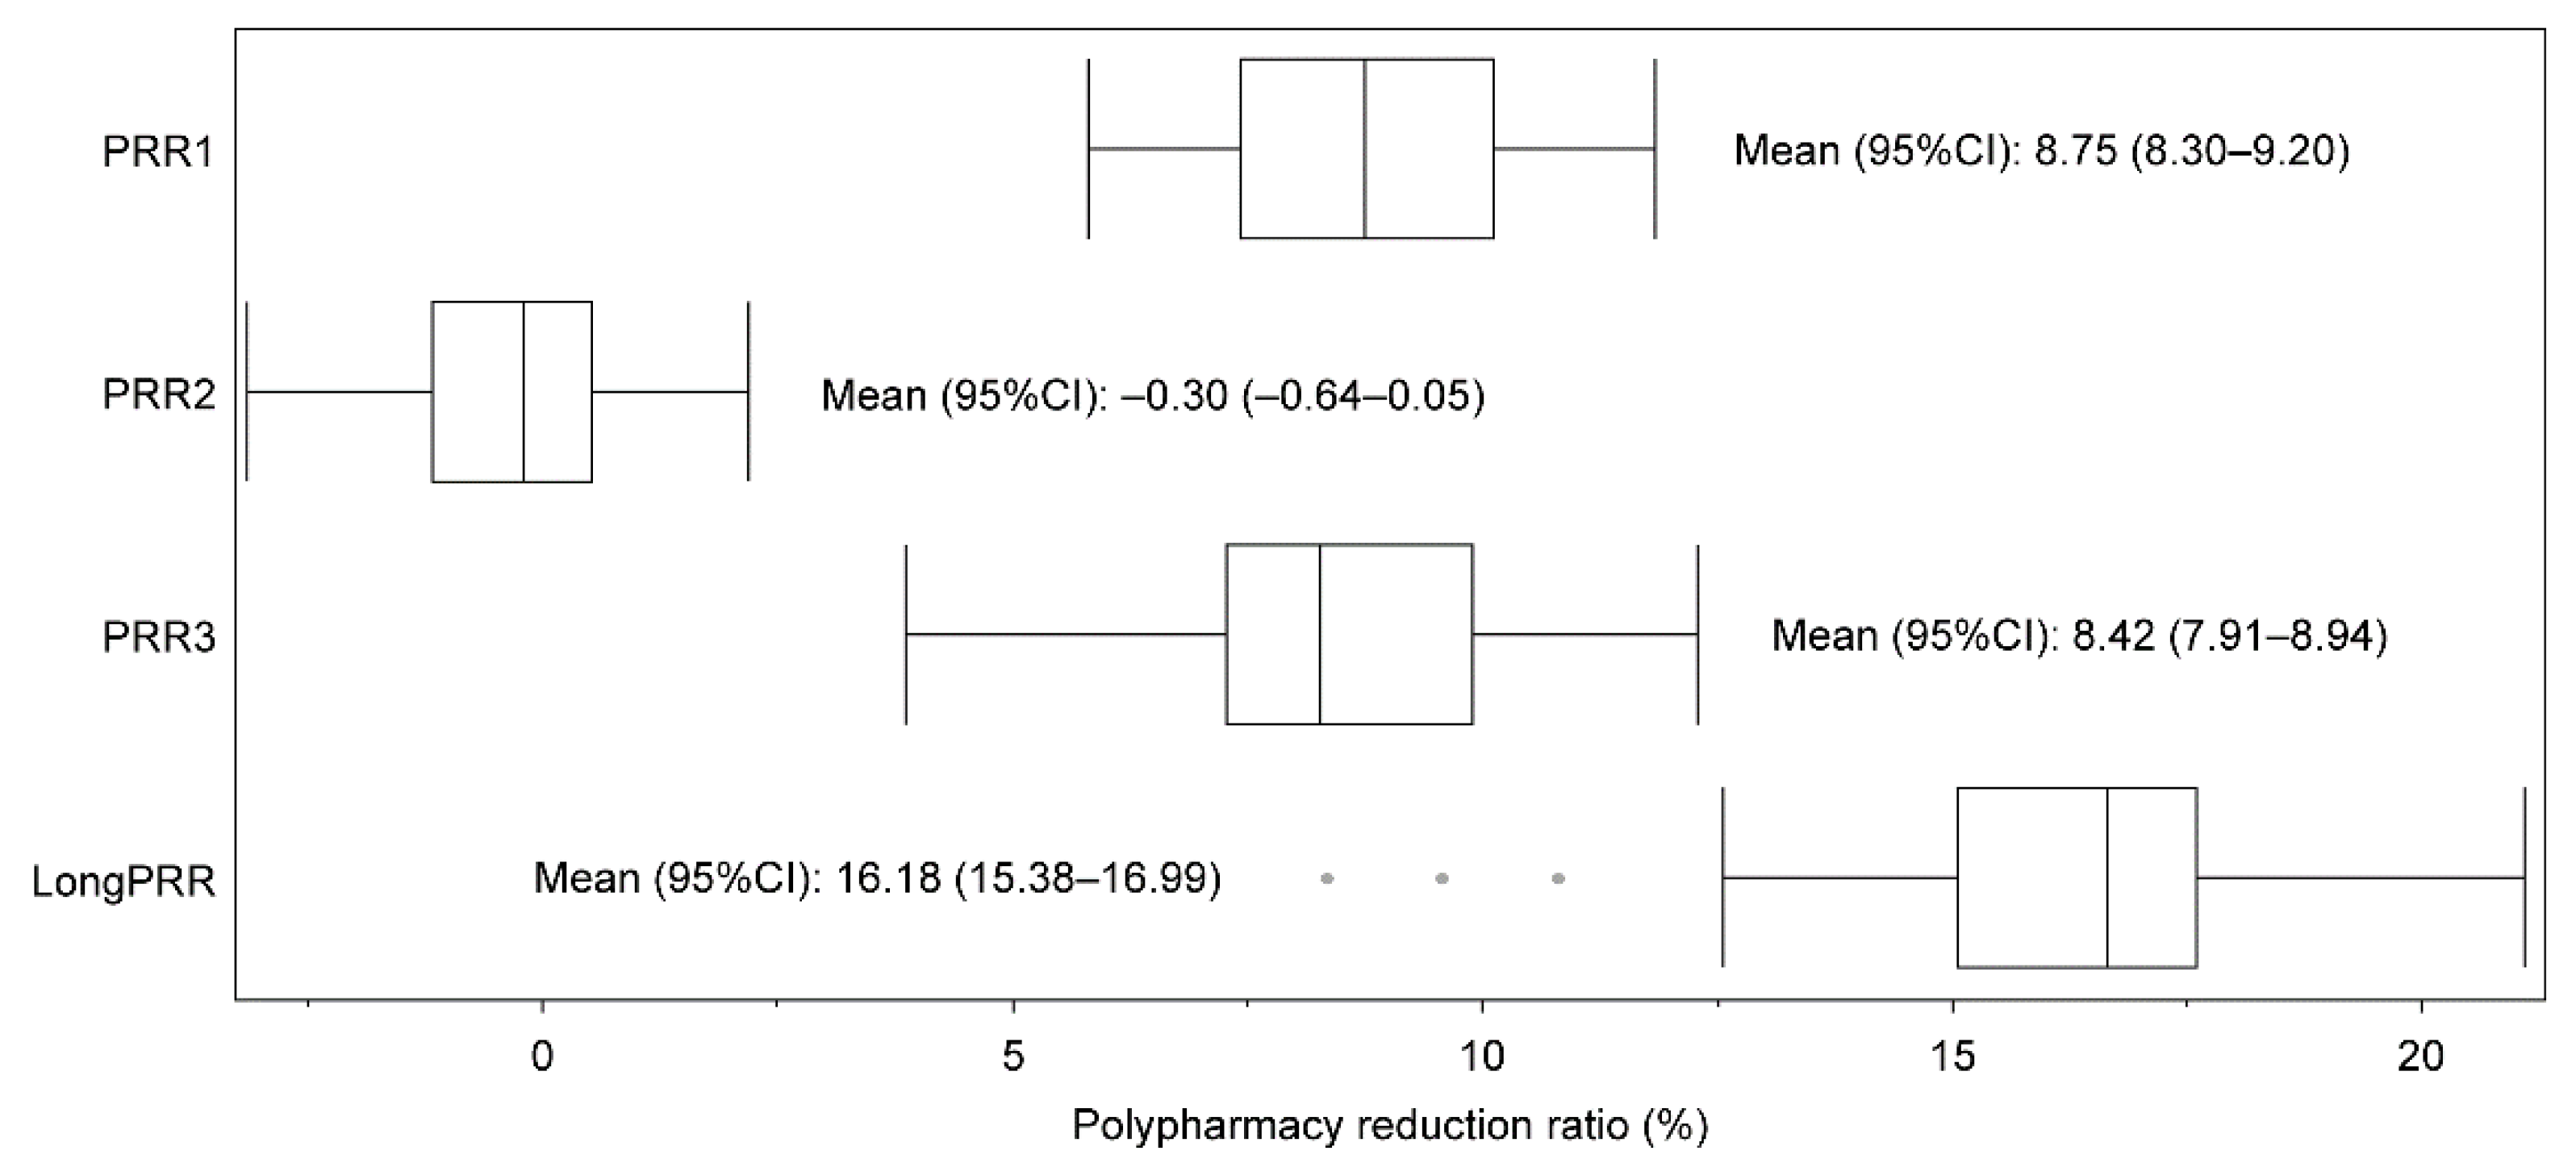
3.2. PRR Trends (April 2015–March 2019)
3.3. Associated Factor Analysis for Long-Term Polypharmacy Reduction Ratio over Four Years
4. Discussion
4.1. Key Findings
4.2. Strengths and Limitations
4.3. Future Perspectives
5. Conclusions
Supplementary Materials
Author Contributions
Funding
Institutional Review Board Statement
Informed Consent Statement
Data Availability Statement
Conflicts of Interest
References
- Leelakanok, N.; Holcombe, A.L.; Lund, B.C.; Gu, X.; Schweizer, M.L. Association between polypharmacy and death: A systematic review and meta-analysis. J. Am. Pharm. Assoc. 2017, 57, 729–738.e10. [Google Scholar] [CrossRef] [PubMed]
- Onoue, H.; Koyama, T.; Zamami, Y.; Hagiya, H.; Tatebe, Y.; Mikami, N.; Shinomiya, K.; Kitamura, Y.; Hinotsu, S.; Sendo, T.; et al. Trends in polypharmacy in Japan: A nationwide retrospective study. J. Am. Geriatr. Soc. 2018, 66, 2267–2273. [Google Scholar] [CrossRef]
- Page, A.T.; Falster, M.O.; Litchfield, M.; Pearson, S.A.; Etherton-Beer, C. Polypharmacy among older Australians, 2006–2017: A population-based study. Med. J. Aust. 2019, 211, 71–75. [Google Scholar] [CrossRef] [PubMed]
- Zhang, N.; Sundquist, J.; Sundquist, K.; Ji, J. An increasing trend in the prevalence of polypharmacy in Sweden: A nationwide register-based study. Front. Pharmacol. 2020, 11, 326. [Google Scholar] [CrossRef] [PubMed]
- Jokanovic, N.; Tan, E.C.; Dooley, M.J.; Kirkpatrick, C.M.; Bell, J.S. Prevalence and factors associated with polypharmacy in long-term care facilities: A systematic review. J. Am. Med. Dir. Assoc. 2015, 16, 535.e1–535.e12. [Google Scholar] [CrossRef] [PubMed]
- Ministry of Internal Affairs and Communications. 2015 National Census Report in Japan. Available online: https://www.stat.go.jp/data/kokusei/2015/kekka/kihon1/pdf/gaiyou1.pdf (accessed on 27 July 2022).
- Kojima, T.; Akishita, M.; Nakamura, T.; Nomura, K.; Ogawa, S.; Iijima, K.; Eto, M.; Ouchi, Y. Polypharmacy as a risk for fall occurrence in geriatric outpatients. Geriatr. Gerontol. Int. 2012, 12, 425–430. [Google Scholar] [CrossRef] [PubMed]
- Ouchi, Y.; Rakugi, H.; Arai, H.; Akishita, M.; Ito, H.; Toba, K.; Kai, I. Redefining the elderly as aged 75 years and older: Proposal from the Joint Committee of Japan Gerontological Society and the Japan Geriatrics Society. Geriatr. Gerontol. Int. 2017, 17, 1045–1047. [Google Scholar] [CrossRef] [PubMed]
- Mabuchi, T.; Hosomi, K.; Yokoyama, S.; Takada, M. Polypharmacy in elderly patients in Japan: Analysis of Japanese real-world databases. J. Clin. Pharm. Ther. 2020, 45, 991–996. [Google Scholar] [CrossRef] [PubMed]
- Ministry of Health, Labour and Welfare. Proper Medication Guideline for Older Adults. Available online: https://www.mhlw.go.jp/content/11121000/kourei-tekisei_web.pdf (accessed on 27 July 2022). (In Japanese)
- Chau, S.H.; Jansen, A.P.; van de Ven, P.M.; Hoogland, P.; Elders, P.J.; Hugtenburg, J.G. Clinical medication reviews in elderly patients with polypharmacy: A cross-sectional study on drug-related problems in the Netherlands. Int. J. Clin. Pharm. 2016, 38, 46–53. [Google Scholar] [CrossRef] [PubMed]
- Sakoi, M. Mechanism of medical reimbursement and revisions. J. Jpn. Soc. Intern. Med. 2016, 105, 2320–2329. Available online: https://www.jstage.jst.go.jp/article/naika/105/12/105_2320/_pdf (accessed on 27 July 2022). (In Japanese). [CrossRef]
- Ministry of Health, Labour and Welfare. The 2016 Revision of Medical Fees. Available online: https://www.mhlw.go.jp/stf/seisakunitsuite/bunya/0000106421.html (accessed on 27 July 2022). (In Japanese)
- Ministry of Health, Labour and Welfare. The 2018 Revision of Medical Fees. Available online: https://www.mhlw.go.jp/stf/seisakunitsuite/bunya/0000188411.html (accessed on 27 July 2022). (In Japanese)
- Kojima, T. Basic concepts and resolution for polypharmacy. J. Jpn. Geriatr. Soc. 2019, 56, 442–448. (In Japanese) [Google Scholar] [CrossRef]
- Japanese Medical and Dental Practitioners for the Improvement of Medical Care (Hodanren). The Trend of Total Medical Costs and Medication Fees through 2000–2017. Available online: https://hodanren.doc-net.or.jp/news/tyousa/181115_srh_med.pdf (accessed on 27 July 2022). (In Japanese).
- Ishida, T.; Yamaoka, K.; Suzuki, A.; Nakata, Y. Effectiveness of polypharmacy reduction policy in Japan: Nationwide retrospective observational study. Int. J. Clin. Pharm. 2022, 44, 357–365. [Google Scholar] [CrossRef] [PubMed]
- Okada, Y.; Akazawa, M. Effects of medical service fee revision on reducing irrational psychotropic polypharmacy in Japan: An interrupted time-series analysis. Soc. Psychiatry Psychiatr. Epidemiol. 2022, 57, 411–422. [Google Scholar] [CrossRef] [PubMed]
- Hirose, N.; Ishimaru, M.; Morita, K.; Yasunaga, H. A review of studies using the Japanese national database of health insurance claims and specific health checkups. Ann. Clin. Epidemiol. 2020, 2, 13–26. [Google Scholar] [CrossRef]
- Ministry of Health, Labour and Welfare. The Manual for Researchers to Consider NDB Utilization. Available online: https://www.mhlw.go.jp/content/12400000/000950356.pdf (accessed on 27 July 2022). (In Japanese)
- Ministry of Health, Labour and Welfare. The Official Website of NDB Open Data. Available online: https://www.mhlw.go.jp/stf/seisakunitsuite/bunya/0000177182.html (accessed on 27 July 2022). (In Japanese)
- Ministry of Health, Labour and Welfare. The 2014 Revision of Medical Fees. Available online: https://www.mhlw.go.jp/stf/seisakunitsuite/bunya/0000032996.html (accessed on 27 July 2022). (In Japanese)
- Ministry of Internal Affairs and Communications. e-Stat. Available online: https://www.e-stat.go.jp/ (accessed on 27 July 2022).
- Ministry of Health, Labour and Welfare. List of Health, Labour and Welfare Statistics. Available online: https://www.mhlw.go.jp/toukei/itiran/index.html (accessed on 27 July 2022).
- Ministry of Education, Culture, Sports, Science and Technology and Ministry of Health, Labour and Welfare. Ethical Guidelines for Medical and Health Search Involving Human Subjects. Available online: https://www.mhlw.go.jp/file/06-Seisakujouhou-10600000-Daijinkanboukouseikagakuka/0000080278.pdf (accessed on 27 July 2022).
- STROBE. STROBE Statement—Checklist of Items That Should Be Included in Reports of Observational Studies. Available online: https://www.strobe-statement.org/fileadmin/Strobe/uploads/checklists/STROBE_checklist_v4_combined.pdf (accessed on 27 July 2022).
- Hashimoto, R.; Fujii, K.; Shimoji, S.; Utsumi, A.; Hosokawa, K.; Tochino, H.; Sanehisa, S.; Akishita, M.; Onda, M. Study of pharmacist intervention in polypharmacy among older patients: Non-randomized, controlled trial. Geriatr. Gerontol. Int. 2020, 20, 229–237. [Google Scholar] [CrossRef] [PubMed]
- Nind, J.; Smith, A.; Devananda, M.; Auvray, B. A whole of population retrospective observational study on the rates of polypharmacy in New Zealand 2014 to 2018 Polypharmacy in New Zealand: What is the current status? Health. Sci. Rep. 2021, 4, e263. [Google Scholar] [CrossRef] [PubMed]
- Wang, Y.J.; Chiang, S.C.; Lee, P.C.; Chen, Y.C.; Chou, L.F.; Chou, Y.C.; Chen, T.J. Is excessive polypharmacy a transient or persistent phenomenon? A nationwide cohort study in Taiwan. Front. Pharmacol. 2018, 9, 120. [Google Scholar] [CrossRef] [PubMed]
- Verdoorn, S.; van de Pol, J.; Hövels, A.M.; Kwint, H.F.; Blom, J.W.; Gussekloo, J.; Bouvy, M.L. Cost-utility and cost-effectiveness analysis of a clinical medication review focused on personal goals in older persons with polypharmacy compared to usual care: Economic evaluation of the DREAMeR study. Br. J. Clin. Pharmacol. 2021, 87, 588–597. [Google Scholar] [CrossRef] [PubMed]
- Kievit, R.A.; Frankenhuis, W.E.; Waldorp, L.J.; Borsboom, D. Simpson’s paradox in psychological science: A practical guide. Front. Psychol. 2013, 4, 513. [Google Scholar] [CrossRef] [PubMed]
- Mizuno, K.; Inose, R.; Matsui, Y.; Takata, M.; Yamasaki, D.; Kusama, Y.; Koizumi, R.; Ishikane, M.; Tanabe, M.; Ohge, H.; et al. Search for indexes to evaluate trends in antibiotic use in the sub-prefectural regions using the National Database of Health Insurance Claims and Specific Health Checkups of Japan. Antibiotics 2022, 11, 763. [Google Scholar] [CrossRef] [PubMed]


| X §/Y ¶ (Population ‡) | Period 1 † | Period 2 † | Period 3 † | Period 4 † |
|---|---|---|---|---|
| Total-population (All ages) | 246/5984 (126.8) | 226/6019 (126.9) | 229/6099 (126.7) | 212/6148 (126.4) |
| Male (All ages) | 235/5349 (61.7) | 220/5393 (61.8) | 225/5477 (61.7) | 210/5522 (61.5) |
| Female (All ages) | 255/6585 (65.2) | 233/6613 (65.2) | 234/6689 (65.0) | 213/6741 (64.9) |
| Young (Under 65 years) | 74/4182 (93.0) | 68/4221 (92.4) | 70/4298 (91.6) | 65/4353 (90.9) |
| Pre-old (65–74 years) | 418/8961 (17.5) | 380/8801 (17.7) | 377/8768 (17.7) | 345/8704 (17.6) |
| Old (75–89 years) | 1024/13,207 (14.5) | 917/13,080 (15.0) | 900/12,988 (15.4) | 806/12,881 (15.8) |
| Super-old (90 years and above) | 1139/11,718 (1.8) | 1044/11,877 (1.9) | 1046/11,736 (2.1) | 939/11,565 (2.2) |
| PP (Period 1) | PP (Period 2) | PP (Period 3) | PP (Period 4) | |
|---|---|---|---|---|
| 2015/4–2016/3 | 2016/4–2017/3 | 2017/4–2018/3 | 2018/4–2019/3 | |
| Mean (95% CI) (%) | 4.40 (4.21–4.59) | 4.01 (3.84–4.18) | 4.02 (3.85–4.18) | 3.68 (3.53–3.83) |
| Difference (95% CI) (%) | Reference | −0.39 (−0.42–−0.36) | −0.38 (−0.42–−0.34) | −0.72 (−0.77–−0.66) |
| p-value | NA | <0.0001 * | <0.0001 * | <0.0001 * |
| PRR 1 | PRR 2 | PRR 3 | PRR (Long Term) | |
|---|---|---|---|---|
| Total-population (All ages) | 8.3% | 0.1% | 8.4% | 16.1% |
| Male (All ages) | 7.3% | −0.5% | 7.2% | 13.5% |
| Female (All ages) | 9.3% | 0.7% | 9.6% | 18.5% |
| Young (less than 65 years old) | 8.6% | −0.3% | 7.7% | 15.3% |
| Pre-old (65–74 years old) | 7.4% | 0.5% | 7.8% | 15.1% |
| Old (75–89 years old) | 9.5% | 1.2% | 9.7% | 19.3% |
| Super-old (90 years old or above) | 9.5% | −1.4% | 9.0% | 16.5% |
| Mean (95% CI) | Coefficient (95% CI) | p-Value | |
|---|---|---|---|
| Long-term PRR | 16.18 (15.38–16.99) | ||
| X1 (2015) | 28.31 (27.50–29.13) | 0.31 (−0.66–1.29) | 0.52 |
| X2 (2015) | 14.17 (13.57–14.76) | −0.09 (−1.48–1.31) | 0.90 |
| X3 (2015) | 48.23 (47.94–48.52) | 0.20 (−1.19–1.59) | 0.78 |
| X4 (2015) | 47.33 (45.52–49.13) | 0.03 (−0.14–0.20) | 0.71 |
| X5 (2015) | 8.06 (7.11–9.02) | −0.07 (−0.46–0.31) | 0.70 |
Publisher’s Note: MDPI stays neutral with regard to jurisdictional claims in published maps and institutional affiliations. |
© 2022 by the authors. Licensee MDPI, Basel, Switzerland. This article is an open access article distributed under the terms and conditions of the Creative Commons Attribution (CC BY) license (https://creativecommons.org/licenses/by/4.0/).
Share and Cite
Ishida, T.; Suzuki, A.; Nakata, Y. Nationwide Long-Term Evaluation of Polypharmacy Reduction Policies Focusing on Older Adults in Japan. Int. J. Environ. Res. Public Health 2022, 19, 14684. https://doi.org/10.3390/ijerph192214684
Ishida T, Suzuki A, Nakata Y. Nationwide Long-Term Evaluation of Polypharmacy Reduction Policies Focusing on Older Adults in Japan. International Journal of Environmental Research and Public Health. 2022; 19(22):14684. https://doi.org/10.3390/ijerph192214684
Chicago/Turabian StyleIshida, Takehiro, Asuka Suzuki, and Yoshinori Nakata. 2022. "Nationwide Long-Term Evaluation of Polypharmacy Reduction Policies Focusing on Older Adults in Japan" International Journal of Environmental Research and Public Health 19, no. 22: 14684. https://doi.org/10.3390/ijerph192214684
APA StyleIshida, T., Suzuki, A., & Nakata, Y. (2022). Nationwide Long-Term Evaluation of Polypharmacy Reduction Policies Focusing on Older Adults in Japan. International Journal of Environmental Research and Public Health, 19(22), 14684. https://doi.org/10.3390/ijerph192214684