

A Geographical and Temporal Risk Evaluation Method for Red-Light Violations by Pedestrians at Signalized Intersections: Analysis and Results of Suzhou, China


Abstract
1. Introduction
2. Literature Review
2.1. Studies on the Geographical Risk of Pedestrian Violations
2.2. Studies on the Temporal Risk of Pedestrian Violations
3. Methodology
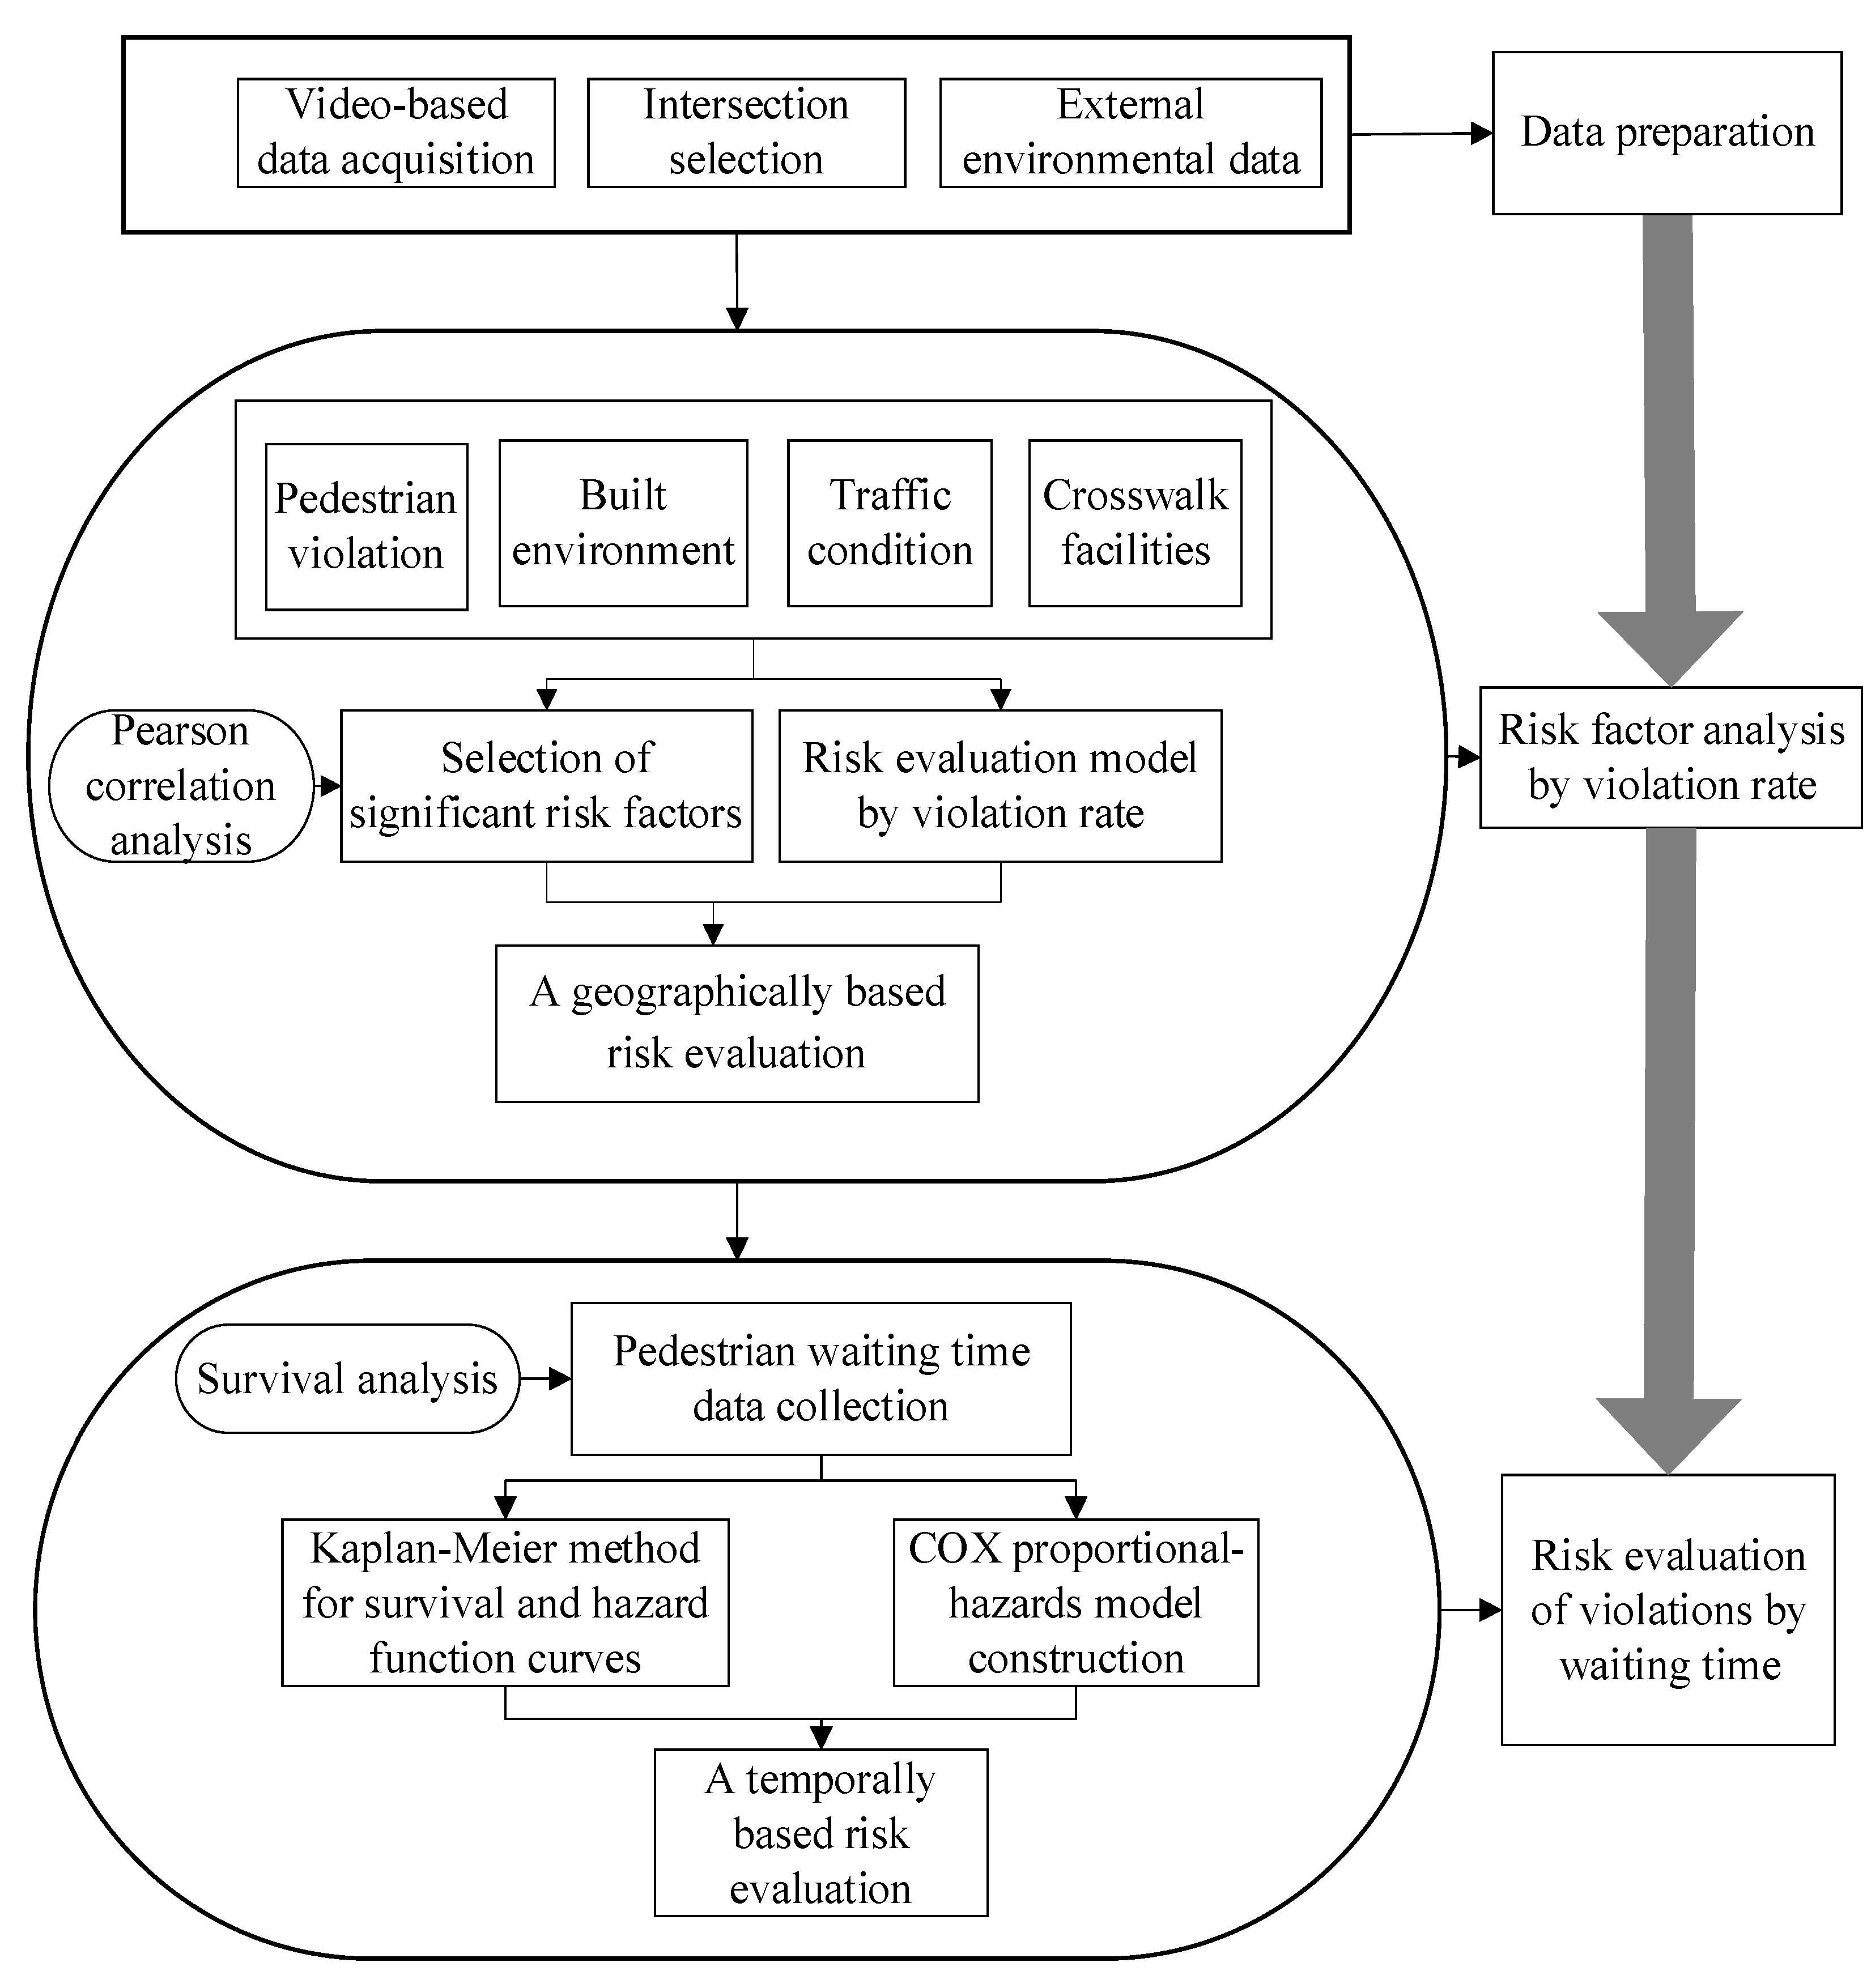
3.1. Research Framework
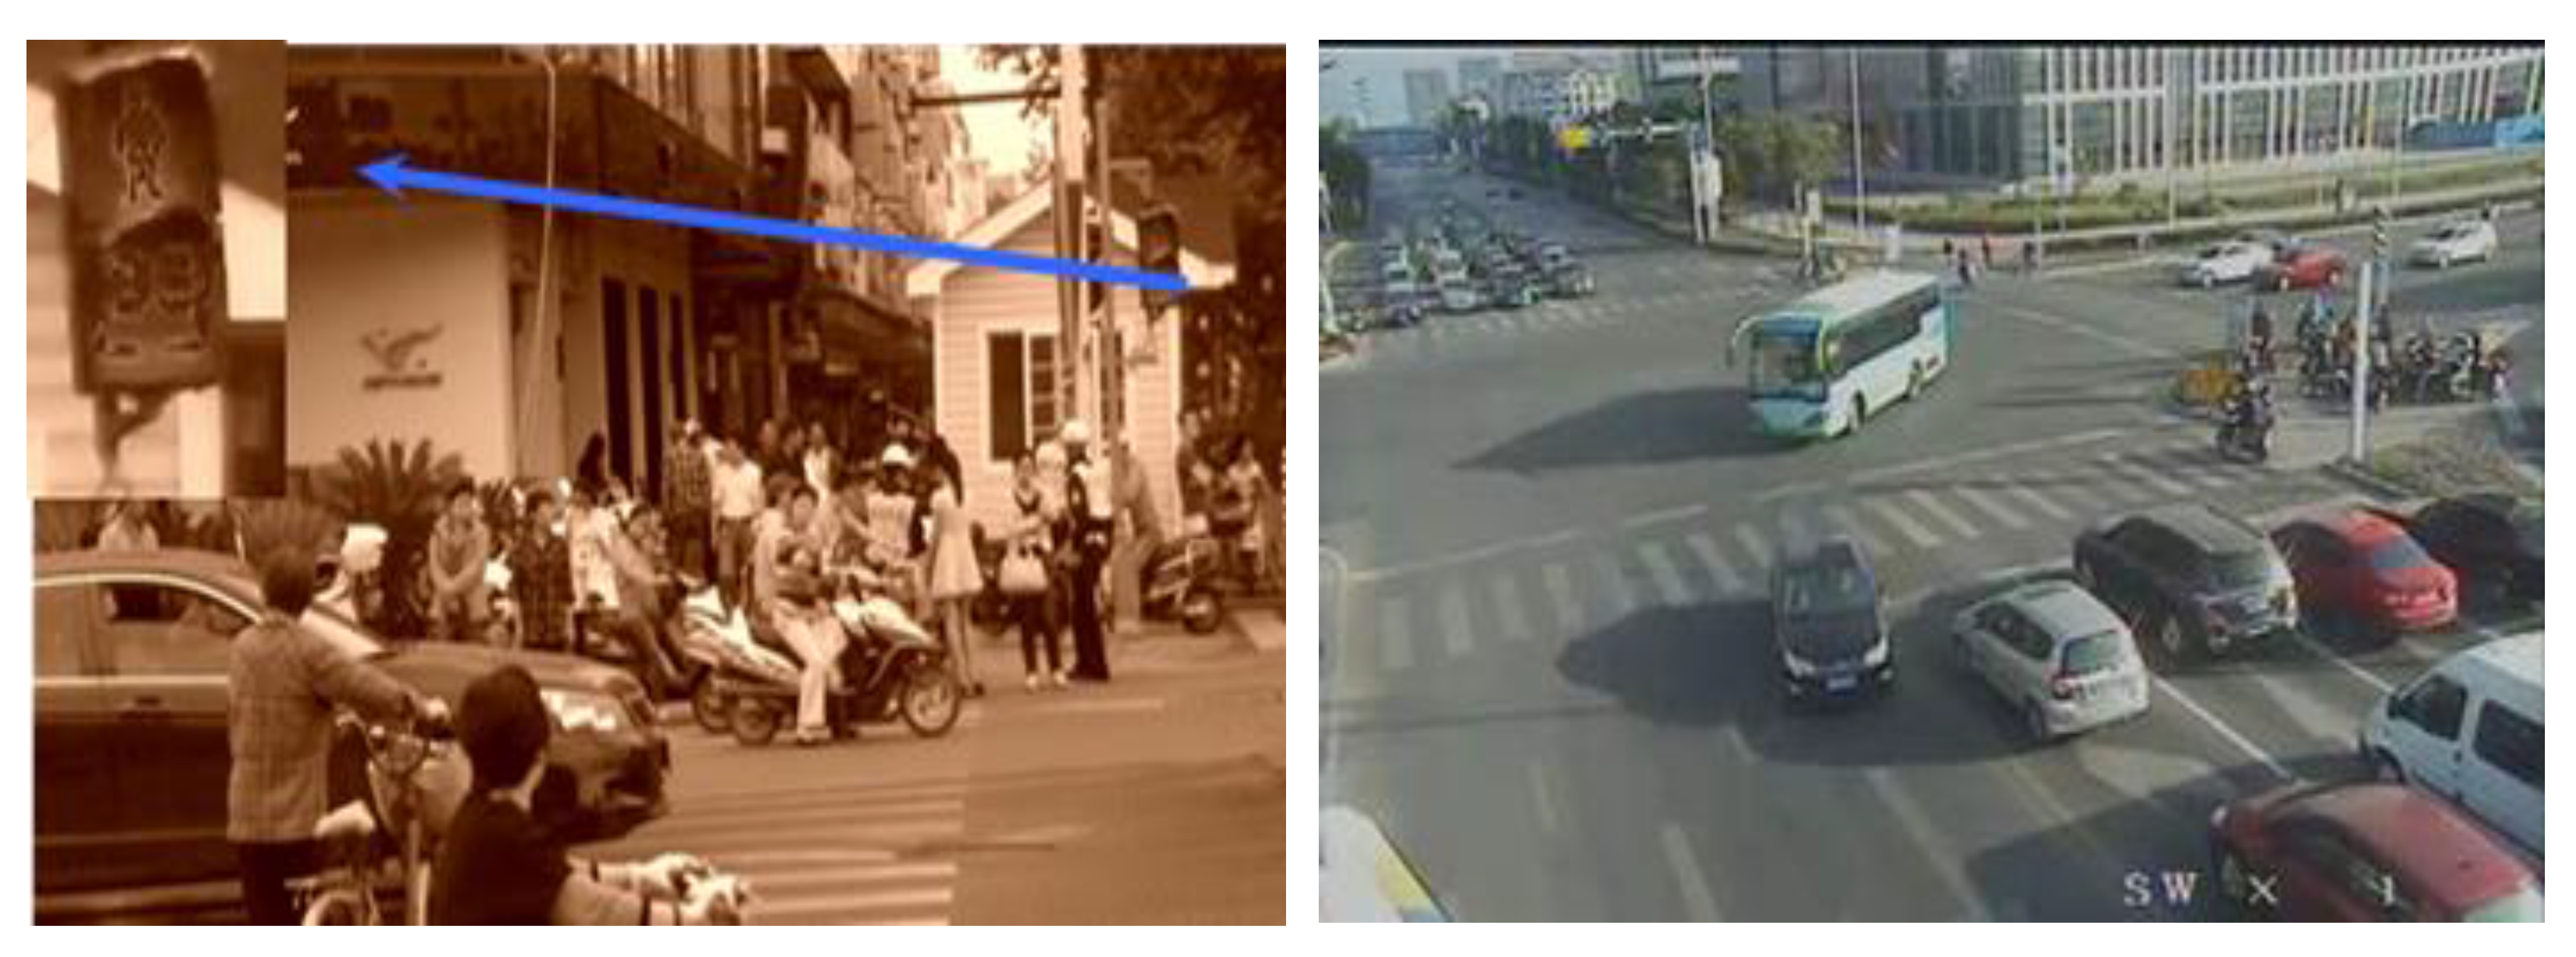
3.2. Investigation of Pedestrian Crosswalk Violations
3.2.1. The Selection of Study Area
3.2.2. Determination of Risk Factors
3.3. Pearson Correlation Analysis of Violation Factors
3.4. Survival Analysis of Pedestrian Waiting
4. Case Study
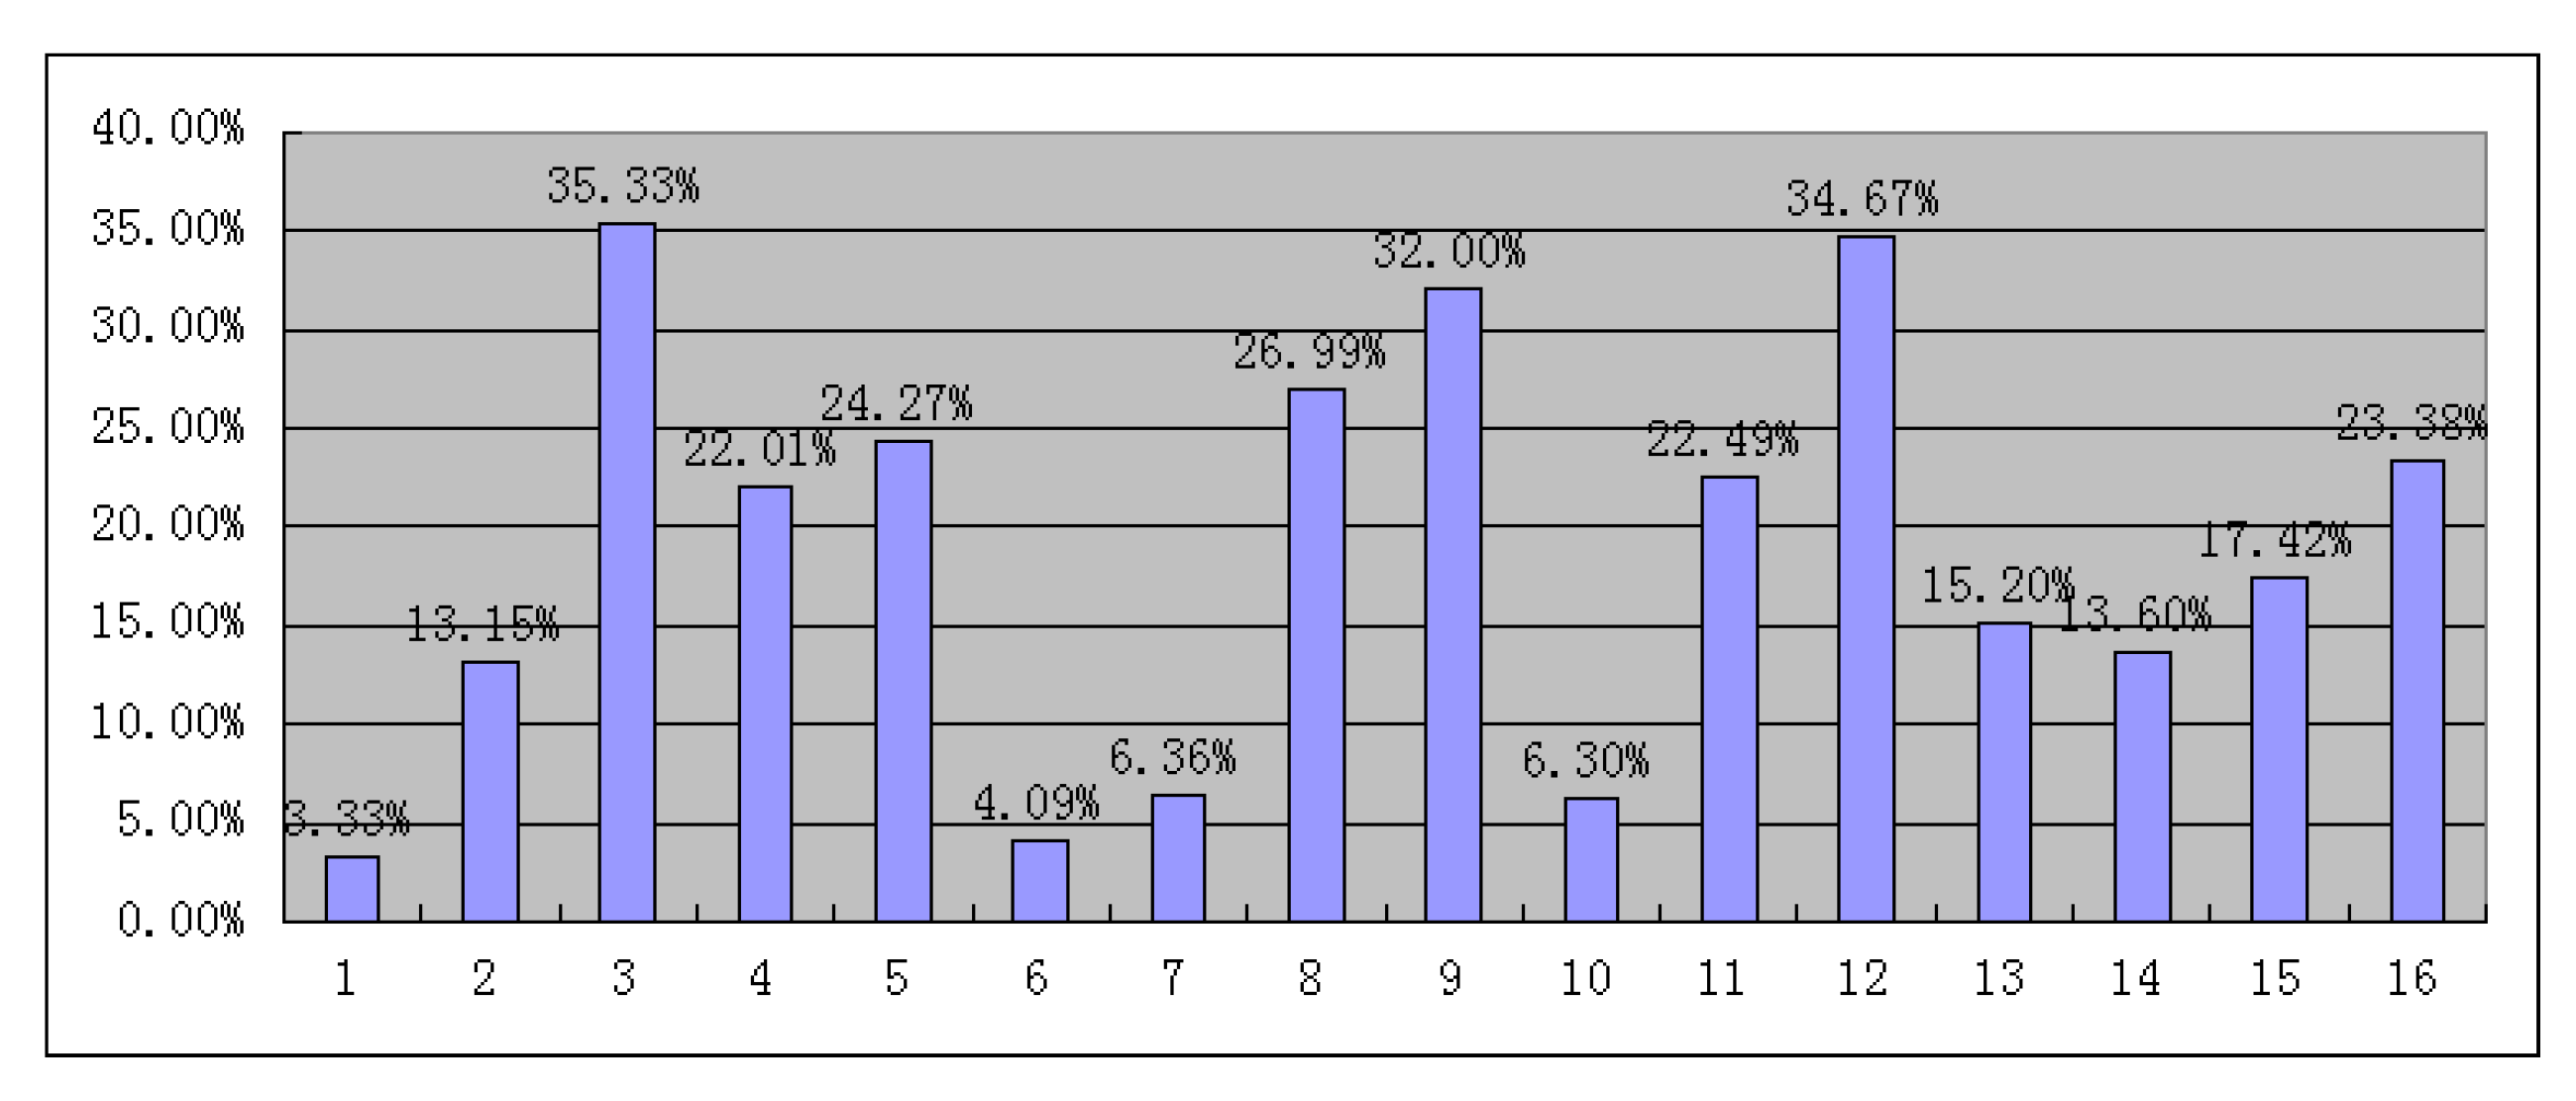
4.1. Statistics of Pedestrian Violation Data
4.2. The Identification of Geographical Risk Factors of Violation
4.3. The Geographical Risk Model for Pedestrian Violations
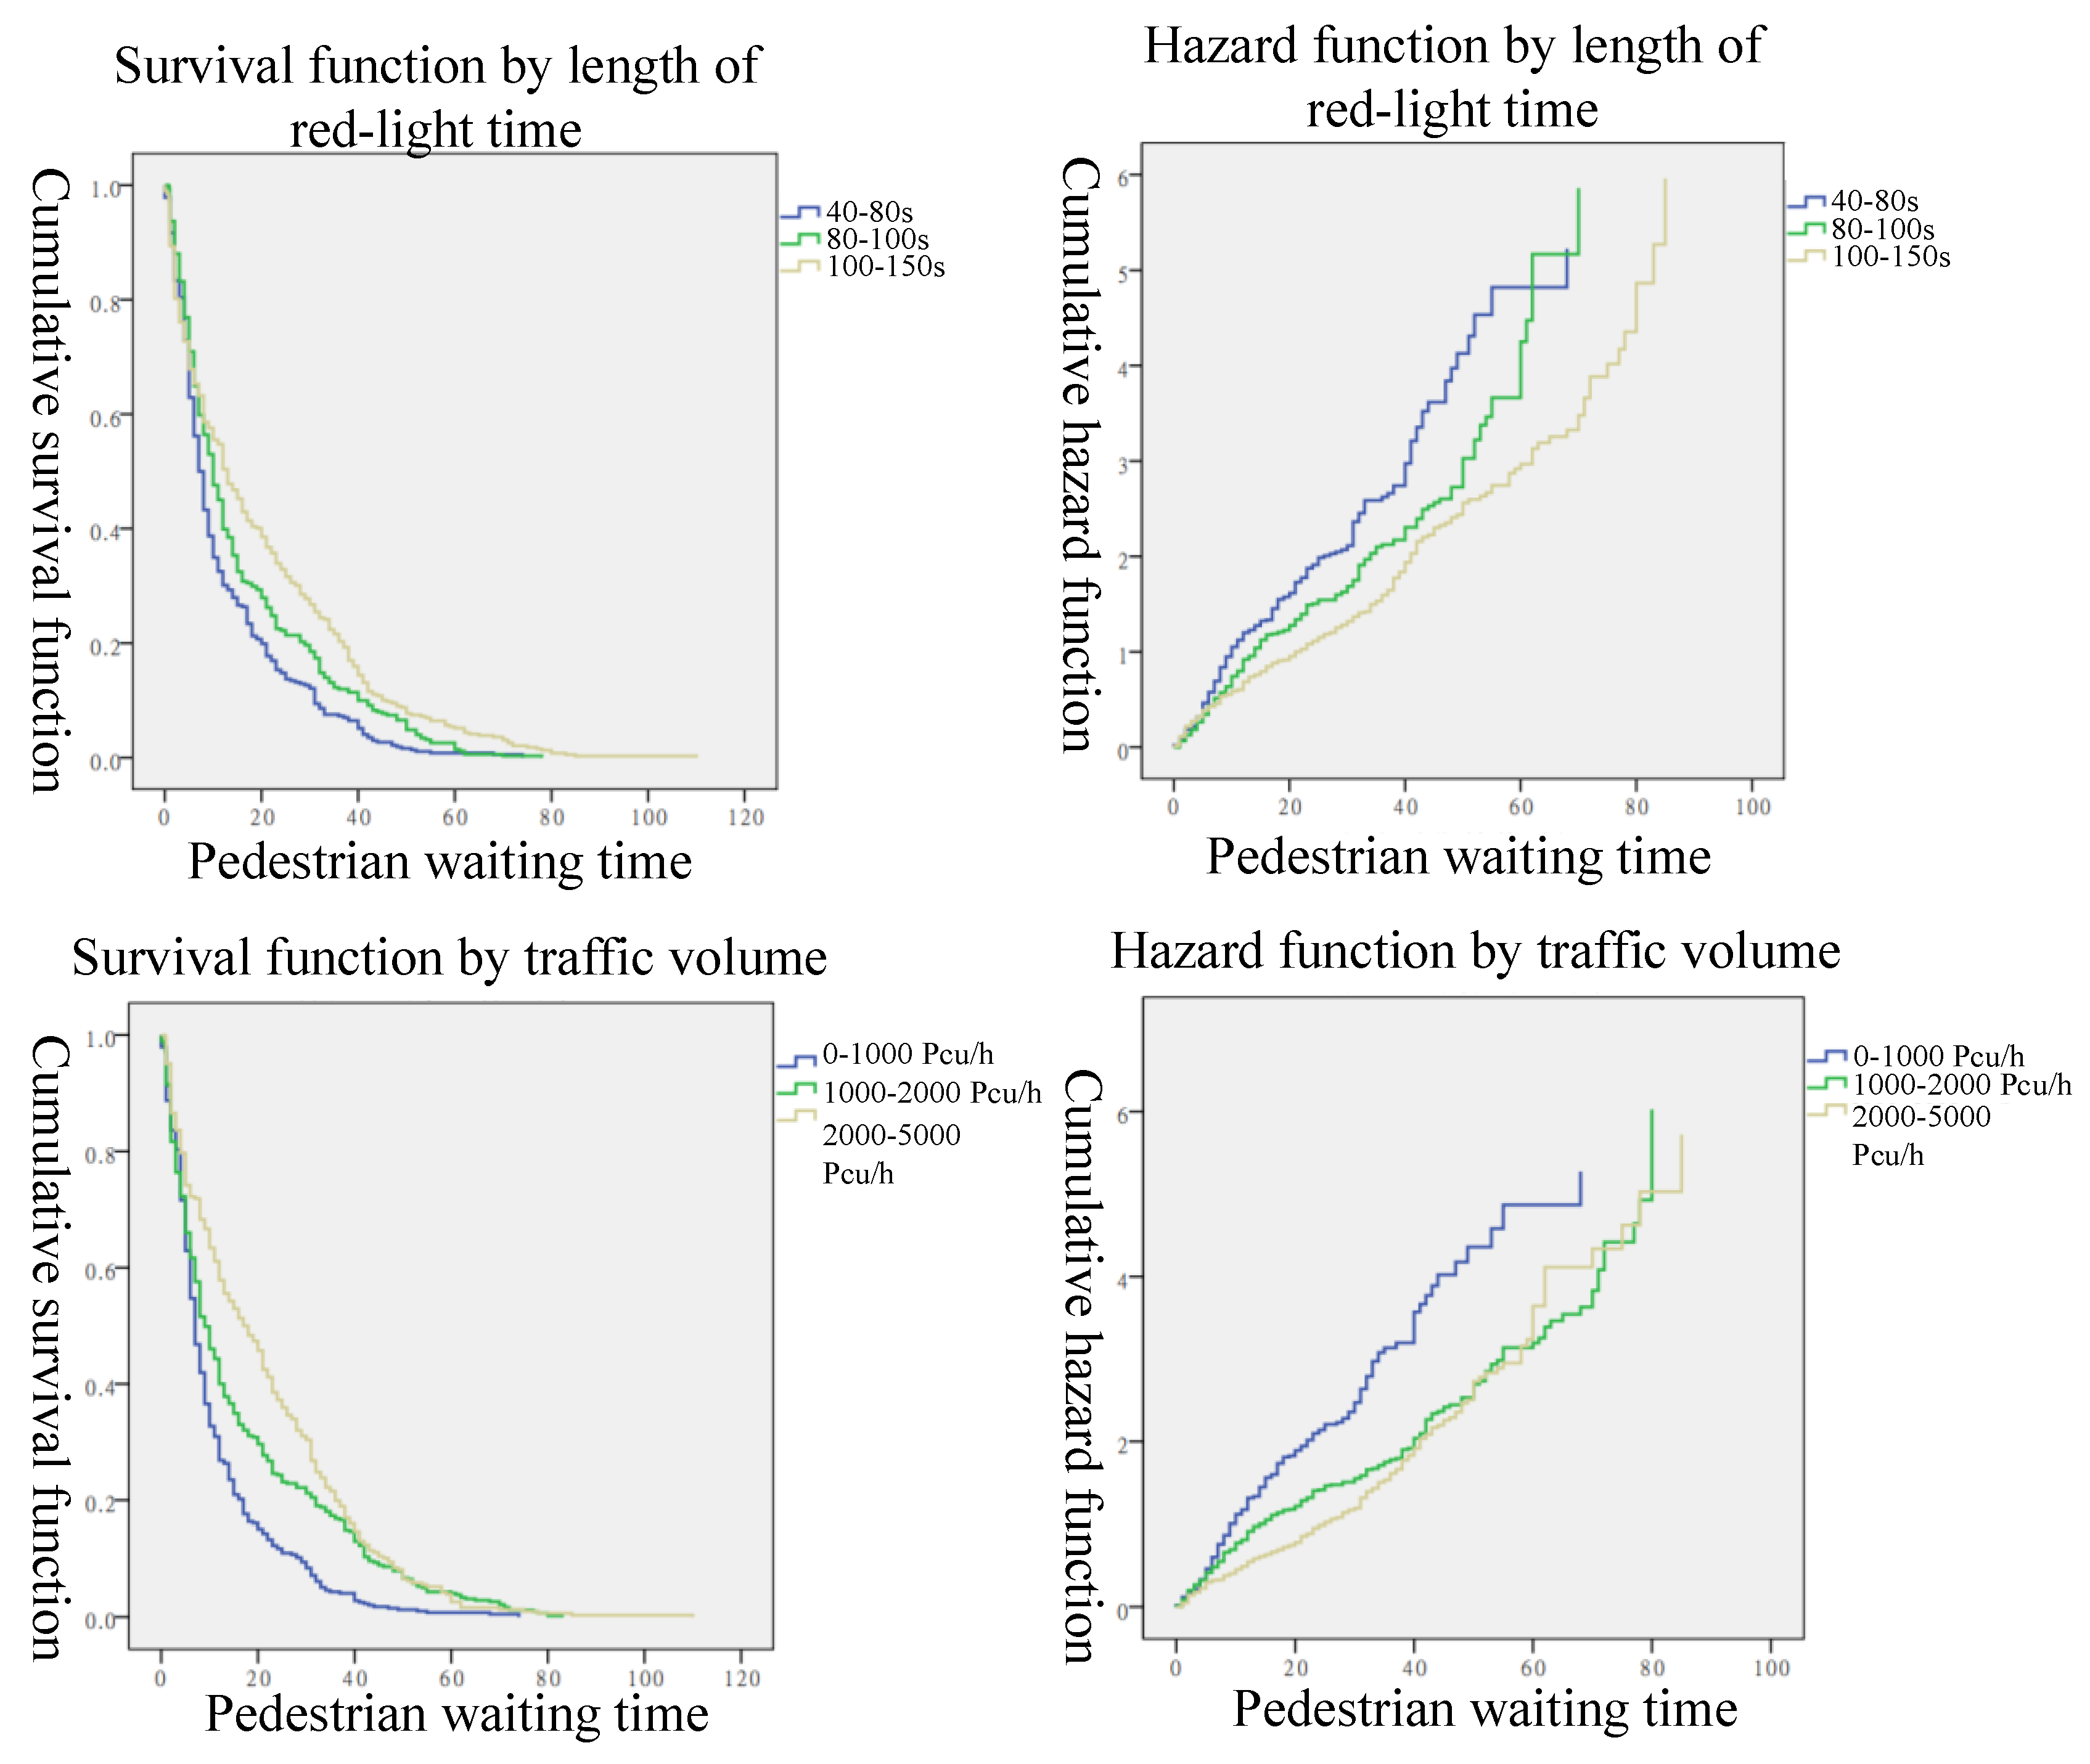
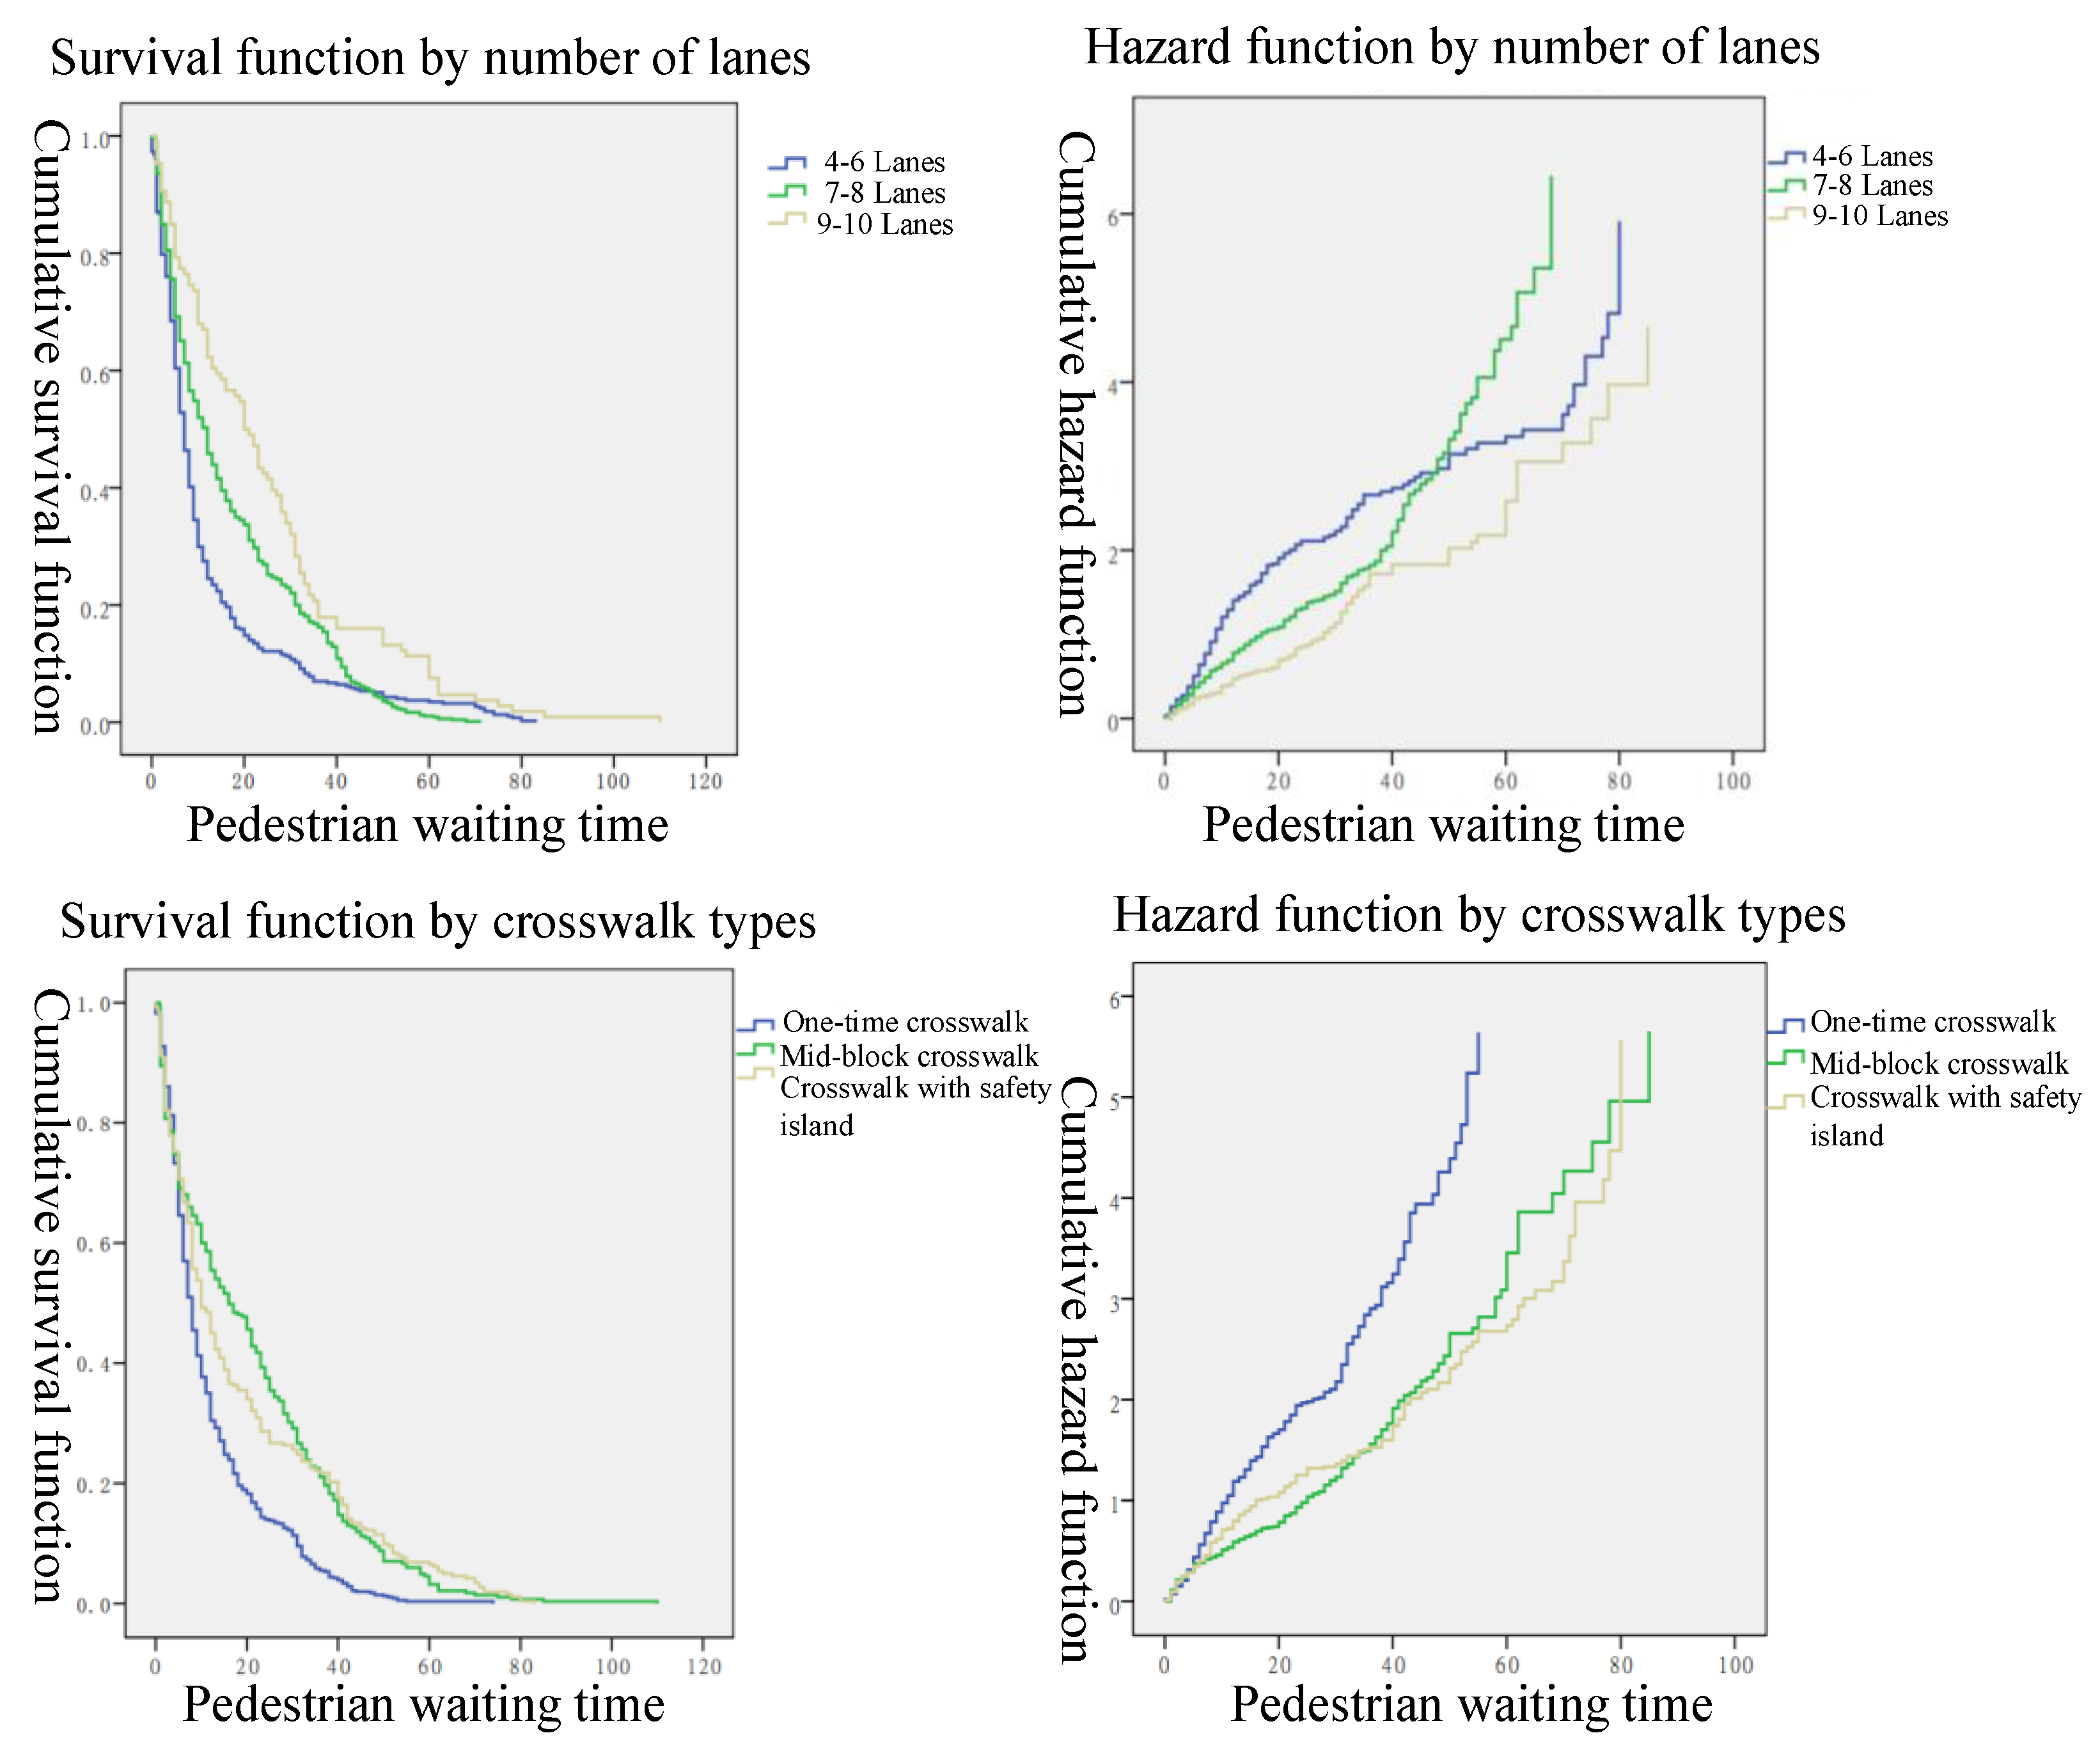
4.4. The Temporal Risk Factors for Pedestrians Waiting at the Crosswalk
4.5. The Temporal Risk Model for Pedestrian Violations
5. Conclusions
6. Limitations and Further Research
Author Contributions
Funding
Institutional Review Board Statement
Informed Consent Statement
Data Availability Statement
Conflicts of Interest
Appendix A

| No. | Study Area | Type of Crosswalk | Central Isolation Degree | Investigation Period |
|---|---|---|---|---|
| 1 | Huanghe Road–New Century Avenue | Residential area | None | 7:00–9:30 a.m. |
| 2 | Beimen Street–Yinxian Street | Residential area | None | 11:30 a.m.–12:30 p.m. |
| 3 | Huanghe Road–Cibei Road | Residential area | Green belt | 5:30–7:00 p.m. |
| 4 | Yushan North Road–Huanghe Road | Residential area | None | 7:00–9:30 a.m. |
| 5 | Huanghe Road–Haiyu North Road | Residential area | None | 11:30 a.m.–12:30 p.m. |
| 6 | Zhaoshang East Road–Shanghai Road | Commercial district | None | 5:30–7:00 p.m. |
| 7 | Yushan North Road–Zhujiang Road | Commercial district | None | 7:00–9:30 a.m. |
| 8 | Yushan North Road–Changjiang Road | Mixing zone | Isolation fence | 11:30 a.m.–12:30 p.m. |
| 9 | Yushan North Road–Fenglin Road | Mixing zone | Isolation fence | 5:30–7:00 p.m. |
| 10 | Ximen Street–Shuyuan Street | Mixing zone | Isolation fence | 7:00–9:30 a.m. |
| 11 | Qinhu Road–Huaxi Road | Mixing zone | Isolation fence | 11:30 a.m.–12:30 p.m. |
| 12 | Haiyu South Road–Xinyan Road | Residential area | None | 5:30–7:00 p.m. |
| 13 | Huancheng Road–Fu’an Bridge | Residential area | None | 7:00–9:30 a.m. |
| 14 | Ganjiang Road–Wusan Road | Residential area | None | 11:30 a.m.–12:30 p.m. |
| 15 | Xihuan Road–Jinmen Road | Residential area | None | 5:30–7:00 p.m. |
| 16 | Ganjiang Road–Xueshi Street | Residential area | Green belt | 7:00–9:30 a.m. |
Appendix B
| No. | 1 | 2 | 3 | 4 | 5 | 6 | 7 | 8 |
|---|---|---|---|---|---|---|---|---|
| Study Area | Huanghe Road–New Century Avenue | Beimen Street–Yinxian Street | Huanghe Road–Cibei Road | Yushan North Road–Huanghe Road | Huanghe Road–Haiyu North Road | Zhaoshang East Road–Shanghai Road | Yushan North Road–Zhujiang Road | Yushan North Road–Changjiang Road |
| Crossing distance | 44 | 45 | 42 | 33 | 34 | 20 | 15 | 60 |
| Lanes | 8 | 6 | 6 | 6 | 7 | 6 | 5 | 9 |
| Traffic volume (veh/5 min) | 57 | 61 | 50 | 35 | 35 | 86 | 64 | 100 |
| Red-light time | 90 | 80 | 120 | 73 | 80 | 80 | 85 | 150 |
| Signal clearing time | 15 | 10 | 5 | 7 | 6 | 10 | 10 | 15 |
| Whether to set countdown | 1 | 1 | 0 | 1 | 1 | 1 | 1 | 0 |
| Land use type | 3 | 2 | 3 | 2 | 2 | 3 | 1 | 3 |
| Crosswalk isolation | 0 | 0 | 2 | 0 | 0 | 0 | 0 | 1 |
| Turn traffic volume | 12 | 7 | 10 | 1 | 8 | 3 | 5 | 20 |
| Crosswalk type | 3 | 2 | 1 | 1 | 1 | 3 | 3 | 2 |
| No. | 9 | 10 | 11 | 12 | 13 | 14 | 15 | 16 |
| Study Area | Yushan North Road–Fenglin Road | Ximen Street–Shuyuan Street | Qinhu Road–Huaxi Road | Haiyu South Road–Xinyan Road | Huancheng Road–Fu’an Bridge | Ganjiang Road–Wusan Road | Xihuan Road–Jinmen Road | Ganjiang Road–Xueshi Street |
| Crossing distance | 45 | 45 | 48 | 33 | 24 | 16 | 31 | 31 |
| Lanes | 8 | 6 | 8 | 5 | 6 | 4 | 6 | 6 |
| Traffic volume (veh/5 min) | 112 | 54 | 73 | 51 | 50 | 40 | 60 | 82 |
| Red-light time | 100 | 65 | 60 | 60 | 70 | 55 | 50 | 80 |
| Signal clearing time | 10 | 15 | 10 | 5 | 10 | 10 | 15 | 5 |
| Whether to set countdown | 0 | 1 | 1 | 0 | 0 | 1 | 0 | 0 |
| Land use type | 3 | 3 | 1 | 2 | 3 | 3 | 1 | 2 |
| Crosswalk isolation | 1 | 1 | 1 | 0 | 0 | 0 | 0 | 2 |
| Turn traffic volume | 15 | 7 | 10 | 6 | 11 | 17 | 10 | 6 |
| Crosswalk type | 2 | 2 | 2 | 1 | 1 | 3 | 3 | 1 |
References
- Cheng, Z.; Lu, J.; Zhao, Y. Pedestrian Evacuation Risk Assessment of Subway Station under Large-Scale Sport Activity. Int. J. Environ. Res. Public Health 2020, 17, 3844. [Google Scholar] [CrossRef] [PubMed]
- Abdel-Aty, M.; Cai, Q.; Wu, Y.; Zheng, O. Evaluation of automated emergency braking system’s avoidance of pedestrian crashes at intersections under occluded conditions within a virtual simulator. Accid. Anal. Prev. 2022, 176, 106797. [Google Scholar] [CrossRef] [PubMed]
- Trpković, A.; Milenković, M.; Vujanić, M.; Stanić, B.; Glavić, D. The Crossing Speed of Elderly Pedestrians. Promet-Traffic Transp. 2017, 29, 175–183. [Google Scholar] [CrossRef]
- Ni, Y.; Cao, Y.; Li, K. Pedestrians’ Safety Perception at Signalized Intersections in Shanghai. Transp. Res. Procedia 2017, 25, 1955–1963. [Google Scholar] [CrossRef]
- Demiroz, Y.; Onelcin, P.; Alver, Y. Illegal road crossing behavior of pedestrians at overpass locations: Factors affecting gap acceptance, crossing times and overpass use. Accid. Anal. Prev. 2015, 80, 220–228. [Google Scholar] [CrossRef]
- Ma, Y.; Lu, S.; Zhang, Y. Analysis on illegal crossing behavior of pedestrians at signalized intersections based on bayesian network. J. Adv. Transp. 2020, 2020, 2675197. [Google Scholar] [CrossRef]
- Useche, S.A.; Llamazares, F.J. The guilty, the unlucky, or the unaware? Assessing self-reported behavioral contributors and attributions on pedestrian crashes through structural equation modeling and mixed methods. J. Saf. Res. 2022, 82, 329–341. [Google Scholar] [CrossRef]
- Congiu, T.; Sotgiu, G.; Castiglia, P.; Azara, A.; Piana, A.; Saderi, L.; Dettori, M. Built environment features and pedestrian accidents: An italian retrospective study. Sustainability 2019, 11, 1064. [Google Scholar] [CrossRef]
- Shaaban, K.; Muley, D.; Mohammed, A. Analysis of illegal pedestrian crossing behavior on a major divided arterial road. Transp. Res. Part F Traffic Psychol. Behav. 2018, 54, 124–137. [Google Scholar] [CrossRef]
- Aghabayk, K.; Esmailpour, J.; Jafari, A.; Shiwakoti, N. Observational-based study to explore pedestrian crossing behaviors at signalized and unsignalized crosswalks. Accid. Anal. Prev. 2021, 151, 105990. [Google Scholar] [CrossRef]
- Liu, Y.; Alsaleh, R.; Sayed, T. Modeling pedestrian temporal violations at signalized crosswalks: A random Intercept parametric survival model. Transp. Res. Rec. 2022, 2676, 707–720. [Google Scholar] [CrossRef]
- Raoniar, R.; Maqbool, S.; Pathak, A.; Chugh, M.; Maurya, A.K. Hazard-based duration approach for understanding pedestrian crossing risk exposure at signalised intersection crosswalks—A case study of Kolkata, India. Transp. Res. Part F Traffic Psychol. Behav. 2022, 85, 47–68. [Google Scholar] [CrossRef]
- Alonso, F.; Oviedo-Trespalacios, O.; Gene-Morales, J.; Useche, S.A. Assessing risky and protective behaviors among pedestrians in the Dominican Republic: New evidence about pedestrian safety in the Caribbean. J. Transp. Health 2021, 22, 101145. [Google Scholar] [CrossRef]
- Nesoff, E.D.; Milam, A.J.; Pollack, K.M.; Curriero, F.C.; Bowie, J.V.; Knowlton, A.R.; Gielen, A.C.; Furr-Holden, D.M. Neighbourhood alcohol environment and injury risk: A spatial analysis of pedestrian injury in Baltimore City. Inj. Prev. 2018, 25, 350–356. [Google Scholar] [CrossRef]
- Yao, S.; Loo, B.P.; Lam, W.W. Measures of activity-based pedestrian exposure to the risk of vehicle-pedestrian collisions: Space-time path vs. potential path tree methods. Accid. Anal. Prev. 2015, 75, 320–332. [Google Scholar] [CrossRef] [PubMed]
- Poulos, R.G.; Chong, S.S.S.; Olivier, J.; Jalaludin, B. Geospatial analyses to prioritize public health interventions: A case study of pedestrian and pedal cycle injuries in New South Wales, Australia. Int. J. Public Health 2012, 57, 467–475. [Google Scholar] [CrossRef]
- Chaudhari, A.R.; Gore, N.; Arkatkar, S.; Joshi, G.; Pulugurtha, S.S. Deriving pedestrian risk index by vehicle type and road geometry at midblock crosswalks under heterogeneous traffic conditions. J. Transp. Eng. Part A Syst. 2020, 146, 04020123. [Google Scholar] [CrossRef]
- Fuentes, C.M.; Hernández, V. Spatial environmental risk factors for pedestrian injury collisions in Ciudad Juárez, Mexico (2008–2009): Implications for urban planning. Int. J. Inj. Control Saf. Promot. 2013, 20, 169–178. [Google Scholar] [CrossRef]
- Jang, K.; Park, S.H.; Kang, S.; Song, K.H.; Kang, S.; Chung, S. Evaluation of pedestrian safety pedestrian crash hot spots and risk factors for injury severity. Transp. Res. Rec. 2013, 2393, 104–116. [Google Scholar] [CrossRef]
- Rankavat, S.; Tiwari, G. Pedestrians risk perception of traffic crash and built environment features—Delhi, India. Saf. Sci. 2016, 87, 1–7. [Google Scholar] [CrossRef]
- Avinash, C.; Jiten, S.; Arkatkar, S.; Gaurang, J.; Manoranjan, P. Investigating effect of surrounding factors on human behaviour at un-controlled mid-block crosswalks in indian cities. Saf. Sci. 2018, 119, 174–187. [Google Scholar] [CrossRef]
- Useche, S.A.; Hezaveh, A.M.; Llamazares, F.J.; Cherry, C. Not gendered… but different from each other? A structural equation model for explaining risky road behaviors of female and male pedestrians. Accid. Anal. Prev. 2020, 150, 105942. [Google Scholar] [CrossRef] [PubMed]
- Yang, Z.; Chen, X.; Pan, R.; Yuan, Q. Exploring location factors of logistics facilities from a spatiotemporal perspective: A case study from Shanghai. J. Transp. Geogr. 2022, 100, 103318. [Google Scholar] [CrossRef]
- Yang, C.; Chen, M.; Yuan, Q. The application of XGBoost and SHAP to examining the factors in freight truck-related crashes: An exploratory analysis. Accid. Anal. Prev. 2021, 158, 106153. [Google Scholar] [CrossRef] [PubMed]
- Cheng, Z.; Zhang, L.; Zhang, Y.; Wang, S.; Huang, W. A systematic approach for evaluating spatiotemporal characteristics of traffic violations and crashes at road intersections: An empirical study. Transp. A Transp. Sci. 2022. [Google Scholar] [CrossRef]
- Tiwari, G.; Bangdiwala, S.; Saraswat, A.; Gaurav, S. Survival analysis: Pedestrian risk exposure at signalized intersections. Transp. Res. Part F Traffic Psychol. Behav. 2007, 10, 77–89. [Google Scholar] [CrossRef]
- Hamed, M.M. Analysis of pedestrians’ behavior at pedestrian crossings. Saf. Sci. 2001, 38, 63–82. [Google Scholar] [CrossRef]
- Yang, X.; Abdel-Aty, M.; Huan, M.; Peng, Y.; Gao, Z. An accelerated failure time model for investigating pedestrian crossing behavior and waiting times at signalized intersections. Accid. Anal. Prev. 2015, 82, 154–162. [Google Scholar] [CrossRef]
- Sueur, C.; Class, B.; Hamm, C.; Meyer, X.; Pelé, M. Different risk thresholds in pedestrian road crossing behaviour: A comparison of French and Japanese approaches. Accid. Anal. Prev. 2013, 58, 59–63. [Google Scholar] [CrossRef]
- Pawar, N.M.; Velaga, N.R. Modelling the influence of time pressure on reaction time of drivers. Transp. Res. Part F Traffic Psychol. Behav. 2020, 72, 1–22. [Google Scholar] [CrossRef]
- Dhoke, A.; Kumar, A.; Ghosh, I. Hazard-based duration approach to pedestrian crossing behavior at signalized intersections. Transp. Res. Rec. J. Transp. Res. Board 2021, 2675, 519–532. [Google Scholar] [CrossRef]
- Useche, S.A.; Alonso, F.; Montoro, L. Validation of the Walking Behavior Questionnaire (WBQ): A tool for measuring risky and safe walking under a behavioral perspective. J. Transp. Health 2020, 18, 100899. [Google Scholar] [CrossRef]
- Useche, S.A.; Gonzalez-Marin, A.; Faus, M.; Alonso, F. Environmentally friendly, but behaviorally complex? A systematic review of e-scooter riders’ psychosocial risk features. PLoS ONE 2022, 17, e0268960. [Google Scholar] [CrossRef] [PubMed]
- Huang, D.; Xing, J.; Liu, Z.; An, Q. A multi-stage stochastic optimization approach to the stop-skipping and bus lane reservation schemes. Transp. A Transp. Sci. 2020, 17, 1272–1304. [Google Scholar] [CrossRef]
- Zheng, Y.; Li, W.; Qiu, F.; Wei, H. The benefits of introducing meeting points into flex-route transit services. Transp. Res. Part C Emerg. Technol. 2019, 106, 98–112. [Google Scholar] [CrossRef]
- Cheng, Q.; Liu, Z.; Guo, J.; Wu, X.; Pendyala, R.; Belezamo, B.; Zhou, X.S. Estimating key traffic state parameters through parsimonious spatial queue models. Transp. Res. Part C Emerg. Technol. 2022, 137, 103596. [Google Scholar] [CrossRef]
- Cheng, Q.; Liu, Z.; Lin, Y.; Zhou, X. An s-shaped three-parameter (S3) traffic stream model with consistent car following relationship. Transp. Res. Part B Methodol. 2021, 153, 246–271. [Google Scholar] [CrossRef]
- Liu, Z.; Wang, Z.; Cheng, Q.; Yin, R.; Wang, M. Estimation of urban network capacity with second-best constraints for multimodal transport systems. Transp. Res. Part B Methodol. 2021, 152, 276–294. [Google Scholar] [CrossRef]
- Huang, D.; Wang, Y.; Jia, S.; Liu, Z.; Wang, S. A Lagrangian relaxation approach for the electric bus charging scheduling optimisation problem. Transp. A Transp. Sci. 2022, 12–34. [Google Scholar] [CrossRef]
- He, Z.; Qi, G.; Lu, L.; Chen, Y. Network-wide identification of turn-level intersection congestion using only low-frequency probe vehicle data. Transp. Res. Part C Emerg. Technol. 2019, 108, 320–339. [Google Scholar] [CrossRef]
- Qin, W.; Ji, X.; Liang, F. Estimation of urban arterial travel time distribution considering link correlations. Transp. A Transp. Sci. 2020, 16, 1429–1458. [Google Scholar] [CrossRef]
- Xing, J.; Wu, W.; Cheng, Q.; Liu, R. Traffic state estimation of urban road networks by multi-source data fusion: Review and new insights. Phys. A Stat. Mech. Its Appl. 2022, 595, 127079. [Google Scholar] [CrossRef]
- Liu, Y.; Ji, Y.; Feng, T.; Shi, Z. A route analysis of metro-bikeshare users using smart card data. Travel Behav. Soc. 2021, 26, 108–120. [Google Scholar] [CrossRef]
- Xing, J.; Liu, Z.; Wu, C.; Chen, S. Traffic volume estimation in multimodal urban networks using cell phone location data. IEEE Intell. Transp. Syst. Mag. 2019, 11, 93–104. [Google Scholar] [CrossRef]
- Cheng, Z.; Yuan, J.; Yu, B.; Lu, J.; Zhao, Y. Crash Risks Evaluation of Urban Expressways: A Case Study in Shanghai. IEEE Trans. Intell. Transp. Syst. 2022, 23, 12–36. [Google Scholar] [CrossRef]
- Yin, R.; Liu, X.; Zheng, N.; Liu, Z. Simulation-based analysis of second-best multimodal network capacity. Transp. Res. Part C Emerg. Technol. 2022, 145, 103925. [Google Scholar] [CrossRef]
- Kalbfleisch, J.D.; Prentice, R.L. Estimation of the Survivor Function; Boston University Press: Boston, MA, USA, 1980. [Google Scholar]
- Wang, S.; Ding, H.; Cheng, Z. Understanding the Shortest Route Selection Behavior for Private Cars Using Trajectory Data and Navigation Information. J. Adv. Transp. 2022, 2022, 4100704. [Google Scholar] [CrossRef]
- Schober, P.; Boer, C.; Schwarte, L.A. Correlation coefficients: Appropriate use and interpretation. Anesth. Analg. 2018, 126, 1763–1768. [Google Scholar] [CrossRef]
- Gu, X.; Cai, Q.; Lee, J.; Xiang, Q.; Ma, Y.; Xu, X. Proactive crash risk prediction modeling for merging assistance system at interchange merging areas. Traffic Inj. Prev. 2020, 21, 234–240. [Google Scholar] [CrossRef]
- Shi, Z.; Zhang, N.; Schonfeld, P.M.; Zhang, J. Short-term metro passenger flow forecasting using ensemble-chaos support vector regression. Transp. A Transp. Sci. 2019, 16, 194–212. [Google Scholar] [CrossRef]
- Cheng, Z.; Zu, Z.; Lu, J.; Li, Y. Exploring the Effect of Driving Factors on Traffic Crash Risk among Intoxicated Drivers: A Case Study in Wujiang. Int. J. Environ. Res. Public Health 2019, 16, 2540. [Google Scholar] [CrossRef]
- Gu, X.; Abdel-Aty, M.; Lee, J.; Xiang, Q.; Ma, Y. Identification of contributing factors for interchange crashes based on a quasi-induced exposure method. J. Transp. Saf. Secur. 2020, 14, 671–692. [Google Scholar] [CrossRef]
- Sauerbrei, W.; Schumacher, M. A bootstrap resampling procedure for model building: Application to the COX regression model. Stat. Med. 1992, 11, 2093–2109. [Google Scholar] [CrossRef]
- He, Z. Portraying ride-hailing mobility using multi-day trip order data: A case study of Beijing, China. Transp. Res. Part A Policy Pract. 2021, 146, 152–169. [Google Scholar] [CrossRef]
- Raoniar, R.; Maurya, A.K. Pedestrian red-light violation at signalised intersection crosswalks: Influence of social and non-social factors. Saf. Sci. 2022, 147, 105583. [Google Scholar] [CrossRef]


| Risk Factors | Investigation Parameters | Category | Variable Assignment |
|---|---|---|---|
| Traffic conditions | Pedestrian waiting time for red light | Continuous variable | Survey confirmation |
| Traffic volume at crosswalk | Discrete variable | Video statistical acquisition | |
| Whether to set a red-light countdown | Nominal variable | Yes = 1, no = 0 | |
| Built environment | Number of lanes | Continuous variable | Survey confirmation |
| Land use type around the crosswalk | Nominal variable | Residential area = 1, mixed area = 2, and commercial area = 3 | |
| Crosswalk isolation degree | Nominal variable | None = 0, fence = 1, and green belt = 2 | |
| Turn right traffic flow | Discrete variable | Video statistical acquisition | |
| Signal clearing time | Continuous variable | Survey confirmation | |
| Crosswalk facilities | Crossing distance | Continuous variable | Survey confirmation |
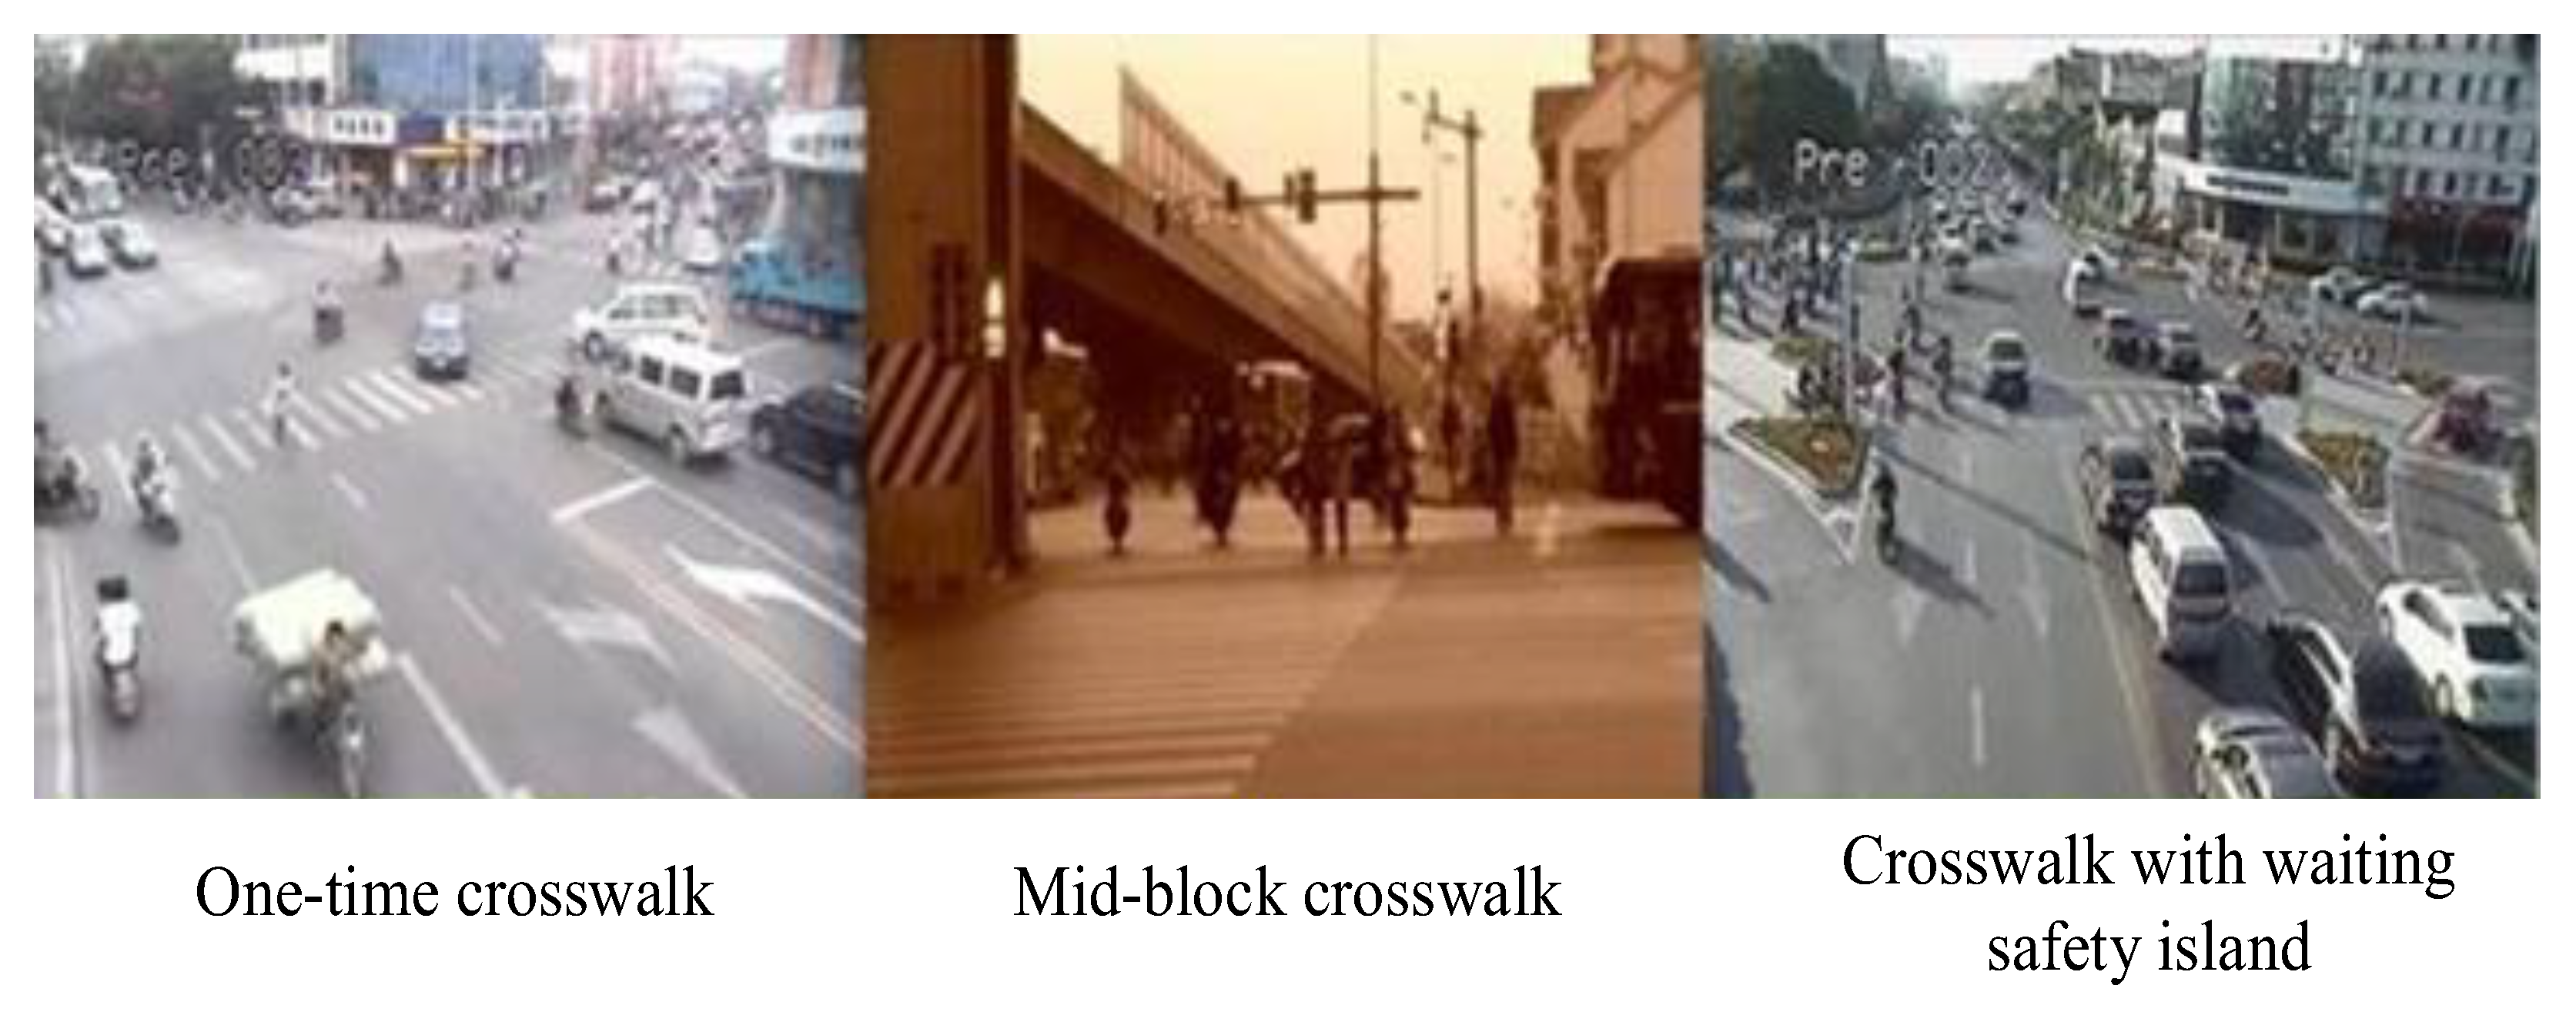
| Crosswalk type | Nominal variable | One-time crosswalk = 1, mid-block crosswalk = 2, and crosswalk with refuge island = 3 |
| Crossing Distance | Number of Lanes | Traffic Volume at Crosswalk | Signal Clearing Time | Length of Red-Light Time | ||
|---|---|---|---|---|---|---|
| Violation rate | Pearson correlation coefficient | 0.57 | −0.028 | 0.551 | 0.228 | 0.668 |
| t-value significance test | 0.037 | 0.541 | 0.05 | 0.479 | −0.028 | |
| Sample size | 16 | 16 | 16 | 16 | 16 | |
| Land Use Type Around Crosswalk | Crosswalk Isolation Degree | Whether to Set Red-Light Countdown | Turn Right Traffic Flow | Crosswalk Type | ||
| Violation rate | Pearson correlation coefficient | −0.337 | −0.228 | 0.43 | 0.479 | 0.79 |
| t-value significance test | 0.396 | 0.678 | 0.35 | 0.178 | 0.018 | |
| Sample size | 16 | 16 | 16 | 16 | 16 |
| Coefficient | Significance | |
|---|---|---|
| Constants | 4.579 | 0.081 |
| Crossing distance | −3.662 | 0.037 |
| Traffic volume | −5.097 | 0.05 |
| Red-light time | 2.51 | 0.028 |
| Crosswalk type | −10.544 | 0.018 |
| Variable | Regression Coefficient | Standard Error of Regression Coefficient | Ward Statistical Values | Relative Hazard | |
|---|---|---|---|---|---|
| Step 1 | Crosswalk type | −0.140 | 0.066 | 3.134 | 0.786 |
| Gender | −0.084 | 0.093 | 3.936 | 0.832 | |
| Age | −0.010 | 0.055 | 0.033 | 0.990 | |
| Red-light time | −0.164 | 0.004 | 0.687 | 1.004 | |
| Crosswalk distance | 0.231 | 0.003 | 1.212 | 0.745 | |
| Traffic volume | 0.410 | 0.021 | 1.471 | 1.000 | |
| Number of lanes | 0.128 | 0.064 | 0.015 | 1.008 | |
| Step 2 | Crosswalk type | −0.141 | 0.066 | 3.235 | 0.786 |
| Age | −0.131 | 0.092 | 3.928 | 0.833 | |
| Red-light time | −0.180 | 0.055 | 0.036 | 0.990 | |
| Crosswalk distance | 0.237 | 0.006 | 2.625 | 0.645 | |
| Traffic volume | 0.423 | 0.04 | 0.973 | 1.004 | |
| Number of lanes | 0.130 | 0.03 | 2.334 | 1.000 | |
| Step 3 | Crosswalk type | −0.137 | 0.029 | 2.213 | 0.235 |
| Red-light time | −0.152 | 0.073 | 1.223 | 0.412 | |
| Crosswalk distance | 0.226 | 0.061 | 3.472 | 0.462 | |
| Traffic volume | −0.317 | 0.015 | 0.751 | 0.819 | |
| Number of lanes | 0.213 | 0.012 | 2.362 | 0.916 | |
| Step 4 | Crosswalk type | −0.120 | 0.066 | 3.250 | 0.786 |
| Red-light time | −0.183 | 0.092 | 3.893 | 0.834 | |
| Traffic volume | −0.434 | 0.004 | 0.993 | 1.004 | |
| Number of lanes | 0.144 | 0.000 | 1.386 | 1.000 | |
Publisher’s Note: MDPI stays neutral with regard to jurisdictional claims in published maps and institutional affiliations. |
© 2022 by the authors. Licensee MDPI, Basel, Switzerland. This article is an open access article distributed under the terms and conditions of the Creative Commons Attribution (CC BY) license (https://creativecommons.org/licenses/by/4.0/).
Share and Cite
Xing, J.; Zhang, Q.; Cheng, Q.; Zu, Z. A Geographical and Temporal Risk Evaluation Method for Red-Light Violations by Pedestrians at Signalized Intersections: Analysis and Results of Suzhou, China. Int. J. Environ. Res. Public Health 2022, 19, 14420. https://doi.org/10.3390/ijerph192114420
Xing J, Zhang Q, Cheng Q, Zu Z. A Geographical and Temporal Risk Evaluation Method for Red-Light Violations by Pedestrians at Signalized Intersections: Analysis and Results of Suzhou, China. International Journal of Environmental Research and Public Health. 2022; 19(21):14420. https://doi.org/10.3390/ijerph192114420
Chicago/Turabian StyleXing, Jiping, Qi Zhang, Qixiu Cheng, and Zhenshan Zu. 2022. "A Geographical and Temporal Risk Evaluation Method for Red-Light Violations by Pedestrians at Signalized Intersections: Analysis and Results of Suzhou, China" International Journal of Environmental Research and Public Health 19, no. 21: 14420. https://doi.org/10.3390/ijerph192114420
APA StyleXing, J., Zhang, Q., Cheng, Q., & Zu, Z. (2022). A Geographical and Temporal Risk Evaluation Method for Red-Light Violations by Pedestrians at Signalized Intersections: Analysis and Results of Suzhou, China. International Journal of Environmental Research and Public Health, 19(21), 14420. https://doi.org/10.3390/ijerph192114420