

The Acceptance Behavior of Smart Home Health Care Services in South Korea: An Integrated Model of UTAUT and TTF


Abstract
1. Introduction
“Smart home health care is a health care service in one’s residence incorporated with IoT technology and ubiquitous computing, which has the characteristics of home automation and home intelligence, communication networks, and remote access and control by authorized health care personnel. It offers informal health care services such as real-time or long-term health monitoring, unobtrusive activity support without interference with daily lives, and disease prevention through anomaly detection. It can reduce care costs, allow satisfactory service experience in a comfortable and private home environment, and ensure the independence of residents [15,16]”.
2. Theoretical Framework and Research Hypotheses
3. Materials and Methods
3.1. Measurement

| Construct | Items | Properties | Measures | References |
|---|---|---|---|---|
| Task characteristics (TAC) | TAC1 | Real-time health monitoring | In my home environment, I need to monitor my health status in real-time. | [13,14] |
| TAC2 | Long-term health monitoring | In my home environment, I need to monitor my health status in the long term. | ||
| TAC3 | Disease prevention by detecting anomalies | In my home environment, I need to prevent disease by detecting anomalies in my health status. | ||
| TAC4 | Emergency management | In my home environment, I need to deal with emergencies by detecting anomalies in my health status. | ||
| TAC5 | Unobtrusive activity assistance | In my home environment, I need services to assist my health care activities unobtrusively. | ||
| TAC6 | Continuous customization (adaptive system) | In my home environment, I need services to be continuously customized according to my health status. | [47,48] | |
| TAC7 | Connection with diversified stakeholders | In my home environment, I need to be connected to diverse stakeholders who will support my health care. | ||
| TAC8 | Improved privacy and independence | I need to improve privacy and life’s independence through home health care. | [49] | |
| Technology characteristics (TEC) | TEC1 | Ubiquitous service | Smart home health care technologies provide ubiquitous health care services. | [24,33] |
| TEC2 | Real-time service | Smart home health care technologies provide real-time health care services. | ||
| TEC3 | Reliable service/security | Smart home health care technologies provide reliable health care services. | ||
| TEC4 | Home intelligence | Smart home health care technologies provide intelligent health care services. | [3,50,51,52,53] | |
| TEC5 | Home automation | Smart home health care technologies provide automated health care services. | ||
| TEC6 | Communication network & IoT technology | Smart home health care technologies provide health care data and information based on the communication network and IoT technologies. | ||
| TEC7 | Remote control and access | Smart home health care technologies provide health care services with remote control and access through various smart devices. | ||
| Task–technology Fit (TTF) | TTF1 | Sufficiency | In my health care, the functions of SHHSs are sufficient (enough). | [24,33,43,45,54] |
| TTF2 | Appropriateness | In my health care, the functions of SHHSs are appropriate. | ||
| TTF3 | Meeting needs of function | The functions of SHHSs fully meet my health care requirements. | ||
| TTF4 | Meeting needs of quality | The quality of SHHSs can fully meet my health care requirements. | ||
| Performance expectancy (PE) | PE1 | Perceived usefulness | I feel SHHSs are useful in my health care. | [24,30,33,43,56] |
| PE2 | Extrinsic motivation | Using SHHSs accelerates the process of health care service provision. | ||
| PE3 | Relative advantage | Using SHHSs increases my chances of managing my health. | ||
| PE4 | Outcome expectation | Using SHHSs enables me to ameliorate my health status. | ||
| Effort expectancy | EE1 | Perceived ease of use | Skillfully using SHHSs is easy for me. | |
| EE2 | Complexity | I find SHHSs difficult to use. (reverse) | ||
| EE3 | Learnability | Learning how to use SHHSs is easy for me. | ||
| EE4 | Understandability | My interactions with SHHSs are clear and understandable. | ||
| Social influence | SI1 | Subjective norm | People who are important to me think that I should use SHHSs. | |
| SI2 | Social factors | People who influence my behavior think that I should use SHHSs. | ||
| SI3 | Image | I find that using SHHSs is a fashionable and popular way of health care. | ||
| Facilitating conditions | FC1 | Perceived behavioral control | I have the necessary resources (system, tools, circumstances) to use SHHSs. | |
| FC2 | Perceived behavioral control | I have the necessary knowledge to use SHHSs. | ||
| FC3 | Facilitating conditions | If I have difficulty using SHHSs, there will be support from the system to help me. | ||
| FC4 | Compatibility | SHHSs are compatible with other technologies or systems I use. | ||
| Behavioral intention | BI1 | Consideration | I will consider using SHHSs for my health care. | [24,30,44,56] |
| BI2 | Intention | I have the intention of using SHHSs for my health care. | ||
| BI3 | Want | I would like to use SHHSs for my health care if I have an opportunity. | ||
| BI4 | Plan | I have a plan to use SHHSs for my health care. | ||
| Adoption | ADT1 | I use SHHSs to monitor my health status. | [30,33,36,44] | |
| ADT2 | I use SHHSs to prevent disease and to deal with emergencies. | |||
| ADT3 | I use SHHSs for customized health care. | |||
| ADT4 | I use SHHSs for my overall health care. | |||
| Continued intention | CI1 | I will continue using SHHSs to monitor my health status. | [40,43,45,46,55] | |
| CI2 | I will continue using SHHSs to prevent disease and to deal with emergencies. | |||
| CI3 | I will continue using SHHSs for continuously customized health care. | |||
| CI4 | I can develop a habit of using SHHSs regularly. | |||
3.2. Data Collection
3.3. Statistical Procedure
4. Results
4.1. Descriptive Statistics
4.2. Measurement Model Evaluation
4.3. Structural Model Evaluation
4.4. Hypothesis Testing
5. Discussion
5.1. Principal Findings
5.2. Contributions and Implications
5.3. Limitations and Future Research
6. Conclusions
Author Contributions
Funding
Institutional Review Board Statement
Informed Consent Statement
Data Availability Statement
Conflicts of Interest
Appendix A
| TAC | TEC | TTF | PE | EE | SI | FC | BI | ADT | CI | |
|---|---|---|---|---|---|---|---|---|---|---|
| TAC | 0.856 | - | - | - | - | - | - | - | - | - |
| TEC | 0.579 | 0.892 | - | - | - | - | - | - | - | - |
| TTF | 0.292 | 0.513 | 0.923 | - | - | - | - | - | - | - |
| PE | 0.534 | 0.720 | 0.658 | 0.896 | - | - | - | - | - | - |
| EE | 0.303 | 0.440 | 0.419 | 0.511 | 0.878 | - | - | - | - | - |
| SI | 0.545 | 0.586 | 0.502 | 0.669 | 0.432 | 0.868 | - | - | - | - |
| FC | 0.348 | 0.505 | 0.549 | 0.623 | 0.628 | 0.550 | 0.875 | - | - | - |
| BI | 0.500 | 0.638 | 0.377 | 0.671 | 0.508 | 0.589 | 0.594 | 0.955 | - | - |
| ADT | 0.384 | 0.416 | 0.415 | 0.509 | 0.422 | 0.543 | 0.621 | 0.563 | 0.948 | - |
| CI | 0.510 | 0.549 | 0.433 | 0.656 | 0.477 | 0.651 | 0.608 | 0.779 | 0.790 | 0.937 |
| TAC | TEC | TTF | PE | EE | SI | FC | BI | ADT | CI | |
|---|---|---|---|---|---|---|---|---|---|---|
| TAC1 | 0.839 | 0.419 | 0.285 | 0.445 | 0.270 | 0.461 | 0.283 | 0.366 | 0.307 | 0.398 |
| TAC2 | 0.870 | 0.474 | 0.255 | 0.466 | 0.256 | 0.463 | 0.260 | 0.405 | 0.296 | 0.405 |
| TAC3 | 0.870 | 0.482 | 0.214 | 0.462 | 0.275 | 0.446 | 0.269 | 0.451 | 0.285 | 0.434 |
| TAC4 | 0.836 | 0.523 | 0.217 | 0.473 | 0.269 | 0.409 | 0.302 | 0.438 | 0.265 | 0.407 |
| TAC5 | 0.859 | 0.517 | 0.273 | 0.459 | 0.268 | 0.490 | 0.314 | 0.413 | 0.383 | 0.448 |
| TAC6 | 0.879 | 0.518 | 0.226 | 0.446 | 0.260 | 0.491 | 0.333 | 0.444 | 0.371 | 0.455 |
| TAC7 | 0.887 | 0.497 | 0.277 | 0.438 | 0.217 | 0.480 | 0.318 | 0.406 | 0.341 | 0.446 |
| TAC8 | 0.807 | 0.553 | 0.232 | 0.472 | 0.267 | 0.481 | 0.301 | 0.526 | 0.371 | 0.506 |
| TEC1 | 0.571 | 0.861 | 0.401 | 0.645 | 0.398 | 0.512 | 0.426 | 0.629 | 0.404 | 0.548 |
| TEC2 | 0.541 | 0.903 | 0.429 | 0.628 | 0.386 | 0.489 | 0.466 | 0.568 | 0.389 | 0.492 |
| TEC3 | 0.514 | 0.882 | 0.487 | 0.654 | 0.379 | 0.564 | 0.369 | 0.560 | 0.362 | 0.498 |
| TEC4 | 0.513 | 0.912 | 0.497 | 0.644 | 0.393 | 0.527 | 0.470 | 0.563 | 0.380 | 0.494 |
| TEC5 | 0.515 | 0.900 | 0.490 | 0.626 | 0.366 | 0.507 | 0.467 | 0.517 | 0.379 | 0.472 |
| TEC6 | 0.468 | 0.890 | 0.452 | 0.642 | 0.422 | 0.526 | 0.472 | 0.556 | 0.344 | 0.460 |
| TEC7 | 0.498 | 0.892 | 0.437 | 0.653 | 0.400 | 0.528 | 0.479 | 0.594 | 0.342 | 0.468 |
| TTF1 | 0.257 | 0.449 | 0.904 | 0.551 | 0.364 | 0.418 | 0.495 | 0.340 | 0.374 | 0.367 |
| TTF2 | 0.284 | 0.495 | 0.926 | 0.631 | 0.406 | 0.462 | 0.528 | 0.408 | 0.407 | 0.439 |
| TTF3 | 0.257 | 0.479 | 0.937 | 0.609 | 0.396 | 0.483 | 0.508 | 0.322 | 0.383 | 0.396 |
| TTF4 | 0.279 | 0.469 | 0.923 | 0.634 | 0.381 | 0.489 | 0.494 | 0.321 | 0.368 | 0.393 |
| PE1 | 0.467 | 0.592 | 0.704 | 0.885 | 0.475 | 0.611 | 0.580 | 0.576 | 0.481 | 0.583 |
| PE2 | 0.502 | 0.648 | 0.571 | 0.884 | 0.414 | 0.613 | 0.588 | 0.537 | 0.470 | 0.573 |
| PE3 | 0.494 | 0.675 | 0.530 | 0.923 | 0.466 | 0.589 | 0.526 | 0.669 | 0.465 | 0.631 |
| PE4 | 0.452 | 0.668 | 0.544 | 0.893 | 0.472 | 0.587 | 0.537 | 0.620 | 0.407 | 0.561 |
| EE1 | 0.313 | 0.458 | 0.452 | 0.533 | 0.924 | 0.426 | 0.637 | 0.503 | 0.429 | 0.473 |
| EE2 | 0.086 | 0.227 | 0.219 | 0.258 | 0.779 | 0.214 | 0.395 | 0.309 | 0.195 | 0.252 |
| EE3 | 0.267 | 0.393 | 0.341 | 0.449 | 0.923 | 0.362 | 0.558 | 0.470 | 0.342 | 0.409 |
| EE4 | 0.335 | 0.413 | 0.410 | 0.490 | 0.879 | 0.462 | 0.570 | 0.460 | 0.455 | 0.488 |
| SI1 | 0.486 | 0.446 | 0.404 | 0.503 | 0.314 | 0.875 | 0.415 | 0.422 | 0.477 | 0.531 |
| SI2 | 0.490 | 0.470 | 0.441 | 0.507 | 0.325 | 0.878 | 0.419 | 0.404 | 0.458 | 0.518 |
| SI3 | 0.450 | 0.571 | 0.451 | 0.676 | 0.445 | 0.852 | 0.554 | 0.635 | 0.474 | 0.614 |
| FC1 | 0.253 | 0.359 | 0.468 | 0.492 | 0.509 | 0.447 | 0.867 | 0.464 | 0.573 | 0.508 |
| FC2 | 0.316 | 0.397 | 0.470 | 0.522 | 0.603 | 0.460 | 0.897 | 0.523 | 0.575 | 0.566 |
| FC3 | 0.340 | 0.527 | 0.500 | 0.608 | 0.556 | 0.521 | 0.854 | 0.559 | 0.499 | 0.524 |
| FC4 | 0.306 | 0.482 | 0.481 | 0.557 | 0.527 | 0.498 | 0.880 | 0.531 | 0.524 | 0.526 |
| BI1 | 0.479 | 0.615 | 0.373 | 0.649 | 0.507 | 0.577 | 0.604 | 0.949 | 0.531 | 0.731 |
| BI2 | 0.480 | 0.614 | 0.368 | 0.658 | 0.497 | 0.575 | 0.582 | 0.974 | 0.549 | 0.759 |
| BI3 | 0.471 | 0.611 | 0.334 | 0.636 | 0.462 | 0.530 | 0.532 | 0.950 | 0.496 | 0.718 |
| BI4 | 0.478 | 0.596 | 0.366 | 0.618 | 0.470 | 0.565 | 0.548 | 0.945 | 0.571 | 0.766 |
| ADT1 | 0.385 | 0.413 | 0.399 | 0.478 | 0.409 | 0.528 | 0.625 | 0.533 | 0.953 | 0.740 |
| ADT2 | 0.374 | 0.380 | 0.379 | 0.442 | 0.368 | 0.518 | 0.548 | 0.453 | 0.917 | 0.702 |
| ADT3 | 0.338 | 0.390 | 0.404 | 0.494 | 0.407 | 0.508 | 0.588 | 0.554 | 0.964 | 0.769 |
| ADT4 | 0.360 | 0.394 | 0.393 | 0.513 | 0.412 | 0.507 | 0.591 | 0.587 | 0.956 | 0.782 |
| CI1 | 0.471 | 0.511 | 0.421 | 0.619 | 0.453 | 0.610 | 0.593 | 0.740 | 0.775 | 0.956 |
| CI2 | 0.512 | 0.517 | 0.398 | 0.614 | 0.395 | 0.613 | 0.540 | 0.674 | 0.721 | 0.908 |
| CI3 | 0.479 | 0.531 | 0.420 | 0.630 | 0.453 | 0.625 | 0.565 | 0.762 | 0.755 | 0.965 |
| CI4 | 0.451 | 0.500 | 0.384 | 0.595 | 0.488 | 0.593 | 0.580 | 0.743 | 0.710 | 0.920 |
References
- Bassi, A.; Horn, G. Internet of Things in 2020: A Roadmap for the Future. Eur. Comm. Inf. Soc. Media 2008, 22, 97–114. [Google Scholar]
- Marikyan, D.; Papagiannidis, S.; Alamanos, E. A systematic review of the smart home literature: A user perspective. Technol. Forecast. Soc. Chang. 2019, 138, 139–154. [Google Scholar] [CrossRef]
- Alam, M.R.; Reaz, M.B.I.; Ali, M.A.M. A Review of Smart Homes: Past, Present, and Future. IEEE Trans. Syst. Man Cybern. Part C 2012, 42, 1190–1203. [Google Scholar] [CrossRef]
- Aldrich, F.K. Smart homes: Past, present and future. In Inside the Smart Home; Harper, R., Ed.; Springer Science & Business Media: London, UK, 2006; pp. 17–40. [Google Scholar]
- Balta-Ozkan, N.; Amerighi, O.; Boteler, B. A comparison of consumer perceptions towards smart homes in the UK, Germany and Italy: Reflections for policy and future research. Technol. Anal. Strateg. Manag. 2014, 26, 1176–1195. [Google Scholar] [CrossRef]
- De Silva, L.C.; Morikawa, C.; Petra, I.M. State of the art of smart homes. Eng. Appl. Artif. Intell. 2012, 25, 1313–1321. [Google Scholar] [CrossRef]
- Chan, M.; Estève, D.; Escriba, C.; Campo, E. A review of smart homes—Present state and future challenges. Comput. Methods Programs Biomed. 2008, 91, 55–81. [Google Scholar] [CrossRef] [PubMed]
- Demiris, G.; Hensel, B.K. Technologies for an aging society: A systematic review of “smart home” applications. Yearb. Med. Inform. 2008, 17, 33–40. [Google Scholar]
- Demiris, G.; Hensel, B. “Smart Homes” for Patients at the End of Life. J. Hous. Elder. 2009, 23, 106–115. [Google Scholar] [CrossRef]
- Reeder, B.; Meyer, E.; Lazar, A.; Chaudhuri, S.; Thompson, H.J.; Demiris, G. Framing the evidence for health smart homes and home-based consumer health technologies as a public health intervention for independent aging: A systematic review. Int. J. Med. Inform. 2013, 82, 565–579. [Google Scholar] [CrossRef]
- Czaja, S.J. Long-Term Care Services and Support Systems for Older Adults: The Role of Technology. Am. Psychol. 2016, 71, 294–301. [Google Scholar] [CrossRef]
- Chan, M.; Campo, E.; Estève, D.; Fourniols, J.-Y. Smart homes—Current features and future perspectives. Maturitas 2009, 64, 90–97. [Google Scholar] [CrossRef] [PubMed]
- Amiribesheli, M.; Benmansour, A.; Bouchachia, A. A review of smart homes in healthcare. J. Ambient Intell. Humaniz. Comput. 2015, 6, 495–517. [Google Scholar] [CrossRef]
- Majumder, S.; Aghayi, E.; Noferesti, M.; Memarzadeh-Tehran, H.; Mondal, T.; Pang, Z.; Deen, M.J. Smart Homes for Elderly Healthcare-Recent Advances and Research Challenges. Sensors 2017, 17, 2496. [Google Scholar] [CrossRef] [PubMed]
- Kang, H.J.; Han, J.; Kwon, G.H. An Ecological Approach to Smart Homes for Health Care Services: Conceptual Framework of a Smart Servicescape Wheel. JMIR mHealth uHealth 2019, 7, e12425. [Google Scholar] [CrossRef]
- Kang, H.J.; Han, J.; Kwon, G.H. Determining the Intellectual Structure and Academic Trends of Smart Home Health Care Research: Coword and Topic Analyses. J. Med. Internet Res. 2021, 23, e19625. [Google Scholar] [CrossRef]
- Peek, S.T.M.; Wouters, E.J.M.; van Hoof, J.; Luijkx, K.G.; Boeije, H.R.; Vrijhoef, H.J.M. Factors influencing acceptance of technology for aging in place: A systematic review. Int. J. Med. Inform. 2014, 83, 235–248. [Google Scholar] [CrossRef]
- Marikyan, D.; Papagiannidis, S.; Rana, O.F.; Ranjan, R.; Morgan, G. “Alexa, let’s talk about my productivity”: The impact of digital assistants on work productivity. J. Bus. Res. 2022, 142, 572–584. [Google Scholar] [CrossRef]
- Papagiannidis, S.; Harris, J.; Morton, D. WHO led the digital transformation of your company? A reflection of IT related challenges during the pandemic. Int. J. Inf. Manag. 2020, 55, 102166. [Google Scholar] [CrossRef]
- Venkatesh, V. Impacts of COVID-19: A research agenda to support people in their fight. Int. J. Inf. Manag. 2020, 55, 102197. [Google Scholar] [CrossRef]
- Medina, M.; Babiuch, C.; Card, M.; Gavrilescu, R.; Zafirau, W.; Boose, E.; Giuliano, K.; Kim, A.; Jones, R.; Boissy, A. Home monitoring for COVID-19. Clevel. Clin. J. Med. 2020. [Google Scholar] [CrossRef]
- Taiwo, O.; Ezugwu, A.E. Smart healthcare support for remote patient monitoring during covid-19 quarantine. Inform. Med. Unlocked 2020, 20, 100428. [Google Scholar] [CrossRef] [PubMed]
- Palos-Sanchez, P.R.; Saura, J.R.; Rios Martin, M.Á.; Aguayo-Camacho, M. Toward a Better Understanding of the Intention to Use mHealth Apps: Exploratory Study. JMIR mHealth uHealth 2021, 9, e27021. [Google Scholar] [CrossRef] [PubMed]
- Wang, H.; Tao, D.; Yu, N.; Qu, X. Understanding consumer acceptance of healthcare wearable devices: An integrated model of UTAUT and TTF. Int. J. Med. Inform. 2020, 139, 104156. [Google Scholar] [CrossRef]
- Askari, M.; Klaver, N.S.; van Gestel, T.J.; van de Klundert, J. Intention to use Medical Apps Among Older Adults in the Netherlands: Cross-Sectional Study. J. Med. Internet Res. 2020, 22, e18080. [Google Scholar] [CrossRef]
- Akdur, G.; Aydin, M.N.; Akdur, G. Adoption of Mobile Health Apps in Dietetic Practice: Case Study of Diyetkolik. JMIR mHealth uHealth 2020, 8, e16911. [Google Scholar] [CrossRef]
- Deng, Z.; Hong, Z.; Ren, C.; Zhang, W.; Xiang, F. What Predicts Patients’ Adoption Intention Toward mHealth Services in China: Empirical Study. JMIR mHealth uHealth 2018, 6, e172. [Google Scholar] [CrossRef] [PubMed]
- Davis, F.D. Perceived Usefulness, Perceived Ease of Use, and User Acceptance of Information Technology. MIS Q. 1989, 13, 319–340. [Google Scholar] [CrossRef]
- Venkatesh, V.; Davis, F.D. A Theoretical Extension of the Technology Acceptance Model: Four Longitudinal Field Studies. Manag. Sci. 2000, 46, 186–204. [Google Scholar] [CrossRef]
- Venkatesh, V.; Morris, M.G.; Davis, G.B.; Davis, F.D. User Acceptance of Information Technology: Toward a Unified View. MIS Q. 2003, 27, 425–478. [Google Scholar] [CrossRef]
- Williams, M.D.; Rana, N.P.; Dwivedi, Y.K. The unified theory of acceptance and use of technology (UTAUT): A literature review. J. Enterp. Inf. Manag. 2015, 28, 443–488. [Google Scholar] [CrossRef]
- Magsamen-Conrad, K.; Upadhyaya, S.; Joa, C.Y.; Dowd, J. Bridging the divide: Using UTAUT to predict multigenerational tablet adoption practices. Comput. Hum. Behav. 2015, 50, 186–196. [Google Scholar] [CrossRef] [PubMed]
- Zhou, T.; Lu, Y.; Wang, B. Integrating TTF and UTAUT to explain mobile banking user adoption. Comput. Hum. Behav. 2010, 26, 760–767. [Google Scholar] [CrossRef]
- Shiferaw, K.B.; Mehari, E.A. Modeling predictors of acceptance and use of electronic medical record system in a resource limited setting: Using modified UTAUT model. Inform. Med. Unlocked 2019, 17, 100182. [Google Scholar] [CrossRef]
- Cimperman, M.; Makovec Brenčič, M.; Trkman, P. Analyzing older users’ home telehealth services acceptance behavior—Applying an Extended UTAUT model. Int. J. Med. Inform. 2016, 90, 22–31. [Google Scholar] [CrossRef]
- Goodhue, D.L.; Thompson, R.L. Task-Technology Fit and Individual Performance. MIS Q. 1995, 19, 213–236. [Google Scholar] [CrossRef]
- Goodhue, D.L. Understanding User Evaluations of Information Systems. Manag. Sci. 1995, 41, 1827–1844. [Google Scholar] [CrossRef]
- Gebauer, J.; Ginsburg, M. Exploring the black box of task-technology fit. Commun. ACM 2009, 52, 130–135. [Google Scholar] [CrossRef]
- Aljukhadar, M.; Senecal, S.; Nantel, J. Is more always better? Investigating the task-technology fit theory in an online user context. Inf. Manag. 2014, 51, 391–397. [Google Scholar] [CrossRef]
- Wu, B.; Chen, X. Continuance intention to use MOOCs: Integrating the technology acceptance model (TAM) and task technology fit (TTF) model. Comput. Hum. Behav. 2017, 67, 221–232. [Google Scholar] [CrossRef]
- Lee, C.-C.; Cheng, H.K.; Cheng, H.-H. An empirical study of mobile commerce in insurance industry: Task–technology fit and individual differences. Decis. Support Syst. 2007, 43, 95–110. [Google Scholar] [CrossRef]
- Junglas, I.; Abraham, C.; Watson, R.T. Task-technology fit for mobile locatable information systems. Decis. Support Syst. 2008, 45, 1046–1057. [Google Scholar] [CrossRef]
- Wan, L.; Xie, S.; Shu, A. Toward an Understanding of University Students’ Continued Intention to Use MOOCs: When UTAUT Model Meets TTF Model. SAGE Open 2020, 10, 2158244020941858. [Google Scholar] [CrossRef]
- Oliveira, T.; Faria, M.; Thomas, M.A.; Popovič, A. Extending the understanding of mobile banking adoption: When UTAUT meets TTF and ITM. Int. J. Inf. Manag. 2014, 34, 689–703. [Google Scholar] [CrossRef]
- Lin, W.-S.; Wang, C.-H. Antecedences to continued intentions of adopting e-learning system in blended learning instruction: A contingency framework based on models of information system success and task-technology fit. Comput. Educ. 2012, 58, 88–99. [Google Scholar] [CrossRef]
- Guo, Z.; Xiao, L.; Van Toorn, C.; Lai, Y.; Seo, C. Promoting online learners’ continuance intention: An integrated flow framework. Inf. Manag. 2016, 53, 279–295. [Google Scholar] [CrossRef]
- Rouse, W.B. Managing complexity: Disease control as a complex adaptive system. Inf. Knowl. Syst. Manag. 2000, 2, 143–165. [Google Scholar]
- Rouse, W.B. Health care as a complex adaptive system: Implications for design and management. Bridge-Wash.-Natl. Acad. Eng. 2008, 38, 17–25. [Google Scholar]
- van Hoof, J.; Demiris, G.; Wouters, E.J. Handbook of Smart Homes, Health Care and Well-Being; Fontys: Tilburg, The Netherlands, 2014. [Google Scholar]
- van Berlo, A.; Allen, B. Design Guidelines on Smart Homes: A COST 219bis Guidebook; COST, European Co-Operation in the Field of Scientific and Technical Research: Brussels, Belgium, 1999. [Google Scholar]
- King, N. Smart Home—A Definition; Intertek Research and Testing Center: Ōta, Tokyo, 2003; pp. 1–6. [Google Scholar]
- Park, S.H.; Won, S.H.; Lee, J.B.; Kim, S.W. Smart home: Digitally engineered domestic life. Pers. Ubiquitous Comput. 2003, 7, 189–196. [Google Scholar] [CrossRef]
- Balta-Ozkan, N.; Davidson, R.; Bicket, M.; Whitmarsh, L. The development of smart homes market in the UK. Energy 2013, 60, 361–372. [Google Scholar] [CrossRef]
- McGill, T.J.; Klobas, J.E. A task–technology fit view of learning management system impact. Comput. Educ. 2009, 52, 496–508. [Google Scholar] [CrossRef]
- Dağhan, G.; Akkoyunlu, B. Modeling the continuance usage intention of online learning environments. Comput. Hum. Behav. 2016, 60, 198–211. [Google Scholar] [CrossRef]
- Floruss, J.; Vahlpahl, N. Artificial Intelligence in Healthcare: Acceptance of AI-based Support Systems by Healthcare Professionals. Master’s Thesis, Jönköping University, Jönköping, Sweden, 2020. [Google Scholar]
- Leung, S.-O. A Comparison of Psychometric Properties and Normality in 4-, 5-, 6-, and 11-Point Likert Scales. J. Soc. Serv. Res. 2011, 37, 412–421. [Google Scholar] [CrossRef]
- Wu, H.; Leung, S.-O. Can Likert Scales be Treated as Interval Scales?—A Simulation Study. J. Soc. Serv. Res. 2017, 43, 527–532. [Google Scholar] [CrossRef]
- Hwang, W.; Choi, Y. New Growth Engines in the Era of the 4th Industrial Revolution, Smart Healthcare Industry; Korea Institute for Industrial Economics and Trades: Sejong, Korea, 2017. [Google Scholar]
- Lin, H.M.; Lee, M.H.; Liang, J.C.; Chang, H.Y.; Huang, P.; Tsai, C.C. A review of using partial least square structural equation modeling in e-learning research. Br. J. Educ. Technol. 2020, 51, 1354–1372. [Google Scholar] [CrossRef]
- Luo, X.; Li, H.; Zhang, J.; Shim, J.P. Examining multi-dimensional trust and multi-faceted risk in initial acceptance of emerging technologies: An empirical study of mobile banking services. Decis. Support Syst. 2010, 49, 222–234. [Google Scholar] [CrossRef]
- Wong, K.K.-K. Partial least squares structural equation modeling (PLS-SEM) techniques using SmartPLS. Mark. Bull. 2013, 24, 1–32. [Google Scholar]
- Hair, J.F.; Ringle, C.M.; Sarstedt, M. PLS-SEM: Indeed a Silver Bullet. J. Mark. Theory Pract. 2011, 19, 139–152. [Google Scholar] [CrossRef]
- Huang, K.-Y.; Chuang, Y.-R. Aggregated model of TTF with UTAUT2 in an employment website context. J. Data Sci. 2017, 15, 187–204. [Google Scholar] [CrossRef]
- Hair, J.F.; Hult, G.T.M.; Ringle, C.M.; Sarstedt, M. A Primer on Partial Least Squares Structural Equation Modeling (PLS-SEM); SAGE Publications: Thousand Oaks, CA, USA, 2016. [Google Scholar]
- Vinzi, V.E.; Chin, W.W.; Henseler, J.; Wang, H. Handbook of Partial Least Squares: Concepts, Methods and Applications; Springer: Berlin/Heidelberg, Germany, 2010. [Google Scholar]
- Cronbach, L.J. Coefficient alpha and the internal structure of tests. Psychometrika 1951, 16, 297–334. [Google Scholar] [CrossRef]
- Dijkstra, T.K.; Henseler, J. Consistent Partial Least Squares Path Modeling. MIS Q. 2015, 39, 297–316. [Google Scholar] [CrossRef]
- Chin, W.W. The partial least squares approach for structural equation modeling. In Modern Methods for Business Research; Methodology for Business and Management; Lawrence Erlbaum Associates Publishers: Mahwah, NJ, USA, 1998; pp. 295–336. [Google Scholar]
- Fornell, C.; Larcker, D.F. Evaluating Structural Equation Models with Unobservable Variables and Measurement Error. J. Mark. Res. 1981, 18, 39–50. [Google Scholar] [CrossRef]
- Stone, M. Cross-Validatory Choice and Assessment of Statistical Predictions. J. R. Stat. Soc. Ser. B 1974, 36, 111–133. [Google Scholar] [CrossRef]
- Dishaw, M.T.; Strong, D.M. Extending the technology acceptance model with task–technology fit constructs. Inf. Manag. 1999, 36, 9–21. [Google Scholar] [CrossRef]
- Dwivedi, Y.K.; Rana, N.P.; Jeyaraj, A.; Clement, M.; Williams, M.D. Re-examining the Unified Theory of Acceptance and Use of Technology (UTAUT): Towards a Revised Theoretical Model. Inf. Syst. Front. 2019, 21, 719–734. [Google Scholar] [CrossRef]
- Panetta, K. 5 Trends Emerge in the Gartner Hype Cycle for Emerging Technologies 2018. Available online: https://www.gartner.com/smarterwithgartner/5-trends-emerge-in-gartner-hype-cycle-for-emerging-technologies-2018 (accessed on 18 November 2021).
- Dayton, L. How South Korea made itself a global innovation leader. Nature 2020, 581, S54–S56. [Google Scholar] [CrossRef]
- KOTRA. Ideal Global Test Bed. Available online: https://www.investkorea.org/ik-en/cntnts/i-304/web.do (accessed on 13 December 2021).


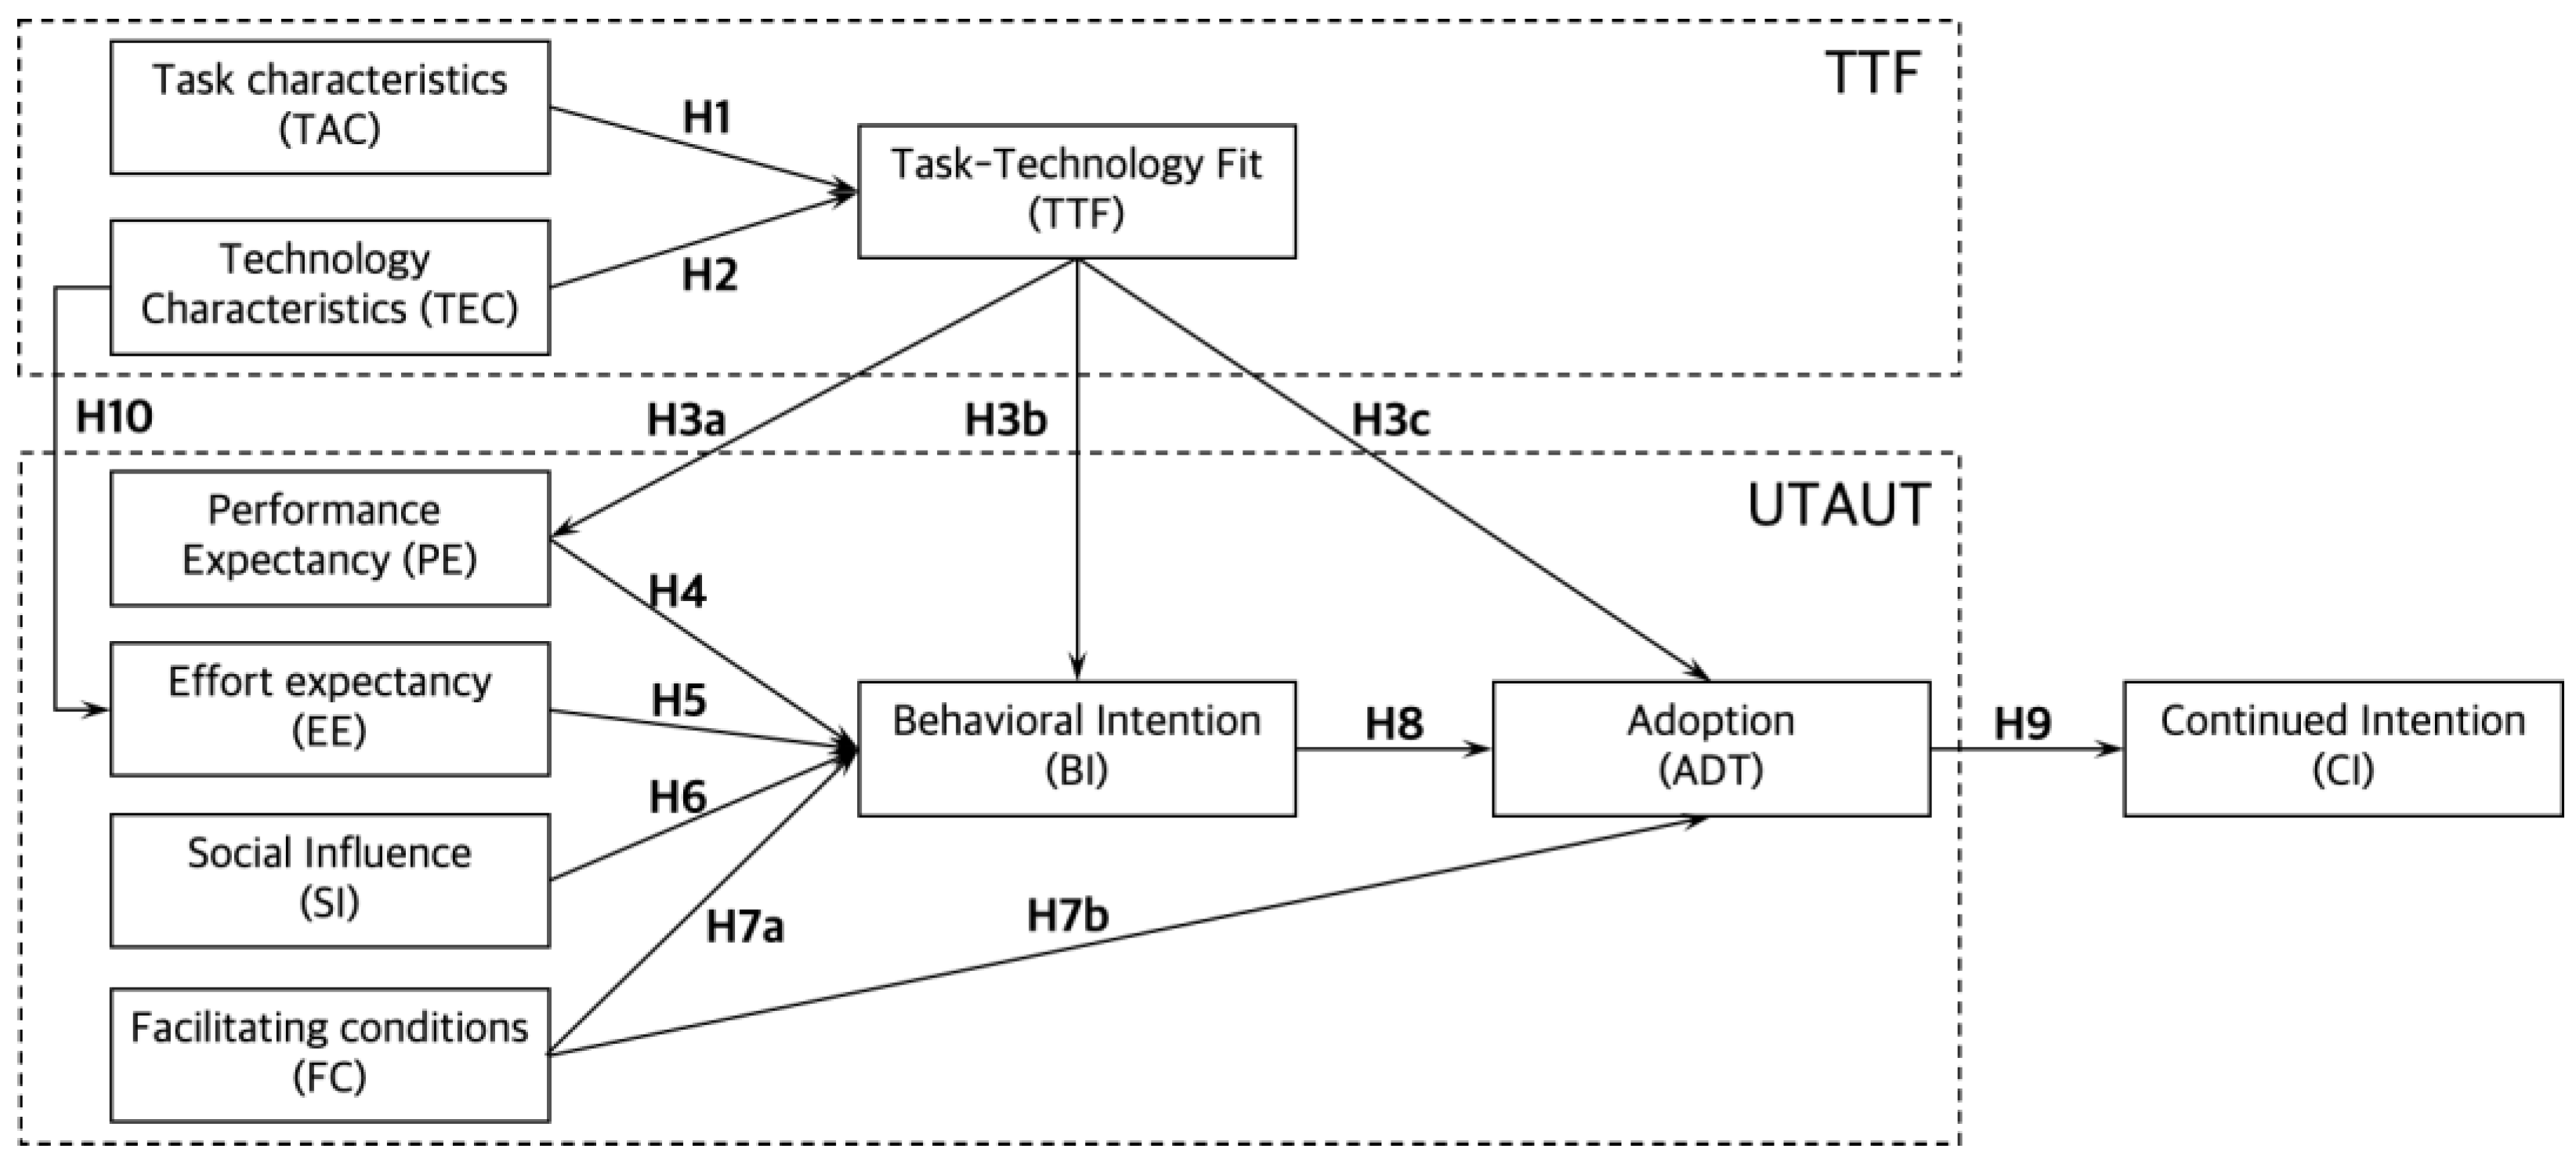
| Label | Hypotheses |
|---|---|
| H1 | The task characteristics of SHHSs * positively affect task–technology fit. |
| H2 | The technology characteristics of SHHSs positively affect task–technology fit. |
| H3a | Task–technology fit positively affects the performance expectancy of SHHSs. |
| H3b | Task–technology fit positively affects the behavioral intention to use SHHSs. |
| H3c | Task–technology fit positively affects the adoption of SHHSs. |
| H4 | Performance expectancy positively affects the behavioral intention to use SHHSs. |
| H5 | Effort expectancy positively affects the behavioral intention to use SHHSs. |
| H6 | Social influence positively affects the behavioral intention to use SHHSs. |
| H7a | Facilitating conditions positively affect the behavioral intention to use SHHSs. |
| H7b | Facilitating conditions positively affect the adoption of SHHSs. |
| H8 | Behavioral intention to use SHHSs positively affects the adoption of SHHSs. |
| H9 | The adoption of SHHSs positively affects the continued intention to use SHHSs. |
| H10 | The technology characteristics of SHHSs positively affect effort expectancy. |
| Characteristics | Values, n (%) | |
|---|---|---|
| Gender | Men | 241 (49.5) |
| Women | 246 (50.5) | |
| Age group | 20s | 184 (37.8) |
| 30s | 192 (39.4) | |
| 40s | 72 (14.8) | |
| 50s | 39 (8.0) | |
| Residential district | Capital area—Seoul | 160 (32.9) |
| Capital area—Incheon, Gyeonggi-do | 151 (31.0) | |
| Metropolitan cities | 80 (16.4) | |
| Other districts | 96 (19.7) | |
| Marital status | Single | 313 (64.3) |
| Married | 174 (35.7) | |
| Household members | 1 person | 87 (17.9) |
| 2 people | 80 (16.4) | |
| 3 people | 141 (29.0) | |
| 4 people | 135 (27.7) | |
| 5 or more | 44 (9.0) | |
| SHHS experiences (multiple answers) | Personal health care devices | 275 (56.5%) |
| Wearable devices | 294 (60.4%) | |
| Health information app services | 313 (64.3%) | |
| Customized health care app services | 334 (68.6%) | |
| Telemedicine services | 60 (12.3%) | |
| Construct | Item | Mean (SD) | 95% CI | Skewness | Kurtosis |
|---|---|---|---|---|---|
| Task characteristics (TAC) | TAC1 | 6.26 (2.68) | [6.02, 6.50] | −0.67 | −0.01 |
| TAC2 | 6.50 (2.55) | [6.27, 6.73] | −0.76 | 0.35 | |
| TAC3 | 7.02 (2.39) | [6.81, 7.24] | −0.88 | 0.77 | |
| TAC4 | 6.98 (2.61) | [6.74, 7.21] | −0.88 | 0.31 | |
| TAC5 | 6.05 (2.69) | [5.81, 6.29] | −0.52 | −0.22 | |
| TAC6 | 6.32 (2.64) | [6.08, 6.55] | −0.68 | 0.07 | |
| TAC7 | 6.03 (2.62) | [5.79, 6.26] | −0.45 | −0.25 | |
| TAC8 | 6.61 (2.46) | [6.39, 6.83] | −0.59 | 0.18 | |
| Technology characteristics (TEC) | TEC1 | 7.02 (1.89) | [6.85, 7.19] | −0.33 | 0.46 |
| TEC2 | 6.87 (1.88) | [6.70, 7.03] | −0.28 | 0.59 | |
| TEC3 | 6.57 (1.96) | [6.40, 6.75] | −0.09 | 0.14 | |
| TEC4 | 6.72 (1.96) | [6.55, 6.90] | −0.32 | 0.46 | |
| TEC5 | 6.66 (2.02) | [6.48, 6.83] | −0.35 | 0.32 | |
| TEC6 | 6.80 (1.93) | [6.63, 6.97] | −0.32 | 0.49 | |
| TEC7 | 6.97 (1.90) | [6.80, 7.14] | −0.31 | 0.26 | |
| Task-technology Fit (TTF) | TTF1 | 5.72 (2.08) | [5.53, 5.90] | 0.02 | 0.05 |
| TTF2 | 5.94 (1.94) | [5.76, 6.11] | 0.14 | 0.01 | |
| TTF3 | 5.50 (2.07) | [5.31, 5.68] | 0.05 | 0.12 | |
| TTF4 | 5.46 (1.99) | [5.28, 5.64] | 0.05 | 0.36 | |
| Performance expectancy (PE) | PE1 | 6.30 (1.86) | [6.14, 6.47] | −0.12 | 0.41 |
| PE2 | 6.16 (1.90) | [5.99, 6.33] | −0.15 | 0.76 | |
| PE3 | 6.80 (1.87) | [6.63, 6.96] | −0.40 | 0.75 | |
| PE4 | 6.79 (1.83) | [6.63, 6.96] | −0.30 | 0.66 | |
| Effort expectancy (EE) | EE1 | 6.58 (1.96) | [6.40, 6.75] | −0.20 | 0.03 |
| EE2 | 6.63 (1.97) | [6.46, 6.81] | −0.05 | −0.36 | |
| EE3 | 6.76 (1.96) | [6.59, 6.94] | −0.19 | −0.08 | |
| EE4 | 6.24 (1.83) | [6.08, 6.40] | 0.21 | −0.11 | |
| Social influence (SI) | SI1 | 5.72 (2.54) | [5.49, 5.94] | −0.30 | −0.12 |
| SI2 | 5.56 (2.51) | [5.34, 5.79] | −0.27 | −0.05 | |
| SI3 | 6.64 (2.06) | [6.46, 6.83] | −0.39 | 0.48 | |
| Facilitating conditions (FC) | FC1 | 5.83 (2.25) | [5.63, 6.03] | −0.36 | 0.22 |
| FC2 | 6.07 (2.10) | [5.89, 6.26] | −0.40 | 0.49 | |
| FC3 | 6.21 (1.95) | [6.03, 6.38] | −0.14 | 0.09 | |
| FC4 | 6.14 (2.03) | [5.96, 6.32] | −0.26 | 0.45 | |
| Behavioral intention (BI) | BI1 | 7.07 (1.93) | [6.90, 7.25] | −0.27 | −0.35 |
| BI2 | 7.16 (1.98) | [6.98, 7.33] | −0.50 | 0.10 | |
| BI3 | 7.27 (2.03) | [7.09, 7.45] | −0.53 | −0.09 | |
| BI4 | 7.05 (2.10) | [6.86, 7.24] | −0.55 | 0.16 | |
| Adoption (ADT) | ADT1 | 5.45 (2.55) | [5.22, 5.67] | −0.50 | −0.09 |
| ADT2 | 5.21 (2.62) | [4.98, 5.44] | −0.37 | −0.34 | |
| ADT3 | 5.62 (2.52) | [5.40, 5.84] | −0.50 | 0.04 | |
| ADT4 | 5.73 (2.53) | [5.51, 5.96] | −0.56 | 0.07 | |
| Continued intention (CI) | CI1 | 6.41 (2.27) | [6.20, 6.61] | −0.48 | 0.26 |
| CI2 | 6.20 (2.38) | [5.99, 6.41] | −0.56 | 0.22 | |
| CI3 | 6.47 (2.30) | [6.27, 6.68] | −0.57 | 0.31 | |
| CI4 | 6.44 (2.32) | [6.23, 6.64] | −0.58 | 0.44 |
| Construct | Item | Convergent Validity | Internal Consistency Reliability | ||||
|---|---|---|---|---|---|---|---|
| Outer Loading | Indicator Reliability | AVE | Cronbach α | Rho Value | Composite Reliability | ||
| (>0.70) | (>0.50) | (>0.50) | (>0.70) | (>0.70) | (>0.70) | ||
| Task characteristics (TAC) | TAC1 | 0.839 | 0.703 | 0.733 | 0.948 | 0.952 | 0.956 |
| TAC2 | 0.870 | 0.757 | |||||
| TAC3 | 0.870 | 0.758 | |||||
| TAC4 | 0.836 | 0.699 | |||||
| TAC5 | 0.859 | 0.738 | |||||
| TAC6 | 0.879 | 0.772 | |||||
| TAC7 | 0.887 | 0.787 | |||||
| TAC8 | 0.807 | 0.652 | |||||
| Technology characteristics (TEC) | TEC1 | 0.861 | 0.741 | 0.795 | 0.957 | 0.958 | 0.964 |
| TEC2 | 0.903 | 0.815 | |||||
| TEC3 | 0.882 | 0.779 | |||||
| TEC4 | 0.912 | 0.832 | |||||
| TEC5 | 0.900 | 0.810 | |||||
| TEC6 | 0.890 | 0.792 | |||||
| TEC7 | 0.892 | 0.795 | |||||
| Task–technology Fit (TTF) | TTF1 | 0.903 | 0.816 | 0.852 | 0.942 | 0.944 | 0.958 |
| TTF2 | 0.925 | 0.856 | |||||
| TTF3 | 0.938 | 0.880 | |||||
| TTF4 | 0.924 | 0.854 | |||||
| Performance expectancy (PE) | PE1 | 0.885 | 0.783 | 0.803 | 0.918 | 0.920 | 0.942 |
| PE2 | 0.884 | 0.781 | |||||
| PE3 | 0.923 | 0.851 | |||||
| PE4 | 0.893 | 0.797 | |||||
| Effort expectancy (EE) | EE1 | 0.924 | 0.853 | 0.771 | 0.901 | 0.930 | 0.931 |
| EE2 | 0.779 | 0.607 | |||||
| EE3 | 0.923 | 0.851 | |||||
| EE4 | 0.879 | 0.773 | |||||
| Social influence (SI) | SI1 | 0.875 | 0.766 | 0.754 | 0.845 | 0.889 | 0.902 |
| SI2 | 0.878 | 0.771 | |||||
| SI3 | 0.852 | 0.725 | |||||
| Facilitating conditions (FC) | FC1 | 0.867 | 0.751 | 0.765 | 0.897 | 0.898 | 0.929 |
| FC2 | 0.897 | 0.804 | |||||
| FC3 | 0.854 | 0.730 | |||||
| FC4 | 0.880 | 0.775 | |||||
| Behavioral intention (BI) | BI1 | 0.949 | 0.901 | 0.912 | 0.968 | 0.968 | 0.976 |
| BI2 | 0.974 | 0.948 | |||||
| BI3 | 0.950 | 0.903 | |||||
| BI4 | 0.946 | 0.894 | |||||
| Adoption (ADT) | ADT1 | 0.953 | 0.908 | 0.898 | 0.962 | 0.964 | 0.972 |
| ADT2 | 0.917 | 0.841 | |||||
| ADT3 | 0.964 | 0.929 | |||||
| ADT4 | 0.956 | 0.914 | |||||
| Continued intention (CI) | CI1 | 0.956 | 0.913 | 0.879 | 0.954 | 0.955 | 0.967 |
| CI2 | 0.908 | 0.825 | |||||
| CI3 | 0.965 | 0.931 | |||||
| CI4 | 0.920 | 0.846 | |||||
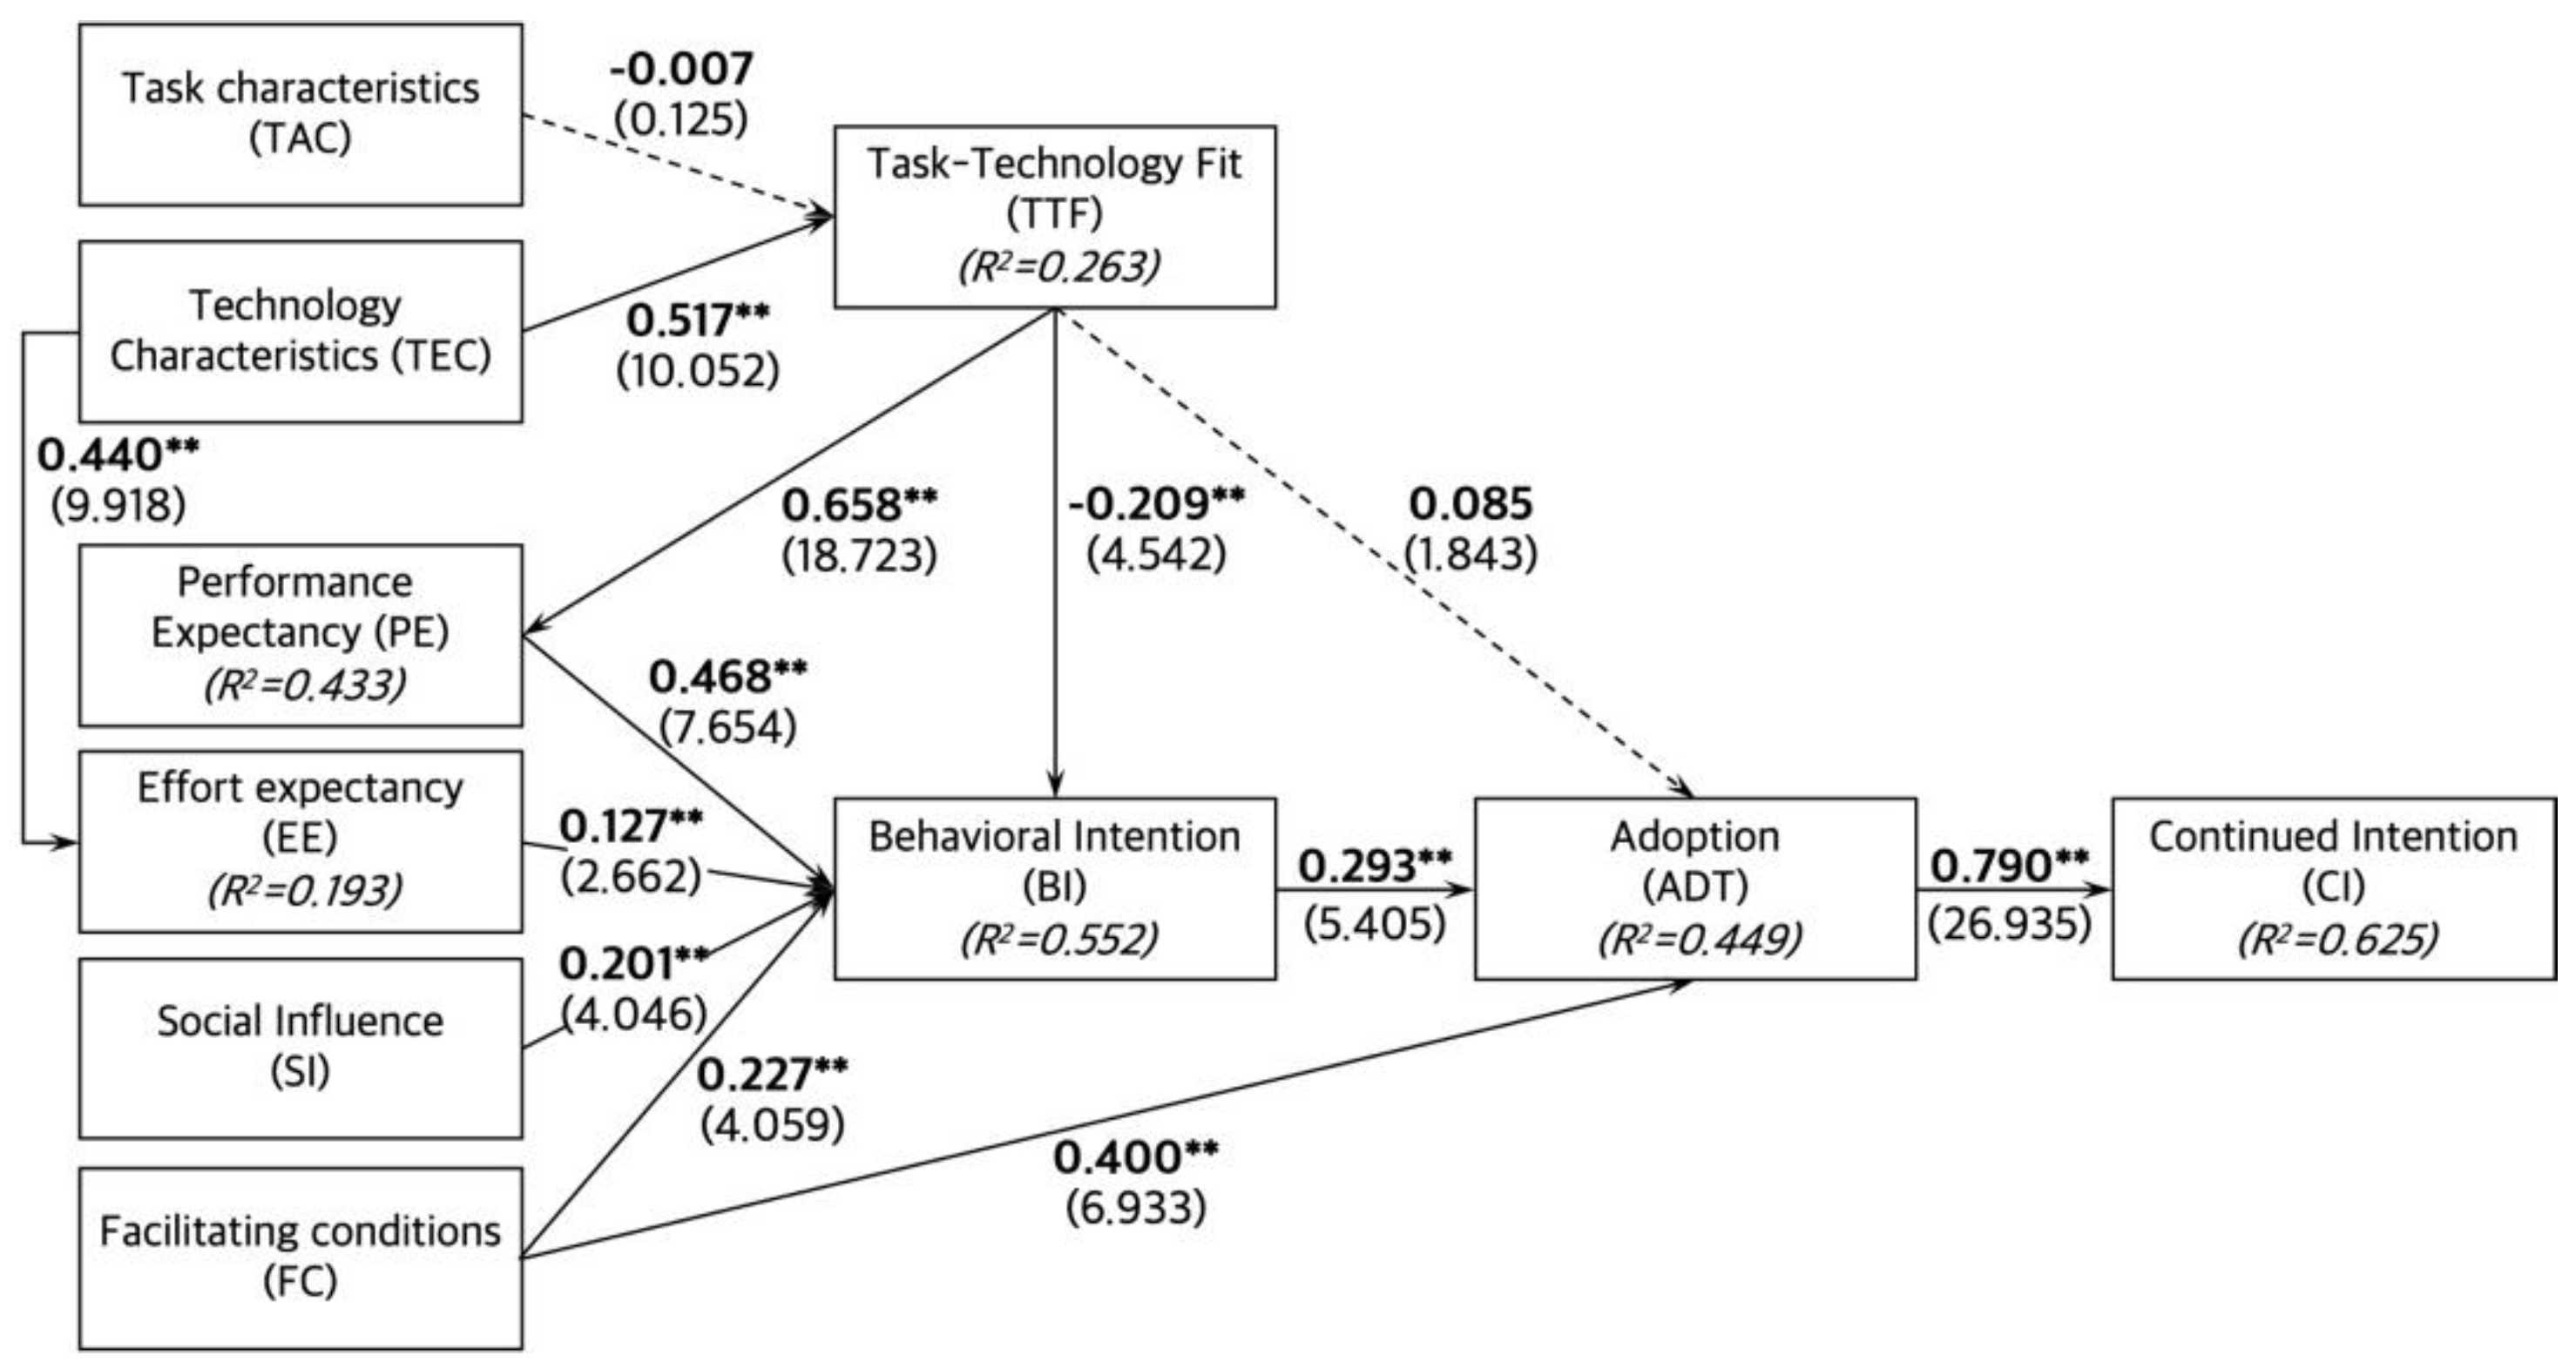
| Hypothesis (Path) | VIF | f2 | Path Coefficient (β) | t Value | p Value | Support |
|---|---|---|---|---|---|---|
| H1 (TAC → TTF) | 1.504 | 0.000 | −0.007 | 0.125 | 0.900 | No |
| H2 (TEC → TTF) | 1.504 | 0.241 | 0.517 | 10.052 | 0.000 | Yes |
| H3a (TTF → PE) | 1.000 | 0.764 | 0.658 | 18.723 | 0.000 | Yes |
| H3b (TTF → BI) | 1.875 | 0.052 | −0.209 | 4.542 | 0.000 | Yes |
| H3c (TTF → ADT) | 1.440 | 0.009 | 0.085 | 1.843 | 0.065 | No |
| H4 (PE → BI) | 2.664 | 0.183 | 0.468 | 7.654 | 0.000 | Yes |
| H5 (EE → BI) | 1.721 | 0.021 | 0.127 | 2.662 | 0.008 | Yes |
| H6 (SI → BI) | 1.923 | 0.047 | 0.201 | 4.046 | 0.000 | Yes |
| H7a (FC → BI) | 2.227 | 0.052 | 0.227 | 4.059 | 0.000 | Yes |
| H7b (FC → ADT) | 1.906 | 0.152 | 0.400 | 6.933 | 0.000 | Yes |
| H8 (BI → ADT) | 1.553 | 0.101 | 0.293 | 5.405 | 0.000 | Yes |
| H9 (ADT → CI) | 1.000 | 1.666 | 0.790 | 26.935 | 0.000 | Yes |
| H10 (TEC → EE) | 1.000 | 0.239 | 0.440 | 9.918 | 0.000 | Yes |
Publisher’s Note: MDPI stays neutral with regard to jurisdictional claims in published maps and institutional affiliations. |
© 2022 by the authors. Licensee MDPI, Basel, Switzerland. This article is an open access article distributed under the terms and conditions of the Creative Commons Attribution (CC BY) license (https://creativecommons.org/licenses/by/4.0/).
Share and Cite
Kang, H.-J.; Han, J.; Kwon, G.H. The Acceptance Behavior of Smart Home Health Care Services in South Korea: An Integrated Model of UTAUT and TTF. Int. J. Environ. Res. Public Health 2022, 19, 13279. https://doi.org/10.3390/ijerph192013279
Kang H-J, Han J, Kwon GH. The Acceptance Behavior of Smart Home Health Care Services in South Korea: An Integrated Model of UTAUT and TTF. International Journal of Environmental Research and Public Health. 2022; 19(20):13279. https://doi.org/10.3390/ijerph192013279
Chicago/Turabian StyleKang, Hyo-Jin, Jieun Han, and Gyu Hyun Kwon. 2022. "The Acceptance Behavior of Smart Home Health Care Services in South Korea: An Integrated Model of UTAUT and TTF" International Journal of Environmental Research and Public Health 19, no. 20: 13279. https://doi.org/10.3390/ijerph192013279
APA StyleKang, H.-J., Han, J., & Kwon, G. H. (2022). The Acceptance Behavior of Smart Home Health Care Services in South Korea: An Integrated Model of UTAUT and TTF. International Journal of Environmental Research and Public Health, 19(20), 13279. https://doi.org/10.3390/ijerph192013279