
Impact of Thermal Dissipation on the Lighting Performance and Useful Life of LED Luminaires Applied to Urban Lighting: A Case Study

 ,
,  ,
,
Abstract
:1. Introduction
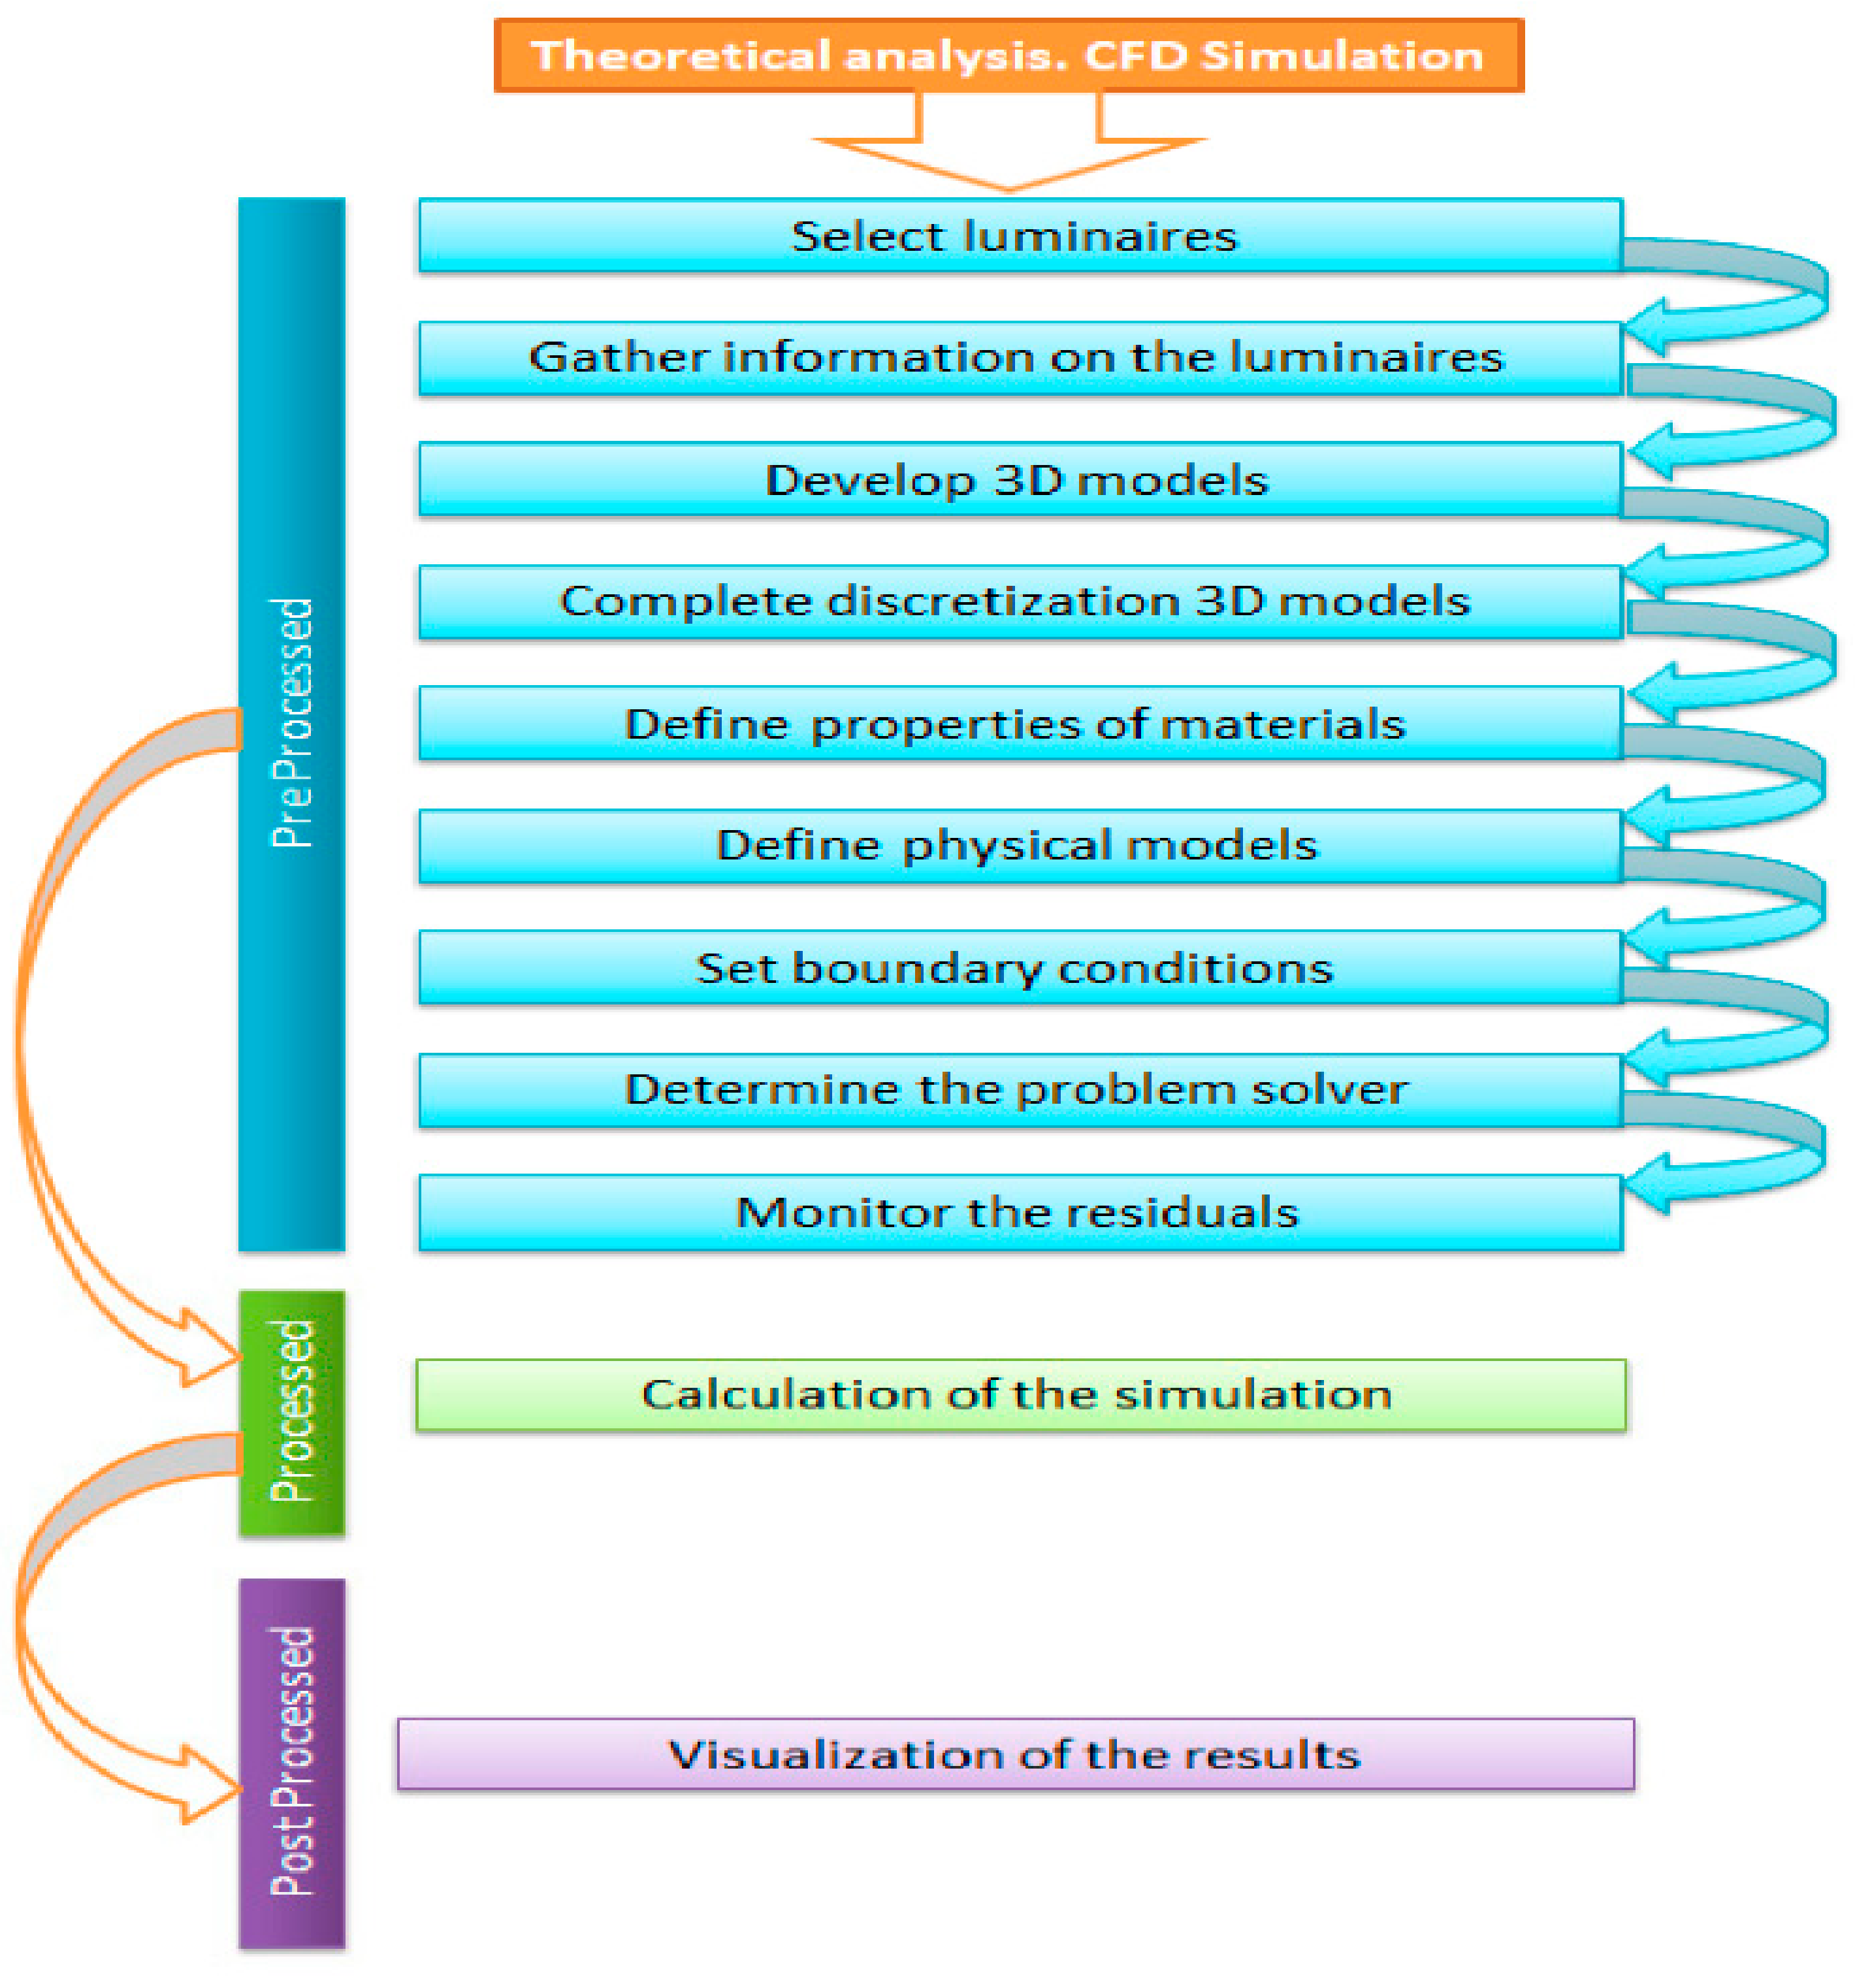
2. Methodology
2.1. Pre-Processing
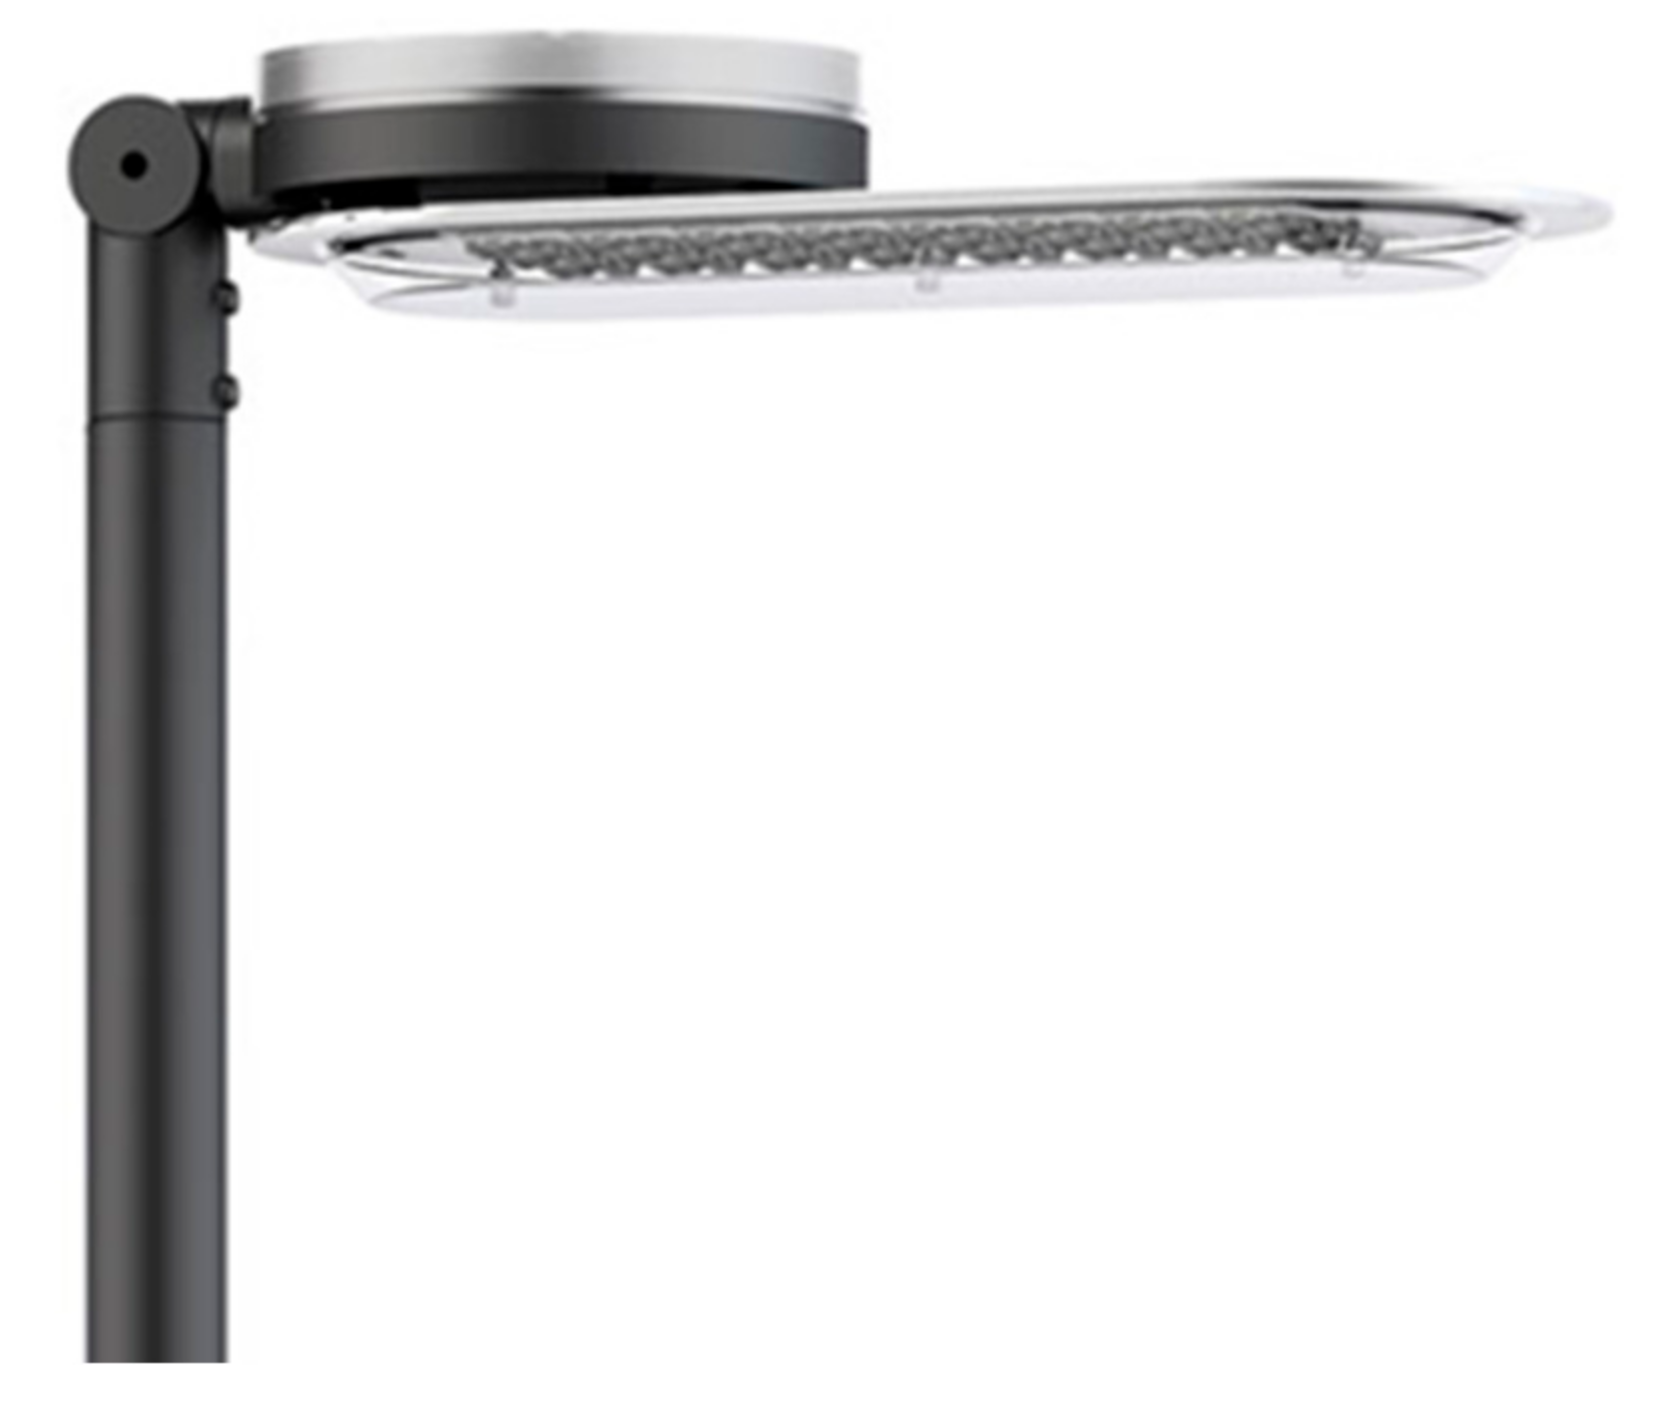
2.1.1. Select the Luminaires for the Study
2.1.2. Obtaining the Information on the Luminaire to Be Analyzed
- -
- To transform alternating current (AC) into direct current (DC), which is used by LEDs for their correct operation;
- -
- To adapt the output voltage and current to the LED requirements.
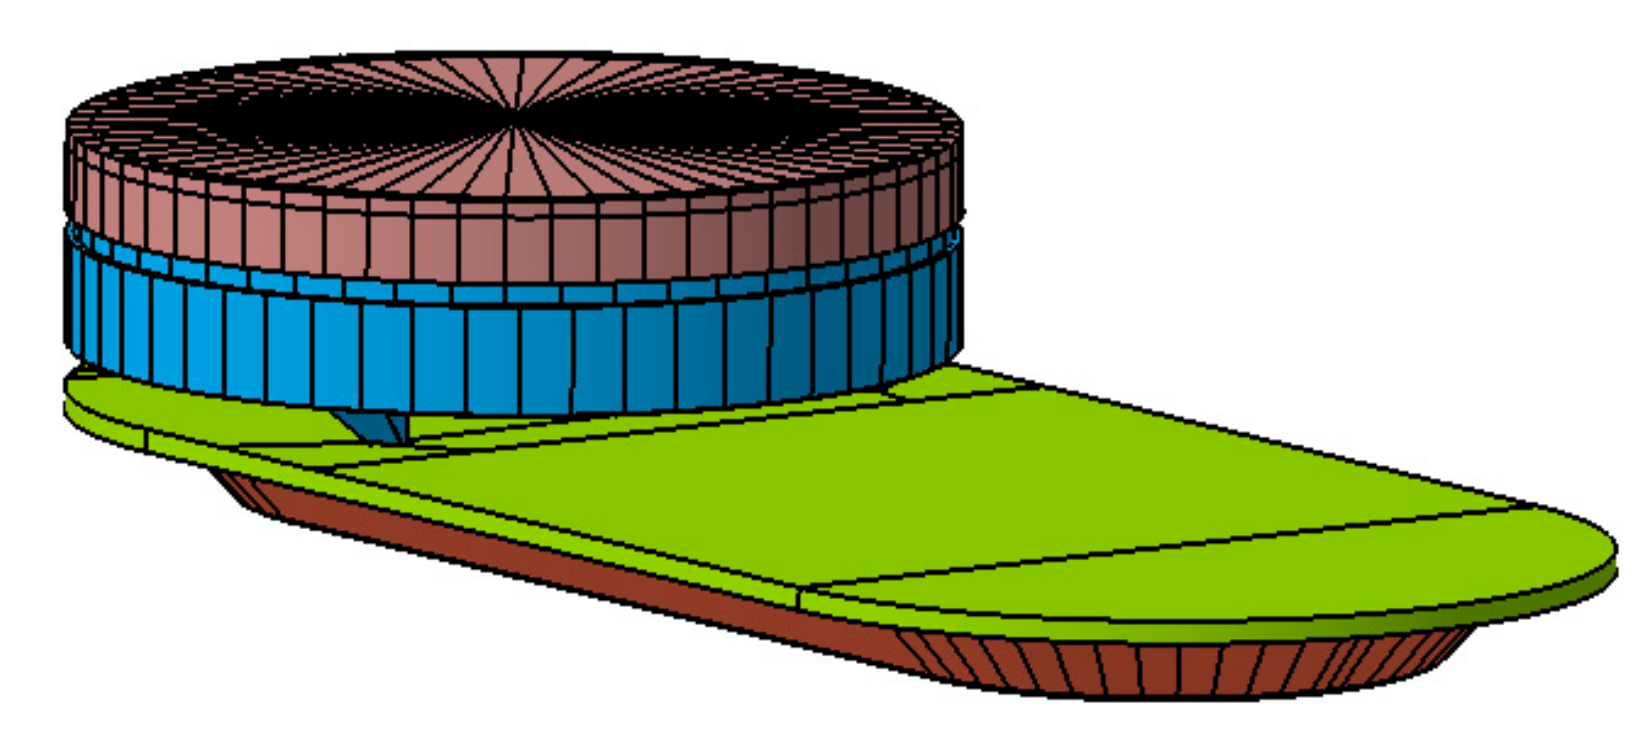
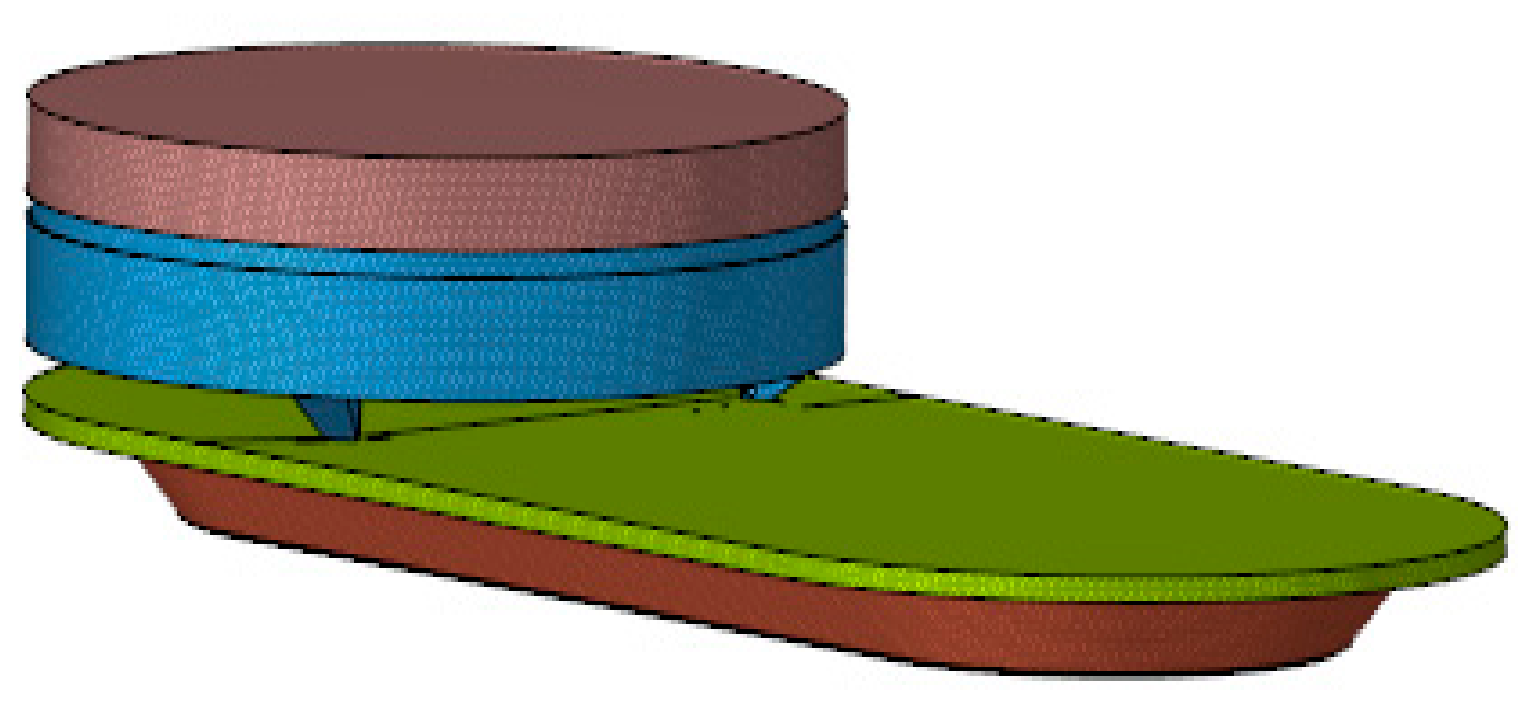
2.1.3. Elaboration of the 3D Model of the Equipment
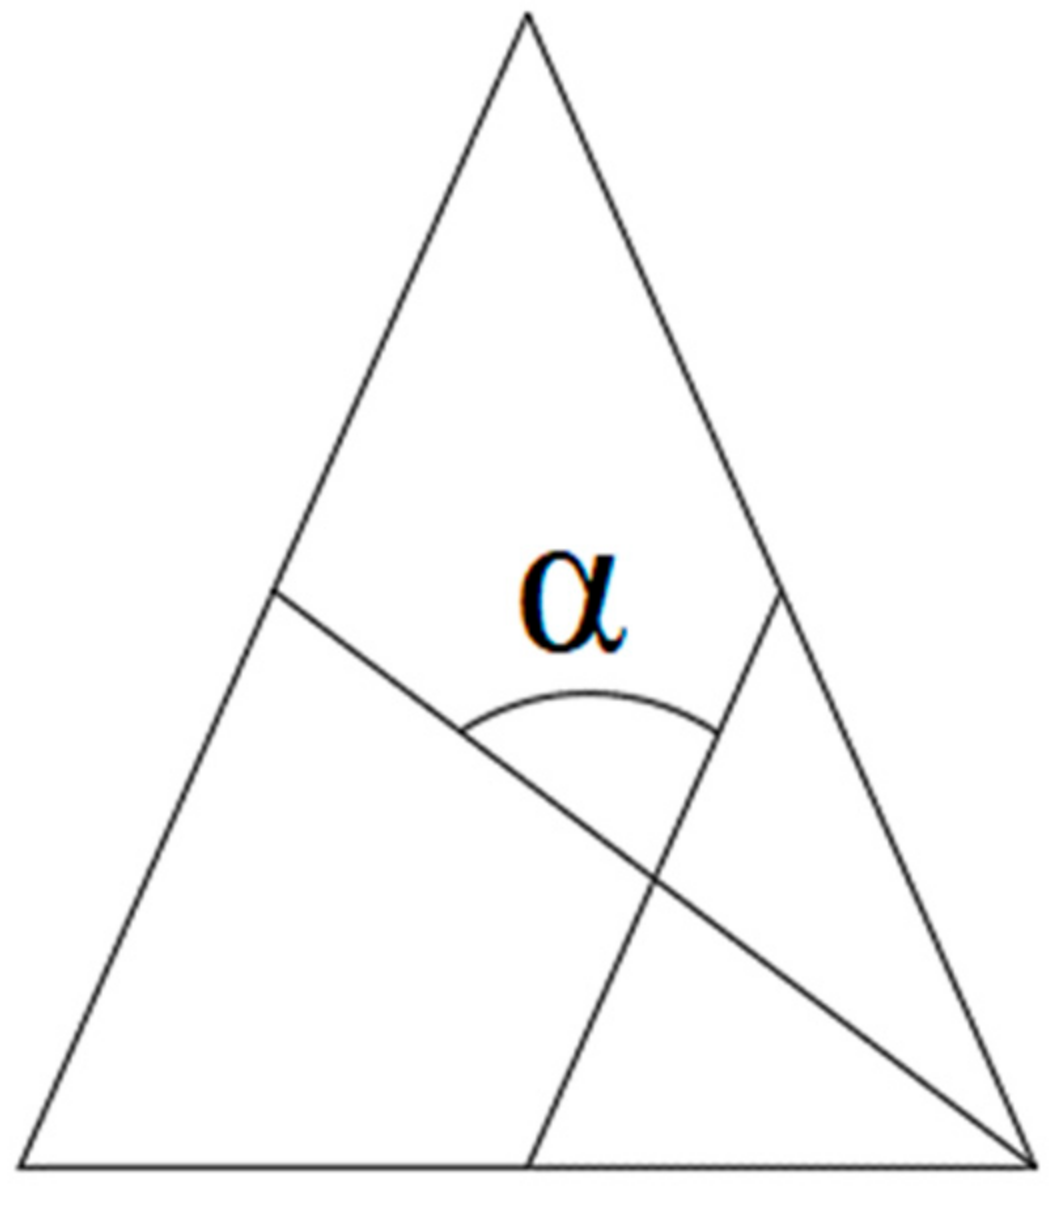
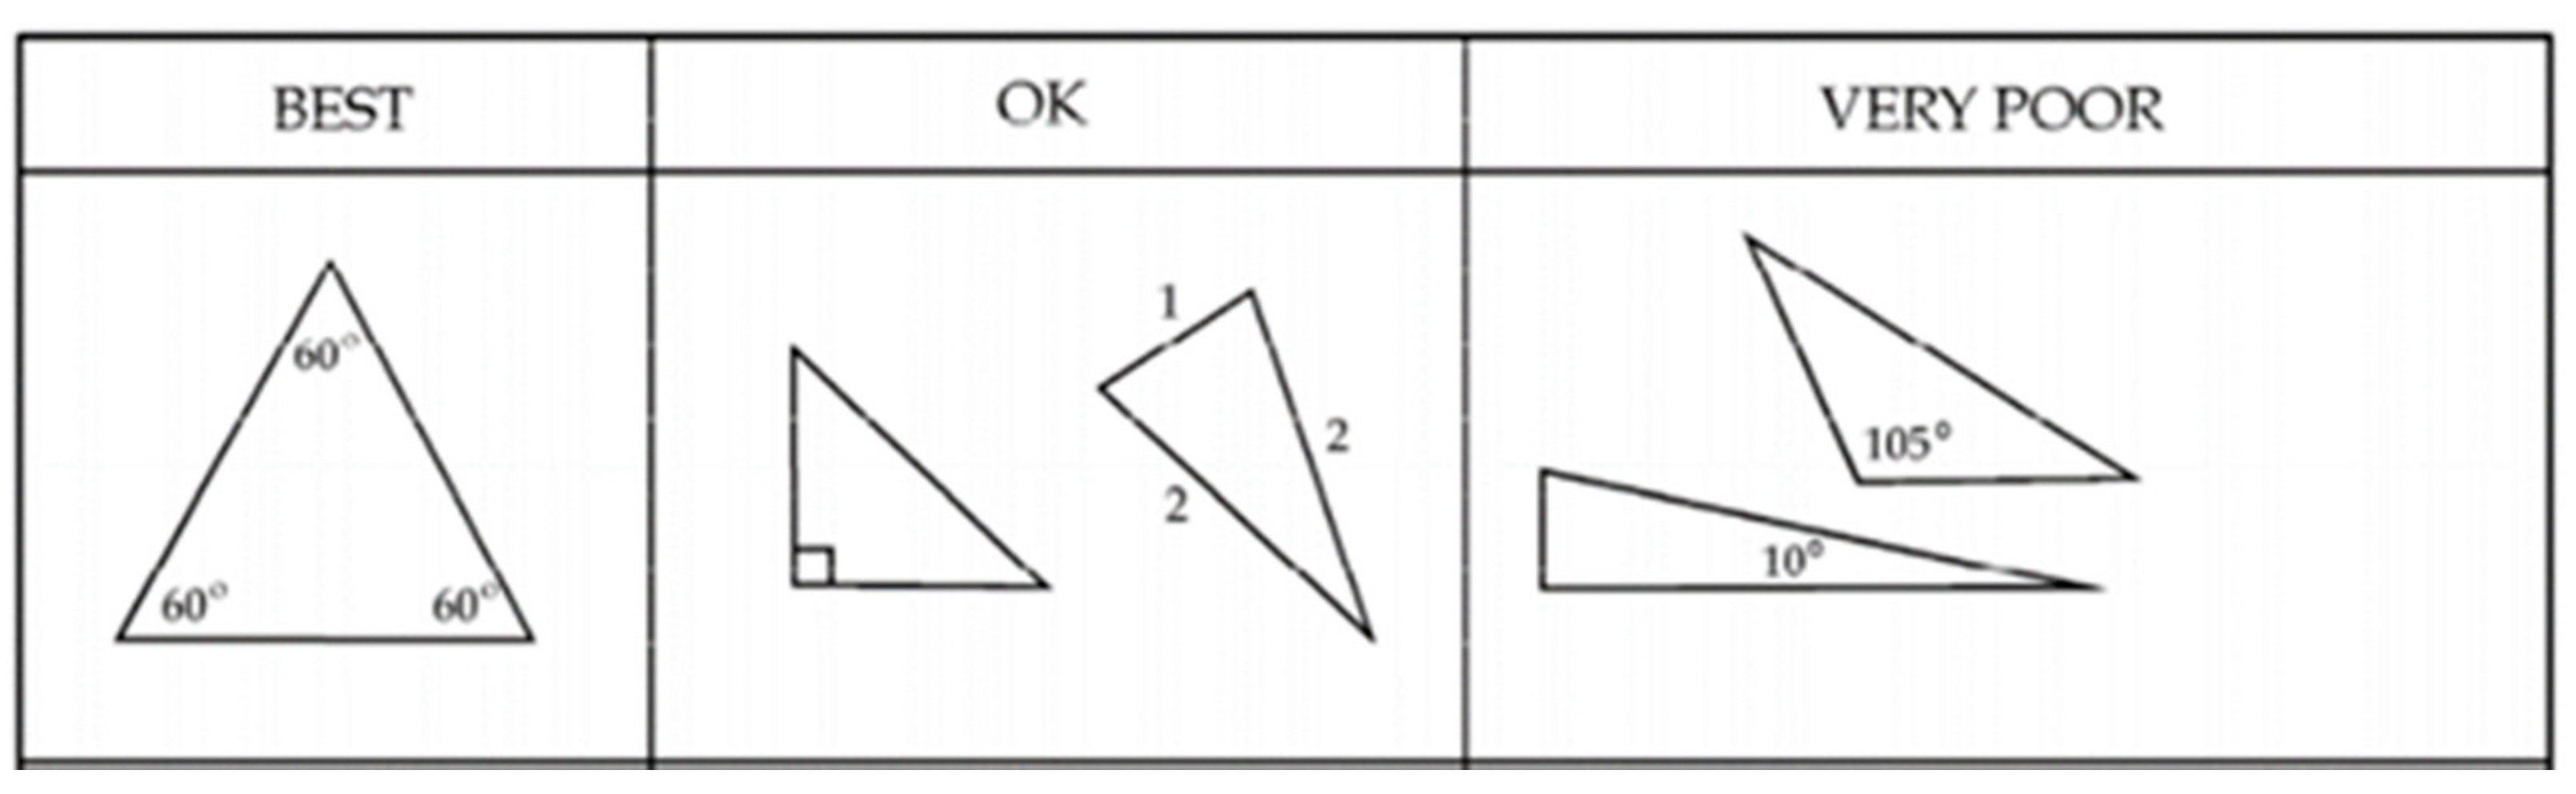
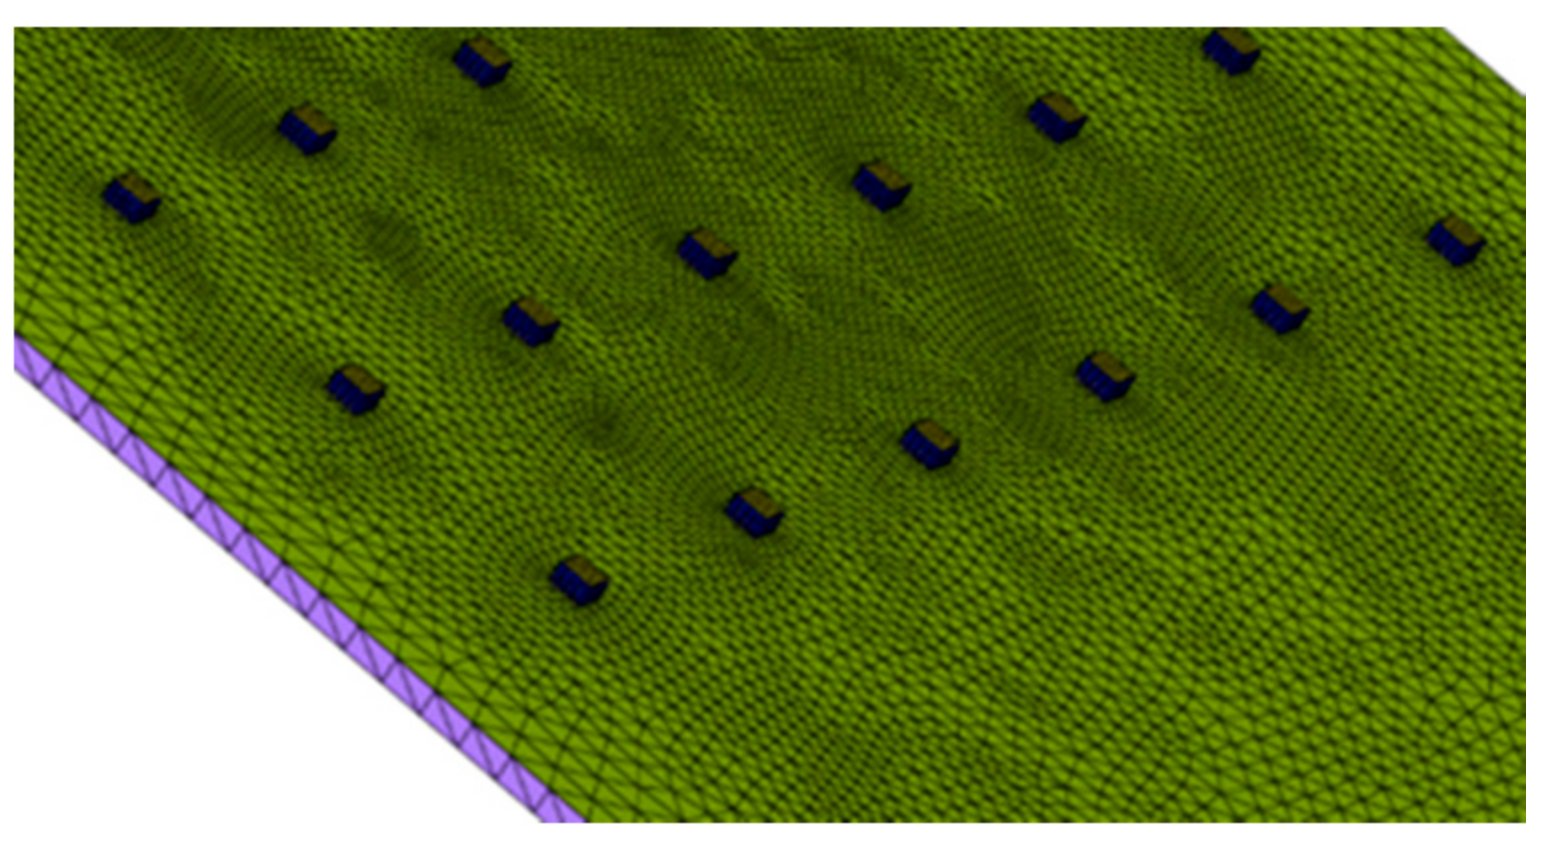
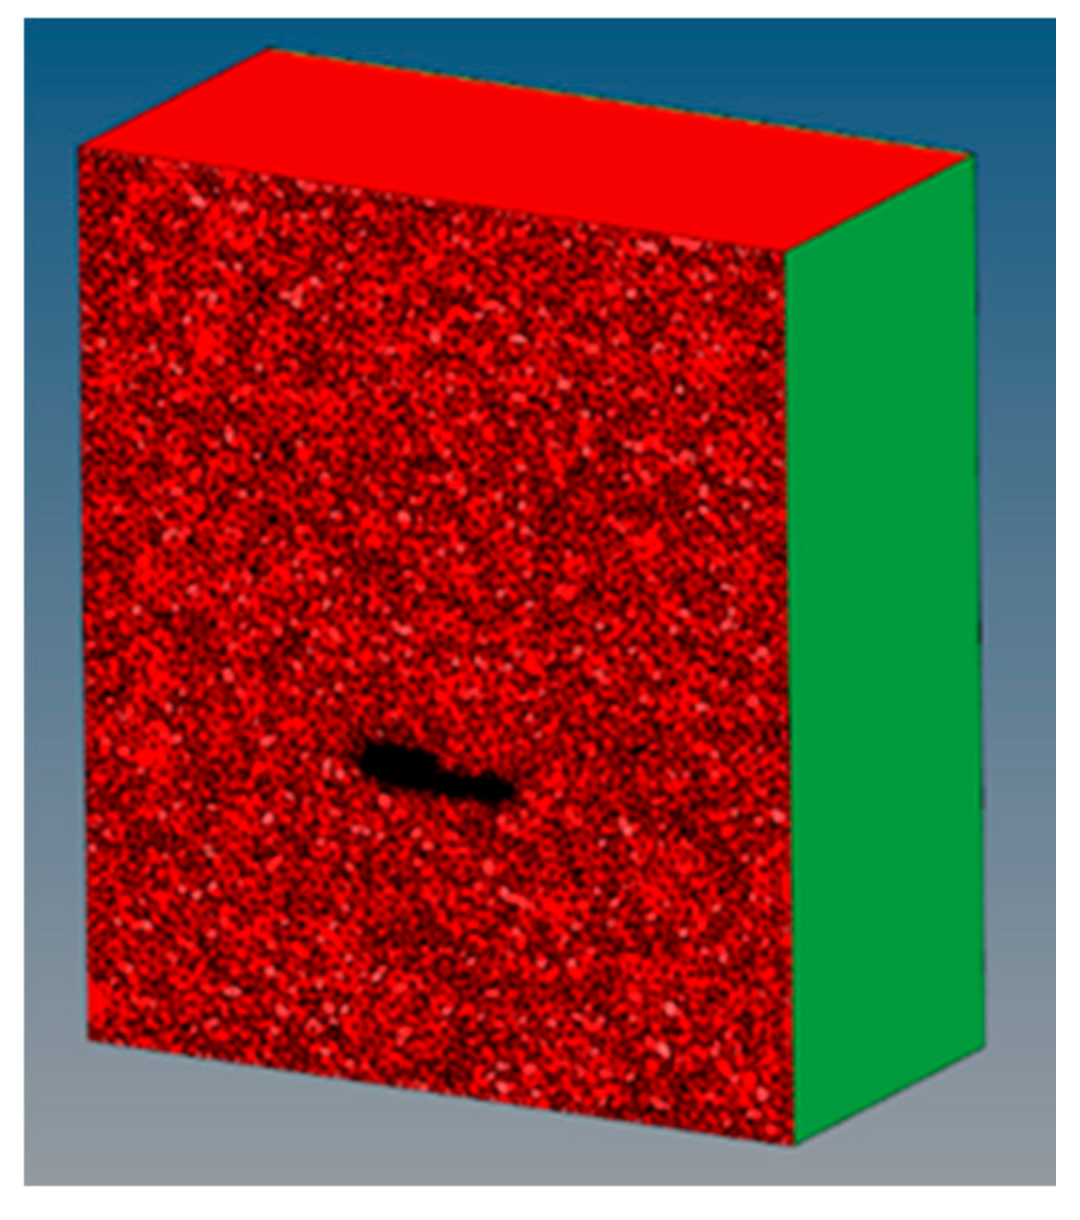
2.1.4. Discretization of the 3D Model for Study
Luminaire Discretization Model
2.1.5. Configuration of the Physical and Solver Characteristics
Definition of the Properties of Materials
Definition of Physical Models
- Conservation equations.
- 2.
- Finite Volume Method.
- = variable transported by a medium;
- = density of the medium through which it is transported Φ;
- V = travel speed of Φ through the medium;
- = medium diffusion constant;
- = source/sink term of the variable transported;
- A = border;
- = speed vector of Φ through the medium;
- = normal vector to the surface.
- = position vector;
- = direction vector;
- = vector direction dissipation;
- s = path length;
- a = absorption coefficient;
- n = refractive index;
- = dispersion coefficient;
- Constant Stefan–Boltzmann (5669 × 10−8 W/m2 K4);
- Intensity of radiation;
- T = local temperature in Kelvin;
- = phase function;
- = solid angle.
- Nfaces = number of faces of volume;
- f = fluid.
- Implement boundary conditions
- 3.
- Determination of the problem solver.
- -
- Pressure-based solver;
- -
- Density-based solution.
- -
- Segregated algorithm based on pressure: The individual governing equations for the solution variables (for example, u, v, w, p, T, k, etc.) are solved one after the other. The convergence of the solution is relatively slow, since the equations are resolved in an uncoupled way;
- -
- Algorithm coupled based on pressure: The pressure-based coupled algorithm solves a coupled system of equations that comprises the moment equations and the pressure-based continuity equation. Since the equations of momentum and continuity are solved in a tightly coupled manner, the convergence rate of the solution improves significantly compared to the segregated algorithm. The convergence with this algorithm improves with respect to the segregated algorithm, which is taken into account in the choosing of this method.
- 4.
- Monitorization of residuals.
2.2. Processed
2.3. Post-Processing
3. Results
3.1. Theoretical Results
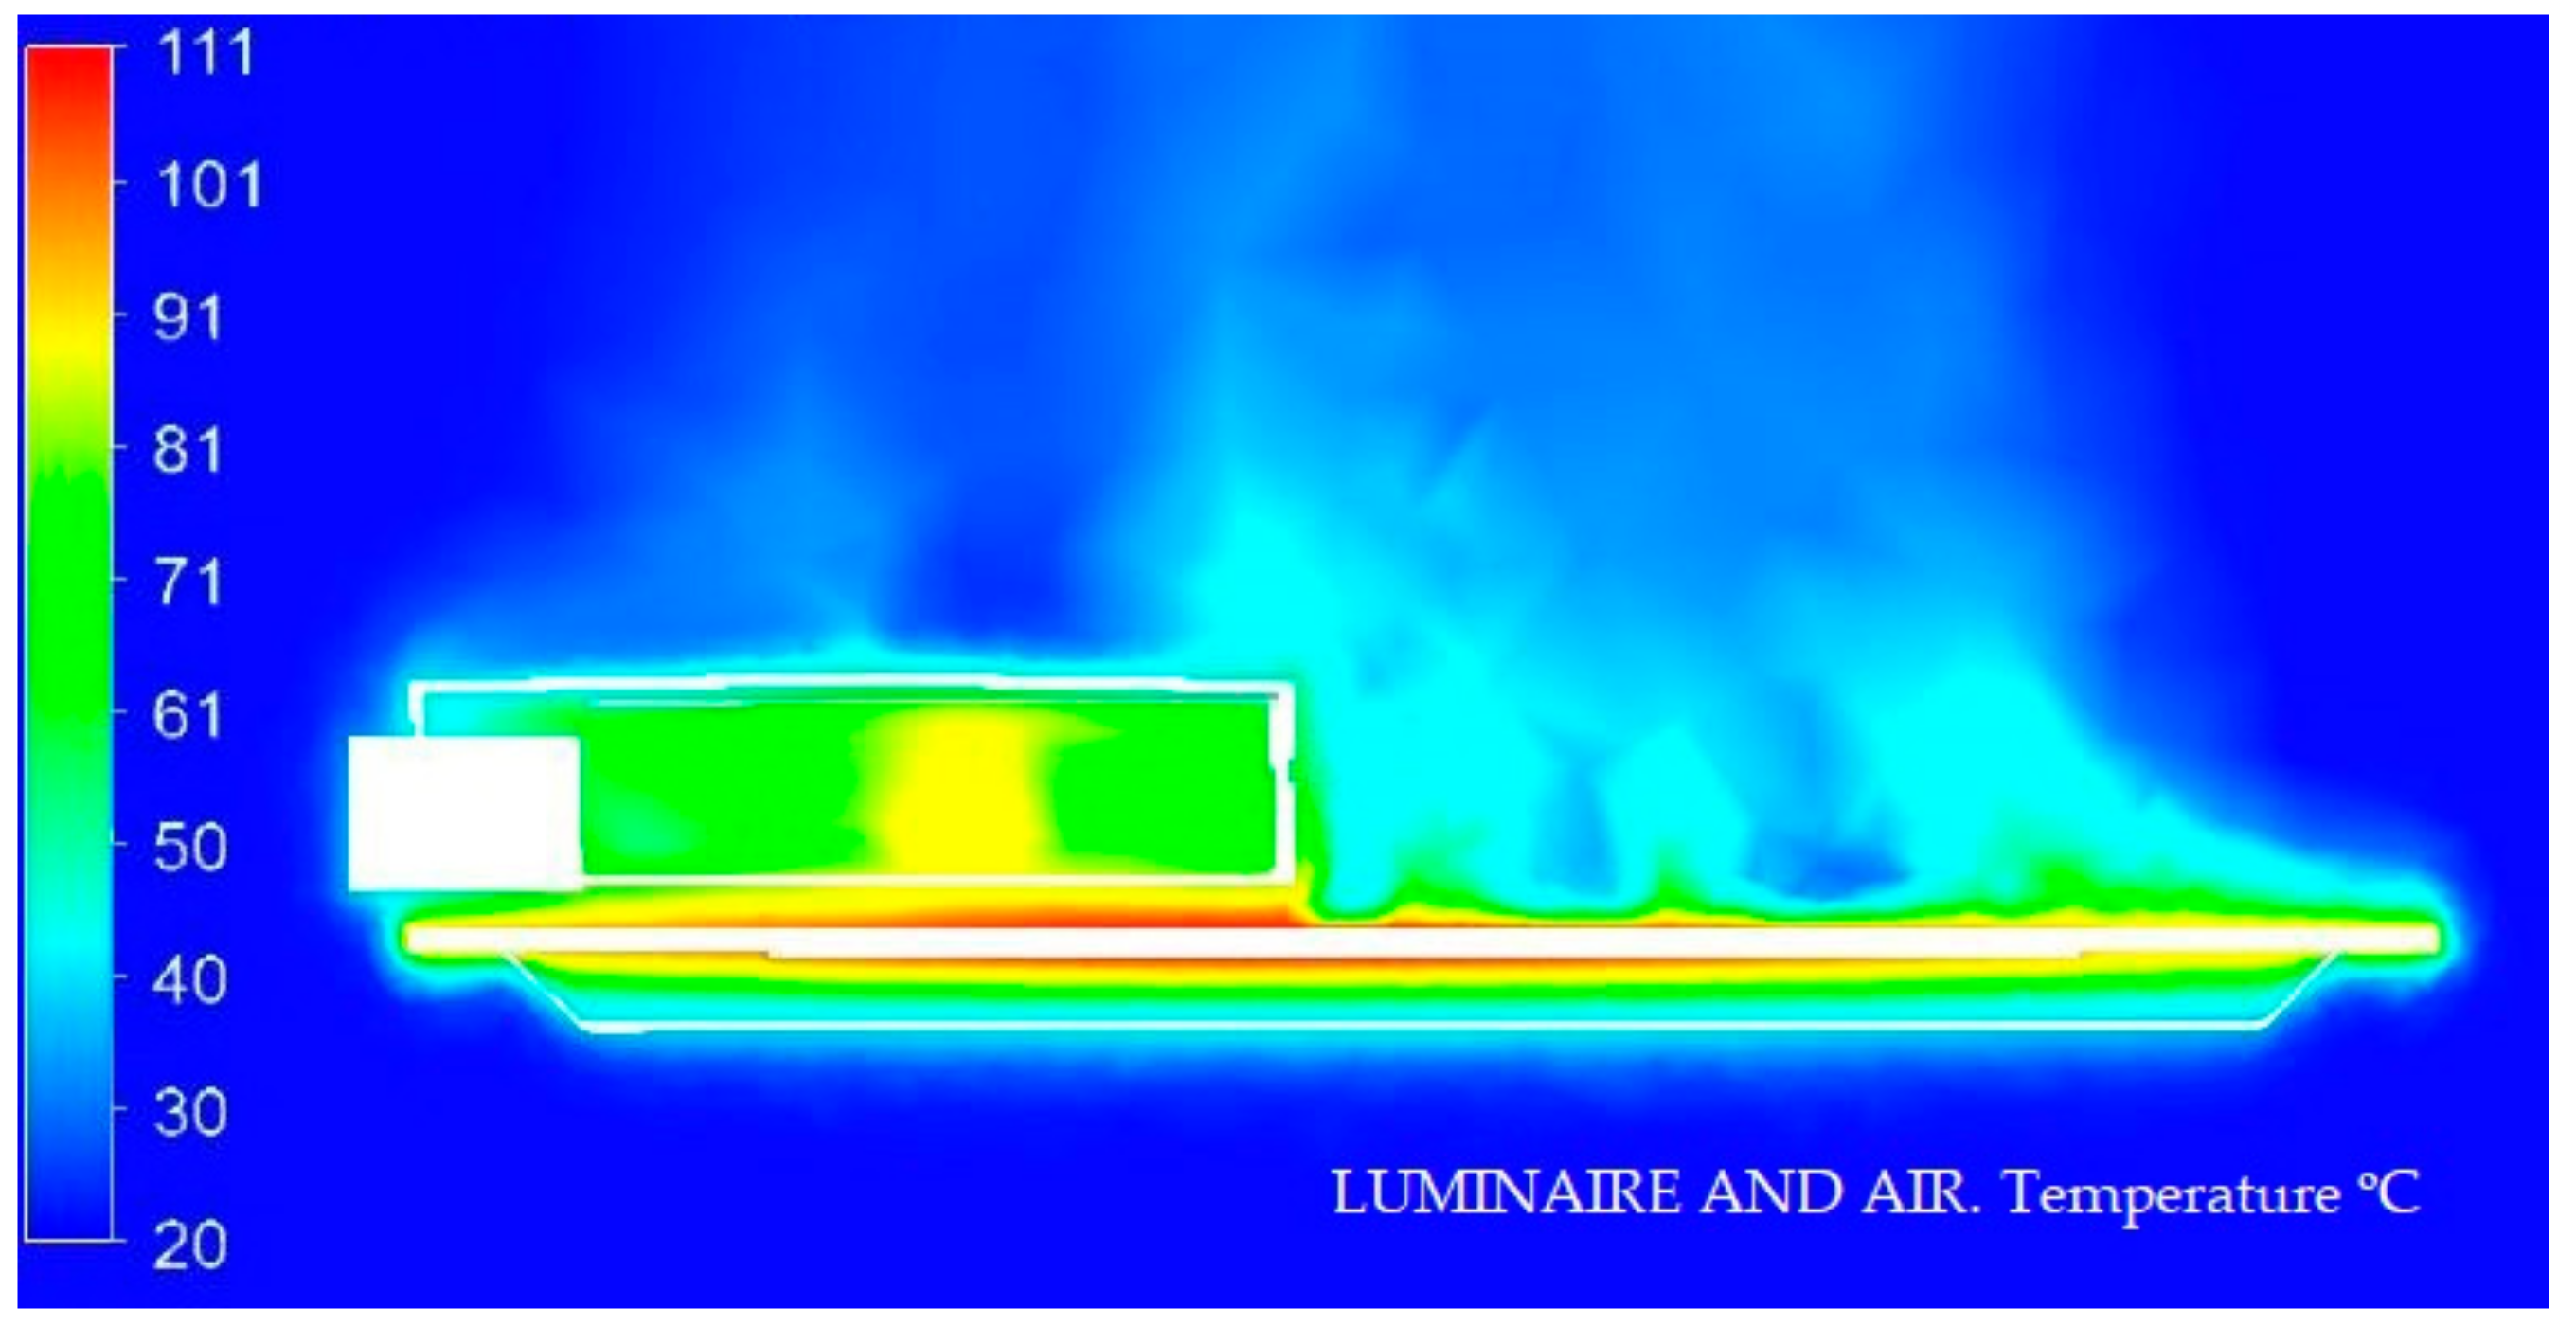
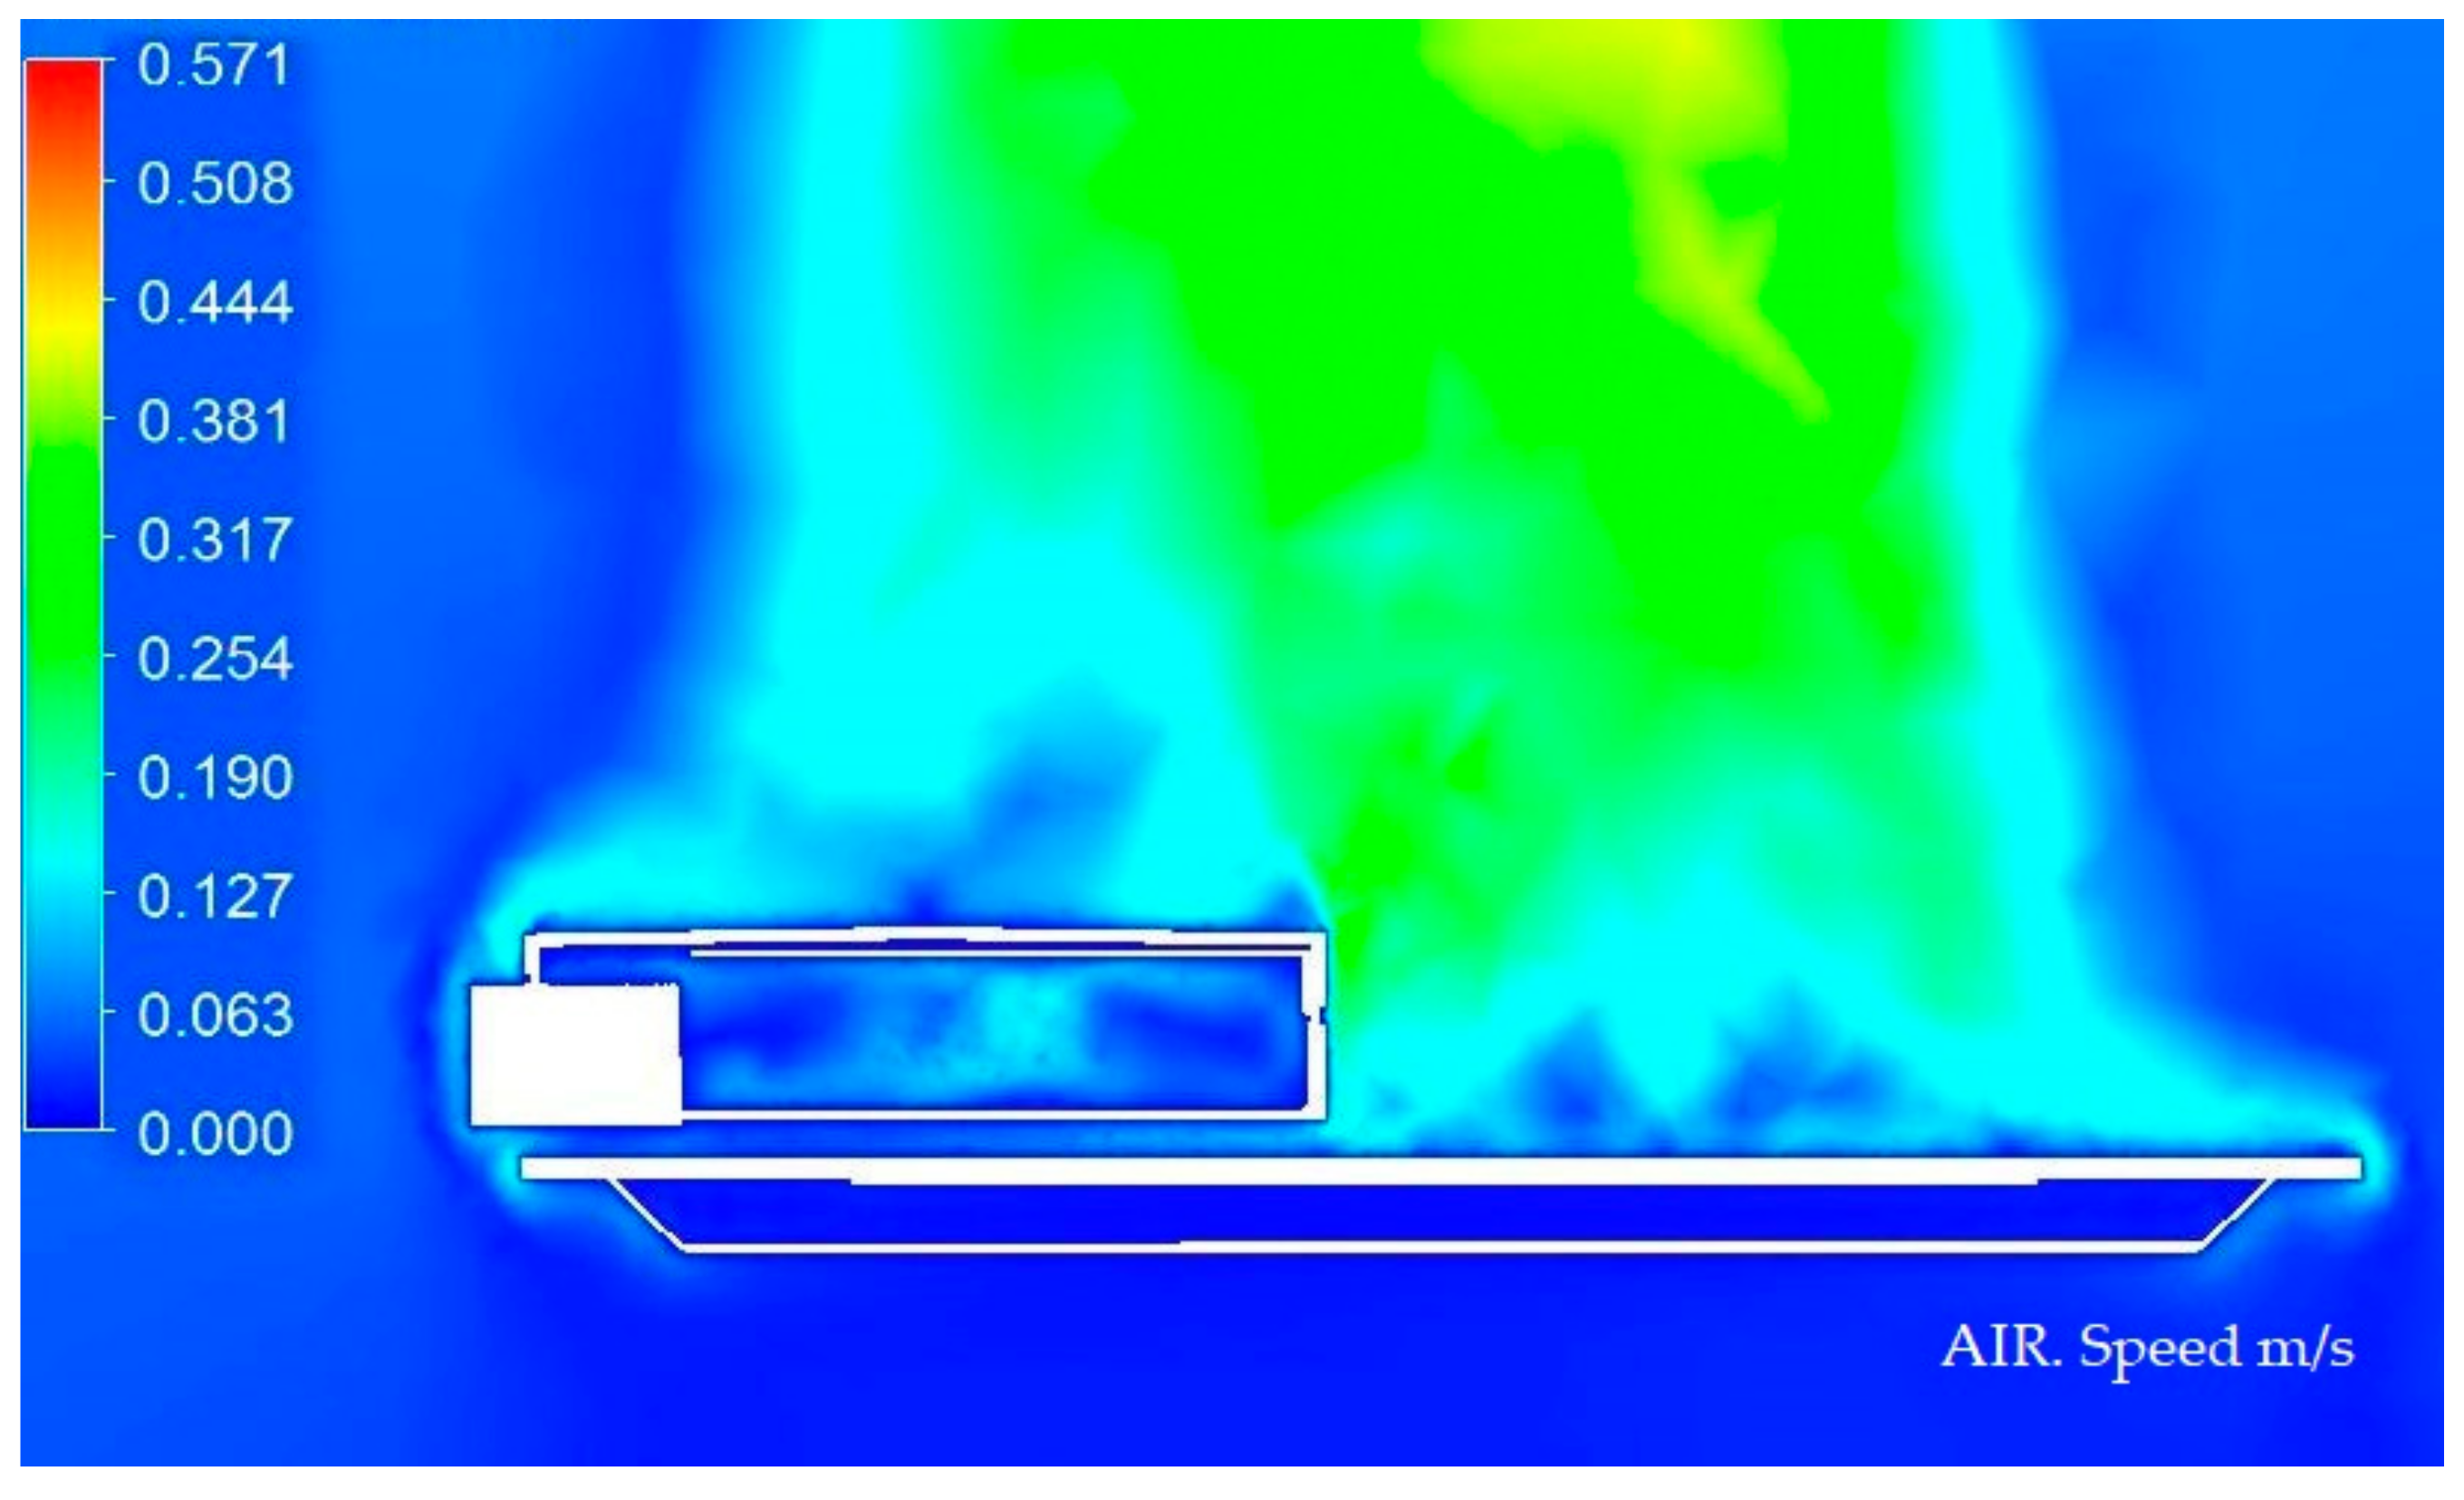
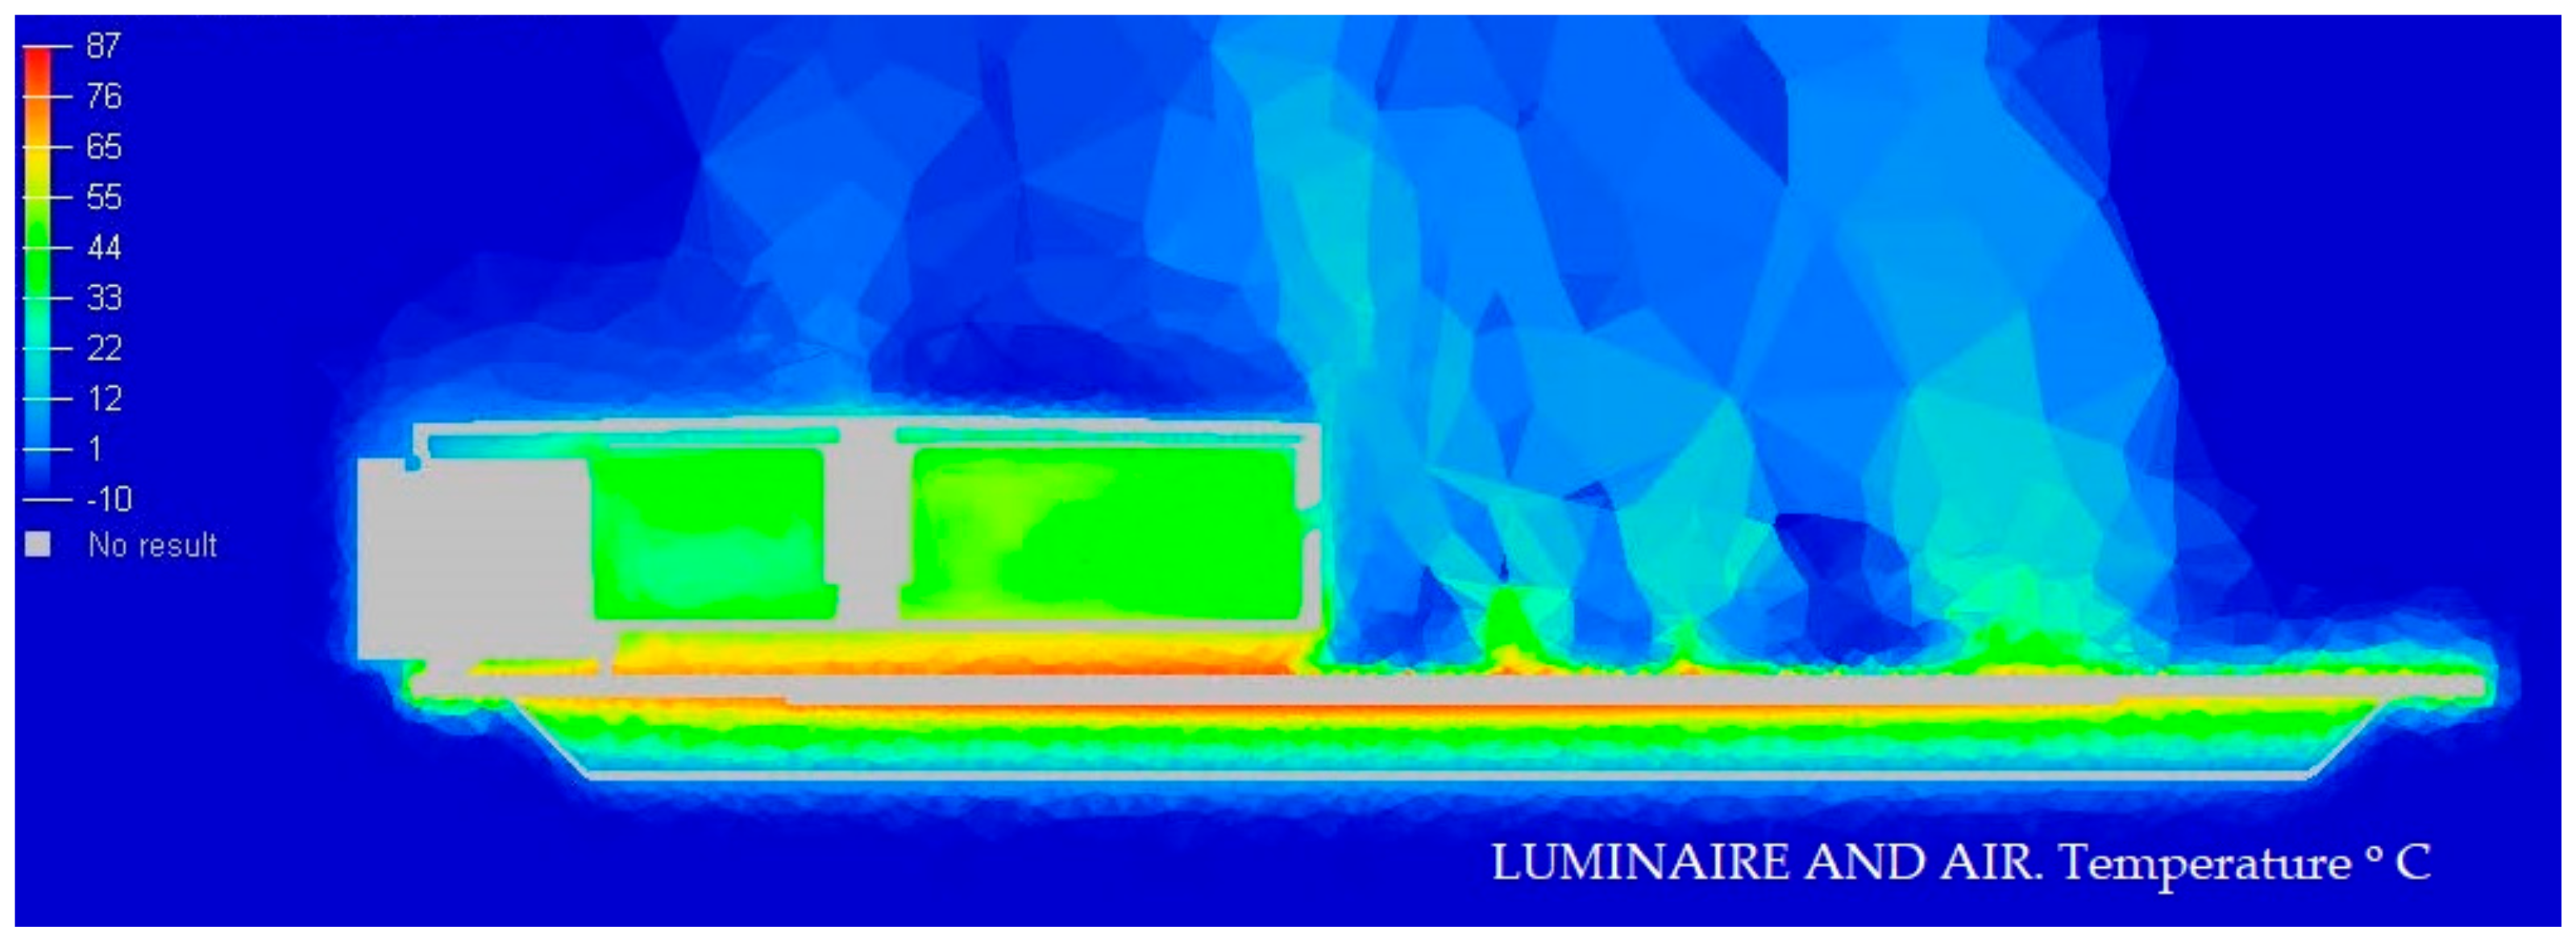
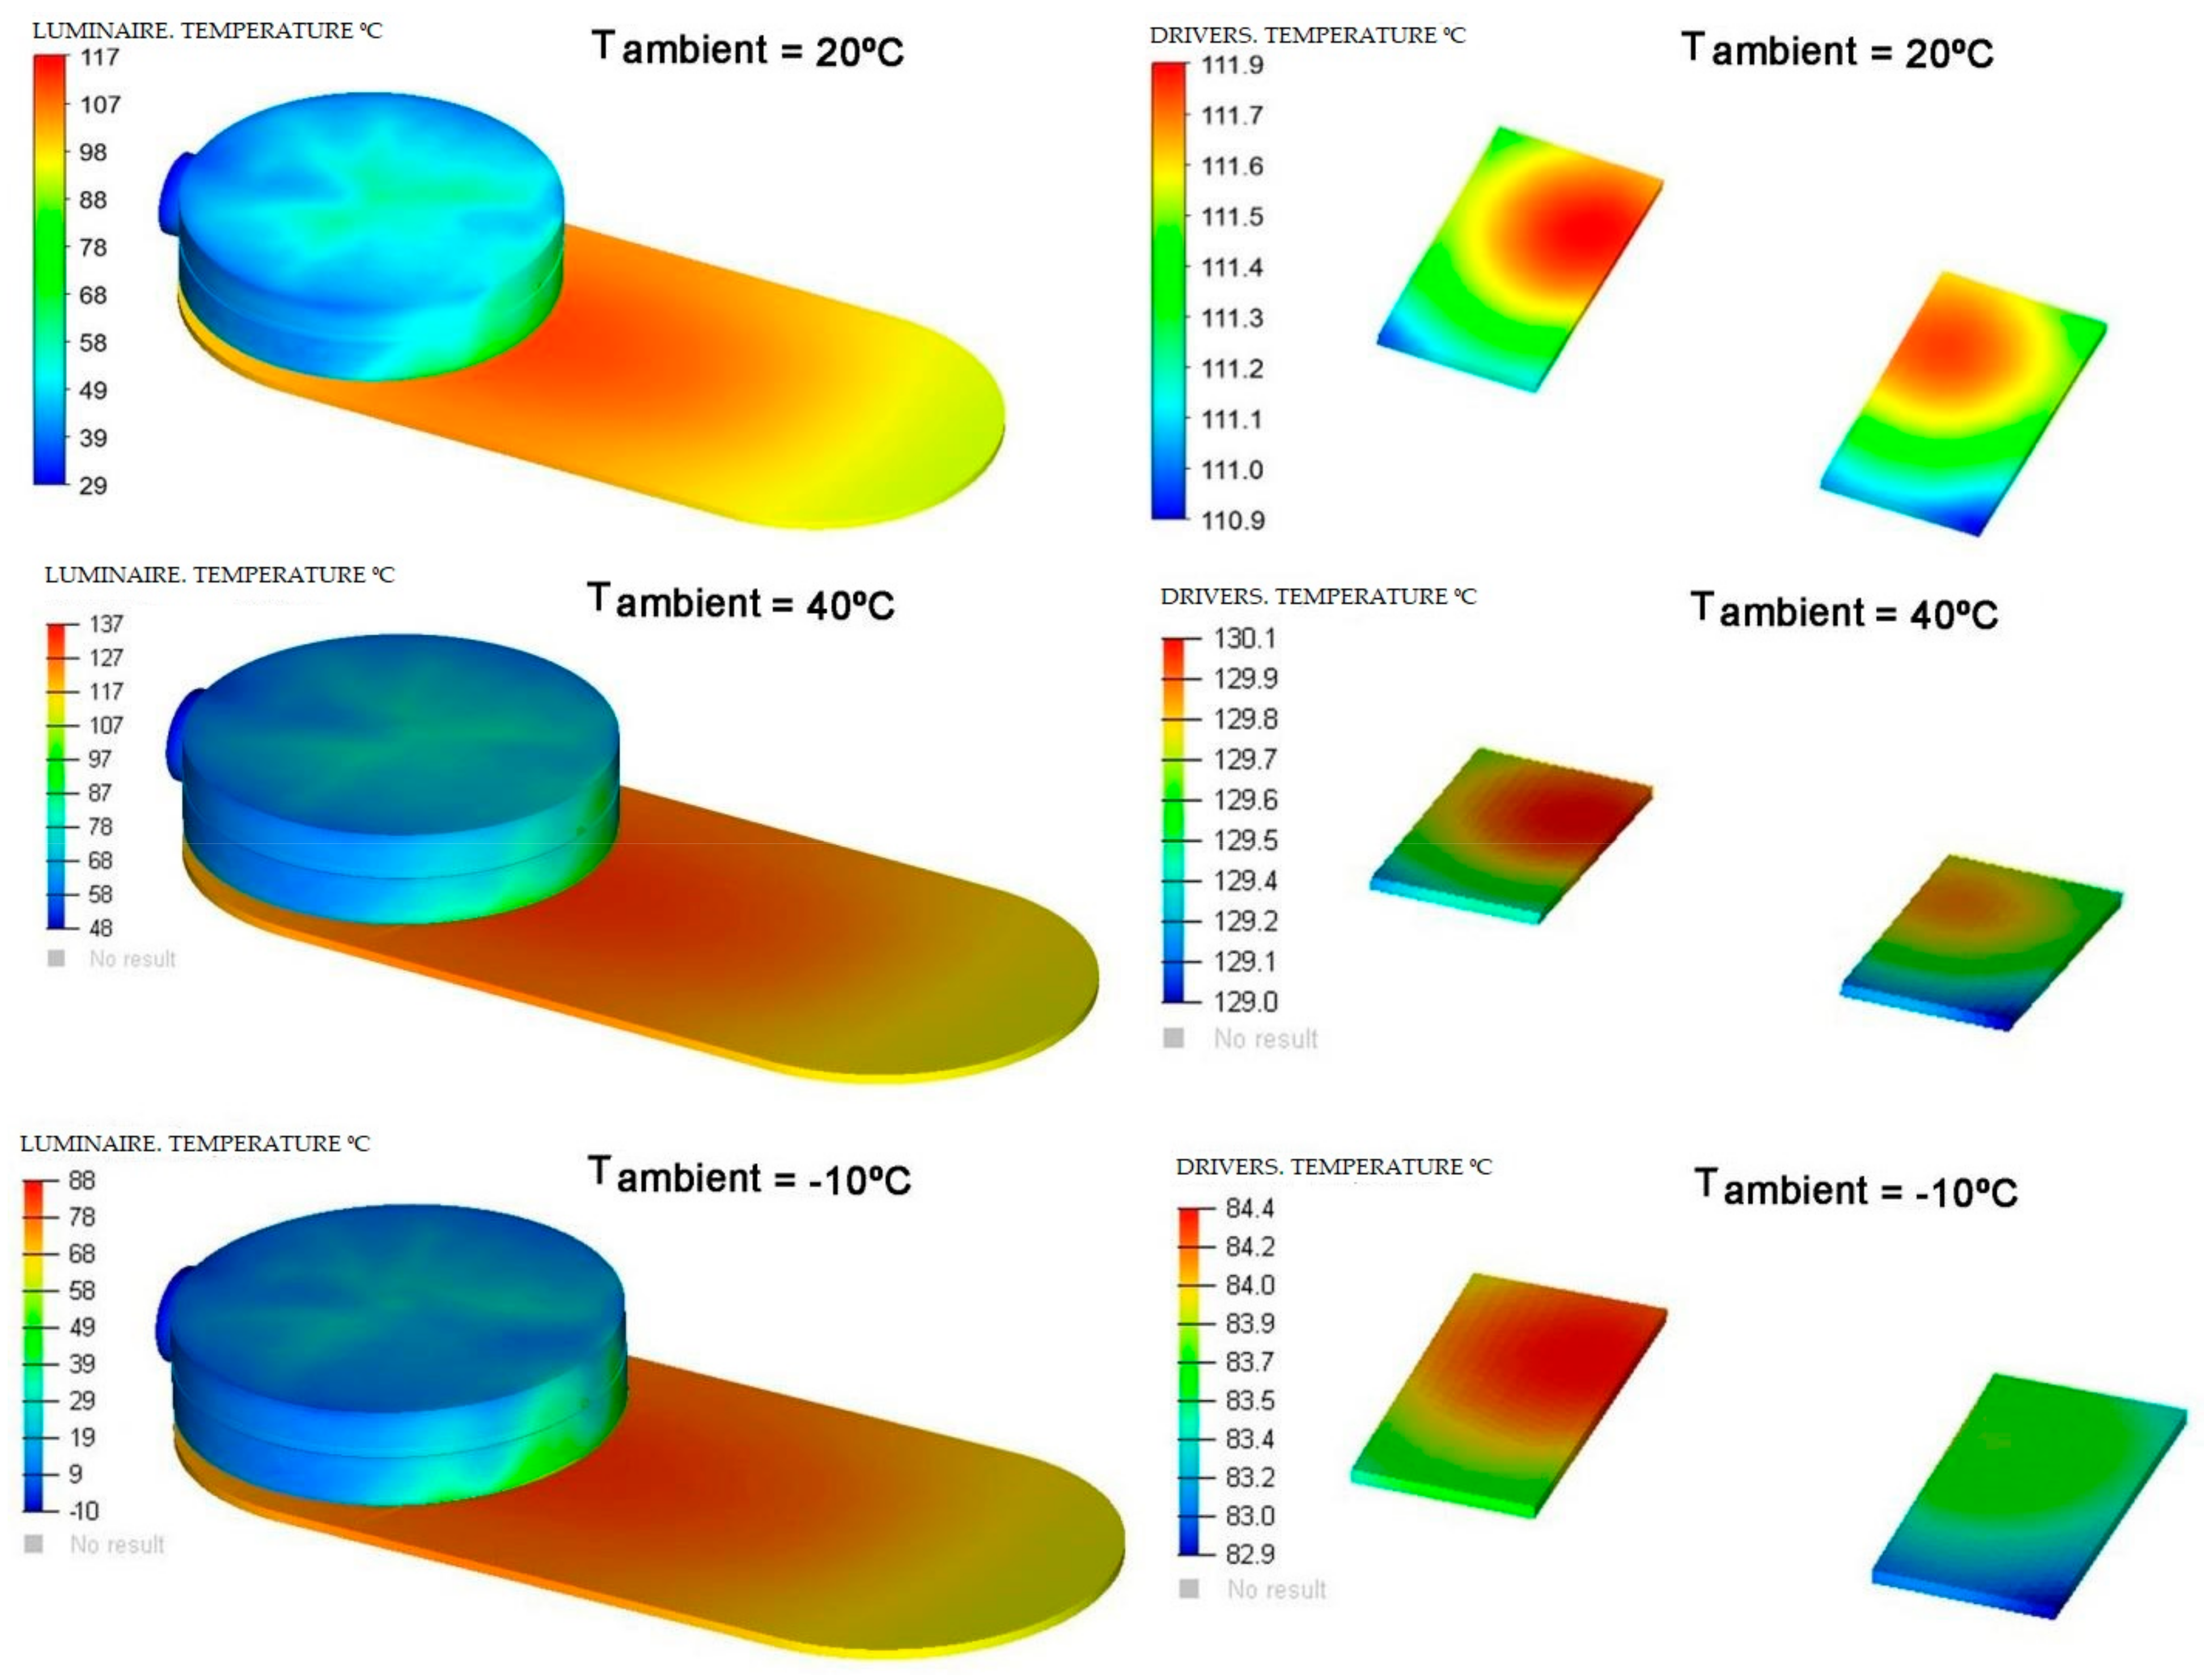
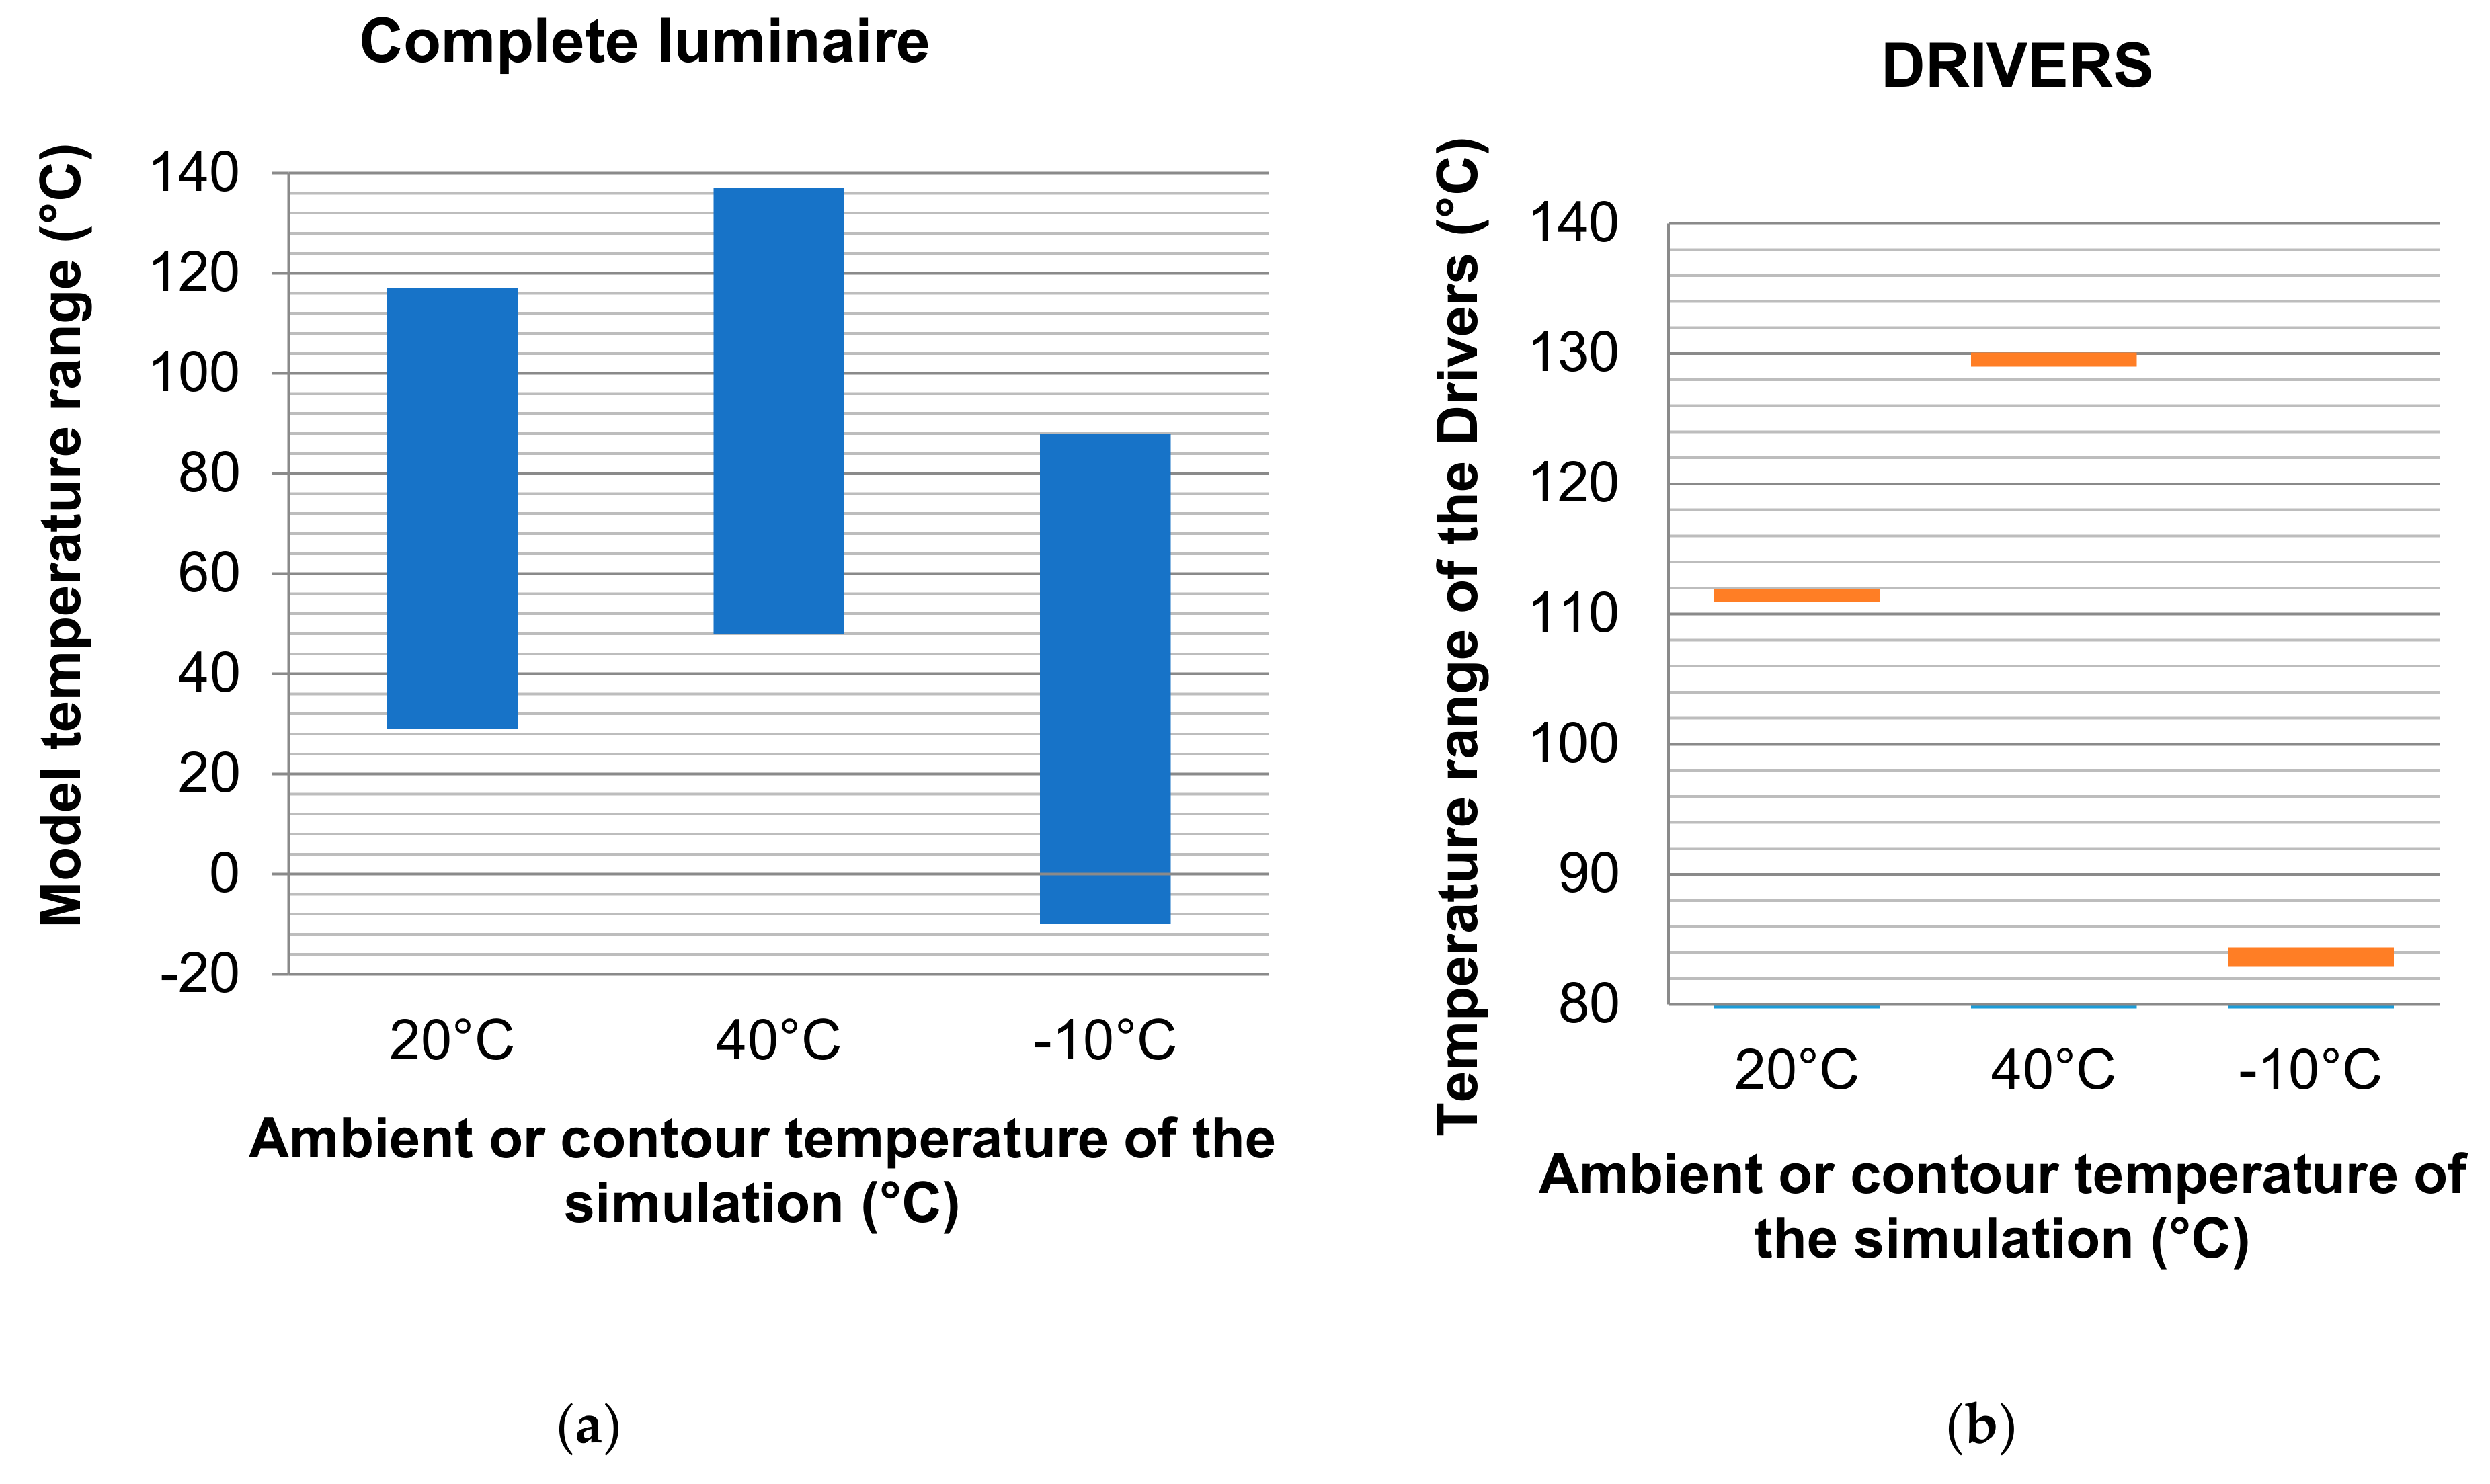
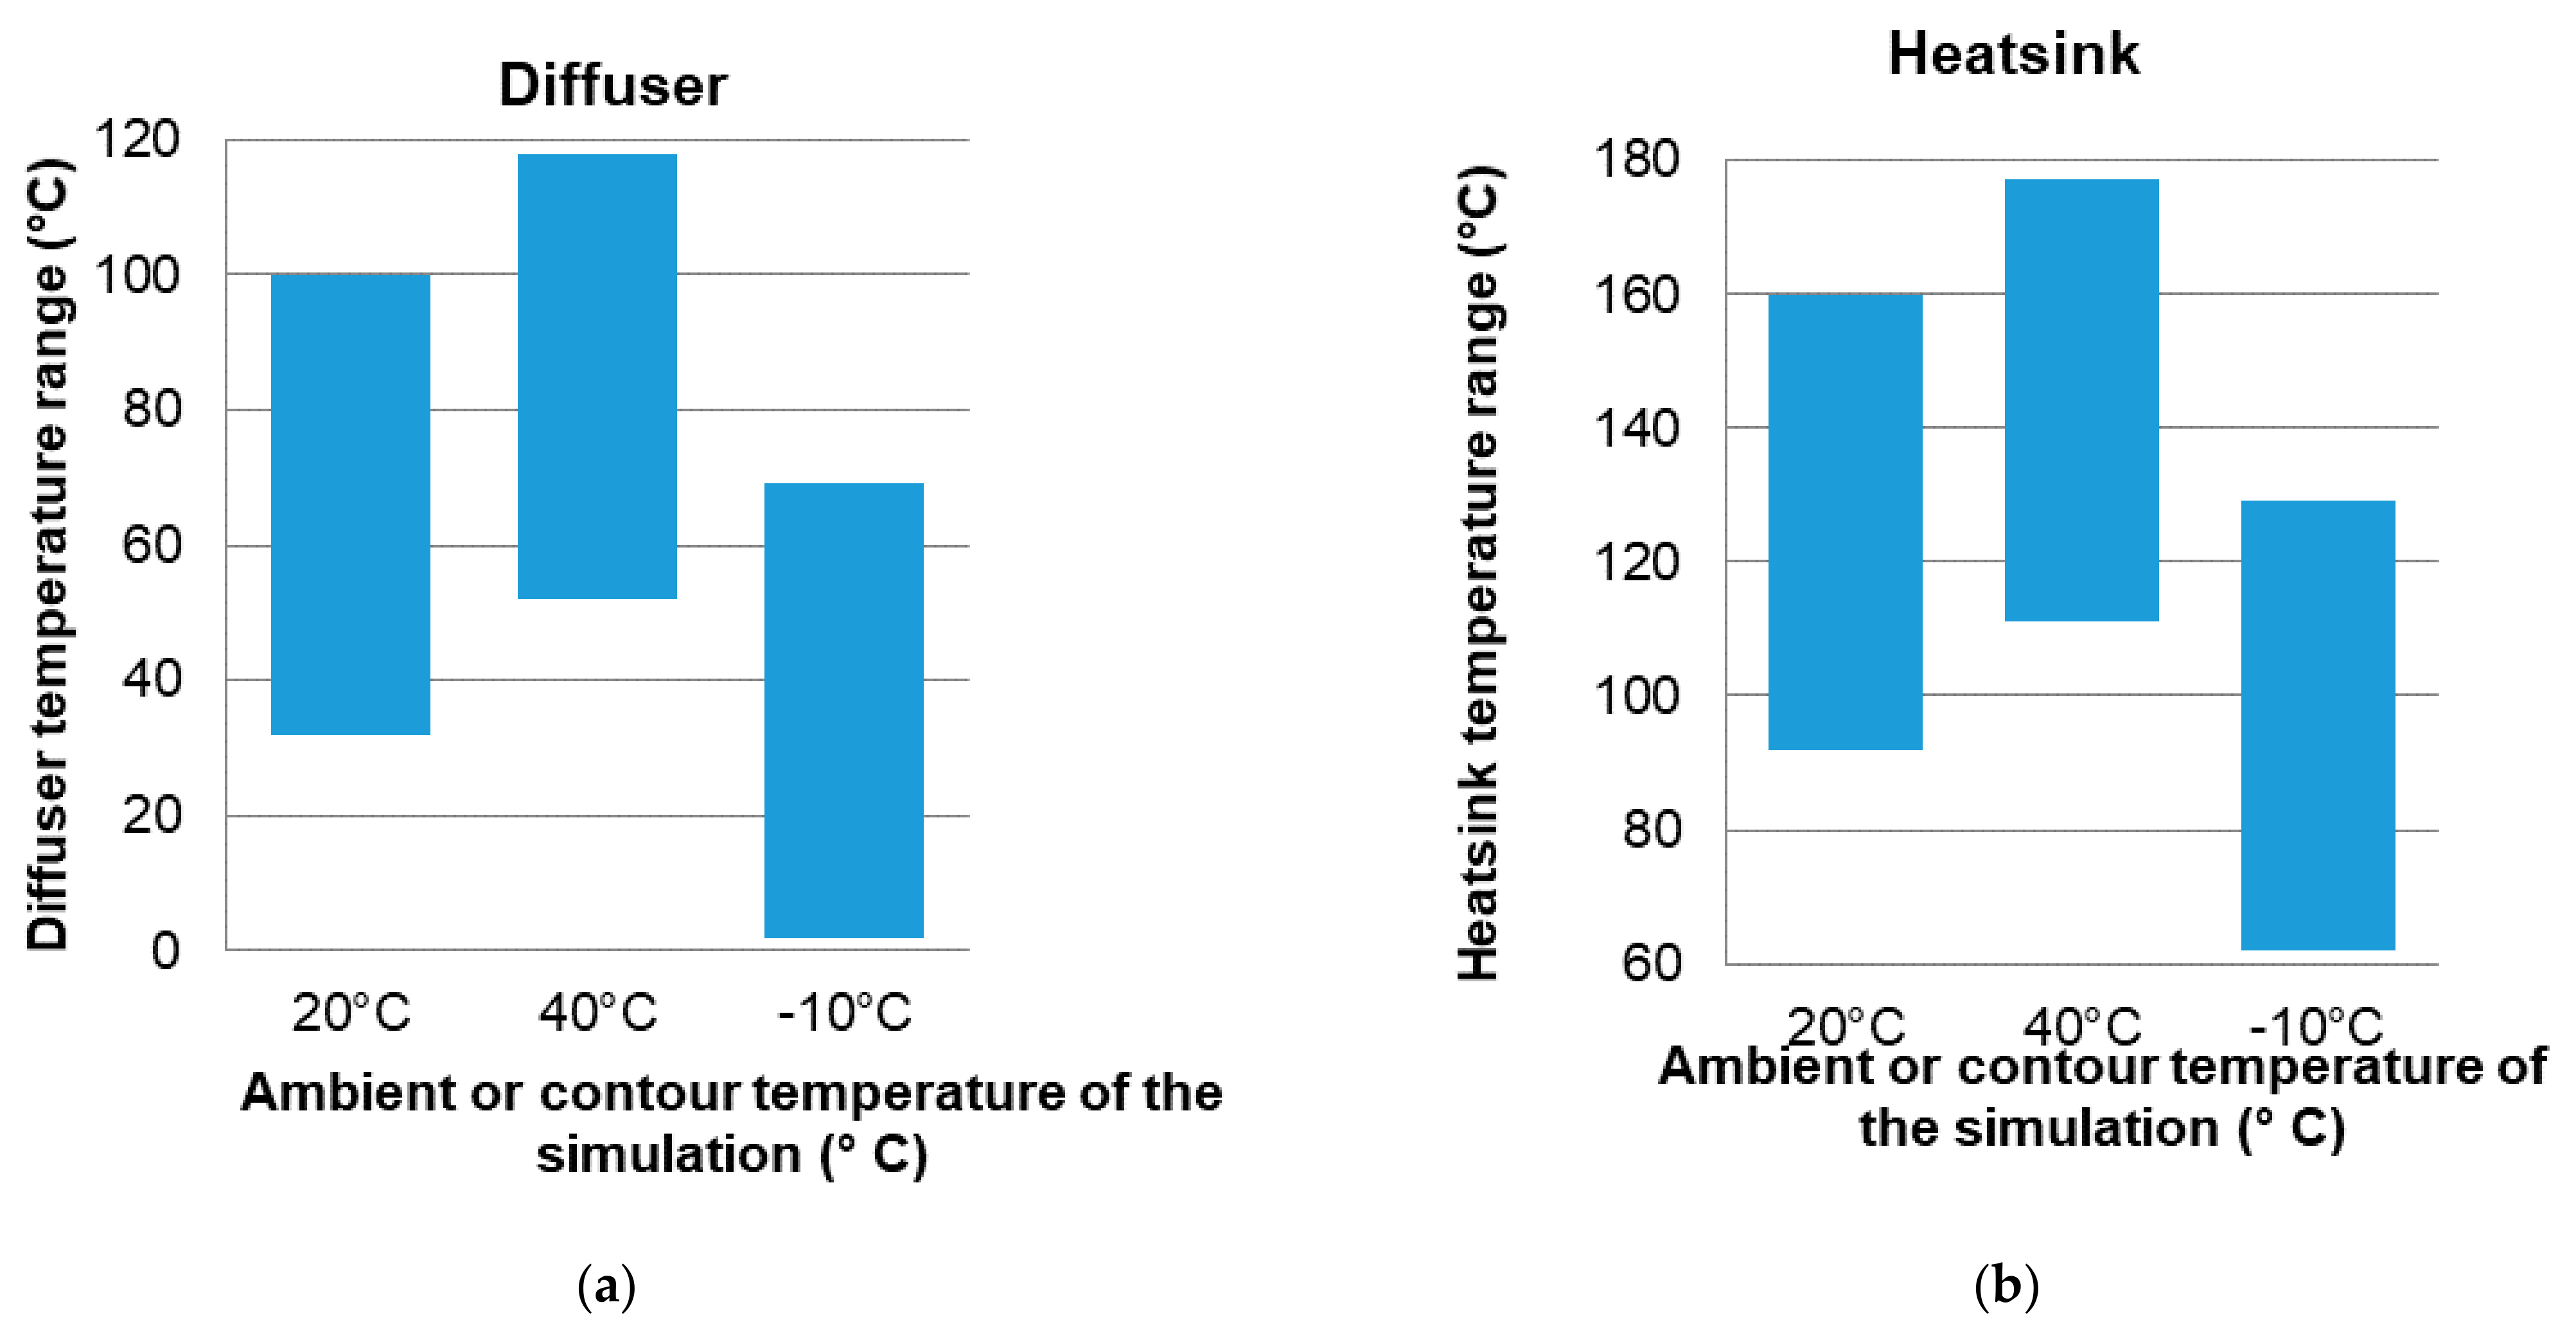
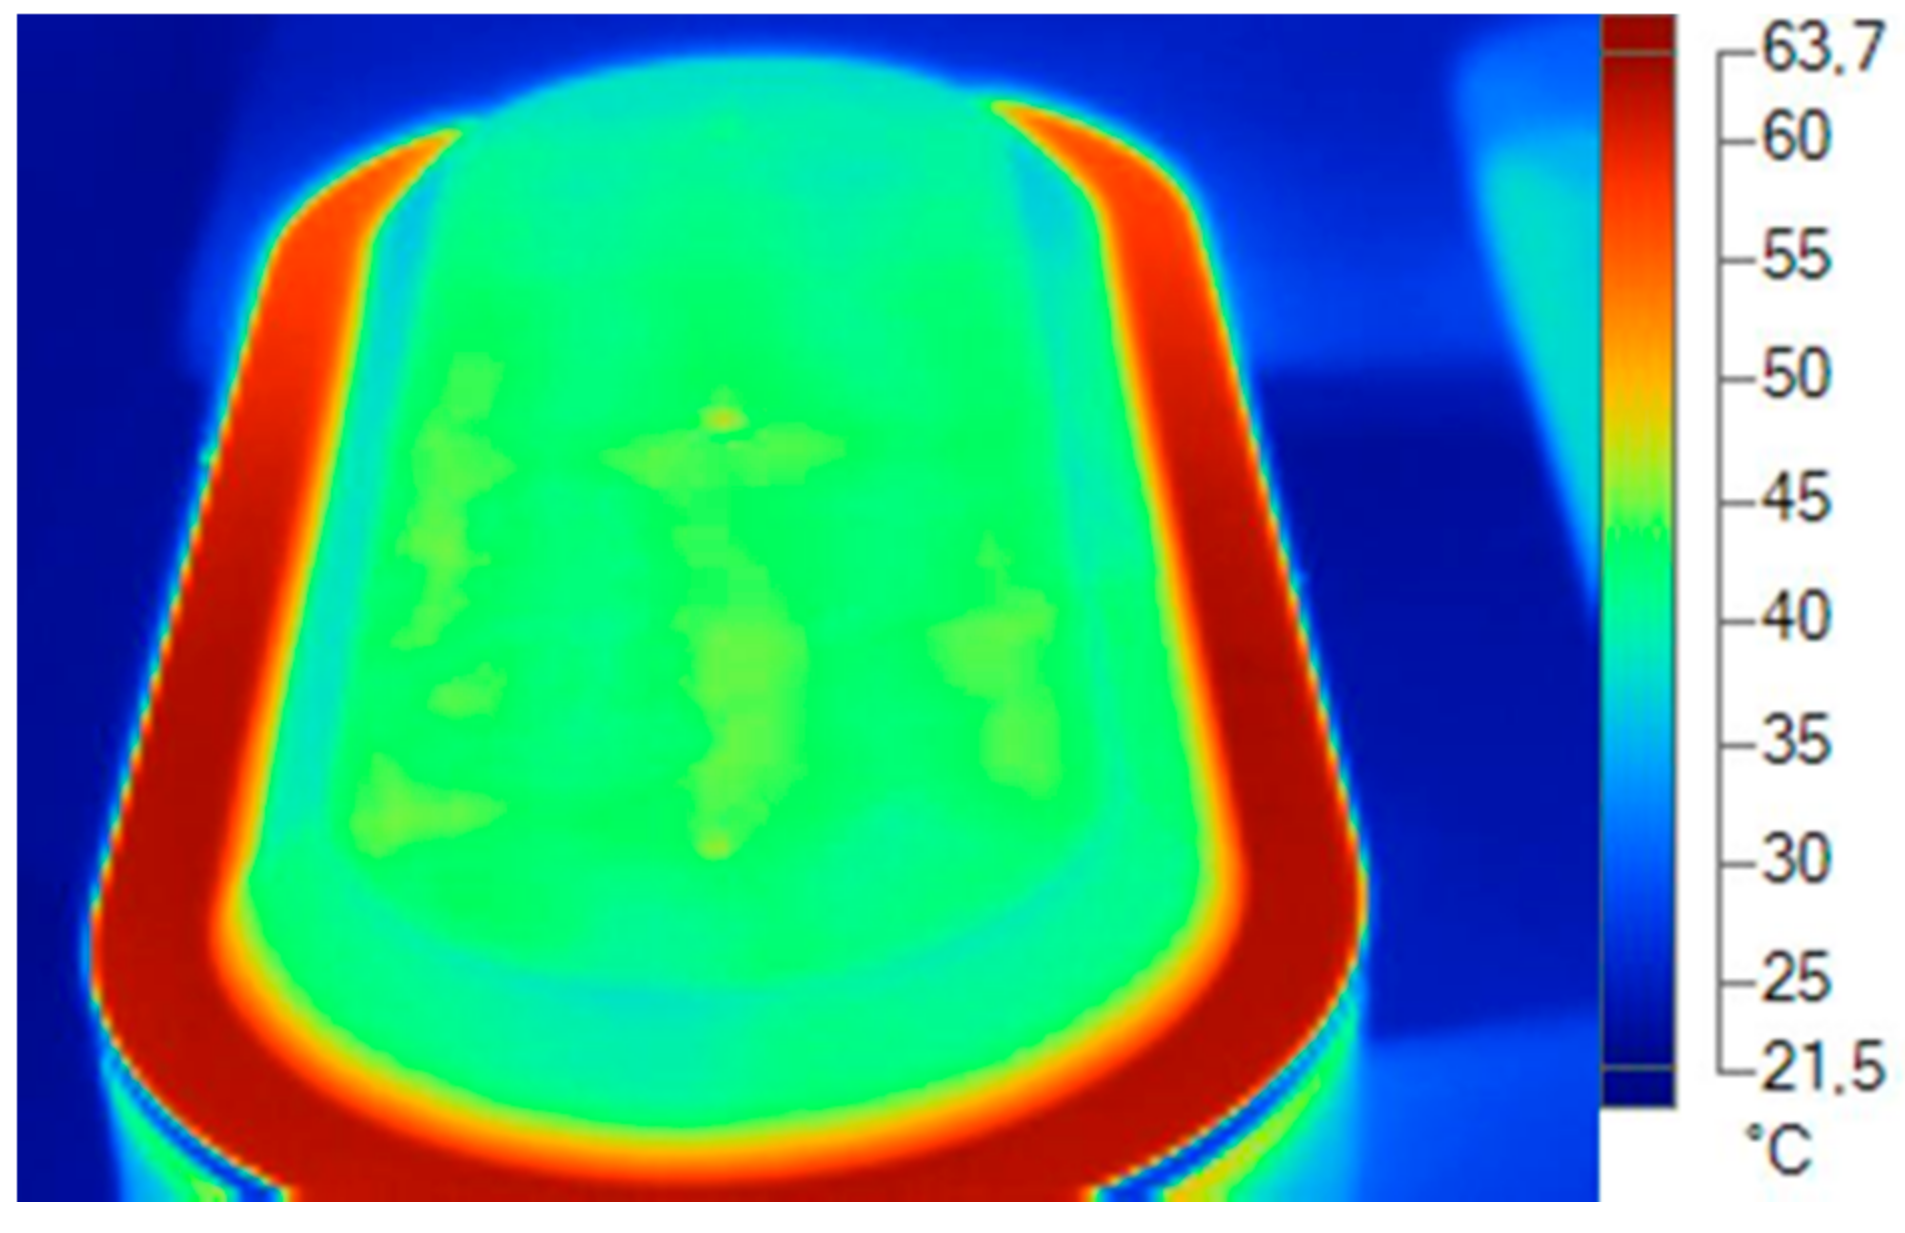
3.1.1. Display of Temperature and Air Speed in the Model Luminaire at 20 °C
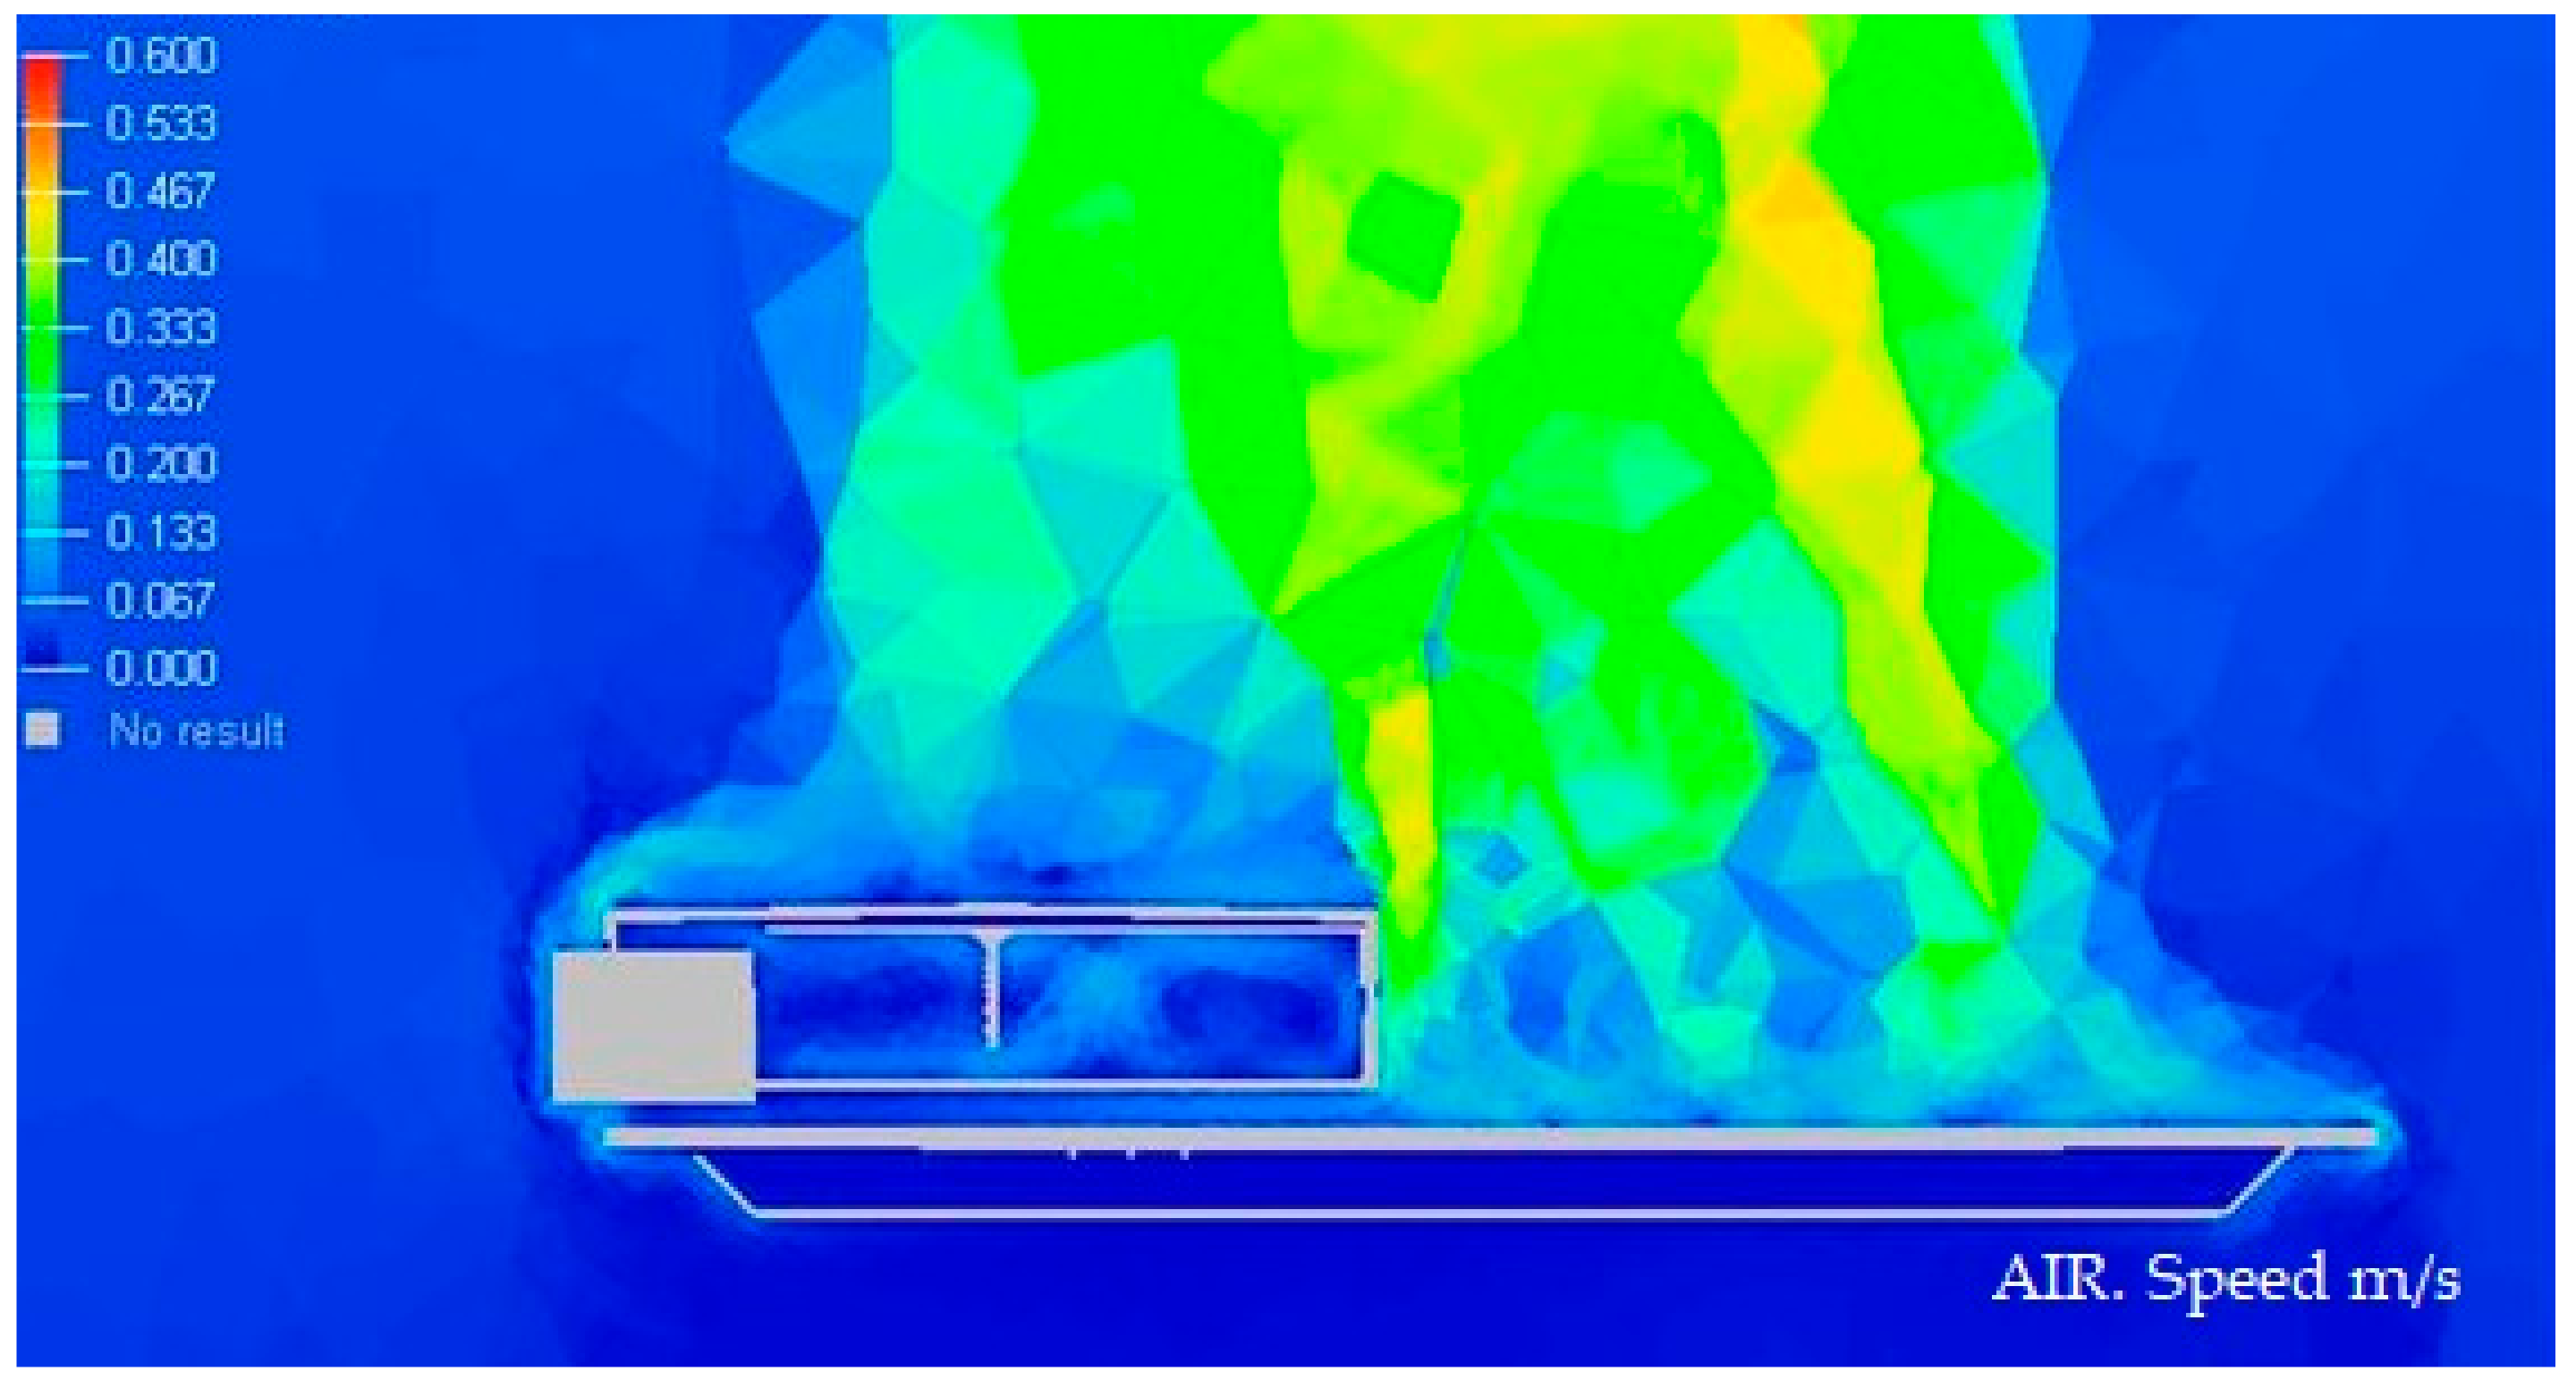
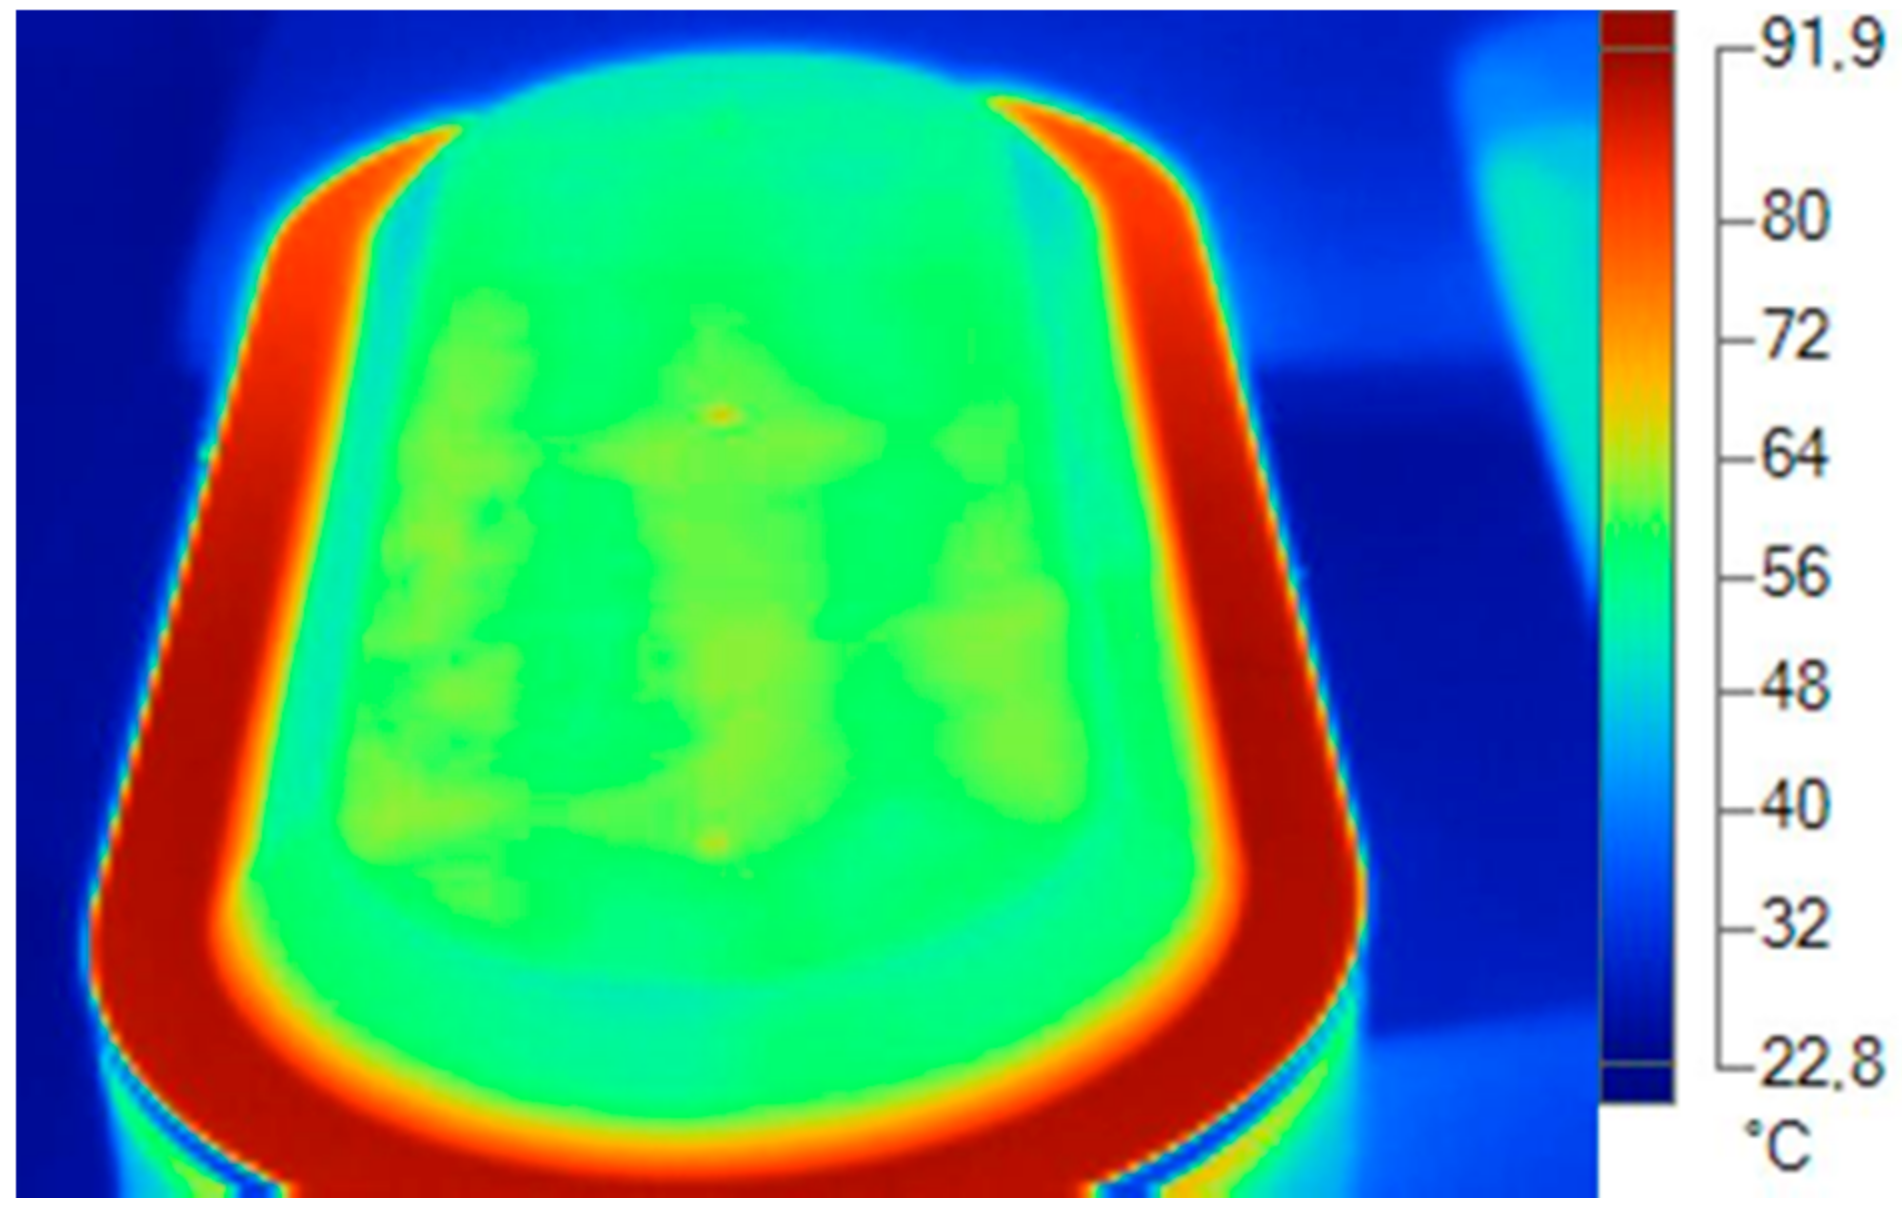
3.1.2. Display of Temperature and Air Speed in the Model Luminaire at 40 °C
3.1.3. Display of Temperature and Air Speed in the Model Luminaire at −10 °C
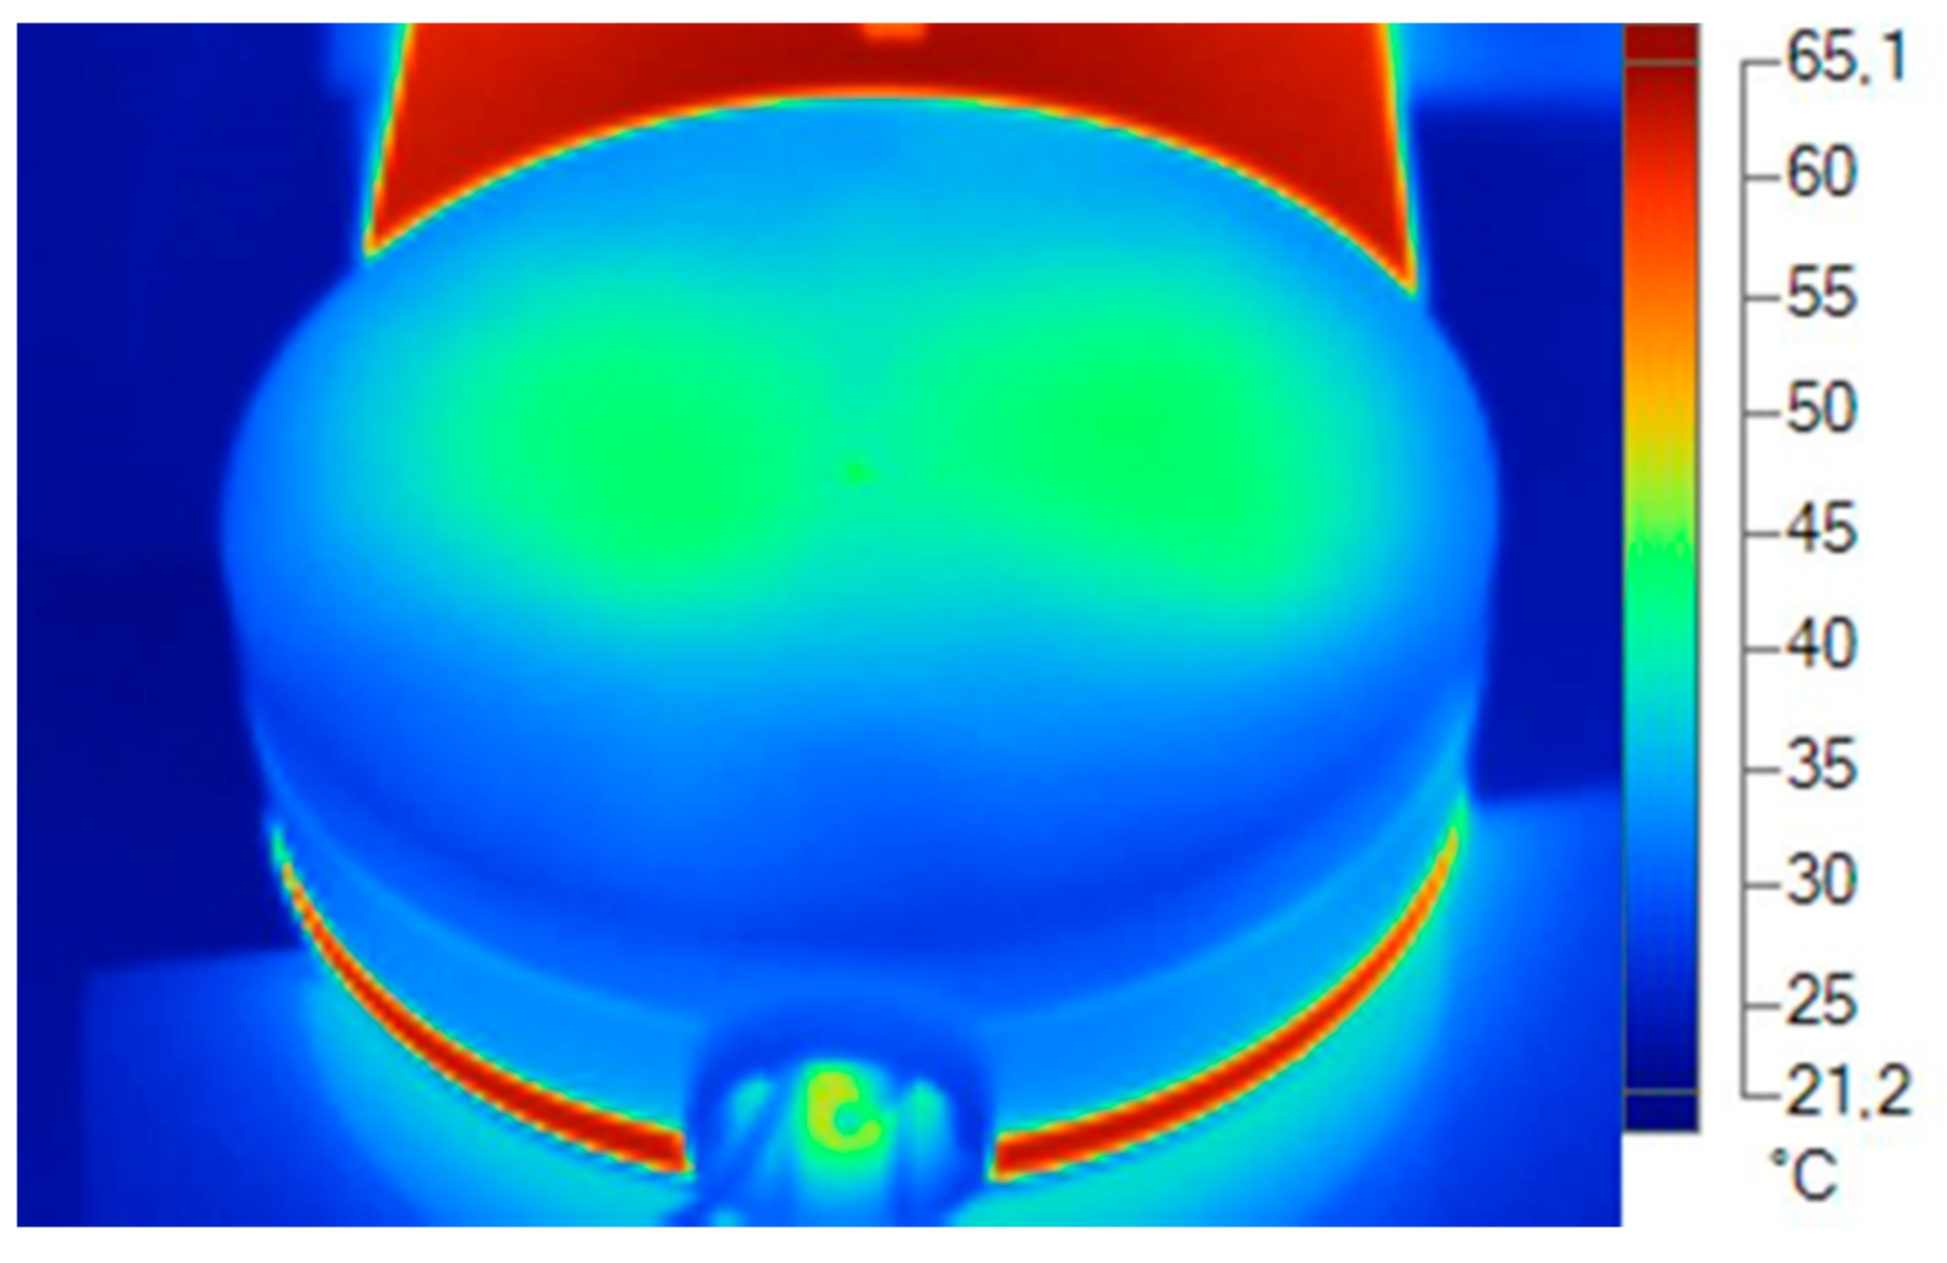
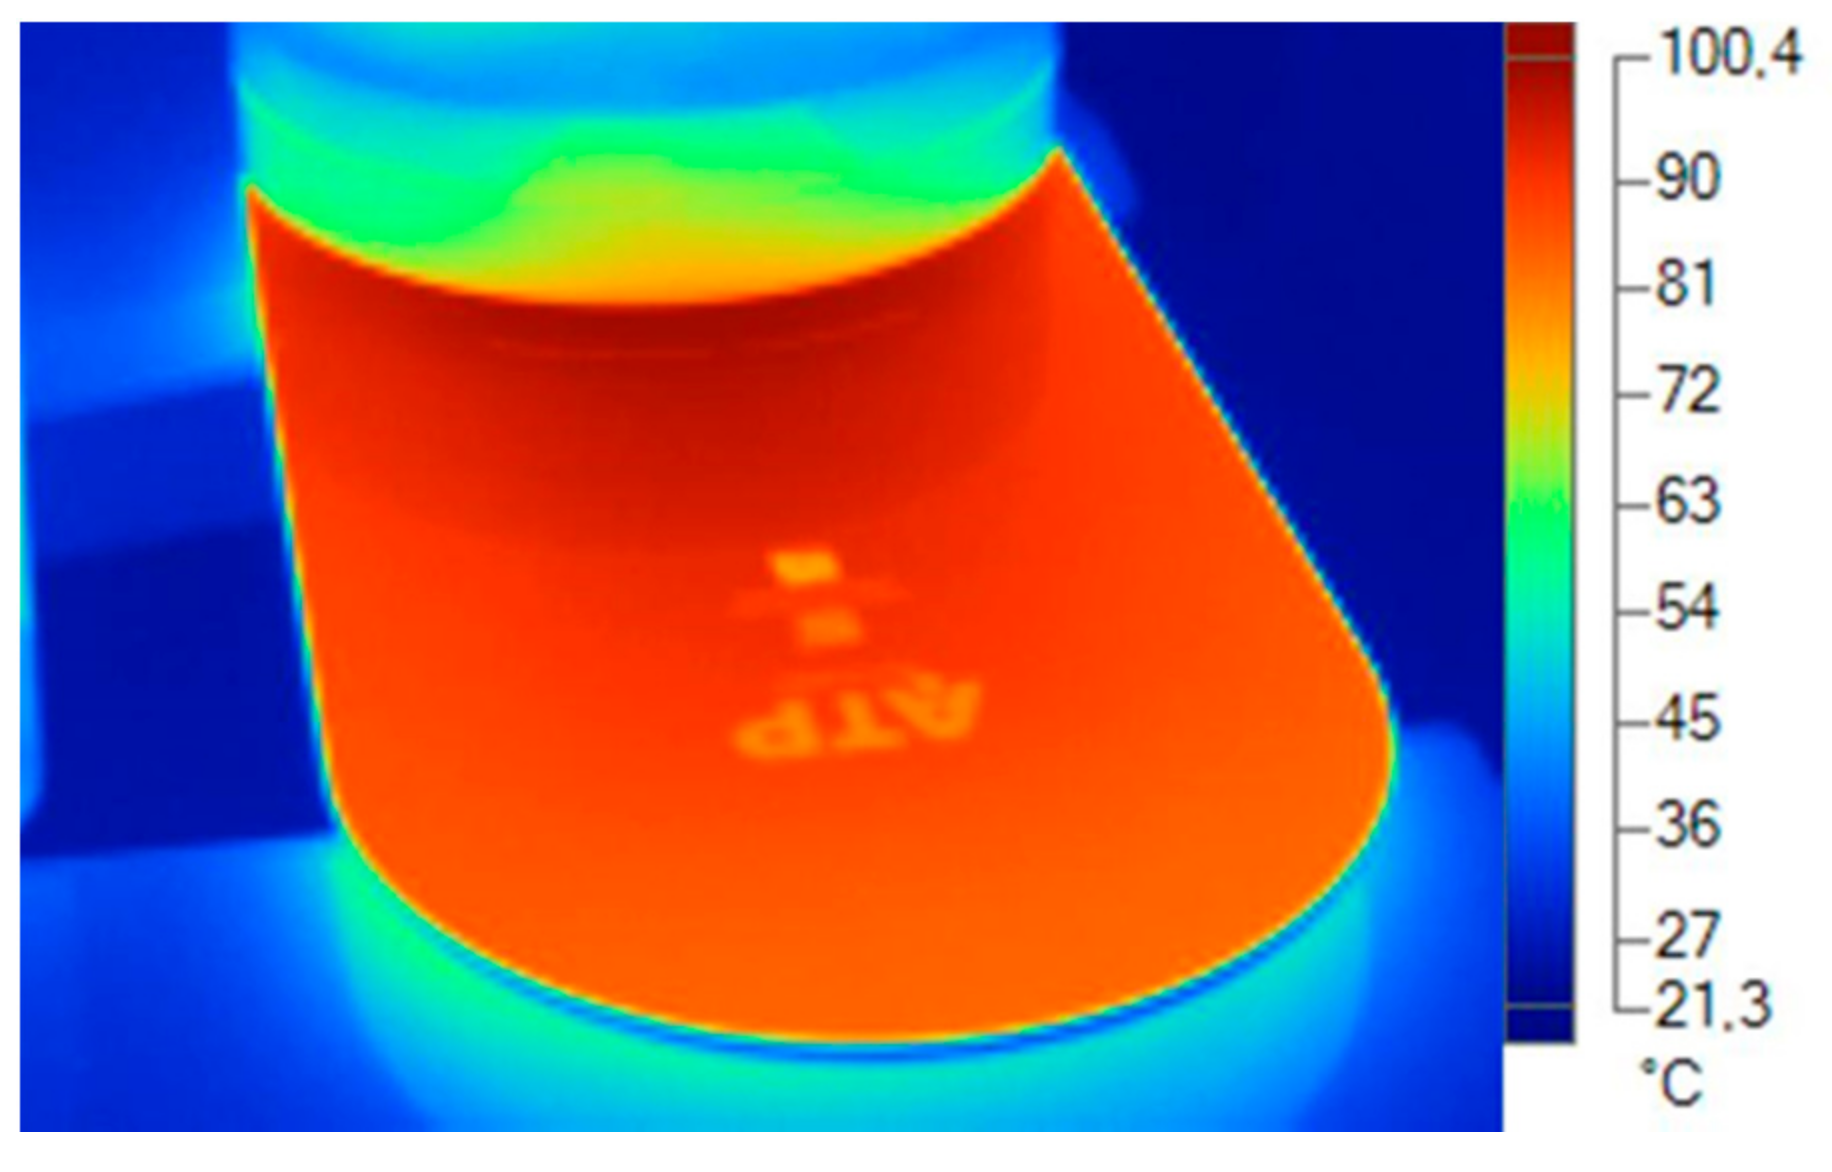
3.2. Experimental Results
4. Discussion
5. Conclusions
Author Contributions
Funding
Institutional Review Board Statement
Informed Consent Statement
Data Availability Statement
Conflicts of Interest
References
- Gago-Calderón, A.; Hermoso-Orzáez, M.J.; De Andres-Diaz, J.R.; Redrado-Salvatierra, G. Evaluation of uniformity and glare improvement with low energy efficiency losses in street lighting LED luminaires using laser-sintered polyamide-based diffuse covers. Energies 2018, 11, 816. [Google Scholar] [CrossRef] [Green Version]
- Li, R.; Liu, Q.; Huang, L.; Yin, L.; Song, G. Properties of Thermal Interface Materials and Its Impact on Thermal Dissipation and Reliability of LED Automotive Lighting. In Proceedings of the 2018 15th China International Forum on Solid State Lighting: International Forum on Wide Bandgap Semiconductors China, SSLChina: IFWS 2018, Shenzhen, China, 15 October 2018; IEEE: Shenzhen, China, 2018; pp. 154–157. [Google Scholar]
- Tsai, C.C.; Cheng, W.C.; Chang, J.K.; Huang, S.Y.; Liou, J.S.; Chen, G.H.; Huang, Y.C.; Wang, J.S.; Cheng, W.H. Thermal-Stability Comparison of Glass- and Silicone-Based High-Power Phosphor-Converted White-Light-Emitting Diodes Under Thermal Aging. IEEE Trans. Device Mater. Reliab. 2012, 14, 4–8. [Google Scholar] [CrossRef]
- Pauley, S. Lighting for the Human Circadian Clock. Recent Research Indicates That Lighting Has Become a Public Health Issue. Med. Hypotheses 2004, 63, 588–596. [Google Scholar] [CrossRef] [PubMed] [Green Version]
- Dettweiler, U.; Becker, C.; Auestad, B.H.; Simon, P.; Kirsch, P. Stress in School. Some Empirical Hints on the Circadian Cortisol Rhythm of Children in Outdoor and Indoor Classes. Int. J. Environ. Res. Public Health 2017, 14, 475. [Google Scholar] [CrossRef] [Green Version]
- Ritonja, J.; McIsaac, M.A.; Sanders, E.; Kyba, C.; Grundy, A.; Cordina-Duverger, E.; Spinelli, J.J.; Aronson, K.J. Outdoor light at night at residences and breast cancer risk in Canada. Eur. J. Epidemiol. 2020, 35, 579–589. [Google Scholar] [CrossRef] [PubMed]
- Dominoni, D.M.; Borniger, J.C.; Nelson, R.J. Light at night, clocks and health: From humans to wild organisms. Biol. Lett. 2016, 12, 2–5. [Google Scholar] [CrossRef] [Green Version]
- Richard, G.; Stevens, P.; George, C.; Brainard, P.; David, E.; Blask, M.; Steven, W.; Lockley, P.; Mario, E.; Motta, M. Adverse Health Effects of Nighttime Lighting Comments on American Medical Association Policy Statement. Am. J. Prev. Med. 2013, 45, 343–346. [Google Scholar] [CrossRef]
- Cajochen, C.; Frey, S.; Anders, D.; Späti, J.; Bues, M.; Pross, A.; Mager, R.; Wirz-Justice, A.; Stefani, O. Evening exposure to a light-emitting diodes (LED)-backlit computer screen affects circadian physiology and cognitive performance. J. Appl. Physiol. 2011, 110, 1432–1438. [Google Scholar] [CrossRef] [Green Version]
- Chen, H.T.; Tan, S.C. Color Variation Reduction of GaN-Based White Light-Emitting Diodes Via Peak-Wavelength Stabilization. IEEE Trans. Power Electron. 2013, 29, 3709–3719. [Google Scholar] [CrossRef] [Green Version]
- Zhang, Y.; Long, E.; Zhang, M. A New Thermal Interface Material: Graphene-epoxy Composite used for LED Heat Dissipation. Chiang Mai J. Sci. 2018, 45, 2459–2470. [Google Scholar]
- Min, J.; Min, K. Journal of A ff ective Disorders Outdoor light at night and the prevalence of depressive symptoms and suicidal behaviors: A cross-sectional study in a nationally representative sample of Korean adults. J. Affect. Disord. 2018, 227, 199–205. [Google Scholar] [CrossRef]
- Cho, Y.; Ryu, S.-H.; Lee, B.R.; Kim, K.H.; Lee, E.; Choi, J. Effects of artificial light at night on human health: A literature review of observational and experimental studies applied to exposure assessment. Chronobiol. Int. J. Biol. Med. Rhythm. Res. 2015, 32, 1294–1310. [Google Scholar] [CrossRef]
- Hsu, C.N.; Tain, Y.L. Light and circadian signaling pathway in pregnancy: Programming of adult health and disease. Int. J. Mol. Sci. 2020, 21, 2232. [Google Scholar] [CrossRef] [Green Version]
- Liu, Y.; Mou, T. Evaluation of Window Lighting Considering the Circadian Effect. In Proceedings of the CIE Centenary Conference towards a New Century of Light, Paris, France, 15–16 April 2013; pp. 851–856. [Google Scholar]
- Delendik, K.; Kolyago, N.; Voitik, O. Design and investigation of cooling system for high-power LED luminaire. Comput. Math. Appl. 2021, 83, 84–94. [Google Scholar] [CrossRef]
- Sun, L.; Zhu, J.; Wong, H. Simulation and evaluation of the peak temperature in LED light bulb heatsink. Microelectron. Reliab. 2016, 61, 140–144. [Google Scholar] [CrossRef]
- Shin, H.W.; Jung, S.B.; Lee, H.S. Thermal Resistance Analysis of Light-Emitting Diode Modules with Thermal Via Structure. J. Electron. Mater. 2018, 47, 7323–7330. [Google Scholar] [CrossRef]
- Cai, M.; Liang, Z.; Tian, K.M.; Yun, M.H.; Zhang, P.; Yang, D.G.; Zhang, G.Q. Junction Temperature Prediction for LED Luminaires Based on a Subsystem-Separated Thermal Modeling Method. IEEE Access 2019, 7, 119755–119764. [Google Scholar] [CrossRef]
- Şevik, S.; Abuşka, M.; Özdilli, Ö. Thermal performance analysis of a novel linear LED housing with inner and outer fins. Int. Commun. Heat Mass Transf. 2020, 119, 104970. [Google Scholar] [CrossRef]
- Chakravarthii, D.M.K.; Devarajan, M.; Choo, C.L.; Suvindraj, K. Thermal and Optical Performance of LEDs Mounted on Substrates With Converging-Diverging and Diverging-Converging Channels. IEEE Trans. Compon. Packag. Manuf. Technol. 2018, 8, 1381–1390. [Google Scholar] [CrossRef]
- Chen, H.; Lin, S.; Xiong, C. Analysis and Modeling of Thermal Effect and Optical Characteristic of LED Systems with Parallel Plate-Fin Heatsink. IEEE Photonics J. 2017, 9, 1–11. [Google Scholar] [CrossRef]
- Hsieh, J.; Lin, D.; Cheng, C.; Kingkaew, S. The optimal design of the thermal spreading on high power LEDs. Microelectron. J. 2014, 45, 904–909. [Google Scholar] [CrossRef]
- Sokmen, K.; Yuruklu, E.; Yamankaradeniz, N. Computational thermal analysis of cylindrical fin design parameters and a new methodology for defining fin structure in LED automobile headlamp cooling applications. Appl. Therm. Eng. 2016, 94, 534–542. [Google Scholar] [CrossRef]
- Hermoso-Orzáez, M.J.; Lozano-Miralles, J.A.; Lopez-Garcia, R.; Brito, P. Environmental Criteria for Assessing the Competitiveness of Public Tenders with the Replacement of Large-Scale LEDs in the Outdoor Lighting of Cities as a Key Element for Sustainable Development: Case Study Applied with PROMETHEE Methodology. Sustainability 2019, 11, 5982. [Google Scholar] [CrossRef] [Green Version]
- Jeon, G.W.; Seung-Taek, O.; Lim, J.H. Natural Light Property-Based LED Lighting System to Maintain Human Circadian Rhythm. IOP Conf. Ser. Mater. Sci. Eng. 2019, 630, 012019. [Google Scholar] [CrossRef]
- Rea, M.S. Human Health and Well-Being: Promises for a Bright Future from Solid-State Lighting. In Proceedings of the SPIE 7954, Light-Emitting Diodes: Materials, Devices, and Applications for Solid State Lighting XV; SPIE: San Francisco, CA, USA, 2011; p. 795404. [Google Scholar]
- Shahzad, K.; Čuček, L.; Sagir, M.; Ali, N.; Rashid, M.I.; Nazir, R.; Nizami, A.S.; Al-Turaif, H.A.; Ismail, I.M.I. An ecological feasibility study for developing sustainable street lighting system. J. Clean. Prod. 2018, 175, 683–695. [Google Scholar] [CrossRef]
- Lozano-Miralles, J.A.; Hermoso-Orzáez, M.J.; Gago-Calderón, A.; Brito, P. LCA case study to LED outdoor luminaries as a circular economy solution to local scale. Sustainability 2020, 12, 190. [Google Scholar] [CrossRef] [Green Version]
- Anithambigai, P.; Chakravarthii, M.K.D.; Mutharasu, D.; Huong, L.H.; Zahner, T.; Lacey, D.; Kamarulazizi, I. Potential thermally conductive alumina filled epoxy composite for thermal management of high power LEDs. J. Mater. Sci. Mater. Electron. 2017, 28, 856–867. [Google Scholar] [CrossRef]
- Lu, L.; Zhang, Z.; Guan, Y.; Zheng, H. Enhancement of Heat Dissipation by Laser Micro Structuring for LED Module. Polymers 2018, 10, 886. [Google Scholar] [CrossRef] [Green Version]
- Analysis, A. Power Quality and Energy Efficiency in the Pre-Evaluation of an Outdoor Lighting Renewal with Study and Amortization Analysis. Energies 2017, 10, 836. [Google Scholar] [CrossRef]
- Yu, X.; Zhang, B.; Zhao, S.; Kao, Z.; Yang, S. Enhancement of Heat Dissipation in LED Using Graphene and Carbon Nanotubes. ECS J. Solid State Sci. Technol. 2018, 7, M153–M160. [Google Scholar] [CrossRef]
- Lee, D.; Lee, J.; Cho, M.; Park, H.; Cha, Y. Influence of the Thermal Conductivity of Thermally Conductive Plastics on the Thermal Distribution of an Light-Emitting Diode Headlight for Vehicles. J. Nanosci. Nanotechnol. 2018, 18, 5904–5907. [Google Scholar] [CrossRef]
- Macuzic, S.; Lukic, J.; Ruzic, D. Three-Dimensional Simulation of the McPherson Suspension System. Teh. Vjesn. Gaz. 2018, 25, 1286–1290. [Google Scholar] [CrossRef]
- Nair, D.V.; Ghoshdastidar, P.S. A comparative study of 2-D and 3-D conjugate natural convection from a vertical rectangular fin array with multilayered base subjected to distributed high heat flux. Int. J. Heat Mass Transf. 2018, 121, 1316–1334. [Google Scholar] [CrossRef]
- Zhou, J.; Huang, J.; Wang, Y.; Zhou, Z. Thermal distribution of multiple LED module. Appl. Therm. Eng. 2016, 93, 122–130. [Google Scholar] [CrossRef]
- Vera Coello, M.; Iglesias Estradé, I.; Sánchez Pérez, A.L.; Martínez Bazán, C. Ingeniería Fluidomecánica; Editorial Paraninfo: Madrid, Spain, 2012; ISBN 9788497329040. [Google Scholar]
- Chen, H.Y.; Chen, C. Determining the emissivity and temperature of building materials by infrared thermometer. Constr. Build. Mater. 2016, 126, 130–137. [Google Scholar] [CrossRef]
- Wen, C.-D.; Chai, T.Y. Experimental investigation of emissivity of aluminum alloys and application of multispectral radiation thermometry. Appl. Therm. Eng. 2011, 31, 2414–2421. [Google Scholar] [CrossRef]
- Colaco, A.; Kurian, C.; Kini, S.; Colaco, S.; Johny, C. Thermal characterization of multicolor LED luminaire. Microelectron. Reliab. 2017, 78, 379–388. [Google Scholar] [CrossRef]
- Karatekin, C.; Kökkaya, O. Comparative analysis of different cooling fin types for countering LED luminaires’ heat problems. Turk. J. Electr. Eng. Comput. Sci. 2018, 26, 454–466. [Google Scholar] [CrossRef]
- Ben Abdelmlek, K.; Araoud, Z.; Ghnay, R.; Abderrazak, K.; Charrada, K.; Zissis, G. Effect of thermal conduction path deficiency on thermal properties of LEDs package. Appl. Therm. Eng. 2016, 102, 251–260. [Google Scholar] [CrossRef]
- Hahn, B.D.; Kim, Y.; Ahn, C.W.; Choi, J.J.; Ryu, J.; Kim, J.W.; Yoon, W.H.; Park, D.S.; Yoon, S.Y.; Ma, B. Fabrication and characterization of aluminum nitride thick film coated on aluminum substrate for heat dissipation. Ceram. Int. 2016, 42, 18141–18147. [Google Scholar] [CrossRef]
- Cho, E.C.; Huang, J.H.; Li, C.P.; Chang-Jian, C.W.; Lee, K.C.; Hsiao, Y.S.; Huang, J.H. Graphene-based thermoplastic composites and their application for LED thermal management. Carbon N. Y. 2016, 102, 66–73. [Google Scholar] [CrossRef]
- Moon, S.M.; Kwon, S.Y.; Lim, J.H. Implementation of smartphone-based color temperature and wavelength control LED lighting system. Clust. Comput. 2016, 19, 949–966. [Google Scholar] [CrossRef]


| Components | Subcomponent | Part | Material | Information |
|---|---|---|---|---|
| Cover | - | - | PC | Opaque |
| Heatsink | - | - | Aluminum | Confidential |
| Equipment carrier | - | - | PA66–30FV | - |
| Equipment | - | - | PA66–30FV | - |
| Drivers | Microchips | Silicon | 2 drivers; 6 W/driver | |
| PCB driver | Welding | Tin | ||
| Base | Aluminum | |||
| Housing | - | PC | ||
| Diffuser | - | - | PC | Transparent |
| Chassis | - | - | PA66–30FV | - |
| PCB LED | - | - | Aluminum | - |
| LED | - | - | Copper/Material Rth | 96 LED; 2 W/LED |
| Material | Density kg/m3 | Specific Heat J/kg·K | Thermal Conductivity W/m·K |
|---|---|---|---|
| Aluminum | 2750 | 961 | 200 |
| Silicon | 2330 | 700 | 148 |
| Tin | 7365 | 228 | 66.6 |
| PA66–30FV | 1370 | 2290 | 0.29 |
| PC | 1200 | 1250 | 0.19 |
| Copper | 8900 | 394 | 387 |
| Material Rth | 3300 | 780 | 52.91 |
| Component | Material | Maximum Limit Temperature (°C) | Temperature Measured (°C) |
|---|---|---|---|
| Cover | PC | 145 | 70 |
| Heatsink | Aluminum | 460 | 112 |
| Equipment carrier | PA66–30FV | 150 | 77 |
| Equipment | PA66–30FV | 150 | 112 |
| Drivers Bases | Aluminum | 460 | 112 |
| Driver (Electronic) | Silicon (Weakest) | 150 | 105 |
| Diffuser | PC | 145 | 100 |
| Chassis | PA66–30FV | 150 | 107 |
| PCB | Aluminum | 460 | 117 |
| Component | Material | Maximum Limit Temperature (°C) | Temperature Measured (°C) |
|---|---|---|---|
| Cover | PC | 145 | 90 |
| Heatsink | Aluminum | 460 | 131 |
| Equipment carrier | PA66–30FV | 150 | 97 |
| Equipment | PA66–30FV | 150 | 129 |
| Drivers Bases | Aluminum | 460 | 130 |
| Driver (Electronic) | Silicon (Weakest) | 150 | 130 |
| Diffuser | PC | 145 | 118 |
| Chassis | PA66–30FV | 150 | 123 |
| PCB | Aluminum | 460 | 137 |
| Component | Material | Maximum Limit Temperature (°C) | Temperature Measured (°C) |
|---|---|---|---|
| Cover | PC | 145 | 42 |
| Heatsink | Aluminum | 460 | 82 |
| Equipment carrier | PA66–30FV | 150 | 47 |
| Equipment | PA66–30FV | 150 | 83 |
| Drivers Bases | Aluminum | 460 | 84 |
| Driver (Electronic) | Silicon (Weakest) | 150 | 90 |
| Diffuser | PC | 145 | 69 |
| Chassis | PA66–30FV | 150 | 74 |
| PCB | Aluminum | 460 | 88 |
| Model | Nominal Power (W) | Number of LEDs | Power by LED (W/LED) | Power DRIVER (W) |
|---|---|---|---|---|
| ATP Aire Serie 7 | 204 | 96 | 2 | 12 (6 W/driver) |
| Model | Efficiency (%) | Nominal Power (W) | Operating Input Range (V) | Storage Temperature (°C) | Output Current (A) |
|---|---|---|---|---|---|
| MP4688 | 95 | 2–2.5 | 4.5–80 | −65 to 150 | Up to 1 A |
| Attribute | Value |
|---|---|
| Thermal sensitivity | ≤90 mK |
| Temperature Measurement Range | −20 → +350 °C |
| Maximum Accuracy of Temperature Measurement | ±2 °C |
| Field of vision H × V | 23 × 17° |
| Update frequency | 9 Hz |
| Minimum Focus Distance | 15 (Thermal Lens) cm, 46 (Visual Lens) cm |
| Type of Focus | Manual |
| Detector Resolution | 160 × 120 pixel |
| Display size | 3.7 plg |
| Display Resolution | 640 × 480 pixel |
| Model number | Ti25 |
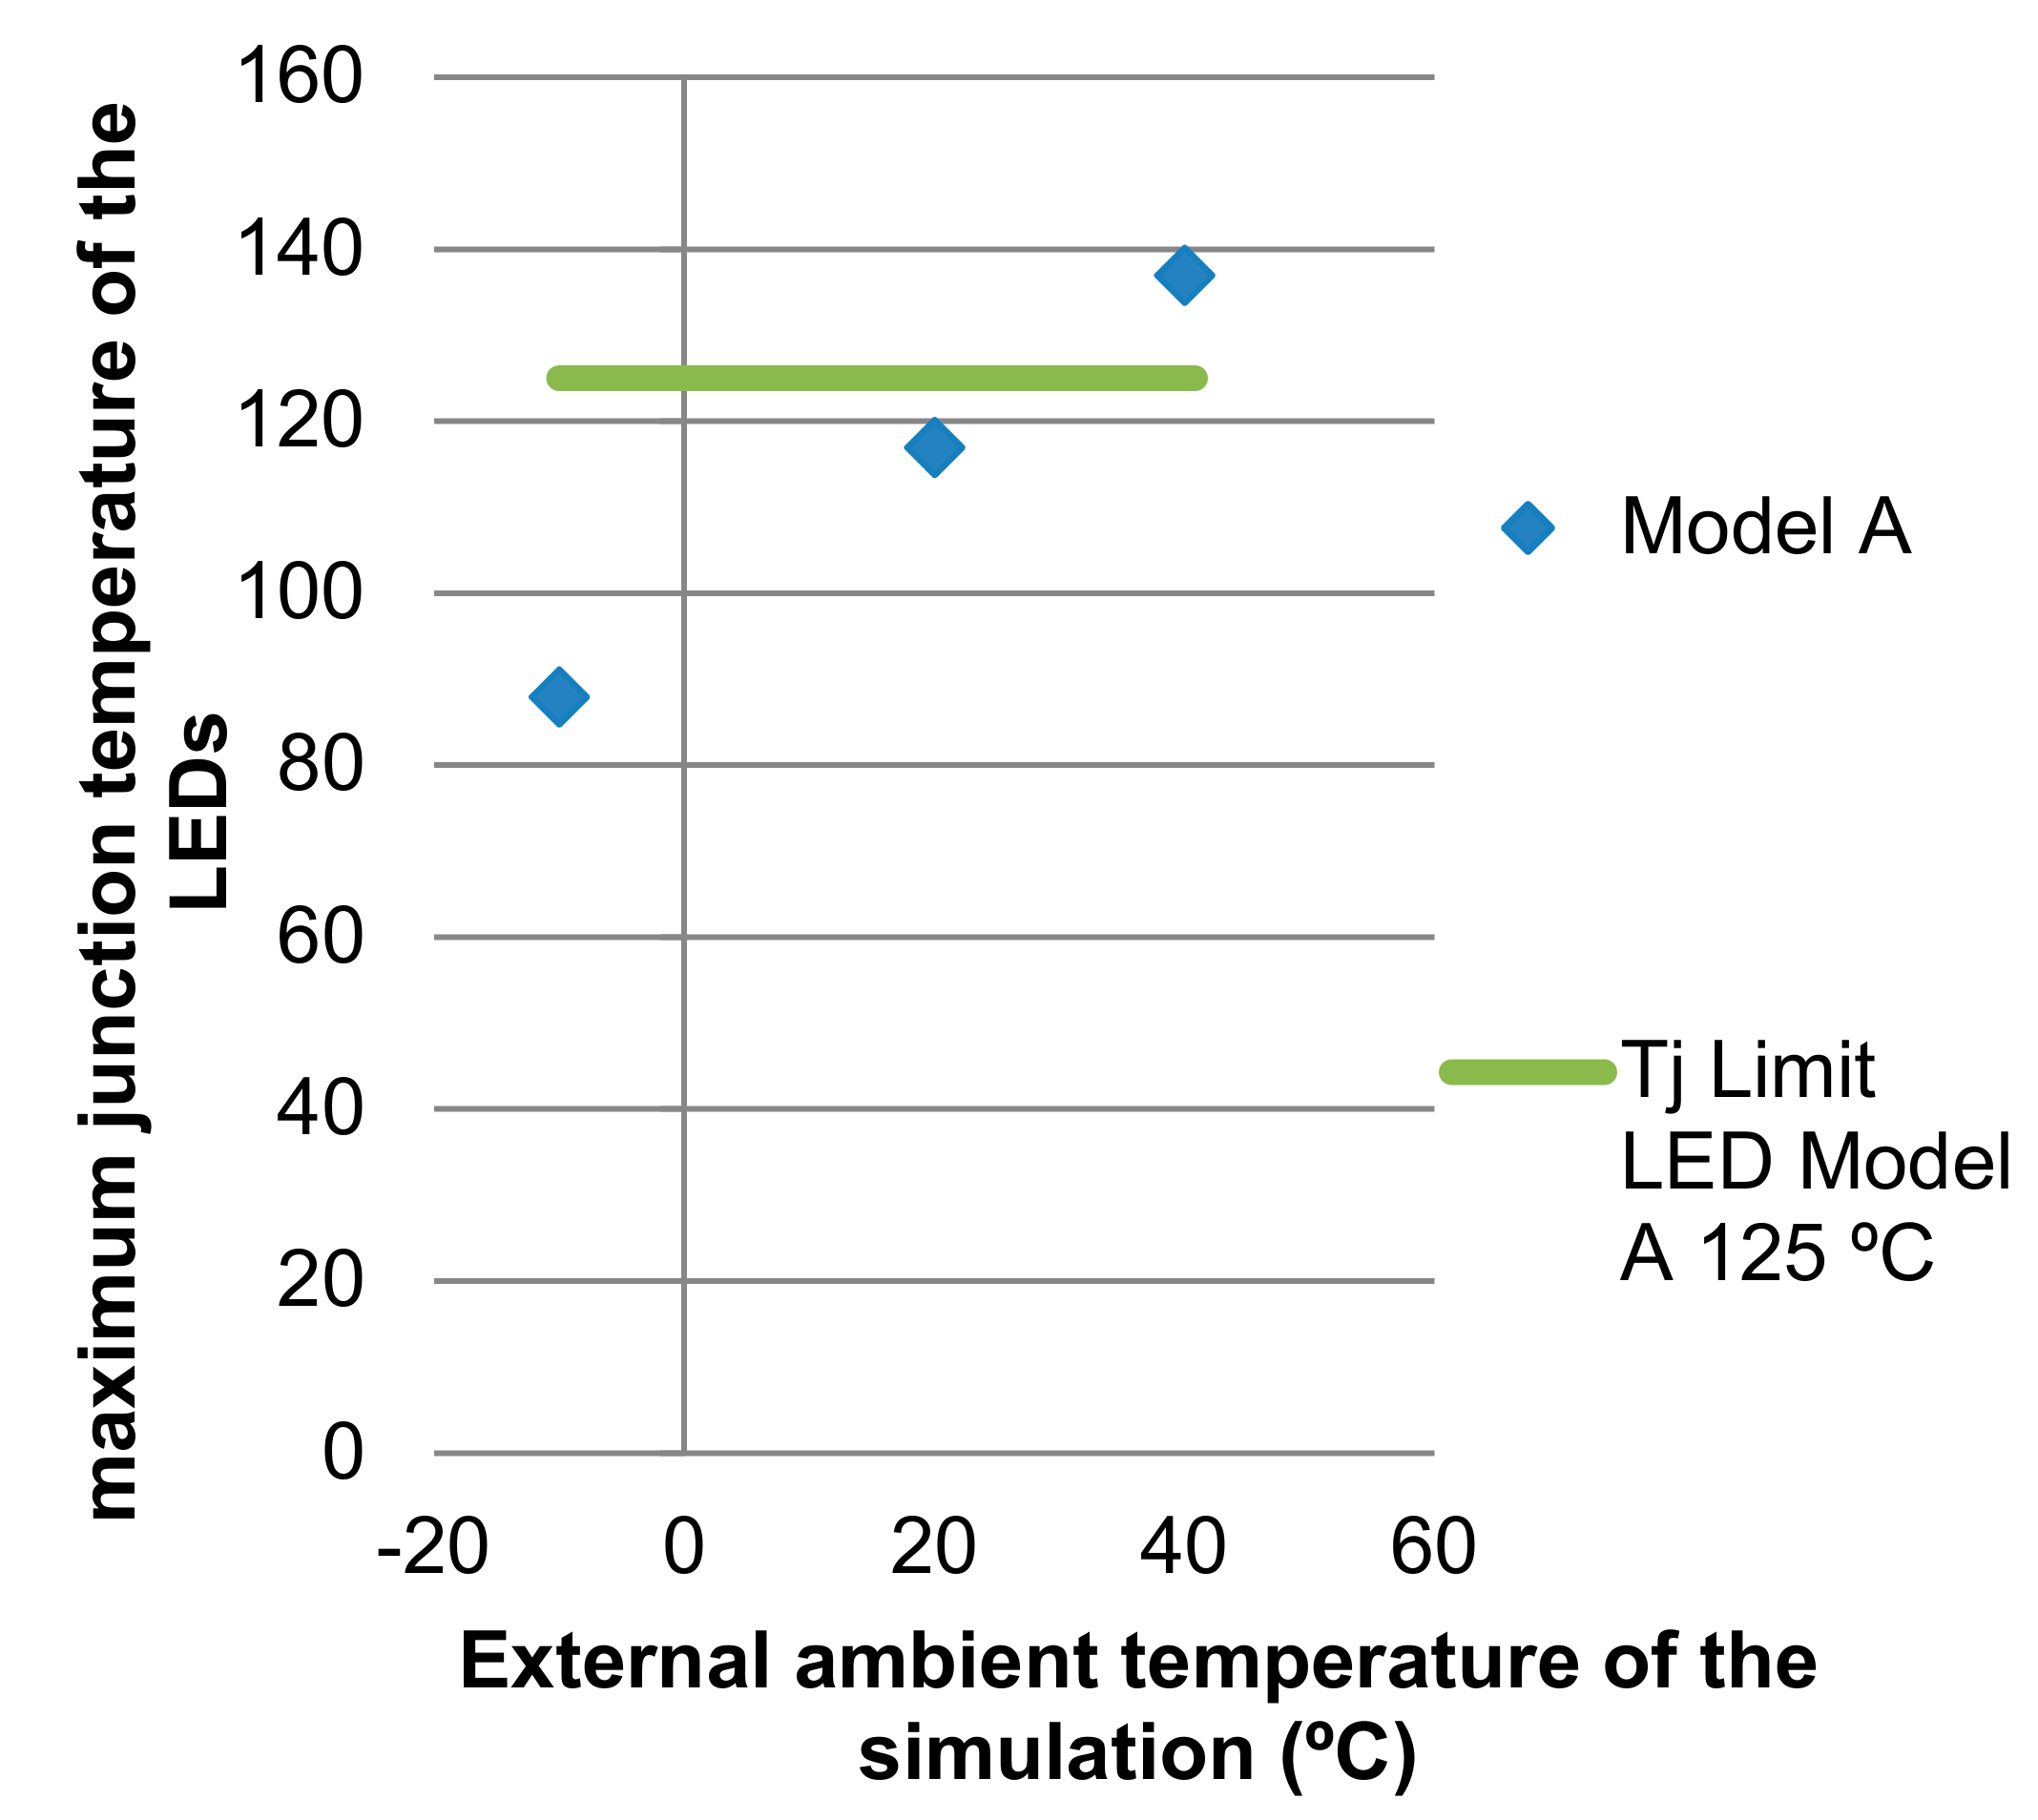
| External Ambient Temperature of the Simulation (°C) | Junction Temperature of the LEDs Tj (°C) | |
|---|---|---|
| Temperature 1 | 40 | 135 |
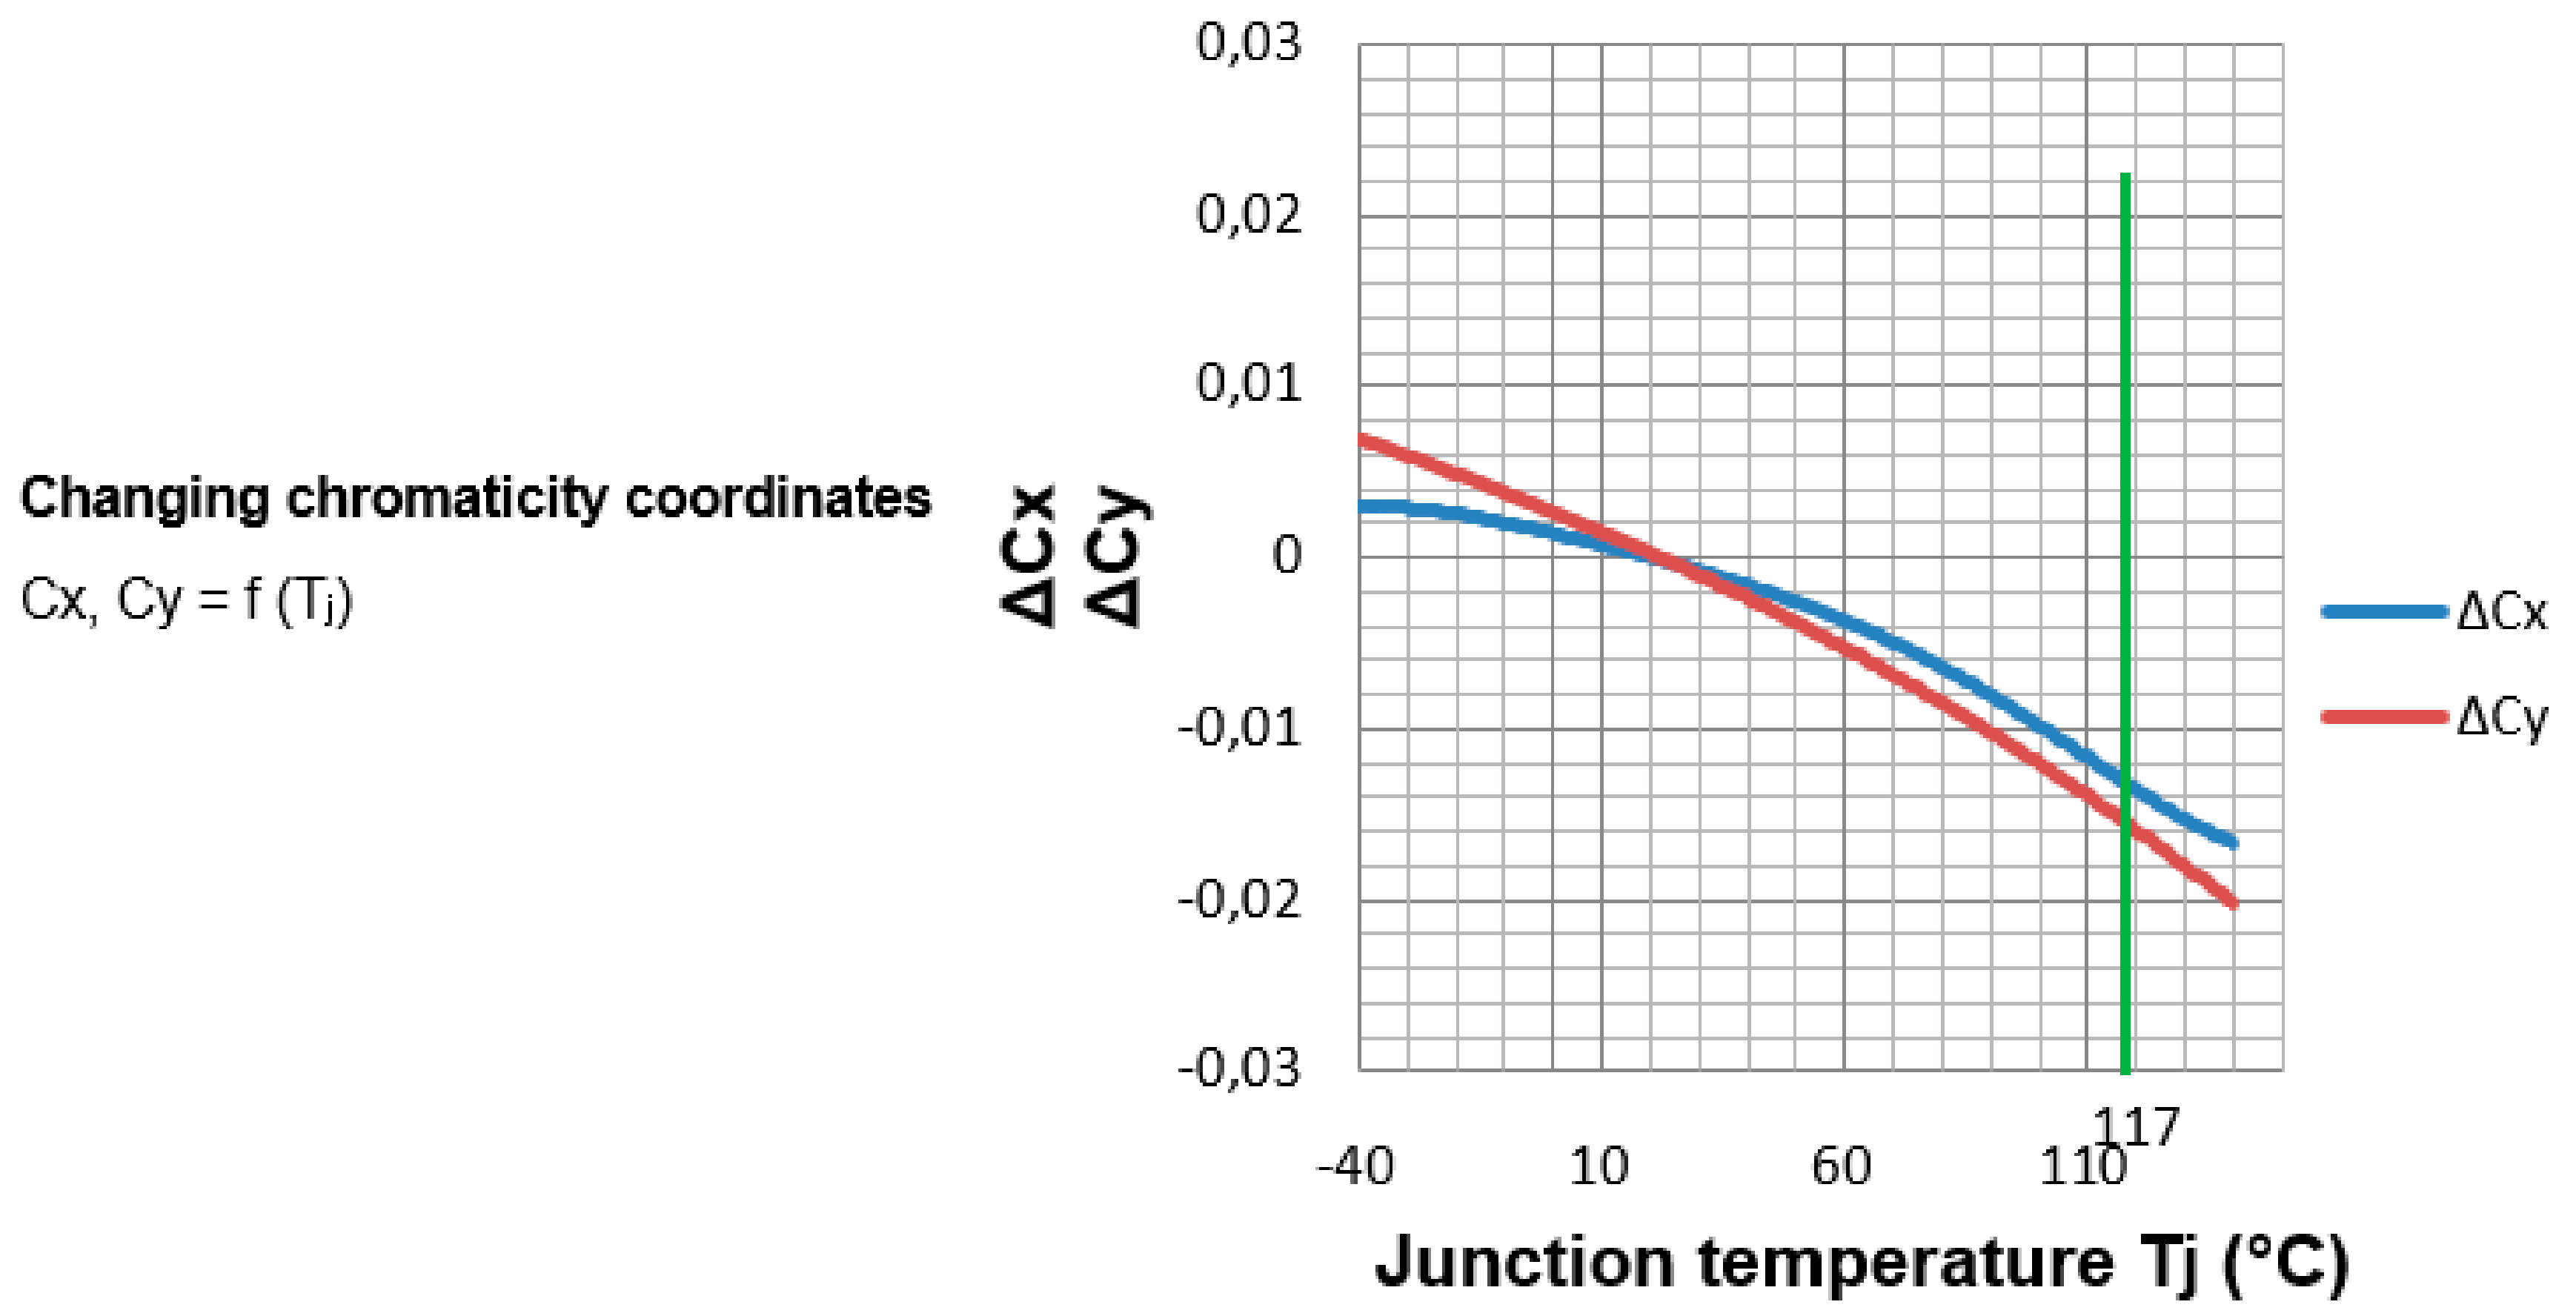
| Temperature 2 | 20 | 117 |
| Temperature 3 | −10 | 86 |
Publisher’s Note: MDPI stays neutral with regard to jurisdictional claims in published maps and institutional affiliations. |
© 2022 by the authors. Licensee MDPI, Basel, Switzerland. This article is an open access article distributed under the terms and conditions of the Creative Commons Attribution (CC BY) license (https://creativecommons.org/licenses/by/4.0/).
Share and Cite
Unión-Sánchez, J.d.D.; Hermoso-Orzáez, M.J.; Hervás-Pulido, M.J.; Ogáyar-Fernández, B. Impact of Thermal Dissipation on the Lighting Performance and Useful Life of LED Luminaires Applied to Urban Lighting: A Case Study. Int. J. Environ. Res. Public Health 2022, 19, 752. https://doi.org/10.3390/ijerph19020752
Unión-Sánchez JdD, Hermoso-Orzáez MJ, Hervás-Pulido MJ, Ogáyar-Fernández B. Impact of Thermal Dissipation on the Lighting Performance and Useful Life of LED Luminaires Applied to Urban Lighting: A Case Study. International Journal of Environmental Research and Public Health. 2022; 19(2):752. https://doi.org/10.3390/ijerph19020752
Chicago/Turabian StyleUnión-Sánchez, Juan de Dios, Manuel Jesús Hermoso-Orzáez, Manuel Jesús Hervás-Pulido, and Blas Ogáyar-Fernández. 2022. "Impact of Thermal Dissipation on the Lighting Performance and Useful Life of LED Luminaires Applied to Urban Lighting: A Case Study" International Journal of Environmental Research and Public Health 19, no. 2: 752. https://doi.org/10.3390/ijerph19020752
APA StyleUnión-Sánchez, J. d. D., Hermoso-Orzáez, M. J., Hervás-Pulido, M. J., & Ogáyar-Fernández, B. (2022). Impact of Thermal Dissipation on the Lighting Performance and Useful Life of LED Luminaires Applied to Urban Lighting: A Case Study. International Journal of Environmental Research and Public Health, 19(2), 752. https://doi.org/10.3390/ijerph19020752