Article

Quantification of the Influence of Citrate/Fe(II) Molar Ratio on Hydroxyl Radical Production and Pollutant Degradation during Fe(II)-Catalyzed O2 and H2O2 Oxidation Processes

1
State Key Laboratory of Biogeology and Environmental Geology, China University of Geosciences, 68 Jincheng Street, East Lake High-Tech Development Zone, Wuhan 430078, China
2
Hubei Key Laboratory of Yangtze Catchment Environmental Aquatic Science, School of Environmental Studies, China University of Geosciences, 68 Jincheng Street, East Lake High-Tech Development Zone, Wuhan 430078, China
*
Author to whom correspondence should be addressed.
Int. J. Environ. Res. Public Health 2022, 19(19), 12977; https://doi.org/10.3390/ijerph191912977
Submission received: 18 September 2022 / Revised: 7 October 2022 / Accepted: 8 October 2022 / Published: 10 October 2022
(This article belongs to the Special Issue State-of-the-Art Research of Soil and Groundwater Remediation)

Abstract

:
Ligand-enhanced hydroxyl radical (•OH) production is an important strategy for Fe(II)-catalyzed O2 and H2O2 oxidation processes. However, the influence of the molar ratio of ligands to Fe(II) on •OH production remains elusive. This study employed citrate and inorganic dissolved Fe(II) (Fe(II)dis) as the representative ligand and Fe(II) species, respectively, to quantify this relationship. Results showed that •OH production was highly dependent on the citrate/Fe(II) molar ratio. For instance, for the oxygenation of Fe(II)dis, the •OH accumulations were 2.0–8.5, 3.4–28.5 and 8.1–42.3 μM at low (0.25–0.5), moderate (0.5–1), and high (1–2) citrate/Fe(II) molar ratios, respectively. At low citrate/Fe(II) molar ratio (<0.5), inorganic Fe(II)dis mainly contributed to •OH production, with the increase in the citrate/Fe(II) molar ratio to a high level (1–2), Fe(II)-citrate complex turned to the electron source for •OH production. The change in Fe(II) speciation with the increase of citrate/Fe(II) molar ratio elevated •OH production. For pollutant degradation, 1 mg/L phenol was degraded by 53.6% within 40 min during oxygenation of Fe(II)-citrate system (1:1) at pH 7. Our results suggest that a moderate molar ratio of ligand/Fe(II) (0.5–1) may be optimal for Fe(II)-catalyzed O2 and H2O2 oxidation processes.

1. Introduction

Hydroxyl radical-based advanced oxidation process (HR-AOP) is considered to be an effective technology for the remediation of contaminated soil and groundwater [1]. The hydroxyl radical (•OH) is the most powerful oxidant in the natural system [2,3,4], capable of oxidizing most environmental pollutants, such as chlorinated hydrocarbons [5,6], antibiotic [7] and aromatic compounds [8,9,10]. Hydrogen peroxide (H2O2) is the traditional source of •OH in HR-AOP, and recent studies showed that oxygen (O2) can also act as a source of •OH in some specific conditions, for example, when the reduced soil or sediment was exposed to oxic conditions [1,6,7]. However, H2O2 and O2 cannot be spontaneously transformed to •OH in natural environments, requiring activation by chemical agents or physical treatments. Ferrous iron (Fe(II)) is the most commonly used and effective activator for H2O2 and O2 [1,11,12]. The Fe(II)-catalyzed H2O2 oxidation process (i.e., Fenton reaction) has been widely used in contaminant remediation, such as in situ chemical oxidation projects and wastewater treatment [1,11]. In comparison, the Fe(II)-catalyzed O2 oxidation process has been demonstrated to degrade pollutants only at the laboratory scale [5,6,7,8,9,13]. However, O2 is cheaper and easier to obtain than H2O2, so the Fe(II)-catalyzed O2 oxidation process is also proposed as a promising method for pollutant degradation [1].
Although the Fe(II)-catalyzed H2O2 oxidation process is effective in acidic pH conditions, the efficiency of pollutant degradation was poor at circumneutral or alkaline pH conditions [6,7,8,9,11,13,14,15]. This change was related to the variation of Fe(II) and Fe(III) speciation at a different solution pH. With the increase of solution pH, Fe(II) speciation varied from Fe2+ to FeOH+ and Fe(OH)2, resulting in the decrease of •OH yield from H2O2 decomposition by Fe(II) at high pH conditions [12]. In addition, inorganic Fe3+ will hydrolyze to Fe(III) precipitation at high pH conditions, which is not conducive to Fe(II) regeneration [11]. For the Fe(II)-catalyzed O2 oxidation process, the •OH yield and efficiency of pollutant degradation were relatively low at circumneutral pH conditions [6,7,9,13].
To enhance the •OH yield during Fe(II)-catalyzed O2 and H2O2 oxidation processes, a common strategy is adding ligands (L, such as citrate) to regulate Fe(II)/Fe(III) speciation [11]. A large number of studies have shown that the addition of ligands can increase •OH yield during Fe(II)-catalyzed O2 and H2O2 oxidation processes and improve pollutant degradation efficiency [11,16,17,18,19]. For instance, Xie et al. (2021) reported that the addition of 2 mM tripolyphosphate elevated trichloroethylene degradation from 13% to 80% in oxic sediment suspension [16]. Given the significance of ligand-enhanced •OH production during Fe(II)-catalyzed O2 and H2O2 oxidation processes, many studies have explored the mechanisms of ligand-enhanced •OH production and found that the enhancement was related to the formation of Fe(II)/Fe(III)-L complexes through the complexation of Fe(II)/Fe(III) by ligands [11,12,16,17,18,19,20,21,22,23]. In general, the higher concentrations of Fe(II)/Fe(III)-L complexes result in a more significant enhancement in •OH production during Fe(II)-catalyzed O2 and H2O2 oxidation processes [1,11,23].
Since the generation of Fe(II)-L complex depended on the concentrations of ligand and free dissolved Fe(II) (Fe(II)dis) and the complexation ability of ligands [18], the influence of ligand concentrations and types and Fe(II) dosages on •OH production and pollutant degradation were widely investigated [16,17,18,20,21,24]. However, there was no conclusive agreement on the roles of the molar ratio of ligand/Fe(II) on •OH production and pollutant degradation [11]. Because the essence of changing ligand and Fe(II) dosages in different reaction systems is to regulate the molar ratio of ligand/Fe(II), the latter is a key factor for Fe(II)-catalyzed O2 and H2O2 oxidation processes. These knowledge gaps limit the development of Fe(II)-catalyzed O2 and H2O2 oxidation processes.
The objective of this study was to quantify the influence of ligand/Fe(II) ratio on •OH production and pollutant degradation during Fe(II)-catalyzed O2 and H2O2 oxidation processes. To quantify •OH production during the reaction process, the oxidation of benzoate to p-hydroxybenzoic acid (p-HBA) was used as a probe reaction [25,26]. For the sake of simplicity, citrate and inorganic Fe(II)dis were chosen as the representatives of ligands and Fe(II) species, respectively. Note that both citrate and inorganic Fe(II)dis have been widely used in previous studies [16,18,21,23,24]. The influence of citrate/Fe(II) molar ratio on •OH production was assessed by fixing the initial Fe(II) concentration while varying the initial citrate concentration over a pH range 6–7.5. Phenol was chosen as a model pollutant to test the oxidative impact of an Fe(II)-O2 system. A kinetic model was developed to quantitatively describe the dependence of •OH production and pollutant degradation on citrate/Fe(II) molar ratio.

2. Materials and Methods

2.1. Chemicals

Ferrous sulfate heptahydrate (FeSO4·7H2O, 99.9%), trisodium citrate dihydrate (C6H5Na3O7·2H2O, 99%), sodium benzoate (99.5%), p-hydroxybenzoic acid (p-HBA, 99%) and boric acid were purchased from Sinopharm Chemical Regent Co. Ltd., China. Piperazine-N, N-bis-(ethanesulfonic acid) sodium salt (PIPES, 99%) and 2-(N-morpholino)ethanesulfonic acid (MES, 99%) were acquired from Sigma-Aldrich. All other chemicals were of analytical grade or above. Deionized water (18.2 MΩ·cm) produced by a Heal Force NW ultrapure water System was used in all the experiments.

2.2. Oxic Experiments

A series of oxic experiments were used to explore the influence of citrate/Fe(II) molar ratio on •OH production and phenol degradation during the Fe(II)-catalyzed O2 oxidation process. All oxic experiments were conducted at 25 ± 1 °C in 150-mL conical flasks that were wrapped with aluminum foil to avoid light. Teflon-coated magnetic stirring bars were used to keep the stirring speed at approximately 300 rpm. To initiate experiments, citrate concentrations of 62.5, 125, 250, and 500 μM were added to the solution containing 250 μM Fe(II)dis, 10 mM buffer (MES for pH 6 and PIPES for pH 7 and 7.5), 20 mM benzoate and 5 mM Na2SO4. Control experiments were carried out with the addition of inorganic Fe(II)dis alone under otherwise identical conditions.
To evaluate the oxidative impact of •OH produced from oxygenation of Fe(II)-citrate system, 1 mg/L phenol (kphenol, •OH = 6.6 × 10⁹ M−1 s−1, [27]) was added to the Fe(II)-citrate solution containing 250 μM citrate, 250 μM Fe(II)dis and 100 mM boric acid. It is noted that boric acid had a marginal influence on pollutant degradation [5] due to the low reaction rate constant of boric acid with •OH (kboric acid, •OH < 5 × 10⁴ M−1 s−1, [27]).
During all of the above experiments, the change of solution pH was less than 0.1 and the dissolved O2 (DO) concentration was maintained at near 0.25 mM. At predetermined times of reaction, approximately 1-mL sample was taken out for p-HBA, Fe(II)dis, Fe(III)dis and total Fe analysis. All experiments were performed in duplicate.

2.3. Anoxic Experiments

The anoxic experiments were used to explore the influence of citrate/Fe(II) molar ratio on •OH production during the Fe(II)-catalyzed H2O2 oxidation process. A solution containing 250 μM inorganic Fe(II)dis, 20 mM benzoate and 10 mM buffer was first purged with N2 (99.999%) for at least 1 h and then mixed with different concentrations of citrate (0, 62.5, 125, 250 and 500 μM) for 2 h in an anaerobic glovebox (95% N2 and 5% H2, COY, USA). Finally, H2O2 concentrations of 20, 40, 60, 80 and 100 μM were added to the above Fe(II)-citrate system. After a reaction of 30 min, a sample of approximately 1 mL was removed for p-HBA. Note that the residual concentration of H2O2 in all experiments was less than 0.1 μM. These experiments were conducted at pH 6, 7 and 7.5.

2.4. Analysis

For the analysis of the p-HBA concentration, a sample of approximately 0.8 mL was rapidly mixed with 0.8 mL of methanol (HPLC grade) to quench further oxidation of benzoate by •OH and then the suspension was filtered through a membrane of 0.22 μm. The concentration of p-HBA was determined by HPLC according to the previous method [28]. The conversion coefficient between p-HBA and cumulative •OH was 5.87 [25,26]. The detection limit of p-HBA was 0.1 μM. For the analysis of Fe(II)dis and Fe(III)dis, another sample of 0.8 mL was filtered through a membrane of 0.22 μm and the filtrate was collected in a pre-acidified vial. Fe(II)dis concentration was measured by the ferrozine method at wavelength 562 nm [29]. To minimize Fe(III)-citrate interference, Fe(II) analysis was performed within 15 min after the chromogenic reaction. Dissolved total iron (Fetotal) was determined by reducing Fe(III) to Fe(II) with hydroxylamine-HCl. The Fe(III)dis was calculated using the difference between dissolved Fetotal and Fe(II)dis concentrations. For the analysis of solid Fe(II) and Fe(III), the sample was directly mixed with 1 M HCl to dissolve solid phase components and then analyzed. For the analysis of Fe(III) in colloids (1–220 nm) and true solution (<1 nm), the sample was fractioned by filters of 0.22 μm and ultrafiltration membranes of 20 nm (30 kDa, Millipore) and 1 nm (3 kDa, Pall), respectively. The concentration of phenol was measured by HPLC [10].

2.5. Kinetic Modeling and Speciation Calculation

A kinetic model was developed to fit the concentration time series data of Fe(II)dis, Fe(III)dis and •OH under different experimental conditions. Kintecus 6.51 software (James C. Ianni, Lansdowne, PA, USA) was used for calculation [30]. The reaction networks are shown in Table 1 and consist of two subsections: (1) inorganic Fe(II)dis oxidation and (2) extended reactions in the presence of citrate. In the inorganic Fe(II)dis system, both the oxidation of inorganic Fe(II)dis and adsorbed Fe(II) (Fe(II)ad) were considered (reactions A1–A13). In Fe(II)-citrate system, the complexation of Fe(II)dis and Fe(III)dis by citrate (reactions B1–B4) and the oxidation of citrate complexed Fe(II) (reactions B5–B8) were considered. For the sake of simplification, the interactions among •O2, H2O2 and •OH were not included in the kinetic model. More details are given in Section S1 in the supporting information. Because the solution pH varied less than 0.1 unit during experiments, constant pH was used in the calculations. DO concentration was set at 0.25 mM.
To evaluate the influence of citrate/Fe(II) molar ratio on the fraction of complexed Fe(II)/Fe(III), a speciation calculation for Fe(II) and Fe(III) under different experimental conditions was performed with Visual MINTEQ 3.1 [39].

3. Results and Discussion

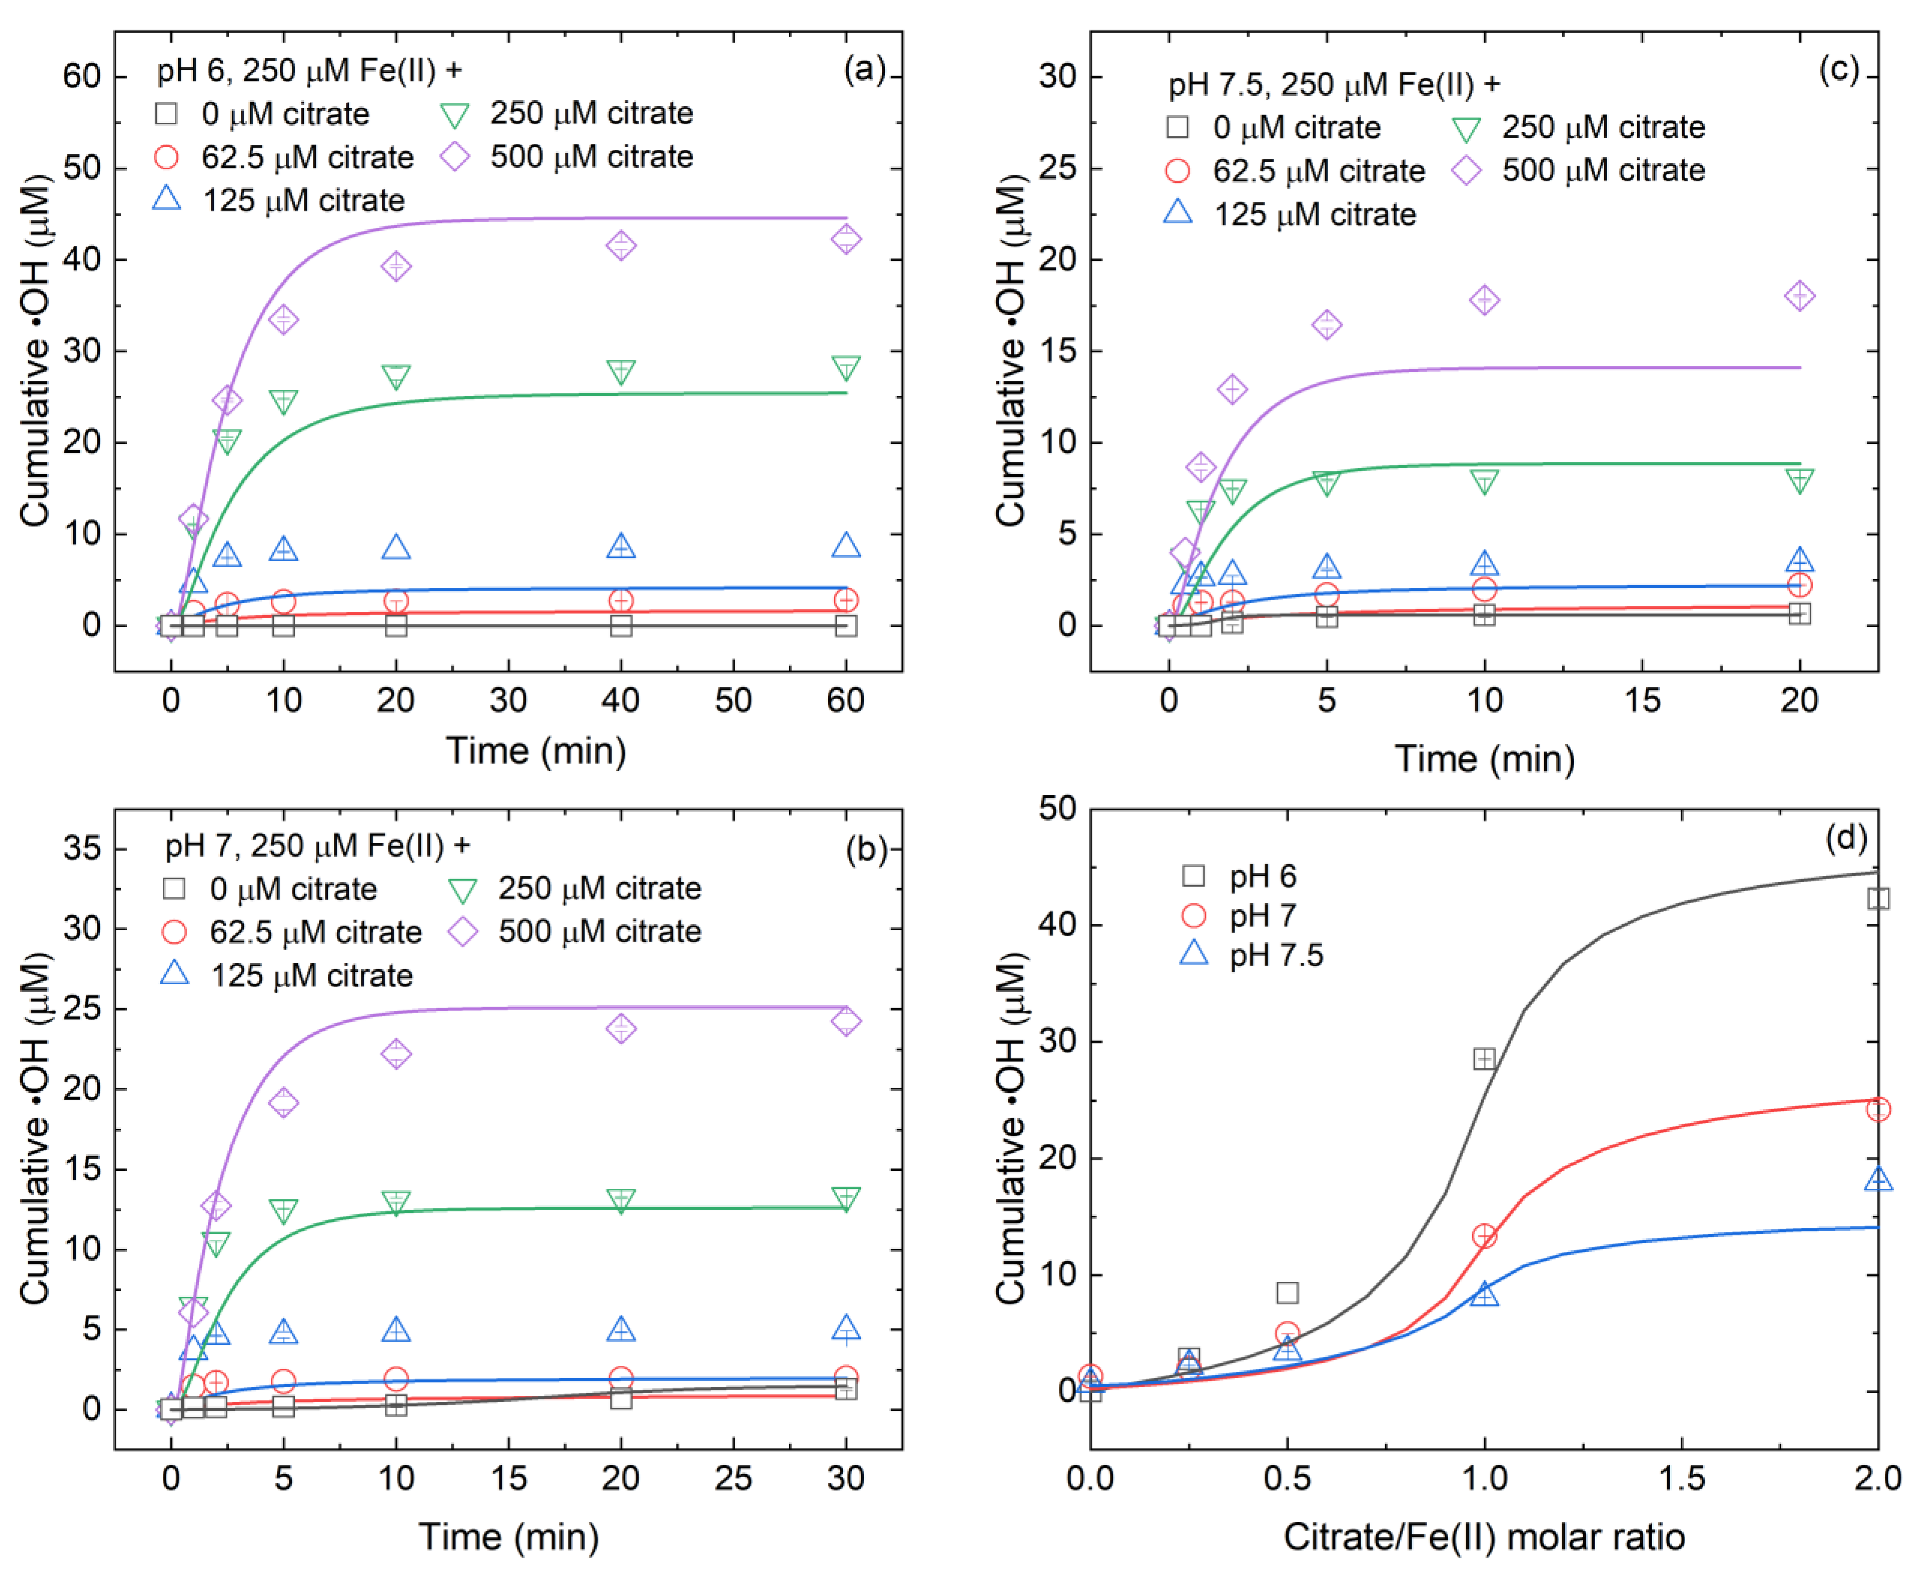
3.1. Effect of Citrate/Fe(II) Molar Ratio on •OH Production during Fe(II)-Catalyzed O2 Oxidation Process

For oxygenation of 250 μM inorganic Fe(II)dis in the absence of citrate, the concentrations of cumulative •OH were always below the detection limit at pH 6 and gradually increased to 1.3 and 0.7 μM at pH 7 and 7.5, respectively (Figure 1a–c). When citrate was added to the above inorganic Fe(II)dis system, •OH accumulation rapidly elevated (Figure 1a–c). For instance, for oxygenation of 250 μM inorganic Fe(II)dis in the presence of 250 μM citrate, •OH accumulation reached 28.5 (>47.5-fold), 13.3 (~10.2-fold) and 8.1 (~11.6-fold) μM for pH 6, 7 and 7.5, respectively (Figure 1), which were much higher than those in the inorganic Fe(II)dis system. The enhancement of citrate on •OH production was in agreement with previous observations [16,18,19,21], which further supported the conclusion that the addition of ligands can effectively reinforce •OH production from Fe(II) oxidation by O2.
As shown in Figure 1d, the enhancement of citrate on •OH production was highly dependent on citrate/Fe(II) molar ratio and solution pH. At pH 6, the cumulative •OH increased from 2.8 to 8.5 μM (~3.0-fold) with increasing citrate/Fe(II) molar ratio from 0.25 to 0.5 (Figure 1d) and increased from 8.5 to 28.5 μM (~3.3-fold) with increasing citrate/Fe(II) molar ratio from 0.5 to 1 (Figure 1d). When the citrate/Fe(II) molar ratio further increased to 2, the cumulative •OH increased to 42.3 μM (~1.5-fold) (Figure 1d). At pH 7, the cumulative •OH increased from 2.0 to 4.9 μM (~2.5-fold) with increasing citrate/Fe(II) molar ratio from 0.25 to 0.5 (Figure 1d) and increased from 4.9 to 13.3 μM (~2.7-fold) with increasing citrate/Fe(II) molar ratio from 0.5 to 1 (Figure 1d). When the citrate/Fe(II) molar ratio further increased to 2, the cumulative •OH increased to 24.2 μM (~1.8-fold) (Figure 1d). At pH 7.5, the cumulative •OH increased from 2.2 to 3.4 μM (~1.5-fold) with increasing citrate/Fe(II) molar ratio from 0.25 to 0.5 (Figure 1d) and increased from 3.4 to 8.1 μM (~2.4-fold) with increasing citrate/Fe(II) molar ratio from 0.5 to 1 (Figure 1d). When the citrate/Fe(II) molar ratio further increased to 2, the cumulative •OH increased to 18.0 μM (~2.2-fold) (Figure 1d). The increased folds on •OH accumulation suggests that a moderate citrate/Fe(II) molar ratio can result in a more significant increase in •OH production.

3.2. Effect of Citrate/Fe(II) Molar Ratio on •OH Yield during Fe(II)-Catalyzed H2O2 Oxidation Process

Similar to the Fe(II)-catalyzed O2 oxidation process, the presence of citrate also facilitated •OH production during the Fe(II)-catalyzed H2O2 oxidation process (Figure 2a–c). For instance, for the oxidation of 250 μM Fe(II) by 100 μM H2O2 at pH 7, the •OH accumulation increased from 1.5 to 28.7 μM (~19.1-fold) when the citrate concentration increased from 0 to 500 μM (Figure 2b). Because •OH accumulation increased linearly with increasing H2O2 concentration at a given solution pH and an initial Fe(II)dis dosage, the yield of •OH relative to H2O2 decomposition can be derived from the slope of the linear fitting. Figure 2d shows that the •OH yield depended on citrate/Fe(II) molar ratio and solution pH and this dependence can also be divided into three subsections. At pH 6, the •OH yield increased from 6.3% to 7.6% (~1.2-fold) with increasing citrate/Fe(II) molar ratio from 0.25 to 0.5 and increased from 7.6% to 26.0% (~3.4-fold) with increasing citrate/Fe(II) molar ratio from 0.5 to 1 (Table 2). When the citrate/Fe(II) molar ratio further increased to 2, the •OH yield increased to 52.2% (~2-fold) (Table 2). At pH 7, the •OH yield increased from 2.9% to 4.5% (~1.6-fold) with increasing citrate/Fe(II) molar ratio from 0.25 to 0.5 and increased from 4.5% to 12.8% (~2.8-fold) with increasing citrate/Fe(II) molar ratio from 0.5 to 1 (Table 2). When the citrate/Fe(II) molar ratio further increased to 2, the •OH yield increased to 31.5% (~2.5-fold) (Table 2). At pH 7.5, the •OH yield increased from 2.9% to 3.7% (~1.3-fold) with increasing citrate/Fe(II) molar ratio from 0.25 to 0.5 and increased from 3.7% to 9.1% (~2.5-fold) with increasing citrate/Fe(II) molar ratio from 0.5 to 1 (Table 2). When citrate/Fe(II) molar ratio further increased to 2, the •OH yield increased to 17.6% (~1.9-fold) (Table 2). These results indicate that a moderate citrate/Fe(II) molar ratio was more beneficial to the increase in •OH yield from H2O2 decomposition.
Previous studies have reported that •OH yield from H2O2 decomposition by inorganic Fe(II)dis at pH 7 was 1.5–1.6% [18,40], close to our measured value of 1.8% (Table 2). In the presence of citrate, a previous study reported that the •OH yield from H2O2 decomposition by Fe(II)dis at pH 7 was 10% when the molar ratio of citrate/Fe(II) was 1 [18], which was also roughly consistent with the result of this study (12.8%, Table 2). At fixed Fe(II) and citrate concentrations, •OH yield decreased with increasing the solution pH from 6 to 7.5 (Table 2), which was in line with the previous observation that acidic pH conditions favored •OH production but alkaline pH was unfavorable [12]. Therefore, under similar conditions, our measurements are comparable with previous studies.

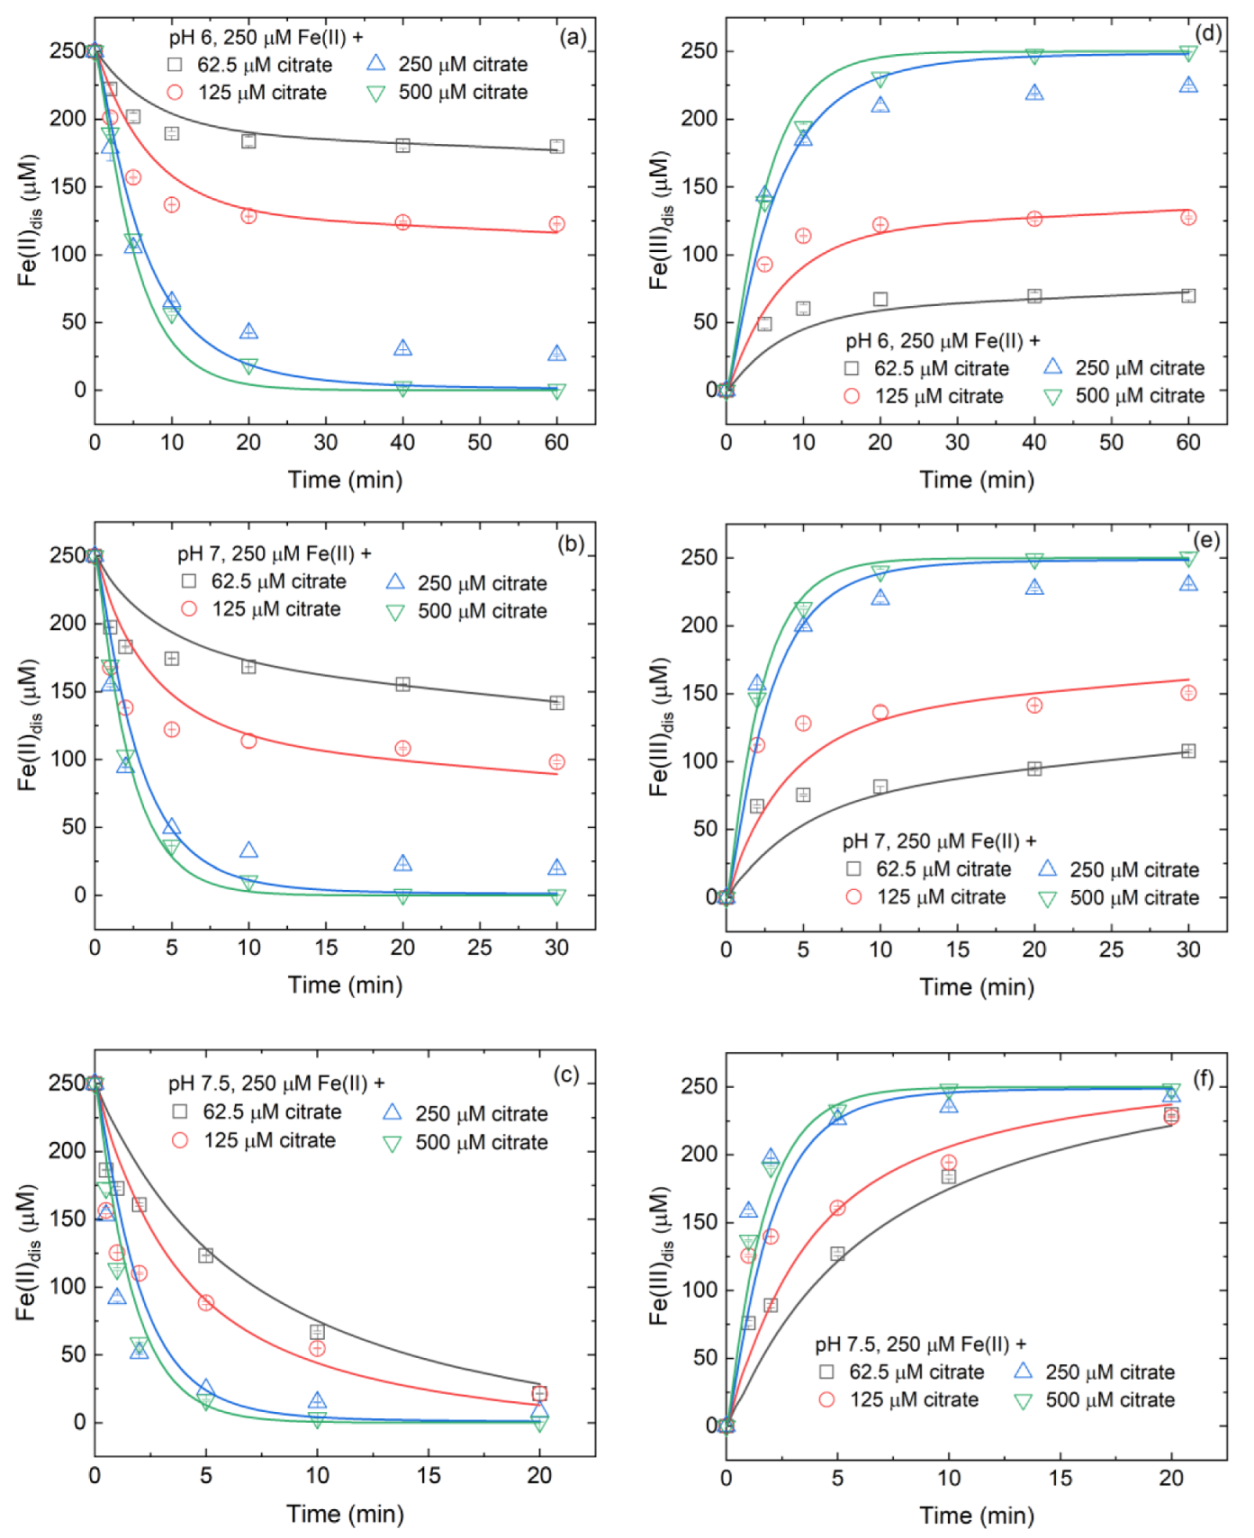
3.3. Variation of Fe(II)/Fe(III) Species at Different Citrate/Fe(II) Ratios during Oxidation Process

Since Fe(II) is the main electron source for •OH production in Fe(II)-citrate systems [18], the variations of Fe(II)dis and Fe(III)dis during oxygenation were measured. In the absence of citrate, the inorganic Fe(II)dis concentrations within 20–60 min varied by <5%, 98% and 99% at pH 6, 7 and 7.5, respectively (Figure S1). Inorganic Fe(III)dis was not measured, but abundant Fe(III) precipitates (>0.22 μm) were generated (Figure S2). XRD analysis shows that lepidocrocite was the main mineral phase of Fe(III) precipitates (Figure S3). However, the addition of citrate remarkably changed the processes of Fe(II)dis oxidation and Fe(III)dis precipitate (Figure 3). At pH 6, the presence of citrate significantly accelerated Fe(II) oxidation and the oxidation rate increased with increasing citrate/Fe(II) molar ratio (Figure 3a). At pH 7, the presence of citrate accelerated Fe(II)dis oxidation only at the initial stage, i.e., there was no lag of Fe(II) oxidation within the initial 10 min, while it inhibited Fe(II)dis oxidation at the last stage (Figure 3b). At pH 7.5, the addition of citrate inhibited Fe(II)dis oxidation (Figure 3c). At pH 7 and 7.5, the inhibition of citrate on Fe(II) oxidation decreased with an increasing citrate/Fe(II) molar ratio. The influence of citrate on Fe(II) oxidation was related to the formation and oxidation of complexed Fe(II)/Fe(III) species (for details, see Section S3). In addition to Fe(II)dis oxidation, the presence of citrate also had a great influence on the hydrolysis and precipitate of Fe(III)dis. At pH 6–7.5, no Fe(III) precipitate (<1 μM) was detected in Fe(II)dis-citrate system (Figure 3d–f), which was opposite to the observation in the inorganic Fe(II)dis system (Figure S1). Results of Figure S3 show that Fe(III)dis was mainly (>90%) in colloidal form (1–220 nm), while the fraction of true Fe(III)dis (<1 nm) was less than 10%. Because Fe(II) oxidation by H2O2 is rapid and not easily sampled, the kinetics of Fe(II) oxidation and Fe(III)dis precipitate during the Fe(II)-catalyzed H2O2 oxidation process were not experimentally measured in this study.

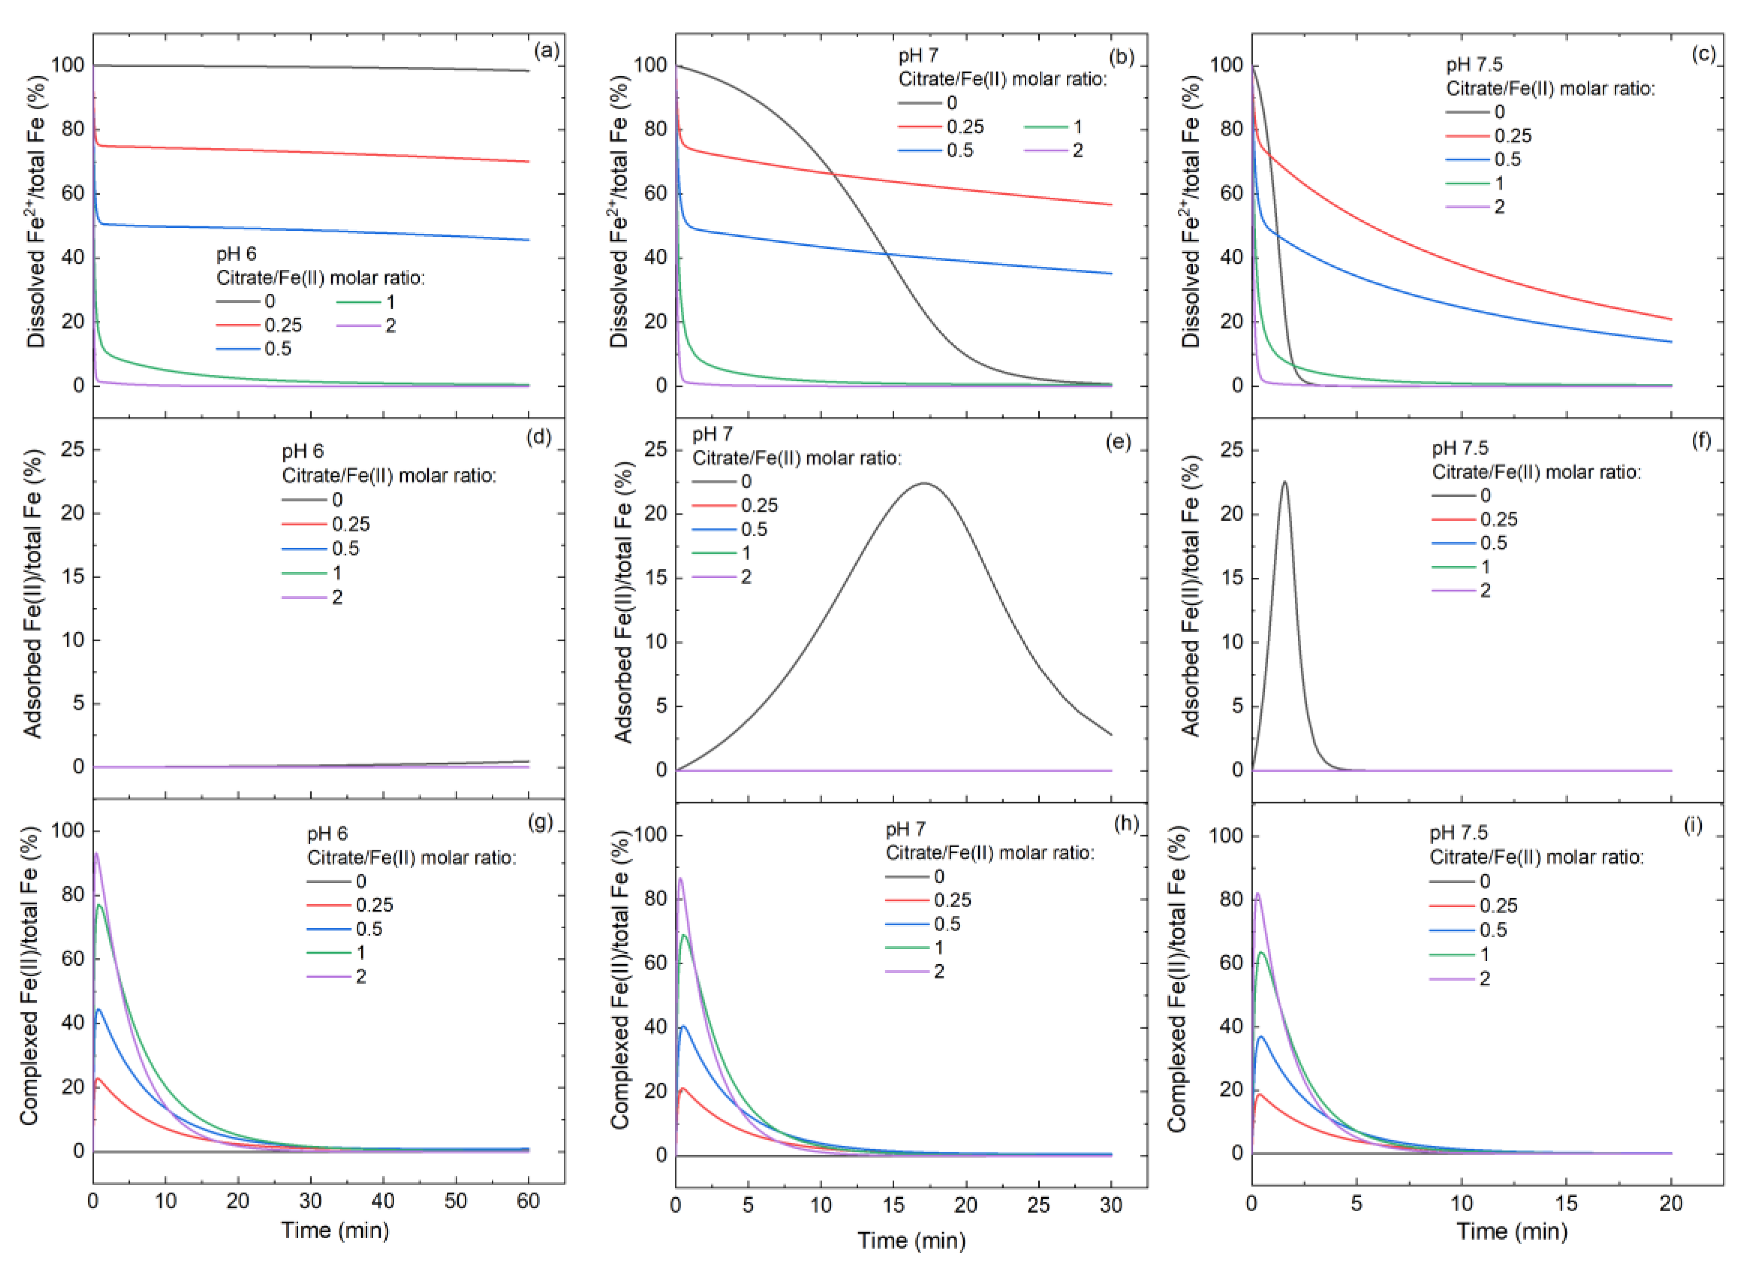
3.4. Controlling Mechanisms of Citrate/Fe(II) Molar Ratio on •OH Production

Based on the above mentioned, a kinetic model was developed to describe •OH production and Fe(II)/Fe(III) transformation during Fe(II)-catalyzed O2 and H2O2 oxidation processes (Table 1). As shown in Figure 1, Figure 3 and Figure S1, the model-predicted time trajectories of Fe(II)dis, Fe(III)dis and •OH were in general agreement with the observed trends. Hence, the reactions in Table 1 can be used to describe the most important reactions in inorganic Fe(II)dis and Fe(II)-citrate systems. Besides, the assumptions made in this study are reasonable and their influence on modeling results could be ignored.
To assess the relative importance of each reaction on •OH production during Fe(II)-catalyzed O2 and H2O2 oxidation processes, the matrices of normalized sensitivity coefficients (NSCs) at different reaction times in inorganic Fe(II)dis and Fe(II)-citrate systems were calculated (Figure 4). The positive NSC values mean that reactions produce •OH, whereas the negative NSC values mean that reactions consume •OH. For the oxygenation of Fe(II)dis by O2, in the absence of citrate, reactions A1 and A10 yielded the largest positive NSC values (Figure 4a), which confirmed the contribution of the oxidation of inorganic Fe(II)dis and Fe(II)ad to •OH production. However, in the presence of citrate, the decomposition of H2O2 by citrate complexed Fe(II) (reaction C7) changed, becoming the most important reaction on •OH production given the largest positive NSC value (Figure 4b). In comparison, the reaction of H2O2 with an inorganic Fe(II)dis (reaction A3) generated the negative NSC value (Figure 4b). In other words, reaction A3 was a consumer of •OH. This may be unexpected given that reaction A3 can generate •OH. The explanation is that when H2O2 is decomposed by inorganic Fe(II)dis, less H2O2 can react with citrate complexed Fe(II), while the latter can produce more •OH (Table 1). In addition, the oxidation of Fe(II)-citrate complex (reaction C5) yielded a negative NSC value (Figure 4b), which may be explained by the fact that when the Fe(II)-citrate complex was oxidized by O2, less Fe(II)-citrate complex can react with H2O2 to generate •OH. Hence, Fe(II)-citrate complex is the main electron contributor for •OH production in the presence of citrate. For the oxidation of Fe(II)dis by H2O2, the reactions C1 and C7 also generated the largest positive NSC values (Figure 4d), indicating that the oxidation of Fe(II)-citrate complex by H2O2 mainly contributed to •OH production in the presence of citrate.
To obtain further insight into the influence of citrate/Fe(II) molar ratio on Fe(II) species, the speciation calculation and kinetic models were executed at pH 6–7.5. Before oxidation, the fractions of Fe(II)-citrate in total Fe(II) were 24.2–49.6%, 48.3–94.2% and 88.8–99.6% at low (0.25–0.5), moderate (0.5–1) and high (1–2) citrate/Fe(II) molar ratios, respectively (Figure S4). During the oxidation process, the citrate complexed Fe(II) accounted for 18.7–44.5%, 37.0–77.2% and 63.6–93.1% of total Fe of oxygenation at low (0.25–0.5), moderate (0.5–1) and high (1–2) citrate/Fe(II) molar ratios (Figure 5g–i), respectively. Accordingly, the fractions of inorganic Fe2+ and adsorbed Fe(II) to total Fe of oxygenation decreased in the presence of citrate (Figure 5a–f). The increase of the fractions of Fe(II)-citrate complex with increasing citrate/Fe(II) molar ratio is in line with the observation that the high citrate/Fe(II) molar ratio was beneficial to •OH production (Figure 1 and Figure 2).
In summary, the influence of citrate/Fe(II) molar ratio on •OH production during Fe(II)-catalyzed O2 and H2O2 oxidation processes can be ascribed to the change of Fe(II)/Fe(III) speciation. In the absence of citrate, inorganic Fe(II)dis and adsorbed Fe(II) contributed to •OH production. In the presence of citrate, the adsorbed Fe(II) became negligible because Fe(III) precipitates were hindered. Therefore, inorganic Fe(II)dis and Fe(II)-citrate complex contributed collectively to •OH production. At a low citrate/Fe(II) molar ratio (<0.5), inorganic Fe(II)dis mainly contributed to •OH production, followed by Fe(II)-citrate complex. At a high citrate/Fe(II) molar ratio (1–2), Fe(II)-citrate complex mainly contributed to •OH production. As the •OH yield from H2O2 decomposition by Fe(II)-citrate complex is much higher than that by inorganic Fe(II)dis (Table 2), the net •OH production increased with increasing citrate/Fe(II) molar ratio during Fe(II)-catalyzed O2 and H2O2 oxidation processes.

3.5. Effect of Citrate/Fe(II) Molar Ratio on Phenol Degradation during Fe(II)-Catalyzed O2 Oxidation Process

The oxidative impact of •OH produced in a Fe(II)-citrate system toward environmental pollutants was evaluated using phenol as a model pollutant. In a Fe(II)-citrate (1:1) system, phenol concentration decreased 53.6% within 40 min (Figure 6a). When 100 mM 2-propanol (k2-propanol, •OH = 2 × 10⁹ M−1 s−1 [27]) was added into the above system, phenol degradation was almost completely inhibited (Figure 6a). As 2-propanol was the scavenger for •OH, the inhibition confirmed that •OH was the main oxidant for phenol degradation. To verify the applicability of the kinetic model for predicting pollutant degradation, phenol instead of benzoate (reaction B1) was added. Results showed that the model-predicted time trajectories of phenol were in accordance with the experimental observations (Figure 6a), which confirmed the applicability of the kinetic model.
Based on the kinetic model, we further assessed the influence of the citrate/Fe(II) molar ratio on phenol degradation in a Fe(II)-citrate system at pH 7. Figure 6b shows that the phenol degradation efficiency rapidly increased from 1.1% to 80.1% when the citrate/Fe(II) molar ratio increased from 0 to 1.8, while it decreased gradually to 46.2% when the citrate/Fe(II) molar ratio reached 8. The dependence between phenol degradation efficiency and citrate/Fe(II) molar ratio may be explained by the fact that citrate can effectively facilitate •OH production from inorganic Fe(II)dis oxidation (Figure 1) but also competed with phenol to consume •OH. A moderate molar ratio of citrate to Fe(II) was more favorable for phenol degradation during the Fe(II)-catalyzed O2 oxidation process.

4. Conclusions

This study investigated the influence of citrate/Fe(II) molar ratio on •OH production and the related environmental impacts during Fe(II)-catalyzed O2 and H2O2 oxidation processes. Results highlighted that the citrate/Fe(II) molar ratio controlled •OH production. In the absence of citrate, •OH is mainly produced from the oxidation of inorganic Fe(II)dis and Fe(II)ad by O2 and H2O2. Because the •OH yield from H2O2 decomposition by inorganic Fe(II)dis and Fe(II)ad was relatively low, •OH production was negligible. In the presence of citrate, the complexation of citrate resulted in the formation of Fe(II)-citrate complex, which can effectively decompose H2O2 to produce •OH. Hence, the addition of citrate significantly enhanced •OH production during Fe(II)-catalyzed O2 and H2O2 oxidation processes at pH 6–7.5. The variation of citrate/Fe(II) molar ratio changed Fe(II)/Fe(III) speciation and the fraction of Fe(II)-citrate complex, thereby affecting •OH production. With the increase of citrate/Fe(II) molar ratio, the fraction of Fe(II)-citrate complex increased, so •OH accumulation increased. However, for pollutant removal, a high concentration of citrate can also compete with the pollutant to consume •OH, thus weakening pollutant removal efficiency. Therefore, an appropriate ligand/Fe(II) molar ratio is crucial to achieve ligand-enhanced pollutant removal in the remediation of contaminated soil and groundwater.

Supplementary Materials

The following supporting information can be downloaded at: https://www.mdpi.com/article/10.3390/ijerph191912977/s1, Section S1: Descriptions of reactions and associated rate constants for kinetic modeling; Section S2 Influence of citrate/Fe(II) molar ratio on •OH production from H2O2 decomposition; Section S3 Influence of citrate on Fe(II) oxidation and Fe(III)dis precipitate; Figure S1. Effects of solution pH on (a) inorganic Fe(II)dis, (b) inorganic Fe(III)dis and (c) solid Fe(III) production during oxidation; Figure S2. XRD patterns of Fe(III) precipitates; Figure S3. Percentage of Fe(III) concentration in different size fractions as a function of solution pH and citrate dosage; Figure S4. (a–c) Fe(II) and (d–f) Fe(III) species speciation distribution as a function of the molar ratio of citrate to Fe(II)/Fe(III). References [41,42,43,44,45] are cited in Supplementary Materials.

Author Contributions

Conceptualization, S.Y. and P.Z.; methodology, B.H. and P.Z.; software, B.H. and P.Z.; validation, B.H., P.Z., H.L. and S.Y.; formal analysis, B.H.; investigation, B.H.; resources, S.Y.; data curation, B.H.; writing—original draft preparation, B.H.; writing—review and editing, B.H., P.Z., H.L. and S.Y.; visualization, B.H.; supervision, S.Y.; project administration, S.Y.; funding acquisition, H.L. and S.Y. All authors have read and agreed to the published version of the manuscript.

Funding

This work was supported by the National Natural Science Foundation of China (NSFC, No. 41830862, 42025703).

Institutional Review Board Statement

Not applicable.

Informed Consent Statement

Not applicable.

Data Availability Statement

The data will be available on request.

Conflicts of Interest

The authors declare no conflict of interest.

References

  1. Huang, J.; Jones, A.; Waite, T.D.; Chen, Y.; Huang, X.; Rosso, K.M.; Kappler, A.; Mansor, M.; Tratnyek, P.G.; Zhang, H. Fe(II) redox chemistry in the environment. Chem. Rev. 2021, 121, 8161–8233. [Google Scholar] [CrossRef]
  2. Zhou, Q.; Ma, S.; Zhan, S. Superior photocatalytic disinfection effect of Ag-3D ordered mesoporous CeO2 under visible light. Appl. Catal. B Environ. 2018, 224, 27–37. [Google Scholar] [CrossRef]
  3. Tsydenova, O.; Batoev, V.; Batoeva, A. Solar-enhanced advanced oxidation processes for water treatment: Simultaneous removal of pathogens and chemical pollutants. Int. J. Environ. Res. Public Health 2015, 12, 9542–9561. [Google Scholar] [CrossRef] [PubMed] [Green Version]
  4. Aseev, D.; Batoeva, A.; Sizykh, M.; Olennikov, D.; Matafonova, G. Degradation of bisphenol A in an aqueous solution by a photo-Fenton-like process using a UV KrCl excilamp. Int. J. Environ. Res. Public Health 2021, 18, 1152. [Google Scholar] [CrossRef] [PubMed]
  5. Liu, X.; Yuan, S.; Tong, M.; Liu, D. Oxidation of trichloroethylene by the hydroxyl radicals produced from oxygenation of reduced nontronite. Water Res. 2017, 113, 72–79. [Google Scholar] [CrossRef] [PubMed] [Green Version]
  6. Schaefer, C.E.; Ho, P.; Berns, E.; Werth, C. Mechanisms for abiotic dechlorination of trichloroethene by ferrous minerals under oxic and anoxic conditions in natural sediments. Environ. Sci. Technol. 2018, 52, 13747–13755. [Google Scholar] [CrossRef]
  7. Tong, M.; Yuan, S.; Ma, S.; Jin, M.; Liu, D.; Cheng, D.; Liu, X.; Gan, Y.; Wang, Y. Production of abundant hydroxyl radicals from oxygenation of subsurface sediments. Environ. Sci. Technol. 2016, 50, 214–221. [Google Scholar] [CrossRef]
  8. Chen, N.; Huang, D.; Liu, G.; Chu, L.; Fang, G.; Zhu, C.; Zhou, D.; Gao, J. Active iron species driven hydroxyl radicals formation in oxygenation of different paddy soils: Implications to polycyclic aromatic hydrocarbons degradation. Water Res. 2021, 203, 117484. [Google Scholar] [CrossRef] [PubMed]
  9. Xie, W.; Yuan, S.; Tong, M.; Ma, S.; Liao, W.; Zhang, N.; Chen, C. Contaminant degradation by •OH during sediment oxygenation: Dependence on Fe(II) species. Environ. Sci. Technol. 2020, 54, 2975–2984. [Google Scholar] [CrossRef]
  10. Cheng, D.; Neumann, A.; Yuan, S.H.; Liao, W.J.; Qian, A. Oxidative degradation of organic contaminants by FeS in the presence of O2. Environ. Sci. Technol. 2020, 54, 4091–4101. [Google Scholar] [CrossRef] [PubMed]
  11. Zhang, Y.; Zhou, M. A critical review of the application of chelating agents to enable Fenton and Fenton-like reactions at high pH values. J. Hazard. Mater. 2019, 362, 436–450. [Google Scholar] [CrossRef] [PubMed]
  12. Remucal, C.K.; Sedlak, D.L. The role of iron coordination in the production of reactive oxidants from ferrous iron oxidation by oxygen and hydrogen peroxide. In Aquatic Redox Chemistry; ACS Publications: Washington, DC, USA, 2011; pp. 177–197. [Google Scholar]
  13. Cheng, D.; Yuan, S.; Liao, P.; Zhang, P. Oxidizing impact induced by mackinawite (FeS) nanoparticles at oxic conditions due to production of hydroxyl radicals. Environ. Sci. Technol. 2016, 50, 11646–11653. [Google Scholar] [CrossRef] [PubMed]
  14. Zhu, J.; Zhang, P.; Yuan, S.; Liao, P.; Qian, A.; Liu, X.; Tong, M.; Li, L. Production of Hydroxyl radicals from oxygenation of simulated AMD due to CaCO3-induced pH increase. Water Res. 2017, 111, 118–126. [Google Scholar] [CrossRef]
  15. Liu, X.X.; Yuan, S.H.; Zhang, P.; Zhu, J.; Tong, M. Reduced nontronite-activated H2O2 for contaminants degradation: The beneficial role of clayed fractions in ISCO treatments. J. Hazard. Mater. 2020, 386, 121945. [Google Scholar] [CrossRef]
  16. Xie, W.; Zhang, P.; Liao, W.; Tong, M.; Yuan, S. Ligand-enhanced electron utilization for trichloroethylene degradation by •OH during sediment oxygenation. Environ. Sci. Technol. 2021, 55, 7044–7051. [Google Scholar] [CrossRef]
  17. Keenan, C.R.; Sedlak, D.L. Ligand-enhanced reactive oxidant generation by nanoparticulate zero-valent iron and oxygen. Environ. Sci. Technol. 2008, 42, 6936–6941. [Google Scholar] [CrossRef] [PubMed] [Green Version]
  18. Zhang, P.; Yuan, S. Production of hydroxyl radicals from abiotic oxidation of pyrite by oxygen under circumneutral conditions in the presence of low-molecular-weight organic acids. Geochim. Cosmochim. Acta 2017, 218, 153–166. [Google Scholar] [CrossRef]
  19. Zeng, Q.; Dong, H.; Wang, X. Effect of ligands on the production of oxidants from oxygenation of reduced Fe-bearing clay mineral nontronite. Geochim. Cosmochim. Acta 2019, 251, 136–156. [Google Scholar] [CrossRef]
  20. Lewis, S.; Lynch, A.; Bachas, L.; Hampson, S.; Ormsbee, L.; Bhattacharyya, D. Chelate-modified Fenton reaction for the degradation of trichloroethylene in aqueous and two-phase systems. Environ. Eng. Sci. 2009, 26, 849–859. [Google Scholar] [CrossRef] [PubMed]
  21. Miller, C.J.; Rose, A.L.; Waite, T.D. Importance of iron complexation for Fenton-mediated hydroxyl radical production at circumneutral pH. Front. Mar. Sci. 2016, 3, 134. [Google Scholar] [CrossRef]
  22. Miller, C.J.; Rose, A.L.; Waite, T.D. Hydroxyl radical production by H2O2-mediated oxidation of Fe(II) complexed by Suwannee River fulvic acid under circumneutral freshwater conditions. Environ. Sci. Technol. 2013, 47, 829–835. [Google Scholar] [CrossRef] [PubMed]
  23. Lee, J.; Kim, J.; Choi, W. Oxidation of aquatic pollutants by ferrous-oxalate complexes under dark aerobic conditions. J. Hazard. Mater. 2014, 274, 79–86. [Google Scholar] [CrossRef] [PubMed]
  24. Jones, A.M.; Griffin, P.J.; Waite, T.D. Ferrous iron oxidation by molecular oxygen under acidic conditions: The effect of citrate, EDTA and fulvic acid. Geochim. Cosmochim. Acta 2015, 160, 117–131. [Google Scholar] [CrossRef]
  25. Mopper, K.; Zhou, X.L. Hydroxyl radical photoproduction in the sea and its potential impact on marine processes. Science 1990, 250, 661–664. [Google Scholar] [CrossRef]
  26. Joo, S.H.; Feitz, A.J.; Sedlak, D.L.; Waite, T.D. Quantification of the oxidizing capacity of nanoparticulate zero-valent iron. Environ. Sci. Technol. 2005, 39, 1263–1268. [Google Scholar] [CrossRef]
  27. Buxton, G.V.; Greenstock, C.L.; Helman, W.P.; Ross, A.B. Critical-review of rate constants for reactions of hydrated electrons, hydrogen-atoms and hydroxyl radicals (•OH/•O) in aqueous-solution. J. Phys. Chem. Ref. Data 1988, 17, 513–886. [Google Scholar] [CrossRef] [Green Version]
  28. Zhang, P.; Yuan, S.; Liao, P. Mechanisms of hydroxyl radical production from abiotic oxidation of pyrite under acidic conditions. Geochim. Cosmochim. Acta 2016, 172, 444–457. [Google Scholar] [CrossRef]
  29. Viollier, E.; Inglett, P.; Hunter, K.; Roychoudhury, A.; Van Cappellen, P. The ferrozine method revisited: Fe(II)/Fe(III) determination in natural waters. Appl. Geochem. 2000, 15, 785–790. [Google Scholar] [CrossRef]
  30. Ianni, J.C. Kintecus. Windows Version 6.51. 2018. Available online: www.kintecus.com (accessed on 10 July 2022).
  31. Rose, A.L.; Waite, T.D. Kinetic model for Fe(II) oxidation in seawater in the absence and presence of natural organic matter. Environ. Sci. Technol. 2002, 36, 433–444. [Google Scholar] [CrossRef]
  32. Pham, A.N.; Waite, T.D. Oxygenation of Fe(II) in natural waters revisited: Kinetic modeling approaches, rate constant estimation and the importance of various reaction pathways. Geochim. Cosmochim. Acta 2008, 72, 3616–3630. [Google Scholar] [CrossRef]
  33. Pham, A.N.; Rose, A.L.; Feitz, A.J.; Waite, T.D. Kinetics of Fe(III) precipitation in aqueous solutions at pH 6.0–9.5 and 25 °C. Geochim. Cosmochim. Acta 2006, 70, 640–650. [Google Scholar] [CrossRef]
  34. Kinsela, A.S.; Jones, A.M.; Bligh, M.W.; Pham, A.N.; Collins, R.N.; Harrison, J.J.; Wilsher, K.L.; Payne, T.E.; Waite, T.D. Influence of dissolved silicate on rates of Fe(II) oxidation. Environ. Sci. Technol. 2016, 50, 11663–11671. [Google Scholar] [CrossRef] [PubMed] [Green Version]
  35. Lin, S.-S.; Gurol, M.D. Catalytic decomposition of hydrogen peroxide on iron oxide: Kinetics, mechanism, and implications. Environ. Sci. Technol. 1998, 32, 1417–1423. [Google Scholar] [CrossRef]
  36. Rose, A.L.; Waite, T.D. Reduction of organically complexed ferric iron by superoxide in a simulated natural water. Environ. Sci. Technol. 2005, 39, 2645–2650. [Google Scholar] [CrossRef]
  37. Fujii, M.; Rose, A.L.; Omura, T.; Waite, T.D. Effect of Fe(II) and Fe(III) transformation kinetics on iron acquisition by a toxic strain of Microcystis aeruginosa. Environ. Sci. Technol. 2010, 44, 1980–1986. [Google Scholar] [CrossRef]
  38. Garg, S.; Rose, A.L.; Waite, T.D. Superoxide mediated reduction of organically complexed Iron(III): Comparison of non-dissociative and dissociative reduction pathways. Environ. Sci. Technol. 2007, 41, 3205–3212. [Google Scholar] [CrossRef]
  39. Gustafsson, J. Visual MINTEQ, Version 3.1 Division of Land and Water Resources; Royal Institute of Technology: Stockholm, Sweden, 2013. [Google Scholar]
  40. Qian, A.; Yuan, S.; Xie, S.; Tong, M.; Zhang, P.; Zheng, Y. Oxidizing capacity of iron electrocoagulation systems for refractory organic contaminant transformation. Environ. Sci. Technol. 2019, 53, 12629–12638. [Google Scholar] [CrossRef]
  41. Jones, A.M.; Griffin, P.J.; Collins, R.N.; Waite, T.D. Ferrous iron oxidation under acidic conditions–The effect of ferric oxide surfaces. Geochim. Cosmochim. Acta 2014, 145, 1–12. [Google Scholar] [CrossRef]
  42. King, D.W.; Lounsbury, H.A.; Millero, F.J. Rates and mechanism of Fe(II) oxidation at nanomolar total iron concentrations. Environ. Sci. Technol. 1995, 29, 818–824. [Google Scholar] [CrossRef]
  43. Tamura, H.; Kawamura, S.; Hagayama, M. Acceleration of the oxidation of Fe2+ ions by Fe(III)-oxyhydroxides. Corrosion Sci. 1980, 20, 963–971. [Google Scholar] [CrossRef]
  44. Zhang, P.; Van Cappellen, P.; Pi, K.; Yuan, S. Effects of riboflavin and desferrioxamine B on Fe(II) oxidation by O2. Fundam. Res. 2022, 2, 208–217. [Google Scholar] [CrossRef]
  45. Krishnamurti, G.; Huang, P. Influence of citrate on the kinetics of Fe(II) oxidation and the formation of iron oxyhydroxides. Clays Clay Min. 1991, 39, 28–34. [Google Scholar] [CrossRef]
Figure 1. Effects of (ac) citrate concentrations and (d) citrate/Fe(II) molar ratio on •OH production from oxygenation of inorganic Fe(II)dis. Initial conditions: variable citrate concentrations specified in panels (ac), 250 μM Fe(II)dis, 20 mM benzoate and 10 mM buffer under oxic conditions. In panel (d), the calculations were based on 250 μM Fe(II)dis, 20 mM benzoate and 0.25 mM DO. The reaction times were set to be 60, 30, and 20 min for pH 6, 7 and 7.5, respectively. Points are the experimental results and lines are the modeled curves.
Ijerph 19 12977 g001
Figure 2. Effects of (ac) citrate concentrations on •OH production from H2O2 decomposition by Fe(II)dis and (d) the relationship between •OH yield relative to H2O2 decomposition and citrate/Fe(II) molar ratio. Initial conditions: variable citrate and H2O2 concentrations specified in panels (ac), 250 μM Fe(II)dis, 20 mM benzoate and 10 mM buffer under anoxic conditions. Points are the experimental results. Lines are best fit linear regressions in panels (ac) and are the modeled curves in panel (d) (for details, see Section S2).
Ijerph 19 12977 g002
Figure 3. Effects of citrate concentrations on (ac) Fe(II)dis oxidation and (df) Fe(III)dis generation in Fe(II)-citrate system. Initial conditions: variable citrate concentrations specified in panels (af), 250 μM Fe(II)dis, 20 mM benzoate and 10 mM buffer under oxic conditions. Points are the experimental results and lines are the modeled curves.
Ijerph 19 12977 g003
Figure 4. Normalized sensitivity coefficients (NSCs) for •OH production during Fe(II)-catalyzed (a,b) O2 and (c,d) H2O2 oxidation processes. Initial calculation conditions: Fe(II)dis, citrate and DO (or H2O2) concentrations specified, 20 mM benzoate and pH 7.
Ijerph 19 12977 g004
Figure 5. Modeled fractions of (ac) dissolved Fe2+, (df) adsorbed Fe(II) and (gi) Fe(II)-citrate complex during oxygenation of Fe(II)-citrate systems. Initial conditions: 250 μM Fe(II)dis and 0.25 mM DO.
Ijerph 19 12977 g005
Figure 6. (a) Oxidation of phenol by the •OH produced in the Fe(II)-citrate system and (b) modeled variation of phenol degradation efficiency with citrate/Fe(II) molar ratio. In panel (a), the experimental conditions were based on 250 μM Fe(II)dis, 250 μM citrate and 1 mg/L phenol at pH 7; points are the experimental results and lines are the modeled curves. In panel (b), the calculations were based on 250 μM Fe(II)dis, 1 mg/L phenol, 0.25 mM DO and pH 7; citrate concentration was set based on the citrate/Fe(II) molar ratio.
Ijerph 19 12977 g006
Table 1. Reaction network of kinetic model for inorganic Fe(II)dis alone and Fe(II)dis-citrate system.
No.ReactionsRate ConstantSource
pH 6pH 7pH 7.5
Reactions in Inorganic Fe(II)dis System
A1Fe(II) + O2 → Fe(III) + •O21 × 10−3 M−1·s−11.3 × 10⁻¹
M−1·s−1
1.8
M−1·s−1
Fitting
A2Fe(II) + •O2 → Fe(III) + H2O21 × 107 M−1·s−1[31]
A3Fe(II) + H2O2 → Fe(III) + (0.052, 0.018, 0.007) •OH + OH5.5 × 101 M−1·s−14.79 × 10³ M−1·s−11.33 × 10⁴ M−1·s−1[32]
A4Fe(II) + •OH → Fe(III) + OH5 × 108 M−1·s−1[32]
A5Fe(III) + •O2 → Fe(II) + O21.5 × 108 M−1·s−1[31]
A6 aFe(III) + Fe(III) → LEP + LEP3.2 × 105 M−1·s−13.4 × 10⁶ M−1·s−15.0 × 10⁶ M−1·s−1[33]
A7 aFe(III) + LEP → LEP + LEP3.2 × 105 M−1·s−13.4 × 10⁶ M−1·s−15.0 × 10⁶ M−1·s−1[33]
A8Fe(II) + LEP → Fe(II)-LEP1.1 × 106 M−1·s−11.0 × 10⁸ M−1·s−11.0 × 10⁸ M−1·s−1[34]
A9Fe(II)-LEP → Fe(II) + LEP2.3 × 103 M−1·s−1[34]
A10Fe(II)-LEP + O2 → LEP + LEPi + •O22 M−1·s−16 M−1·s−160 M−1·s−1Fitting
A11Fe(II)-LEP + •O2 → LEP + LEPi + H2O21 × 107 M−1·s−1[31]
A12Fe(II)-LEP + H2O2 → LEP + LEPi + (0.052, 0.018, 0.007) •OH + OH5.5 × 101 M−1·s−14.79 × 10³ M−1·s−11.33 × 10⁴ M−1·s−1[32]
A13Fe(II)-LEP + •OH → LEP + LEPi + +OH5 × 108 M−1·s−1[32]
A14LEP + H2O2 → LEP + H2O + 0.5O23.1 × 10−2 M−1·s−1[35]
A15LEP + •O2 → Fe(II) + LEP + O26.5 × 10−2 M−1·s−1[36]
Trapping of •OH by benzoate
B1benzoate + •OH → HBA + •O25.9 × 109 M−1·s−1[27]
Extended reactions in Fe(II)-citrate systems
C1Fe(II) + citrate → Fe(II)-citrate5.0 × 102 M−1·s−1[37]
C2Fe(II)-citrate → Fe(II) + citrate2.0 × 10−3 s−1[37]
C3Fe(III) + citrate → Fe(III)-citrate2.1 × 105 M−1·s−1[37]
C4Fe(III)-citrate → Fe(III) + citrate1.1 × 10−4 s−1[37]
C5Fe(II)-citrate + O2 → Fe(III)-citrate + •O22.9 M−1·s−18 M−1·s−112 M−1·s−1Fitting
C6Fe(II)-citrate + •O2 → Fe(III)-citrate + H2O21 × 107 M−1·s−1[31]
C7Fe(II)-citrate + H2O2 → Fe(III)-citrate + (0.522, 0.315, 0.176) •OH + OH1.3 × 102 M−1·s−18 × 102 M−1·s−15 × 104 M−1·s−1Fitting
C8Fe(II)-citrate + •OH → Fe(III)-citrate + OH5 × 108 M−1·s−1[32]
C9Fe(III)-citrate + H2O2 → Fe(II)-citrate + •O2 + 2H+2.5 × 10⁻³ M−1·s−1[24]
C10Fe(III)-citrate + •O2 → Fe(II)-citrate + O25.6 × 102 M−1·s−1[38]
C11Fe(III)-citrate + •OH → Fe(III)-citrateox + •O21.2 × 108 M−1·s−1[21]
C12citrate + •OH → citrateox + •O25.0 × 107 M−1·s−1[27]
a LEP and LEPi represent the reactive and nonreactive lepidocrocite, respectively. Because the presence of citrate inhibited the hydrolysis and precipitate of inorganic Fe(III)dis, the formation and oxidation of Fe(II)ad (reactions A8–A13) were not included in the Fe(II)-citrate system and the rate constants of Fe(III) hydrolysis and precipitate (reactions A6–A7) were adjusted to <1 × 10³, <1 × 10³ and <1 × 10⁴ M−1 s−1 for pH 6, 7 and 7.5, respectively.
Table 2. A summary of •OH yield from H2O2 decomposition by Fe(II)dis.
Experimental ConditionsYield of •OH Relative to H2O2 DecompositionR2
pH 6250 μM Fe(II)dis5.2 ± 0.03%0.99
250 μM Fe(II)dis + 62.5 μM citrate6.3 ± 0.02%0.99
250 μM Fe(II)dis + 125 μM citrate7.6 ± 0.2%0.89
250 μM Fe(II)dis + 250 μM citrate26.0 ± 0.6%0.99
250 μM Fe(II)dis + 500 μM citrate52.2 ± 0.01%0.99
pH 7250 μM Fe(II)dis1.8 ± 0.04%0.99
250 μM Fe(II)dis + 62.5 μM citrate2.9 ± 0.01%0.99
250 μM Fe(II)dis + 125 μM citrate4.5 ± 0.4%0.97
250 μM Fe(II)dis + 250 μM citrate12.8 ± 0.3%0.99
250 μM Fe(II)dis + 500 μM citrate31.5 ± 0.5%0.99
pH 7.5250 μM Fe(II)dis0.7 ± 0.02%0.95
250 μM Fe(II)dis + 62.5 μM citrate2.9 ± 0.01%0.99
250 μM Fe(II)dis + 125 μM citrate3.7 ± 0.3%0.97
250 μM Fe(II)dis + 250 μM citrate9.1 ± 0.5%0.99
250 μM Fe(II)dis + 500 μM citrate17.6 ± 0.7%0.99
Publisher’s Note: MDPI stays neutral with regard to jurisdictional claims in published maps and institutional affiliations.

