
Analysis of the Spatial Association Network of PM2.5 and Its Influencing Factors in China


Abstract
:1. Introduction
- (1)
- This paper took 31 Chinese provinces as its research objects and explored the association network structure of PM2.5 among the provinces from a more macroscopic perspective, providing a new idea for research on collaborative PM2.5 governance.
- (2)
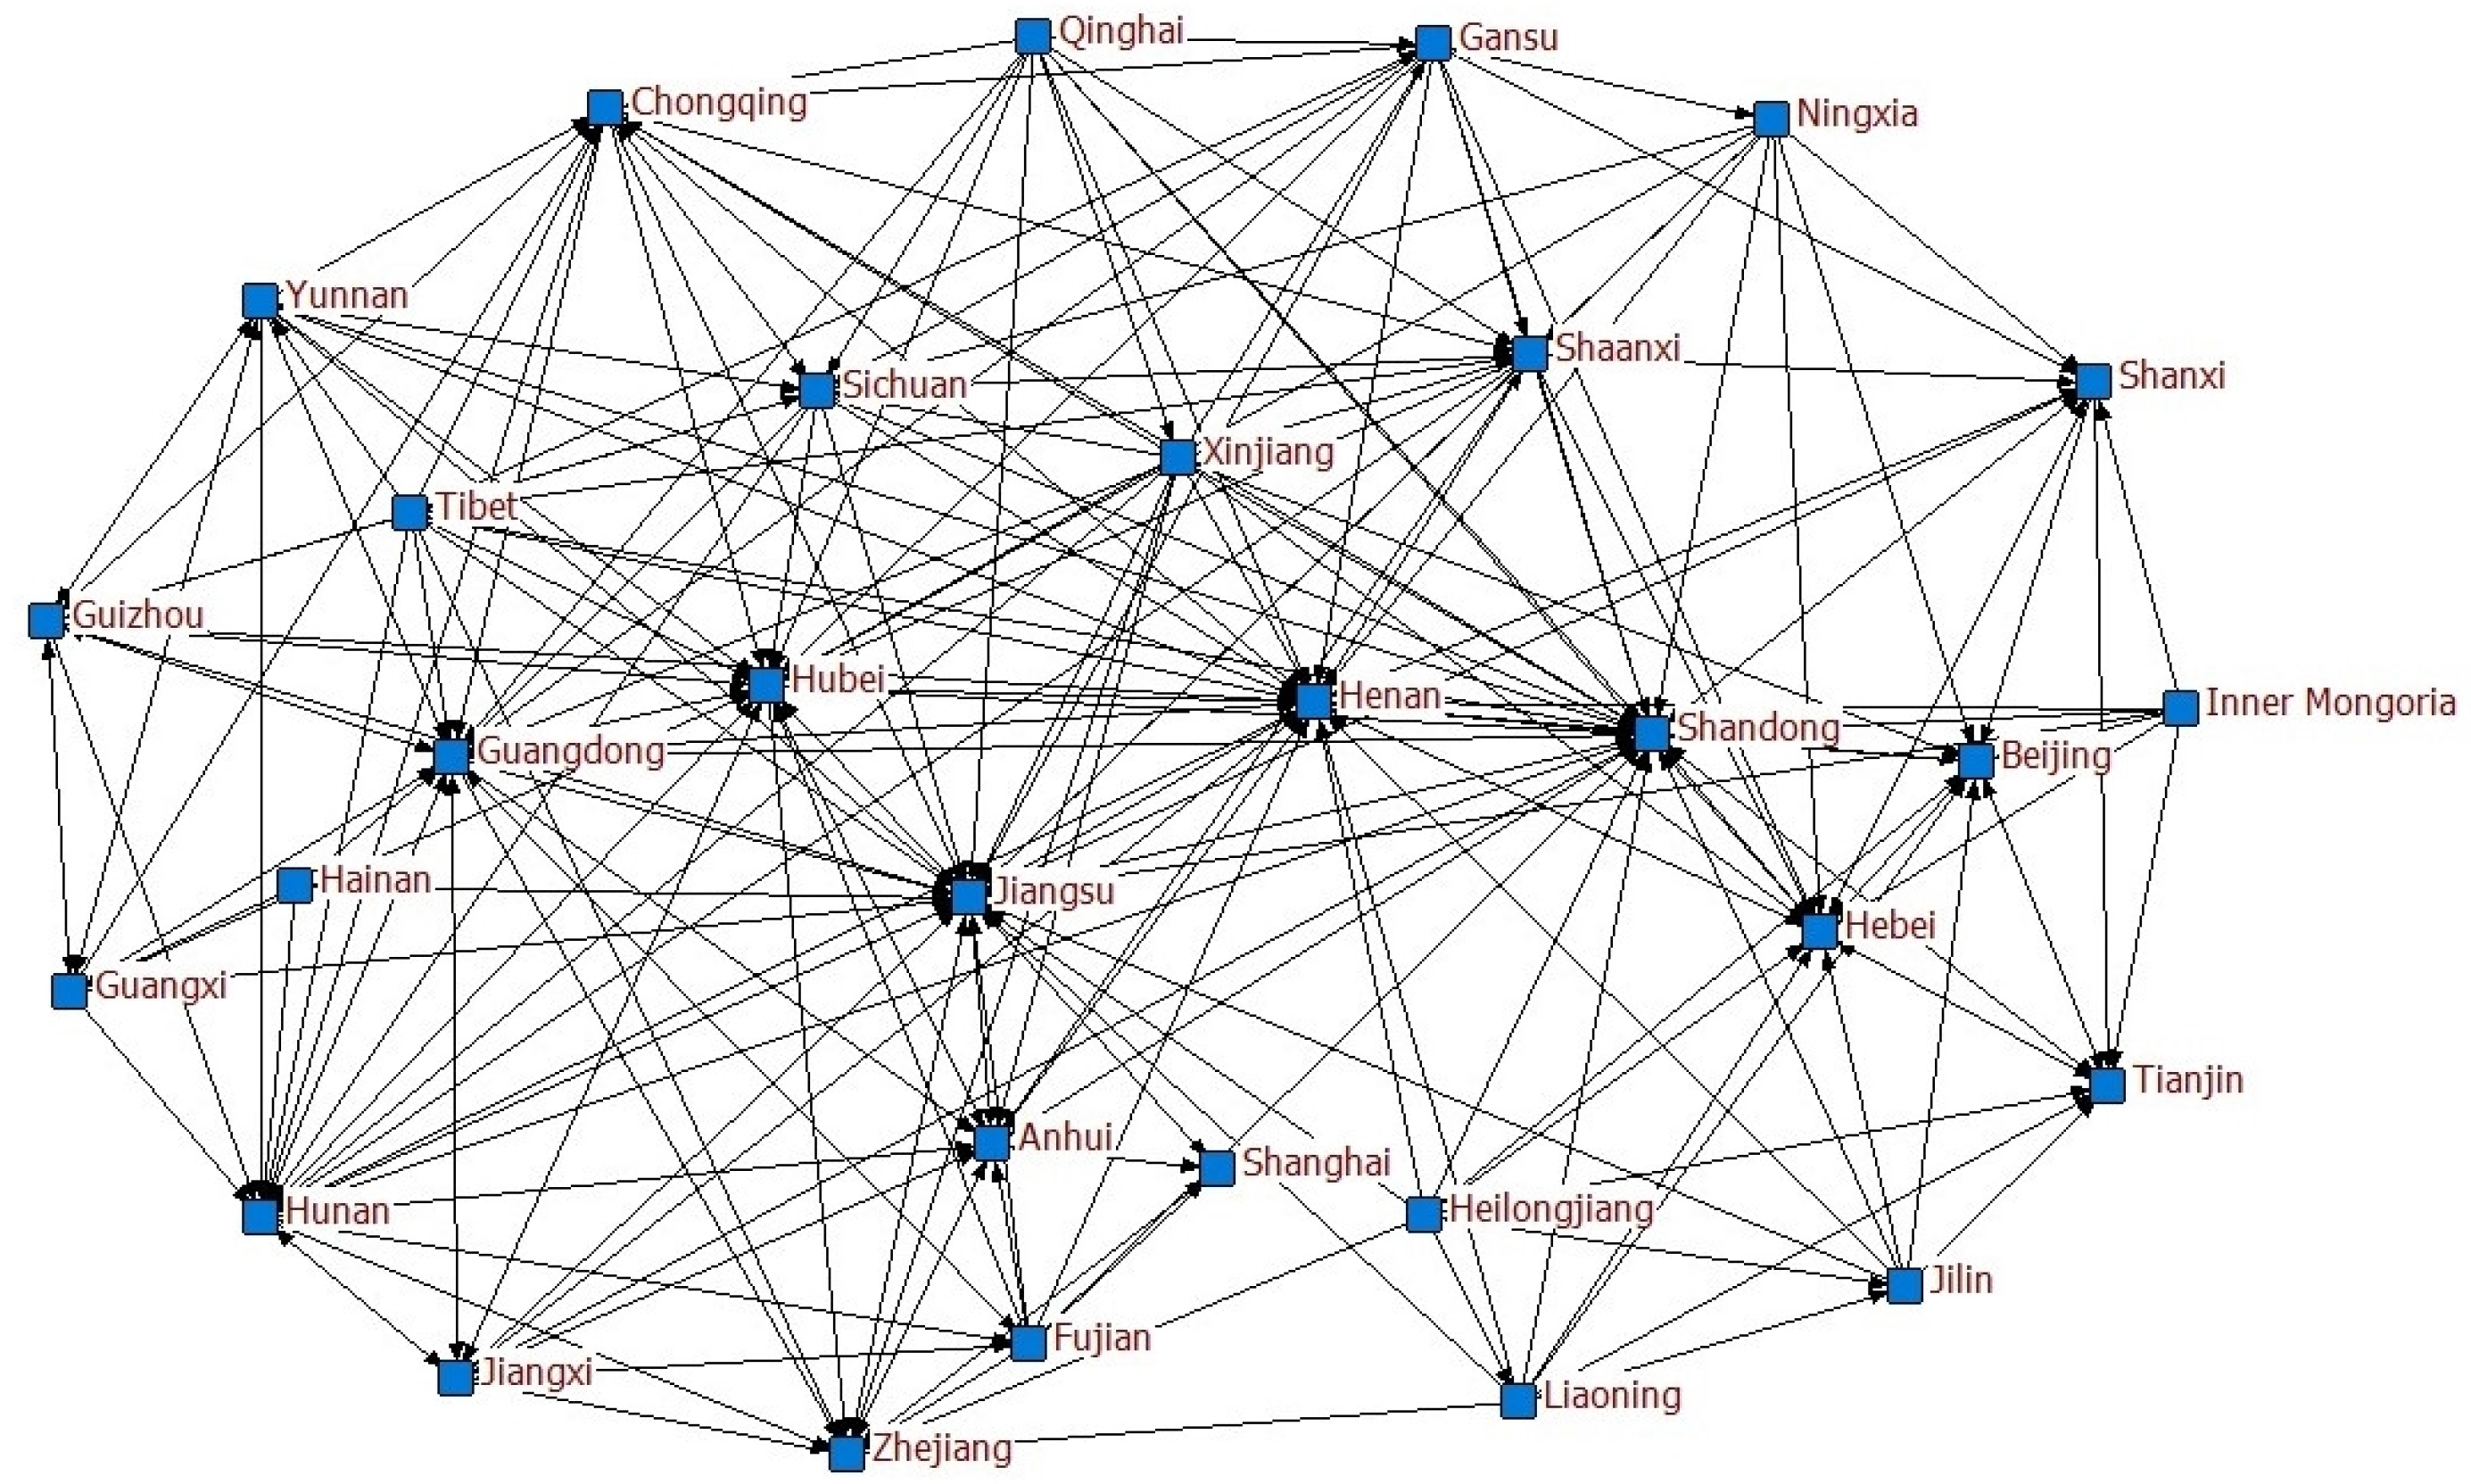
- An improved gravity model was applied to identify the spatial association network of PM2.5 among the 31 provinces, and the structural patterns of the network were identified. The characteristics of the network were analyzed in detail at three levels, i.e., the overall, individual, and subgroup levels, which revealed the role played by each region in the network.
- (3)
- The block model was used to reveal the spatial clustering of PM2.5 and the influencing factors of the network were empirically examined.
2. Materials and Methods
2.1. Improved Gravitational Model
2.2. Indicators of the Spatial Association Network
2.2.1. Overall Network Characteristics
2.2.2. Individual Network Characteristics
2.2.3. Spatial Clustering Analysis
2.2.4. QAP Analysis
2.3. Data Sources
3. Results and Discussion
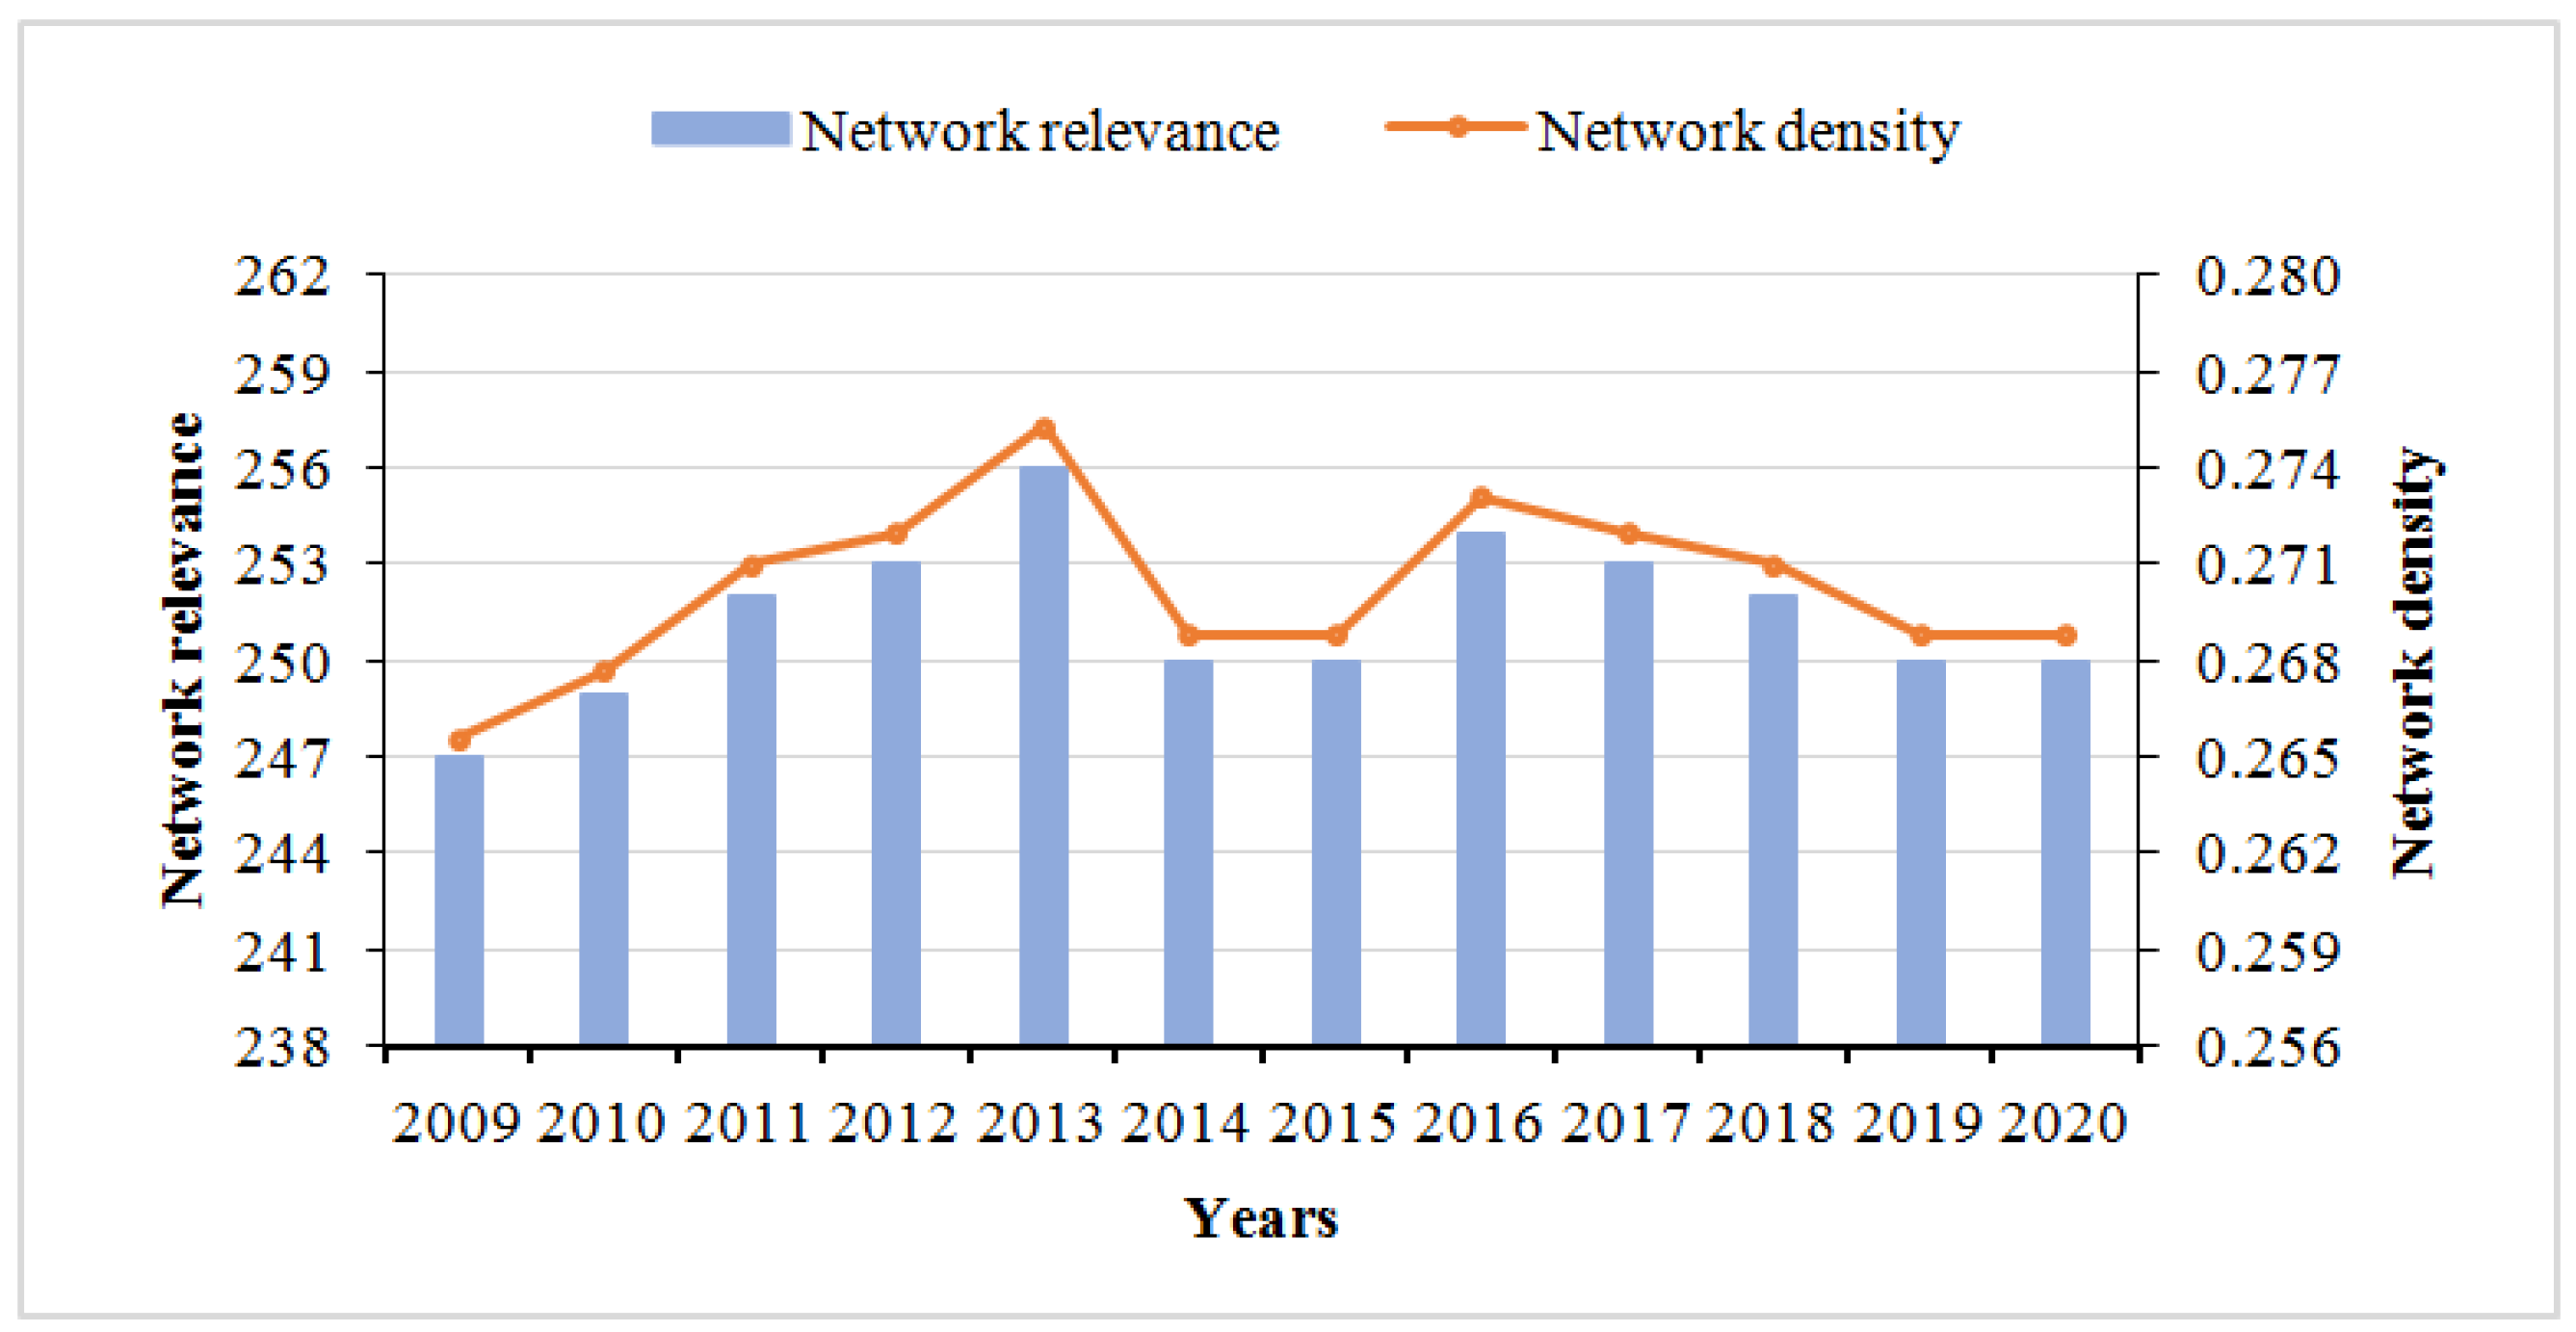
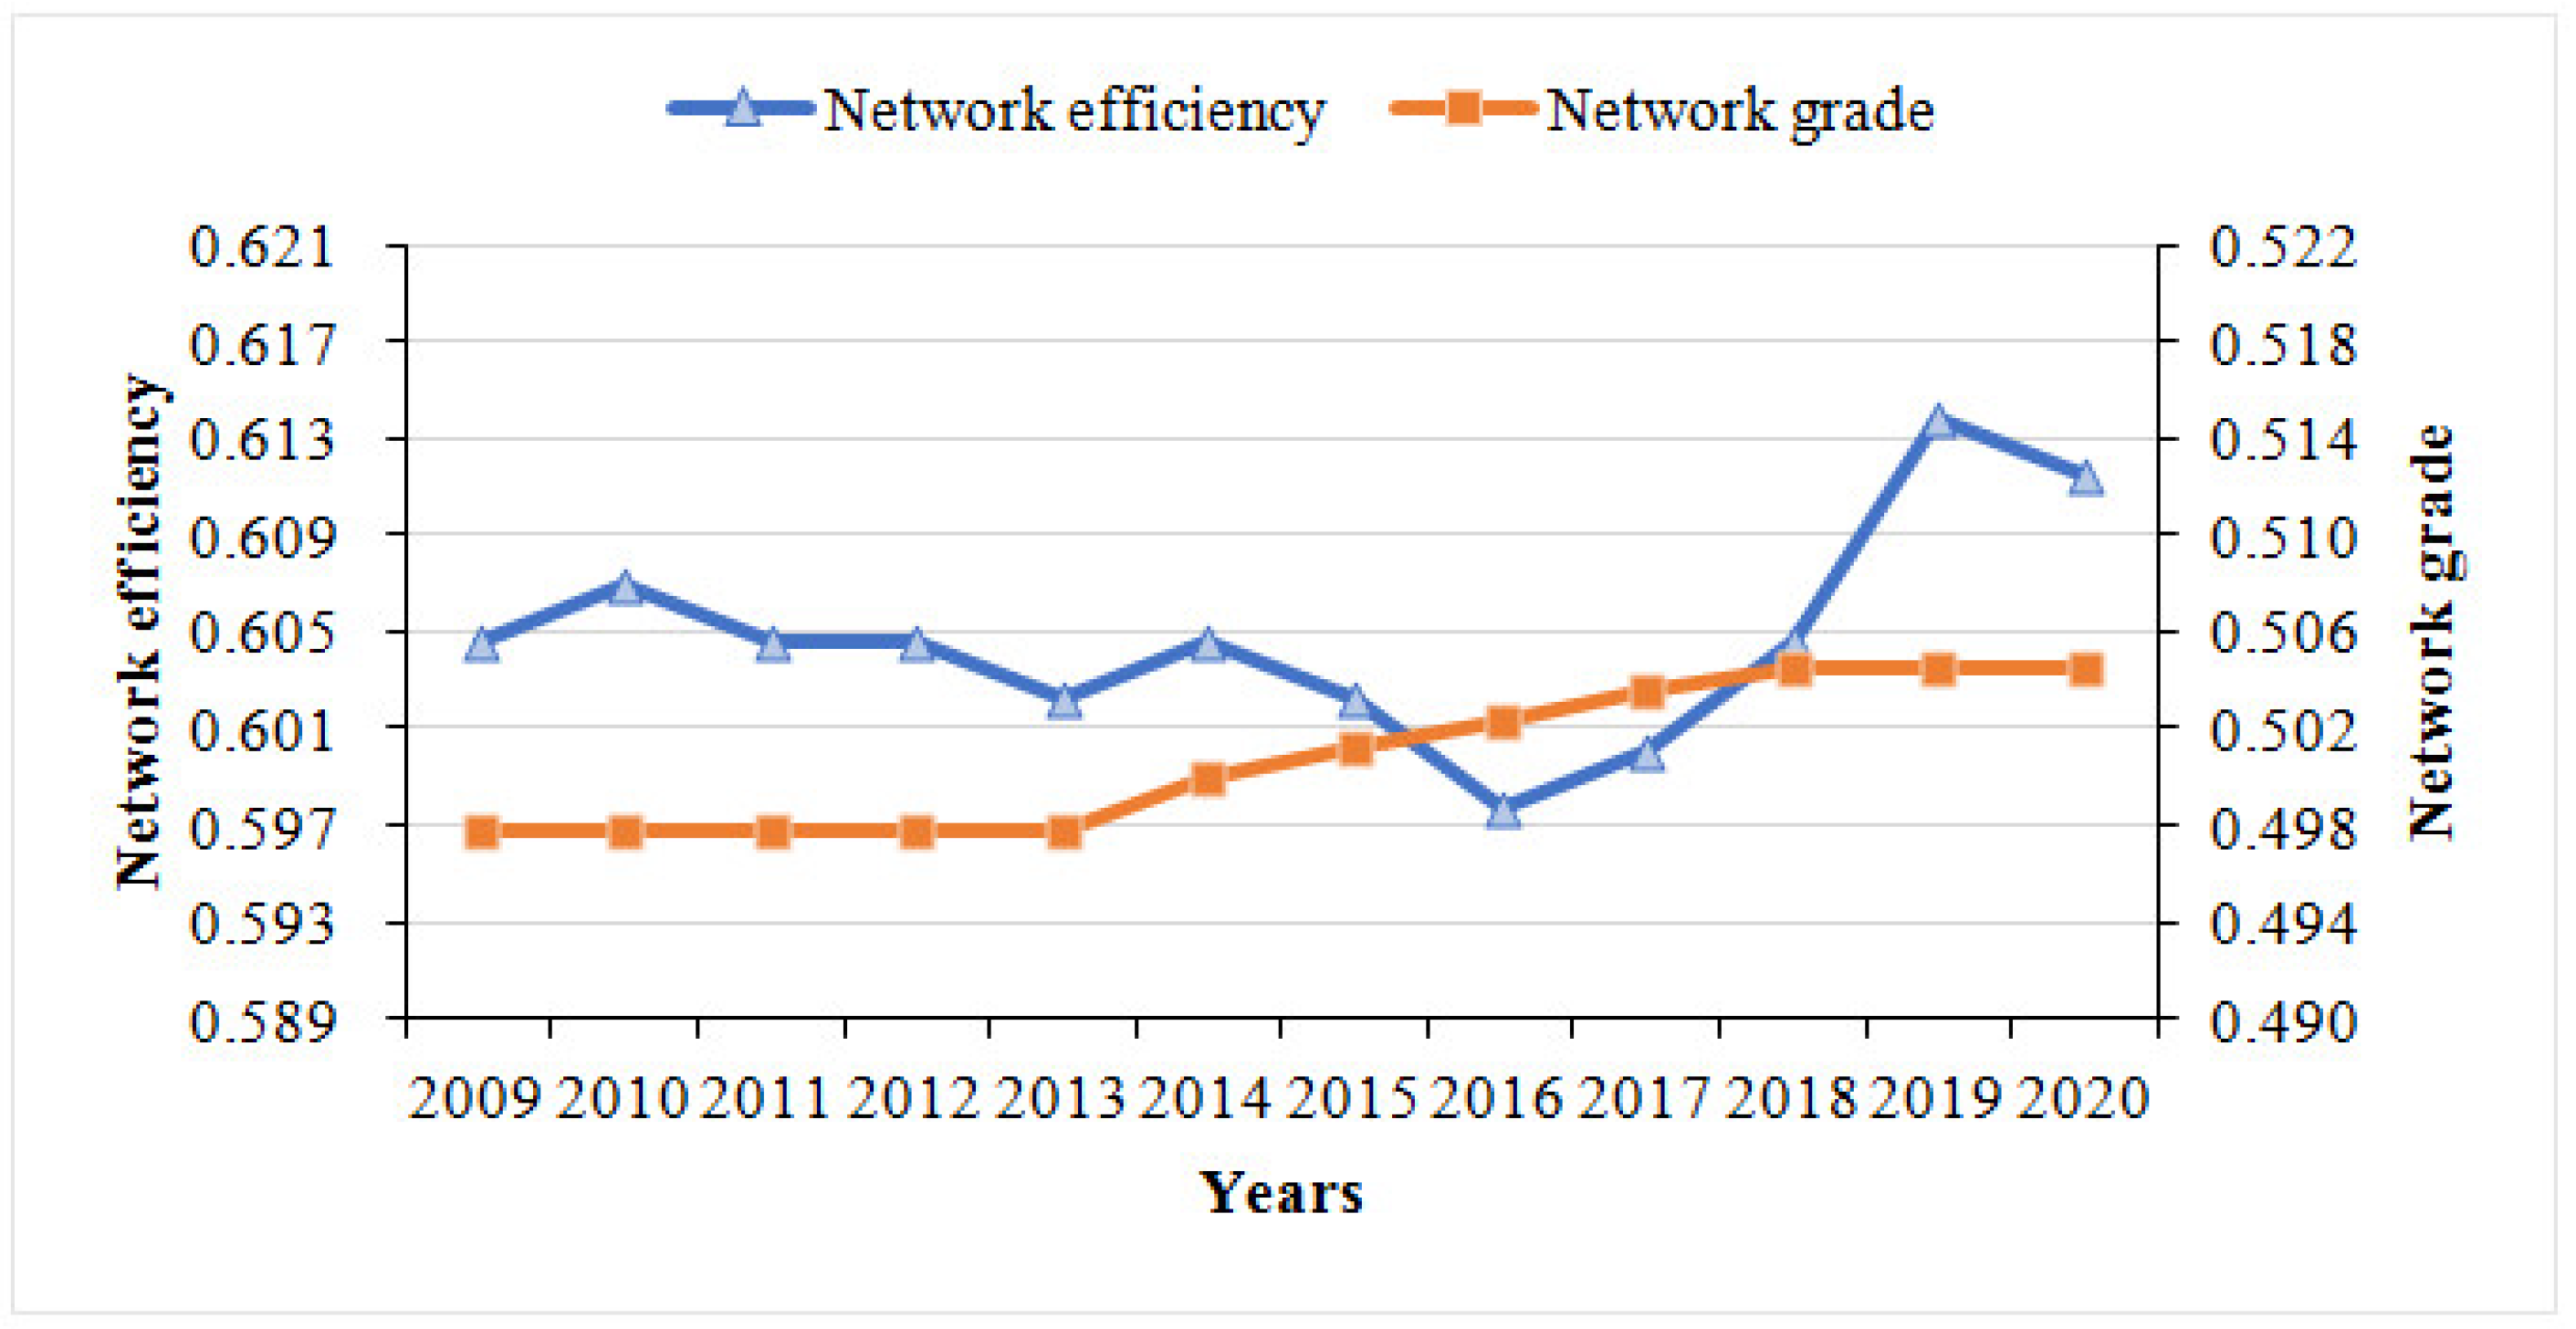
3.1. Characteristics of the Overall Network Structure
3.2. Characteristics of the Individual Network Structure
3.2.1. Degree Centrality
3.2.2. Betweenness Centrality
3.2.3. Closeness Centrality
3.2.4. Evolutionary Trend
3.3. Spatial Clustering Analysis
3.4. Factors Influencing the Network
3.4.1. QAP Correlation Analysis
3.4.2. QAP Regression Analysis
4. Conclusions
- (1)
- The spatial association relationship of PM2.5 in China exhibited a more complex network structure. The network as a whole had strong stability, and there was an external spillover effect of PM2.5 in all provinces. In fact, with the improvement in citizens’ awareness of air pollution protection and the increase in governmental efforts, the interconnection and mutual influence of PM2.5 among provinces is weakening, and the relatively distinct hierarchical structure of PM2.5 among provinces is being deconstructed. However, it should also be realized that the network degree is more closely linked, and the current air pollution problem in China is still severe.
- (2)
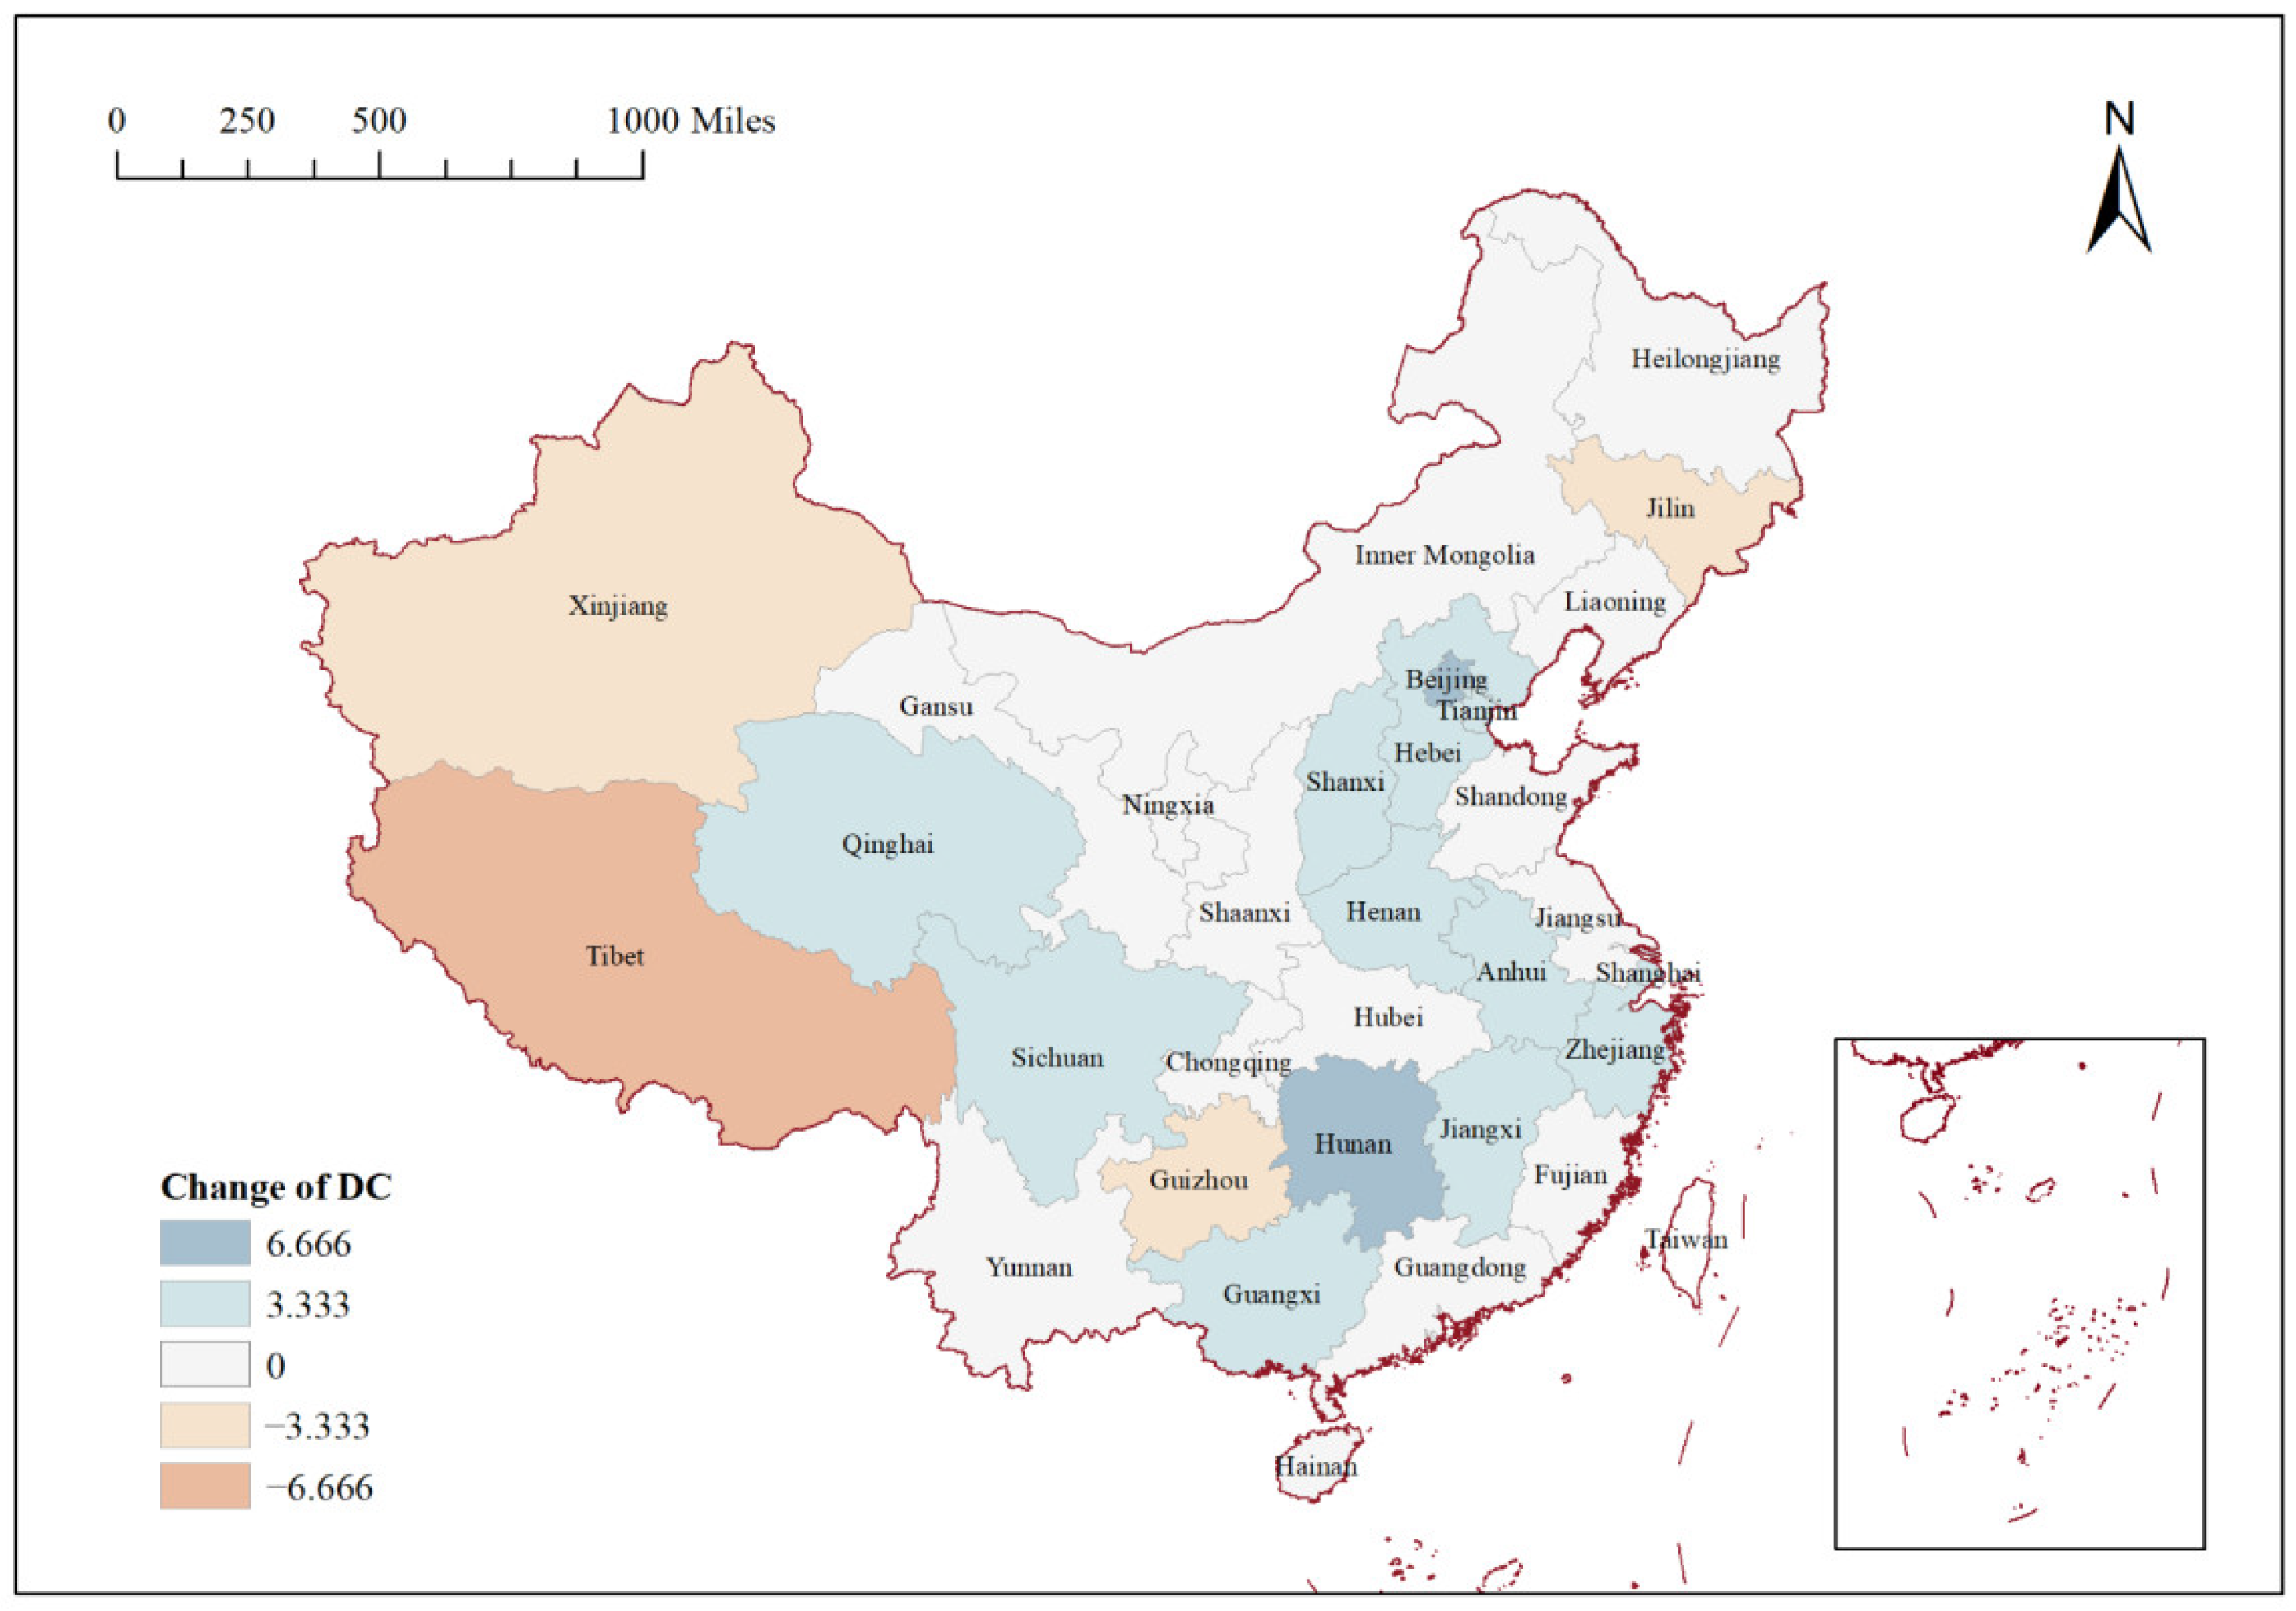
- The centrality analysis showed that the network exhibits a significant “core-edge” distribution pattern. Jiangsu, Shandong, and Henan are located at the center of the network, and these three provinces had the most connections with other provinces, and they also acted as bridges within the network. In addition, comparing the DC of each province in 2013 with that in 2020, we found that the effect of PM2.5 management in China was more significant, and most of the haze focus areas, such as the Yangtze River Delta, the Beijing–Tianjin–Hebei region, the Sichuan–Chongqing region, and central China, decreased to different degrees in the associated networks.
- (3)
- A block model analysis showed that six provinces, such as Beijing, belong to the “net benefit” block, receiving a large number of spillover relationships from other blocks; five provinces, such as Jilin, belong to the “net spillover” block, sending a large number of relationships; and nine provinces belong to the “two-way spillovers” block, which plays a leading role outside the block, and the relationship within the block is also complex, which is the most difficult area for PM2.5 governance; and the other 11 provinces belong to the “broker” block and play a key role in the network.
- (4)
- The results of the QAP regression analysis showed that differences in the geographical distance, car ownership, industrial structure, environmental regulation, and government intervention explained approximately 25.9% of the variation in the network among the Chinese provinces. Among them, the closer the provinces were, the more likely they were to generate the networks. Differences in government intervention and industrial structure also promotes the formation of the network, whereas differences in environmental regulation and car ownership have the opposite effect.
Author Contributions
Funding
Institutional Review Board Statement
Informed Consent Statement
Data Availability Statement
Conflicts of Interest
References
- Ye, W.-F.; Ma, Z.-Y.; Ha, X.-Z. Spatial-temporal patterns of PM2.5 concentrations for 338 Chinese cities. Sci. Total Environ. 2018, 631–632, 524–533. [Google Scholar] [CrossRef] [PubMed]
- Zhang, Y.; Shen, L.; Shuai, C.; Bian, J.; Zhu, M.; Tan, Y.; Ye, G. How is the environmental efficiency in the process of dramatic economic development in the Chinese cities? Ecol. Indic. 2019, 98, 349–362. [Google Scholar] [CrossRef]
- Sun, X.; Zhang, R.; Wang, G.; Guo, J.; Liu, Z. Factor decomposition, reduction potential, and rebound effect of energy consumption related PM2.5 in China. J. Clean. Prod. 2021, 322, 129088. [Google Scholar] [CrossRef]
- Zhang, H.; Liu, Y.; Yang, D.; Dong, G. PM2.5 Concentrations Variability in North China Explored with a Multi-Scale Spatial Random Effect Model. Int. J. Environ. Res. Public Health 2022, 19, 10811. [Google Scholar] [CrossRef] [PubMed]
- Song, J.; Wang, B.; Fang, K.; Yang, W. Unraveling economic and environmental implications of cutting overcapacity of industries: A city-level empirical simulation with input-output approach. J. Clean. Prod. 2019, 222, 722–732. [Google Scholar] [CrossRef]
- Zhou, L.; Chen, X.; Tian, X. The impact of fine particulate matter (PM2.5) on China’s agricultural production from 2001 to 2010. J. Clean. Prod. 2018, 178, 133–141. [Google Scholar] [CrossRef]
- Zhang, L.; Wang, H.; Yang, Z.; Fang, B.; Zeng, H.; Meng, C.; Rong, S.; Wang, Q. Personal PM2.5-bound PAH exposure, oxidative stress and lung function: The associations and mediation effects in healthy young adults. Environ. Pollut. 2022, 293, 118493. [Google Scholar] [CrossRef] [PubMed]
- Thao, N.N.L.; Pimonsree, S.; Prueksakorn, K.; Thao, P.T.B.; Vongruang, P. Public health and economic impact assessment of PM2.5 from open biomass burning over countries in mainland Southeast Asia during the smog episode. Atmos. Pollut. Res. 2022, 13, 101418. [Google Scholar] [CrossRef]
- Liang, X.; Chen, J.; An, X.; Liu, F.; Liang, F.; Tang, X.; Qu, P. The impact of PM2.5 on children’s blood pressure growth curves: A prospective cohort study. Environ. Int. 2022, 158, 107012. [Google Scholar] [CrossRef]
- Wang, Y.; Sun, K.; Li, L.; Lei, Y.; Wu, S.; Jiang, Y.; Xi, Y.; Wang, F.; Cui, Y. Assessing the Public Health Economic Loss from PM2.5 Pollution in ‘2 + 26′ Cities. Int. J. Environ. Res. Public Health 2022, 19, 10647. [Google Scholar] [CrossRef]
- Zeng, Y.; Cao, Y.; Qiao, X.; Seyler, B.C.; Tang, Y. Air pollution reduction in China: Recent success but great challenge for the future. Sci. Total Environ. 2019, 663, 329–337. [Google Scholar] [CrossRef] [PubMed]
- Zhang, Q.; Zheng, Y.; Tong, D.; Shao, M.; Wang, S.; Zhang, Y.; Xu, X.; Wang, J.; He, H.; Liu, W.; et al. Drivers of improved PM2.5 air quality in China from 2013 to 2017. Proc Natl. Acad. Sci. USA 2019, 116, 24463–24469. [Google Scholar] [CrossRef] [PubMed] [Green Version]
- Wang, J.; Zhao, B.; Wang, S.; Yang, F.; Xing, J.; Morawska, L.; Ding, A.; Kulmala, M.; Kerminen, V.-M.; Kujansuu, J.; et al. Particulate matter pollution over China and the effects of control policies. Sci. Total Environ. 2017, 584–585, 426–447. [Google Scholar] [CrossRef] [PubMed]
- Zhang, Y.; Chen, J. An empirical study of the efficiency of haze pollution governance in Chinese cities based on streaming data. Sci. Total Environ. 2020, 739, 139571. [Google Scholar] [CrossRef] [PubMed]
- Jansen, R.C.; Shi, Y.; Chen, J.; Hu, Y.; Xu, C.; Hong, S.; Li, J.; Zhang, M. Using hourly measurements to explore the role of secondary inorganic aerosol in PM2.5 during haze and fog in Hangzhou, China. Adv. Atmos. Sci. 2014, 31, 1427–1434. [Google Scholar] [CrossRef]
- Gao, L.; Tian, Y.; Zhang, C.; Shi, G.; Hao, H.; Zeng, F.; Shi, C.; Zhang, M.; Feng, Y.; Li, X. Local and long-range transport influences on PM2.5 at a cities-cluster in northern China, during summer 2008. Particuology 2014, 13, 66–72. [Google Scholar] [CrossRef]
- Ferm, M.; Sjöberg, K. Concentrations and emission factors for PM2.5 and PM10 from road traffic in Sweden. Atmos. Environ. 2015, 119, 211–219. [Google Scholar] [CrossRef]
- Lyu, W.; Li, Y.; Guan, D.; Zhao, H.; Zhang, Q.; Liu, Z. Driving forces of Chinese primary air pollution emissions: An index decomposition analysis. J. Clean. Prod. 2016, 133, 136–144. [Google Scholar] [CrossRef] [Green Version]
- Ji, X.; Yao, Y.; Long, X. What causes PM2.5 pollution? Cross-economy empirical analysis from socioeconomic perspective. Energy Policy 2018, 119, 458–472. [Google Scholar] [CrossRef]
- He, J.; Ding, S.; Liu, D. Exploring the spatiotemporal pattern of PM2.5 distribution and its determinants in Chinese cities based on a multilevel analysis approach. Sci. Total Environ. 2019, 659, 1513–1525. [Google Scholar] [CrossRef]
- Wu, W.; Zhang, M.; Ding, Y. Exploring the effect of economic and environment factors on PM2.5 concentration: A case study of the Beijing-Tianjin-Hebei region. J. Environ. Manag. 2020, 268, 110703. [Google Scholar] [CrossRef] [PubMed]
- Gan, T.; Liang, W.; Yang, H.; Liao, X. The effect of Economic Development on haze pollution (PM2.5) based on a spatial perspective: Urbanization as a mediating variable. J. Clean. Prod. 2020, 266, 121880. [Google Scholar] [CrossRef]
- Wang, M.; Wang, H. Spatial Distribution Patterns and Influencing Factors of PM2.5 Pollution in the Yangtze River Delta: Empirical Analysis Based on a GWR Model. Asia-Pac. J. Atmos. Sci. 2021, 57, 63–75. [Google Scholar] [CrossRef]
- Wang, Y.; Xu, Z. The scale boundary of urbanized population with peaking PM2.5 concentration: A spatial panel econometric analysis of China’s prefecture-level and above cities. J. Environ. Plan. Manag. 2022, 65, 126–149. [Google Scholar] [CrossRef]
- Cheng, Z.; Li, L.; Liu, J. Identifying the spatial effects and driving factors of urban PM2.5 pollution in China. Ecol. Indic. 2017, 82, 61–75. [Google Scholar] [CrossRef]
- Chen, S.; Zhang, Y.; Zhang, Y.; Liu, Z. The relationship between industrial restructuring and China’s regional haze pollution: A spatial spillover perspective. J. Clean. Prod. 2019, 239, 115808. [Google Scholar] [CrossRef]
- Ding, Y.; Zhang, M.; Chen, S.; Wang, W.; Nie, R. The environmental Kuznets curve for PM2.5 pollution in Beijing-Tianjin-Hebei region of China: A spatial panel data approach. J. Clean. Prod. 2019, 220, 984–994. [Google Scholar] [CrossRef]
- Lin, Y.; Yang, X.; Li, Y.; Yao, S. The effect of forest on PM2.5 concentrations: A spatial panel approach. For. Policy Econ. 2020, 118, 102261. [Google Scholar] [CrossRef]
- Zhang, S.; Wang, Y.; Liu, Z.; Hao, Y. The spatial dynamic relationship between haze pollution and economic growth: New evidence from 285 prefecture-level cities in China. J. Environ. Plan. Manag. 2021, 64, 1985–2020. [Google Scholar] [CrossRef]
- Liu, H.J.; Liu, C.M.; Sun, Y.N. Spatial correlation network structure of energy consumption and its effect in China. China Ind. Econ. 2015, 5, 83–95. [Google Scholar]
- Yu, J.-K.; Ma, J.-Q. Social network analysis as a tool for the analysis of the international trade network of aquatic products. Aquac. Int. 2020, 28, 1195–1211. [Google Scholar] [CrossRef]
- Zhang, P.; Zhao, Y.; Zhu, X.; Cai, Z.; Xu, J.; Shi, S. Spatial structure of urban agglomeration under the impact of high-speed railway construction: Based on the social network analysis. Sustain. Cities Soc. 2020, 62, 102404. [Google Scholar] [CrossRef]
- Leng, Z.; Sun, H.; Cheng, J.; Wang, H.; Yao, Z. China’s rare earth industry technological innovation structure and driving factors: A social network analysis based on patents. Resour. Policy 2021, 73, 102233. [Google Scholar] [CrossRef]
- Meng, X.; Liu, M.; Wang, J. Innovation network economic model of new energy automobile industry based on social network perspective. J. Therm. Anal. Calorim. 2021, 144, 1671–1680. [Google Scholar] [CrossRef]
- Khan, G.F.; Lee, S.; Park, J.Y.; Park, H.W. Theories in communication science: A structural analysis using webometrics and social network approach. Scientometrics 2016, 108, 531–557. [Google Scholar] [CrossRef]
- Wang, H.; He, F.; Ding, K. An identifying method of industrial essential technologies based on social network analysis: Semiconductor industry as a case. J. Intell. 2017, 36, 78–84. [Google Scholar]
- Xu, G.; Ren, X.; Xiong, K.; Li, L.; Bi, X.; Wu, Q. Analysis of the driving factors of PM2.5 concentration in the air: A case study of the Yangtze River Delta, China. Ecol. Indic. 2020, 110, 105889. [Google Scholar] [CrossRef]
- Sun, Y.; Xiao, C.; Liu, H. Air pollution’ s urban linkage and dynamic interaction in Yangtze River Delta region: Based on AQI data empirical study. Rev. Econ. Manag. 2017, 2, 121–131. [Google Scholar]
- Danish; Ozcan, B.; Ulucak, R. An empirical investigation of nuclear energy consumption and carbon dioxide (CO2) emission in India: Bridging IPAT and EKC hypotheses. Nucl. Eng. Technol. 2021, 53, 2056–2065. [Google Scholar]


| Province | In-Degree | Out-Degree | Degree | Betweenness | Closeness |
|---|---|---|---|---|---|
| Beijing | 11 | 4 | 36.667 | 0.807 | 57.692 |
| Tianjin | 8 | 3 | 26.667 | 0.23 | 53.571 |
| Hebei | 14 | 5 | 46.667 | 1.943 | 61.224 |
| Shanxi | 7 | 7 | 33.333 | 0.69 | 60 |
| Inner Mongoria | 0 | 7 | 23.333 | 0.272 | 56.604 |
| Liaoning | 2 | 8 | 30 | 0.706 | 58.824 |
| Jilin | 2 | 8 | 26.667 | 0.272 | 57.692 |
| Heilongjiang | 1 | 9 | 30 | 0.706 | 58.824 |
| Shanghai | 4 | 3 | 13.333 | 0 | 50.847 |
| Jiangsu | 27 | 6 | 90 | 17.409 | 90.909 |
| Zhejiang | 12 | 3 | 40 | 1.825 | 62.5 |
| Anhui | 12 | 7 | 40 | 0.915 | 62.5 |
| Fujian | 3 | 10 | 33.333 | 0.497 | 60 |
| Jiangxi | 5 | 9 | 30 | 0.042 | 58.824 |
| Shandong | 25 | 7 | 83.333 | 11.24 | 85.714 |
| Henan | 25 | 8 | 83.333 | 9.588 | 85.714 |
| Hubei | 18 | 8 | 66.667 | 3.077 | 75 |
| Hunan | 13 | 9 | 60 | 2.837 | 71.429 |
| Guangdong | 14 | 11 | 63.333 | 3.391 | 73.171 |
| Guangxi | 4 | 7 | 26.667 | 0.23 | 54.545 |
| Hainan | 0 | 4 | 13.333 | 0 | 50.847 |
| Chongqing | 9 | 9 | 50 | 0.847 | 66.667 |
| Sichuan | 9 | 10 | 50 | 0.707 | 66.667 |
| Guizhou | 6 | 9 | 33.333 | 0.114 | 58.824 |
| Yunnan | 4 | 10 | 36.667 | 0.225 | 61.224 |
| Tibet | 0 | 13 | 43.333 | 0.496 | 63.83 |
| Shaanxi | 9 | 10 | 50 | 1.17 | 66.667 |
| Gansu | 4 | 11 | 46.667 | 0.805 | 65.217 |
| Qinghai | 0 | 11 | 36.667 | 0.246 | 61.224 |
| Ningxia | 1 | 10 | 33.333 | 0.46 | 60 |
| Xinjiang | 1 | 14 | 50 | 1.699 | 66.667 |
| Block | Receive Relationship | Overflow Relationship | Expected Internal Relationship Ratio | Actual Internal Relationship Ratio | ||
|---|---|---|---|---|---|---|
| Inside | Outside | Inside | Outside | |||
| I | 26 | 64 | 26 | 8 | 17 | 76 |
| II | 5 | 1 | 5 | 37 | 13 | 12 |
| III | 50 | 58 | 50 | 16 | 30 | 76 |
| IV | 39 | 7 | 39 | 69 | 37 | 36 |
| Block | I | II | III | IV |
|---|---|---|---|---|
| I | 0.867 | 0.000 | 0.111 | 0.000 |
| II | 0.867 | 0.250 | 0.178 | 0.055 |
| III | 0.259 | 0.000 | 0.694 | 0.020 |
| IV | 0.364 | 0.018 | 0.444 | 0.355 |
| Block | I | II | III | IV |
|---|---|---|---|---|
| I | 1 | 0 | 0 | 0 |
| II | 1 | 0 | 0 | 0 |
| III | 0 | 0 | 1 | 0 |
| IV | 1 | 0 | 1 | 1 |
| Variable | Coefficients | Sig. | Average | Std Dev | Minimum | Maximum | p ≥ 0 | p ≤ 0 |
|---|---|---|---|---|---|---|---|---|
| GD | 0.459 | 0.000 | 0.001 | 0.036 | −0.140 | 0.139 | 0.000 | 1.000 |
| GDP | 0.026 | 0.358 | 0.000 | 0.060 | −0.224 | 0.216 | 0.358 | 0.671 |
| TI | −0.068 | 0.155 | −0.001 | 0.063 | −0.222 | 0.191 | 0.867 | 0.155 |
| GOV | 0.095 | 0.064 | −0.001 | 0.063 | −0.201 | 0.198 | 0.064 | 0.946 |
| ER | −0.103 | 0.044 | −0.001 | 0.057 | −0.216 | 0.213 | 0.965 | 0.044 |
| IS | 0.168 | 0.002 | 0.000 | 0.059 | −0.182 | 0.207 | 0.002 | 0.999 |
| CO | −0.164 | 0.003 | 0.001 | 0.061 | −0.189 | 0.189 | 0.998 | 0.003 |
| Variable | Un-Standardized Coefficient | Standardized Coefficient | Significance | p ≥ 0 | p ≤ 0 |
|---|---|---|---|---|---|
| GD | 0.555 | 0.443 | 0.000 | 0.000 | 1.000 |
| GOV | 0.075 | 0.080 | 0.062 | 0.062 | 0.938 |
| ER | −0.069 | −0.075 | 0.055 | 0.946 | 0.055 |
| IS | 0.075 | 0.082 | 0.040 | 0.040 | 0.960 |
| CO | −0.165 | −0.180 | 0.002 | 0.999 | 0.002 |
| R2 | 0.262(0.259) |
Publisher’s Note: MDPI stays neutral with regard to jurisdictional claims in published maps and institutional affiliations. |
© 2022 by the authors. Licensee MDPI, Basel, Switzerland. This article is an open access article distributed under the terms and conditions of the Creative Commons Attribution (CC BY) license (https://creativecommons.org/licenses/by/4.0/).
Share and Cite
Wang, H.; Ge, Q. Analysis of the Spatial Association Network of PM2.5 and Its Influencing Factors in China. Int. J. Environ. Res. Public Health 2022, 19, 12753. https://doi.org/10.3390/ijerph191912753
Wang H, Ge Q. Analysis of the Spatial Association Network of PM2.5 and Its Influencing Factors in China. International Journal of Environmental Research and Public Health. 2022; 19(19):12753. https://doi.org/10.3390/ijerph191912753
Chicago/Turabian StyleWang, Huiping, and Qi Ge. 2022. "Analysis of the Spatial Association Network of PM2.5 and Its Influencing Factors in China" International Journal of Environmental Research and Public Health 19, no. 19: 12753. https://doi.org/10.3390/ijerph191912753
APA StyleWang, H., & Ge, Q. (2022). Analysis of the Spatial Association Network of PM2.5 and Its Influencing Factors in China. International Journal of Environmental Research and Public Health, 19(19), 12753. https://doi.org/10.3390/ijerph191912753