1. Introduction
Worldwide, an increasing proportion of the population is living in urban areas, resulting in both expansion in size of urban areas and densification [
1]. As cities are growing and densifying, the competition for space increases. This has led to a decrease of urban green spaces (UGS) in Europe, and even more so in Asia and Australia [
1]. In Sweden, the trend of urbanization has been clear. Today, almost nine out of ten Swedes live in urban areas, whereas the opposite was true 200 years ago [
2].
There are only a few studies measuring changes in UGS, in this study defined as any vegetation found in the urban environment [
1], using methodology that enables comparisons over time have been made for Swedish cities. Statistics Sweden found a reduction in UGS by 0.6–1.5% in the ten largest cities (including Malmö) in Sweden from 2000 to 2005 [
3]. However, a later study including only Stockholm found an increase in Normalized Differentiated Vegetation Index (NDVI), i.e., vegetation cover, between 1990 to 2015 [
4].
It is well known that UGS can provide so-called ecosystem services (for example, regulate temperature, produce biomass, and reduce risk of flooding) and improve biodiversity inside cities, as well as have a positive impact on health and wellbeing on residents [
5]. A growing literature on positive effects of UGS on health includes reduced risk of cardiovascular disease [
6], lower mortality [
7,
8] as well as mental health and wellbeing [
9,
10]. The promotion of physical activity from availability to UGS is of importance, but also merely viewing it from a window can affect physiological health [
11]. Thus, the benefit of a green environment can be due to experiencing the nature as well as using it for, e.g., physical activity. A range of factors impact the use of UGS, such as experience of safety [
12] and walkability [
13]. However, a basic condition for partaking is access. Given that a majority of people live in urban areas, an uneven distribution of UGS could contribute to environmental injustice and consequently increase already existing health gaps between different sociodemographic groups. However, UGS could also potentially help closing these gaps if otherwise disadvantaged groups have greater availability.
Several studies report disparities in the associations between UGS and health for different sociodemographic groups, i.e., UGS may be more beneficial to some groups than others [
14,
15,
16,
17]. A systematic review on sex and gender differences in associations between UGS and physical health (including cardiovascular disease, diabetes, and mortality) found a stronger protective effect for these outcomes in general for women than for men [
17]. This indicates that women have more to gain from having available UGS than men. The effect was particularly strong when considering UGS within a maximum of 500 m from the residency. Other disadvantaged groups, such as those with low-income or belonging to ethnic minorities, have also been found to have more beneficial health effects from UGS, especially those publicly available such as parks [
15]. Moreover, housing type have been found to modify the association between UGS and health [
14]. In an Australian study more UGS (including trees, scrubs, and open grass) within a 1.6 km road network analysis was associated with less physiological distress among single-family house-dwellers, while no such association were found for those living in apartments. When considering only tree canopies, less physical distress was found also for those living in apartments. Only when considering grassland, more physiological distress was found for both groups.
Sociodemographic inequalities in the association between UGS and health can also interact with other sociodemographic factors. In a study from Brussels investigating self-perceived health and mortality, low educated women had the strongest beneficial effect on health from UGS, while among men those with higher education had the strongest positive effect [
16].
Availability to UGS has been found to be unevenly distributed between different sociodemographic groups based on, e.g., ethnicity and income [
18,
19,
20], which be referred to as environmental injustice [
21]. A review paper from the World Health Organization (WHO) reported that in ecological studies, deprived areas had lower availability of UGS, while the associations were mixed for studies on individual level [
22].
To maintain good health over the life course, it is important to continue to exercise physical activity [
23]. Prior studies have found positive associations between availability to UGS and physical activity among older people [
24,
25]. They are also important for good health is social interactions, and older adults’ availability to UGS has been found to promote social ties [
26]. In addition, after retirement, the amount of time that we spend at home or in close vicinity to our residence could be expected to increase, but also the time spent in close vicinity of our residence. It could therefore be argued that availability to UGS, especially close to the residence, becomes even more important with increasing age. The aim of this study was to investigate variations in availability to UGS based on sociodemographic groups among people aged 65 years or older in Sweden. In the present study, we define UGS as any land covered by vegetation found in the urban environment [
1].
2. Materials and Methods
2.1. Study Area
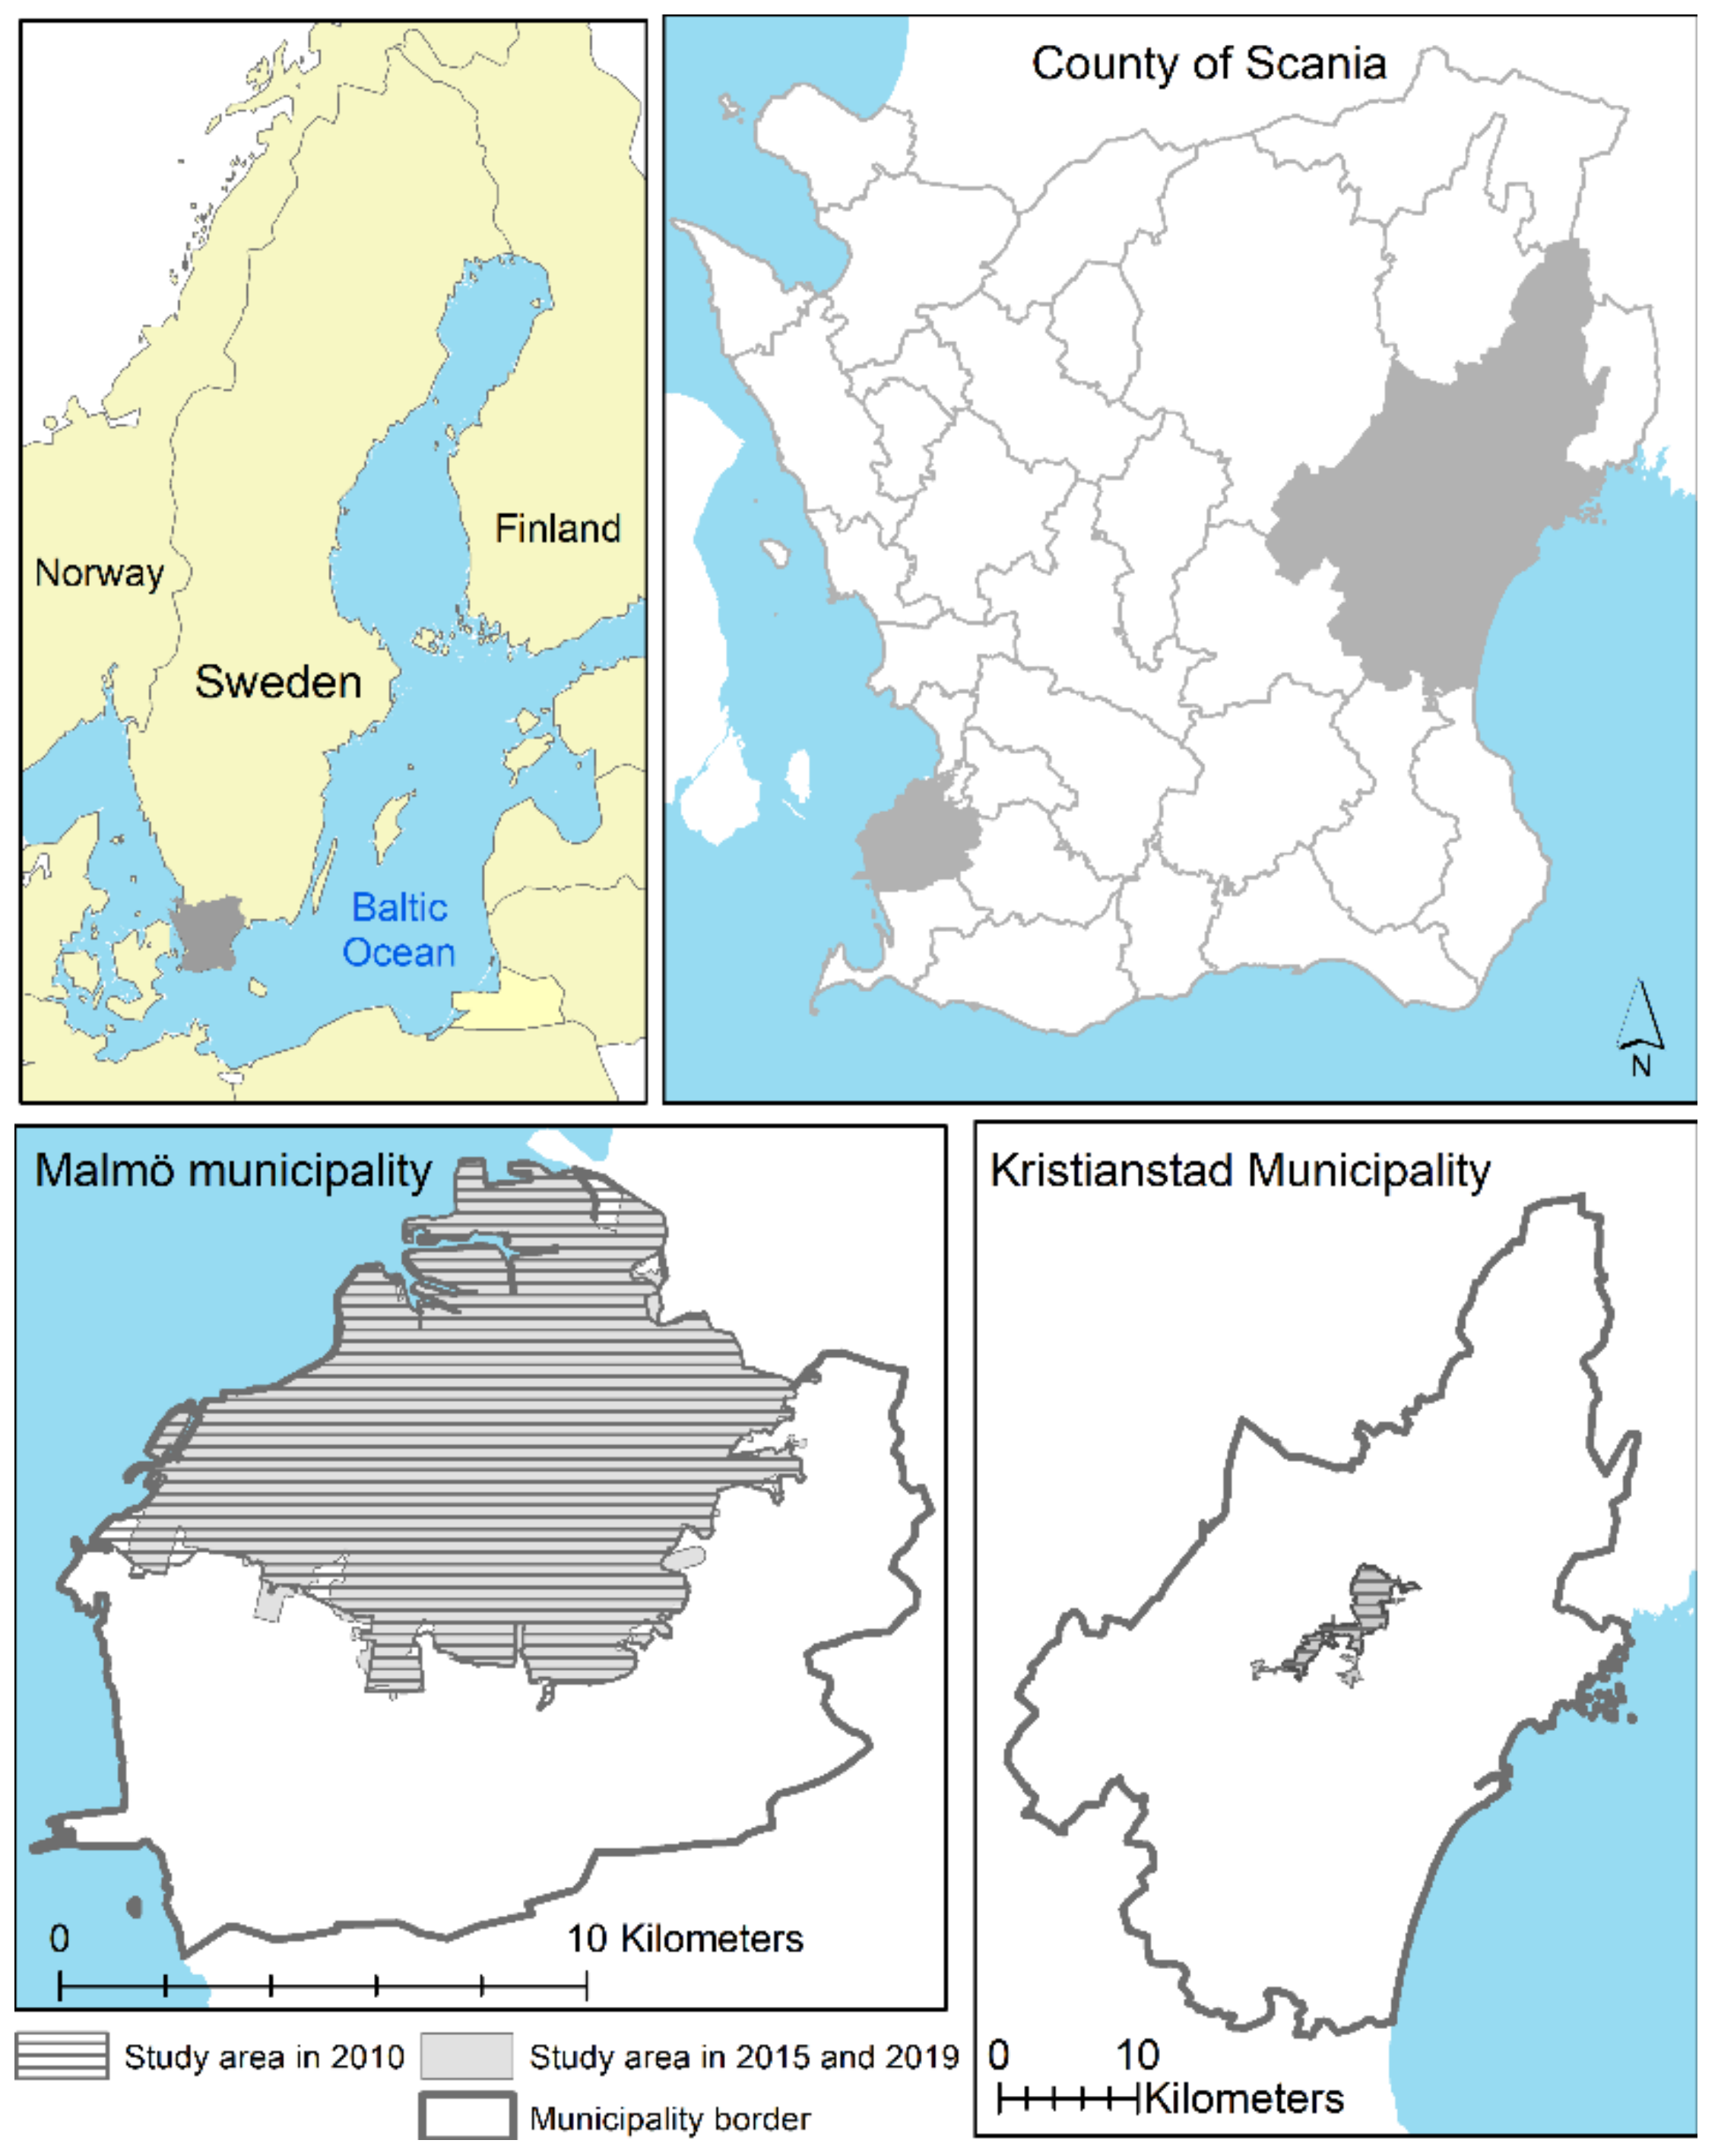
The study area was the urban areas of the two cities Malmö and Kristianstad, located in Scania, the southernmost county of Sweden (
Figure 1).
Based on population size, Malmö is the largest municipality in Scania with about 299,000 inhabitants in 2010 and 344,000 in 2019 [
27]. It is located at the coast of Öresund and in the middle of an area with some of the most valuable agricultural land in Sweden. It is directly connected to Copenhagen (the Danish capital) via the Öresund bridge. The city of Malmö is rapidly growing and has a higher population density (2193 inhabitants/km
2) [
27] than both Gothenburg (the second-largest city in Sweden) and Stockholm (the Swedish capital and largest city). There is a political ambition to continue to densify the city and the municipality [
28].
Kristianstad is located in the northeast corner of Scania. It was selected as a study area to represent a smaller and less densely populated municipality (69 inhabitants/km
2), and thereby a different geographical context. Kristianstad had about 79,500 inhabitants in 2010 and 85,700 in 2019 [
27].
The city of Malmö and Kristianstad, as identified by Statistics Sweden, within respectively municipality were included in this study. However, as Statistics Sweden’s definition of urban areas can vary over time and, the extent of the study area was slightly different in 2010 compared to 2015 and 2019 (
Figure 1).
2.2. Study Population
This was a repeated cross-sectional study in which six cohorts were defined. These cohorts included all persons aged 65 years or older living in the city of Malmö and Kristianstad, within respectively municipality, in 2010, 2015, and 2019. After excluding people with missing data on UGS or any of the sociodemographic variables the final study population was
N = 48,224 in 2010,
N = 50,367 in 2015 and
N = 53,280 in 2019 (
Table 1).
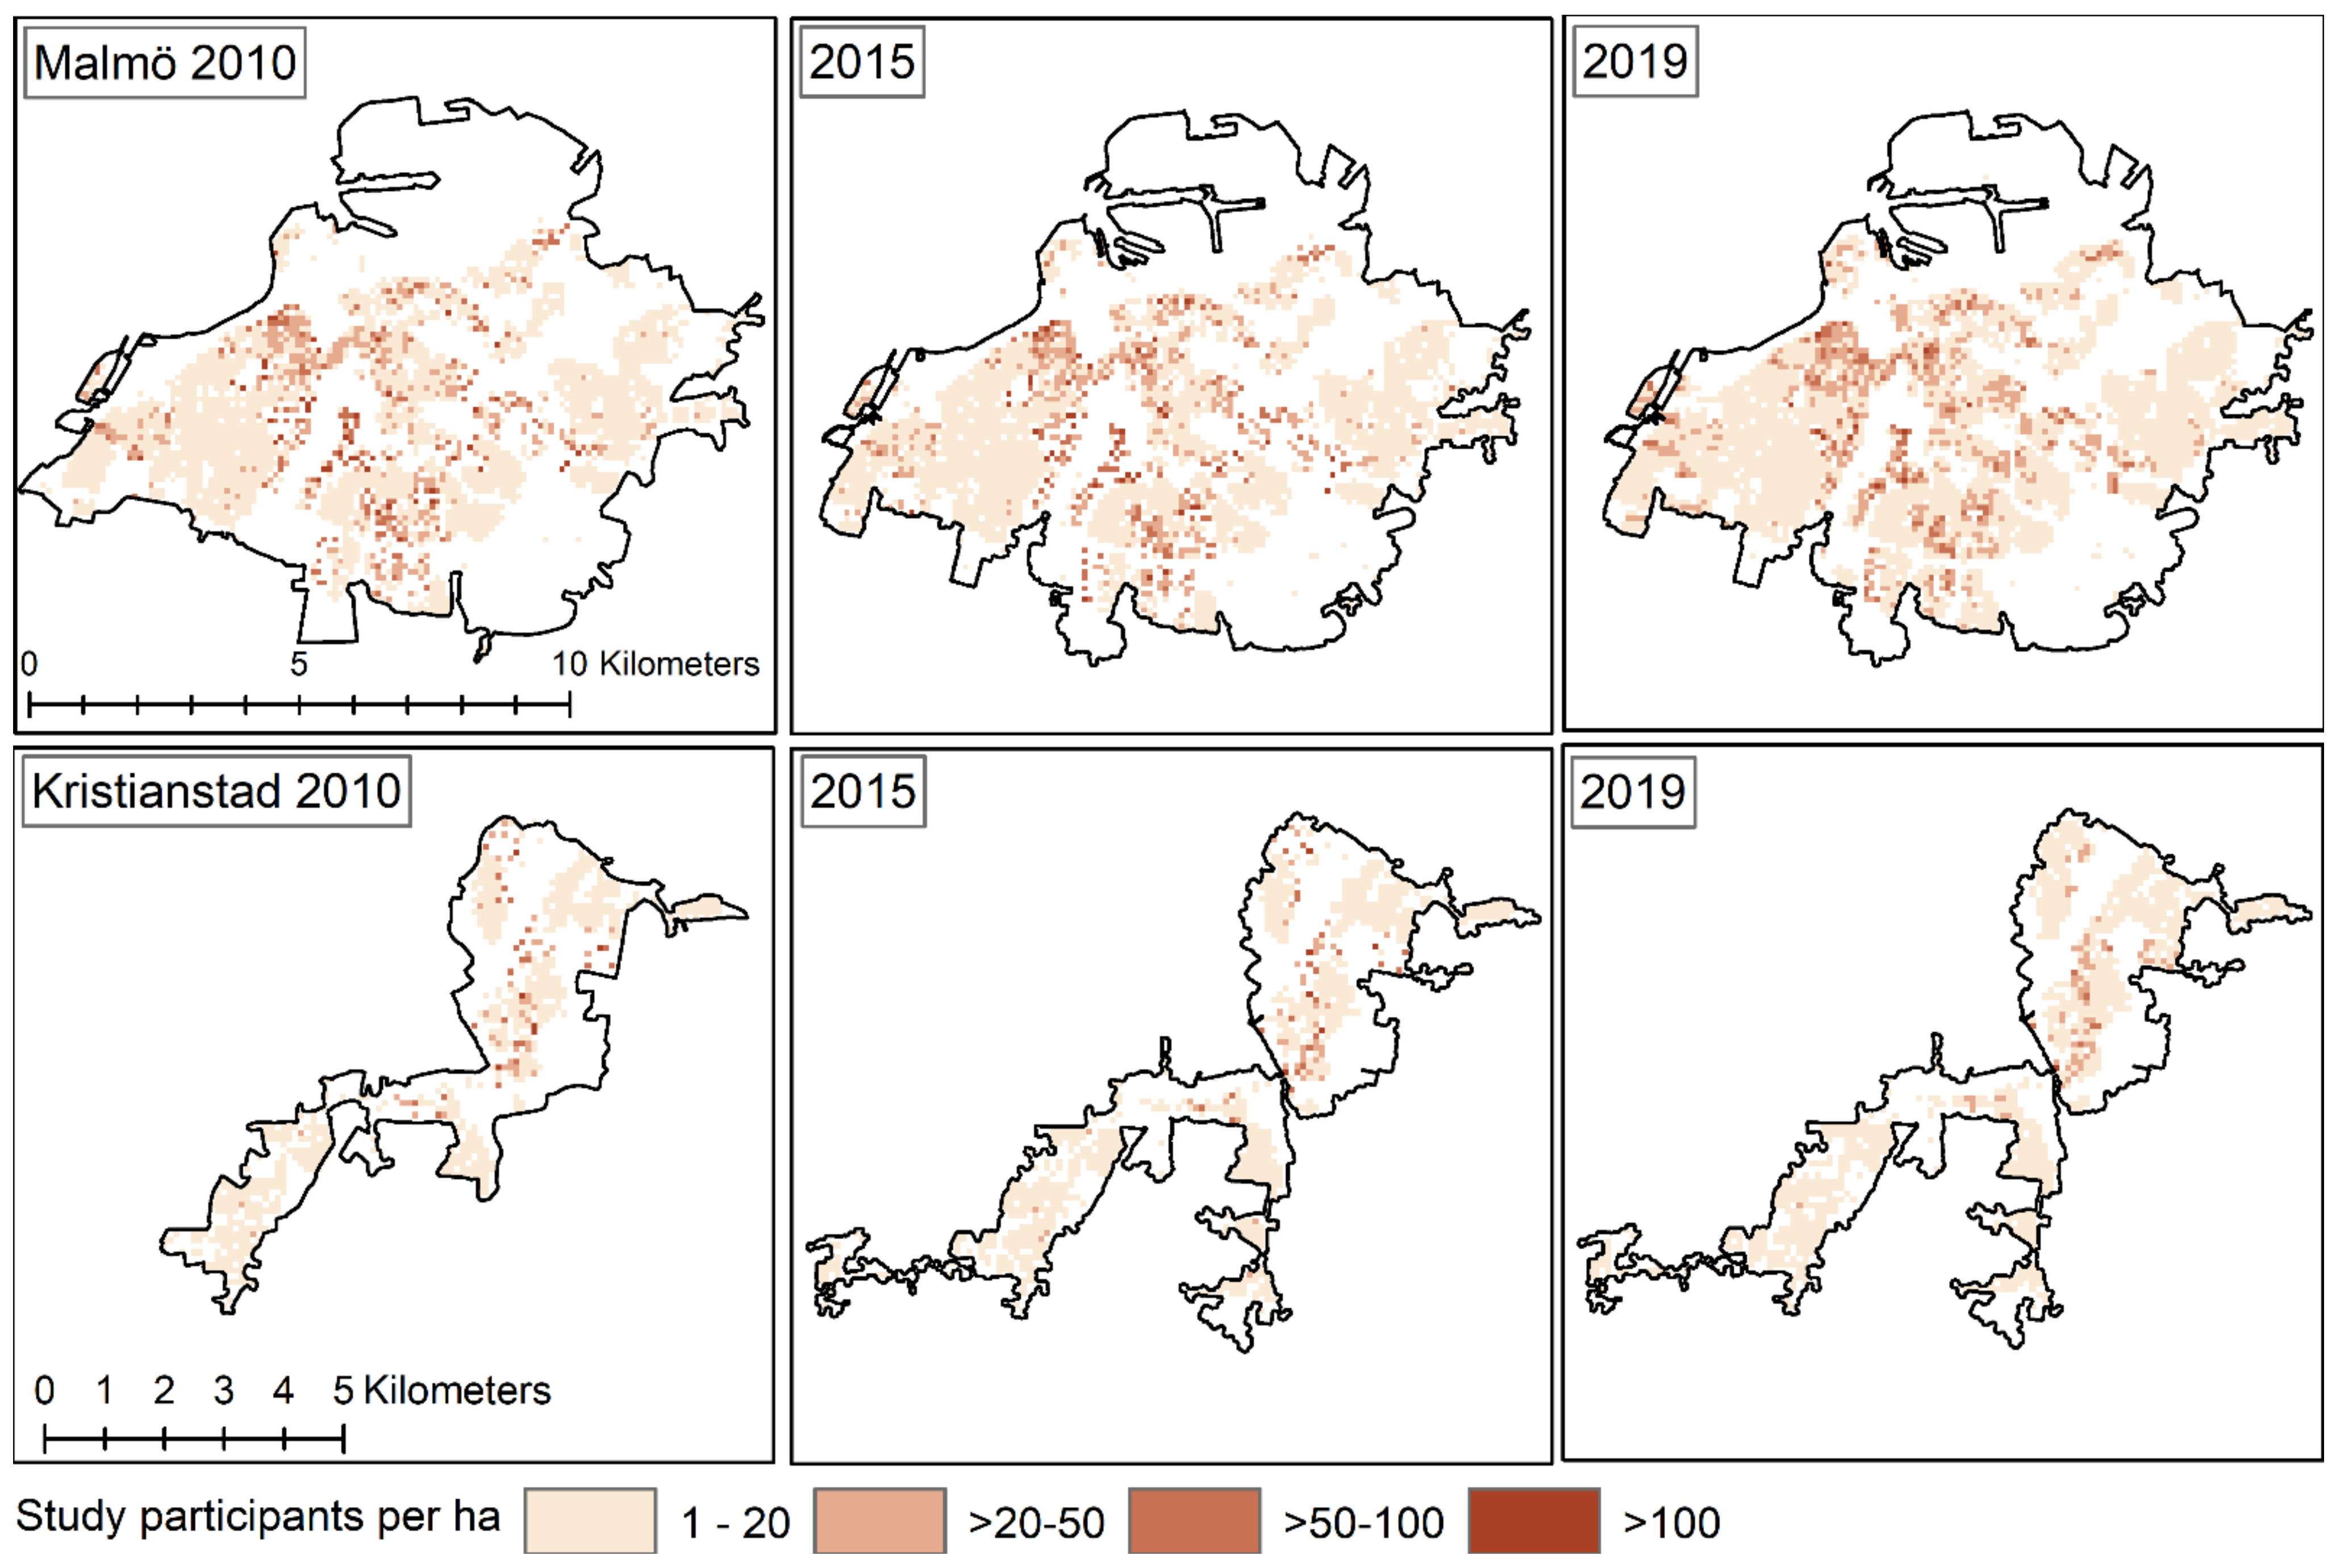
The residential density in the cities are unevenly distributed spatially and presented in
Figure 2.
2.3. Sociodemographic Variables
Five individual level and one area level sociodemographic variables were used. Information on individual characteristics was collected from the register of the total population at Statistics Sweden and information on residential area socioeconomic status (SES) from Statistics Sweden’s homepage (
www.scb.se; accessed on 2 May 2022). Residential area was represented by Demographical statistical area (DeSO), which is administrative units with 700 to 2700 inhabitants, with varying geographical coverage. Proportion of people with low economic standard (less than 60% of the median of the total disposable income of the household) was used as a measure of SES for the residential area, for individual study participants.
Characteristics that were not inherently dichotomous were dichotomized at the overall median (i.e., the median across both municipalities and all three years). Moreover, characteristics that may change over time were determined for the start of the years investigated (31 December 2009, 2014, and 2018, respectively).
Age—Estimated as the difference between year of birth and study year (i.e., 2010, 2015, and 2019, respectively). Those above the median were used as reference category, i.e., older people (aged 74+ years) were compared to younger study participants (65–74 years).
Sex—Woman (reference category) or man
Housing—Living in apartment (reference category) or single-family house [house].
Cohabiting—Living alone (reference category) or cohabiting. This category concerns living condition rather than civil status. That is, an individual could be registered as married but live alone.
Place of birth—Born abroad (reference category) or born in Sweden
Socioeconomic status (SES) in area of residence—Those above the median (19%) were used as reference category, i.e., those living in high SES areas (areas with a low percentage of people with low SES) were compared to those living in low SES areas (i.e., areas with a high percentage of people with low SES).
2.4. Urban Green Spaces
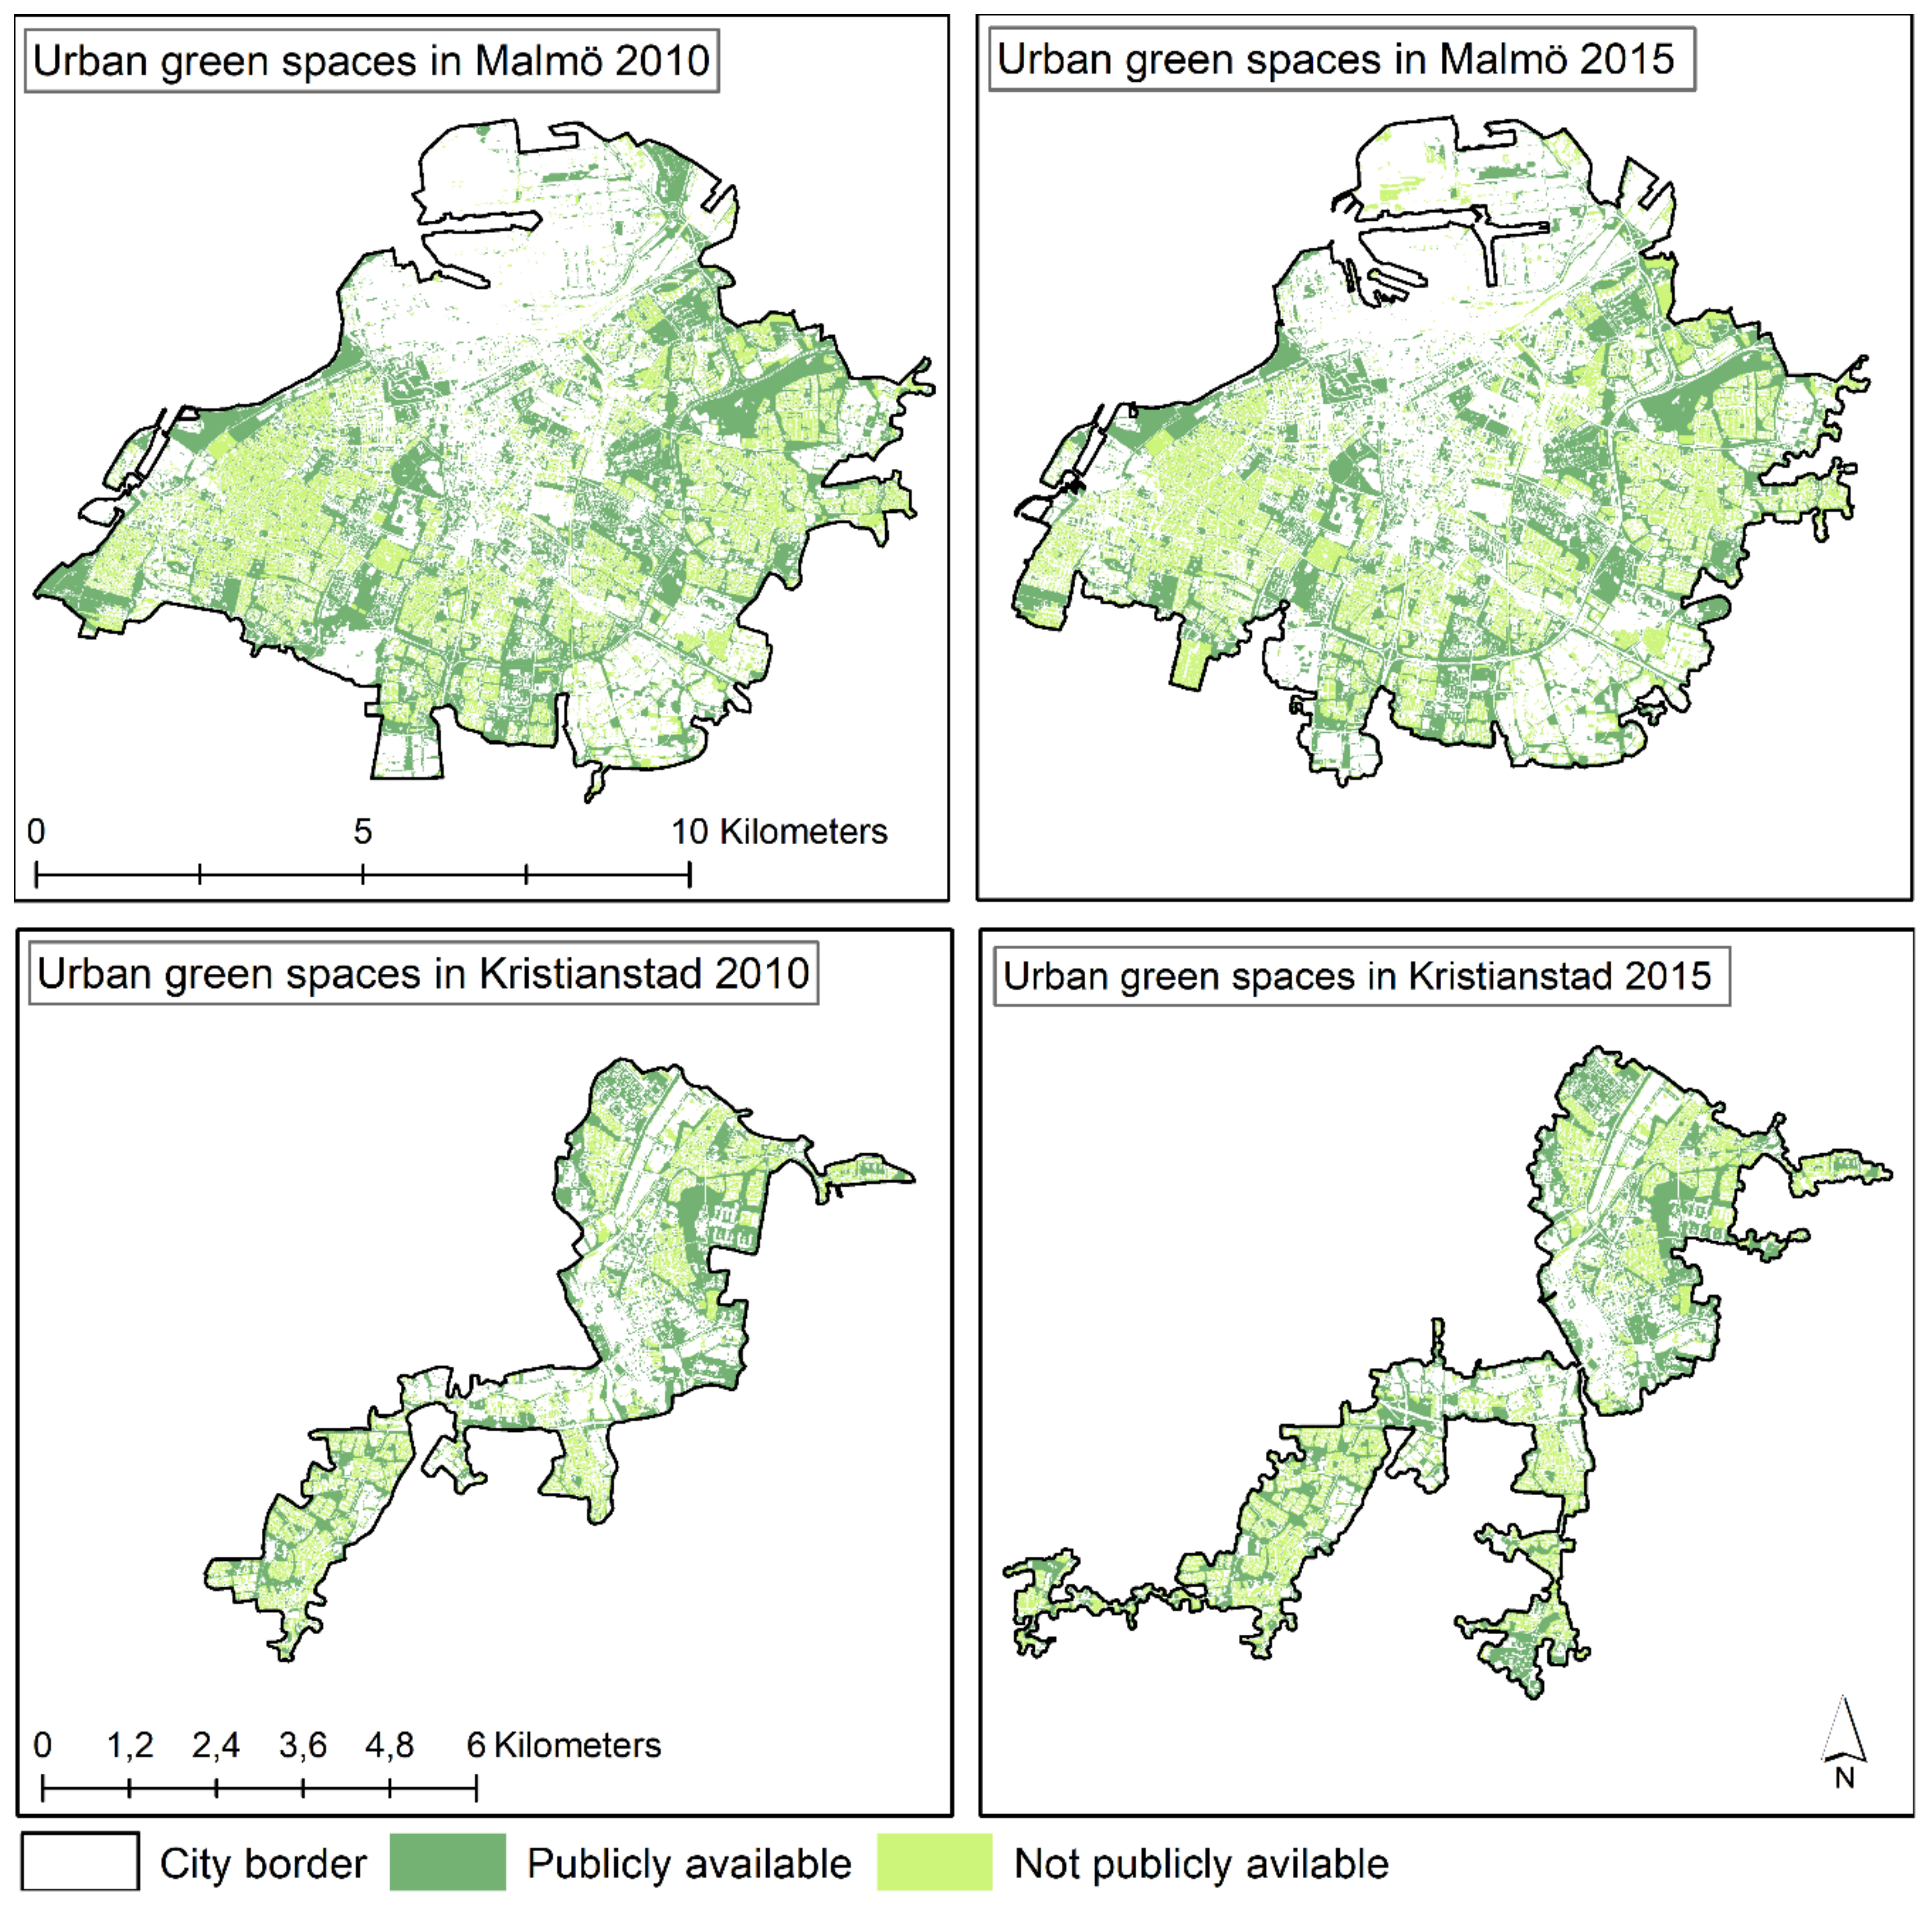
To quantify the physical amount of UGS in the vicinity of the residence (i.e., the availability of UGS), Geographical Information System (GIS) data layers with land cover classifications of vegetation, compiled by Statistics Sweden, were used (see
Figure 3) [
29,
30]. The surveys were carried out in 2010 and 2015, mapping UGS in Sweden including urban areas in Malmö and Kristianstad municipality. Similar methods were used for the classifications both years, allowing comparison between years to be made [
29]. Generally, satellite images with high spatial resolution (10 × 10 m) were classified into different types of land cover. This analysis was complemented with input from a number of other GIS layers, for instance information about buildings and road network, used to make a more detailed classification of total UGS as well as publicly available UGS. The following categories of UGS were used to assess availability of UGS in this study:
Urban green spaces (UGS)—The total area within the urban area covered by green elements for instance gardens (including private gardens), parks, trees, and other grass surfaces, independent of how they are used. The exception is green roofs, which are not considered part of the ground cover.
Publicly available urban green spaces (PGS)—The part of total UGS that is publicly available, with consideration to ownership of the land. To be considered as publicly available, areas should be free to access throughout the year. Areas privately own, but covered by the right of public access, for instance pasture or meadows were considered as publicly available.
Quiet publicly available urban green spaces (QGS)—In addition to the classification from Statistics Sweden, a detailed, modelled noise levels from road traffic respectively railway noise were available for the municipality of Malmö, based on the traffic flows in 2016 [
31]. Areas with noise levels below 45 dB(A) L
Aeq24 were considered as quiet and analyzed in correspondence with publicly available UGS. This level was selected based on levels where roughly all visitors would perceive the acoustic quality as good [
32].
Measures of Availability of Urban Green Spaces
Based on the classification of UGS from Statistics Sweden and available data on noise three measures were selected and assessed for the study population (see
Table 2). A classification of UGS was not available specifically for 2019, why the classification of UGS for 2015 were used to address availability to UGS for the study population in both 2015 and 2019.
Residential addresses were known as coordinates for the centroid of the property for each study participant. As measures of availability of UGS based on these coordinates, we used percentage of UGS, PGS, and QGS within 300 m (main analyses) of the residence, respectively. The distance of 300 m has commonly been used in epidemiological studies to study both physical and mental health outcomes in relation to UGS [
33]. In addition, sensitivity analyses for corresponding measured within 100 m were conducted. A shorter distance was considered as it may be more relevant for an older study population and therefore selected for the sensitivity analysis.
The different measures of urban greenness were dichotomized at the median for all three years and both cities (UGS in 300 m 51.4%, PGS in 300 m 26.6%, and QGS in 300 m 3.3%). Based on this, the outcome was having more than the median, i.e., high availability to UGS, PGS, and QGS, respectively.
2.5. Statistical Analysis
Relative risks (RRs) with 95% confidence intervals (CIs) for having more than the median green space (i.e., high availability) within 300 m (primary analysis) and 100 m (sensitivity analysis) were estimated for UGS, PGS, and QGS using generalized linear models with Poisson distribution and log link. Each sociodemographic variable was analyzed separately (crude estimates) as well as in a model with all sociodemographic variables included (adjusted estimates). As the different outcome measures were not normally distributed, pairwise correlations were determined using Spearman’s correlation coefficient.
All analyses were done using IBM SPSS Statistics 27.0. p-values below 0.05 were considered statistically significant.
4. Discussion
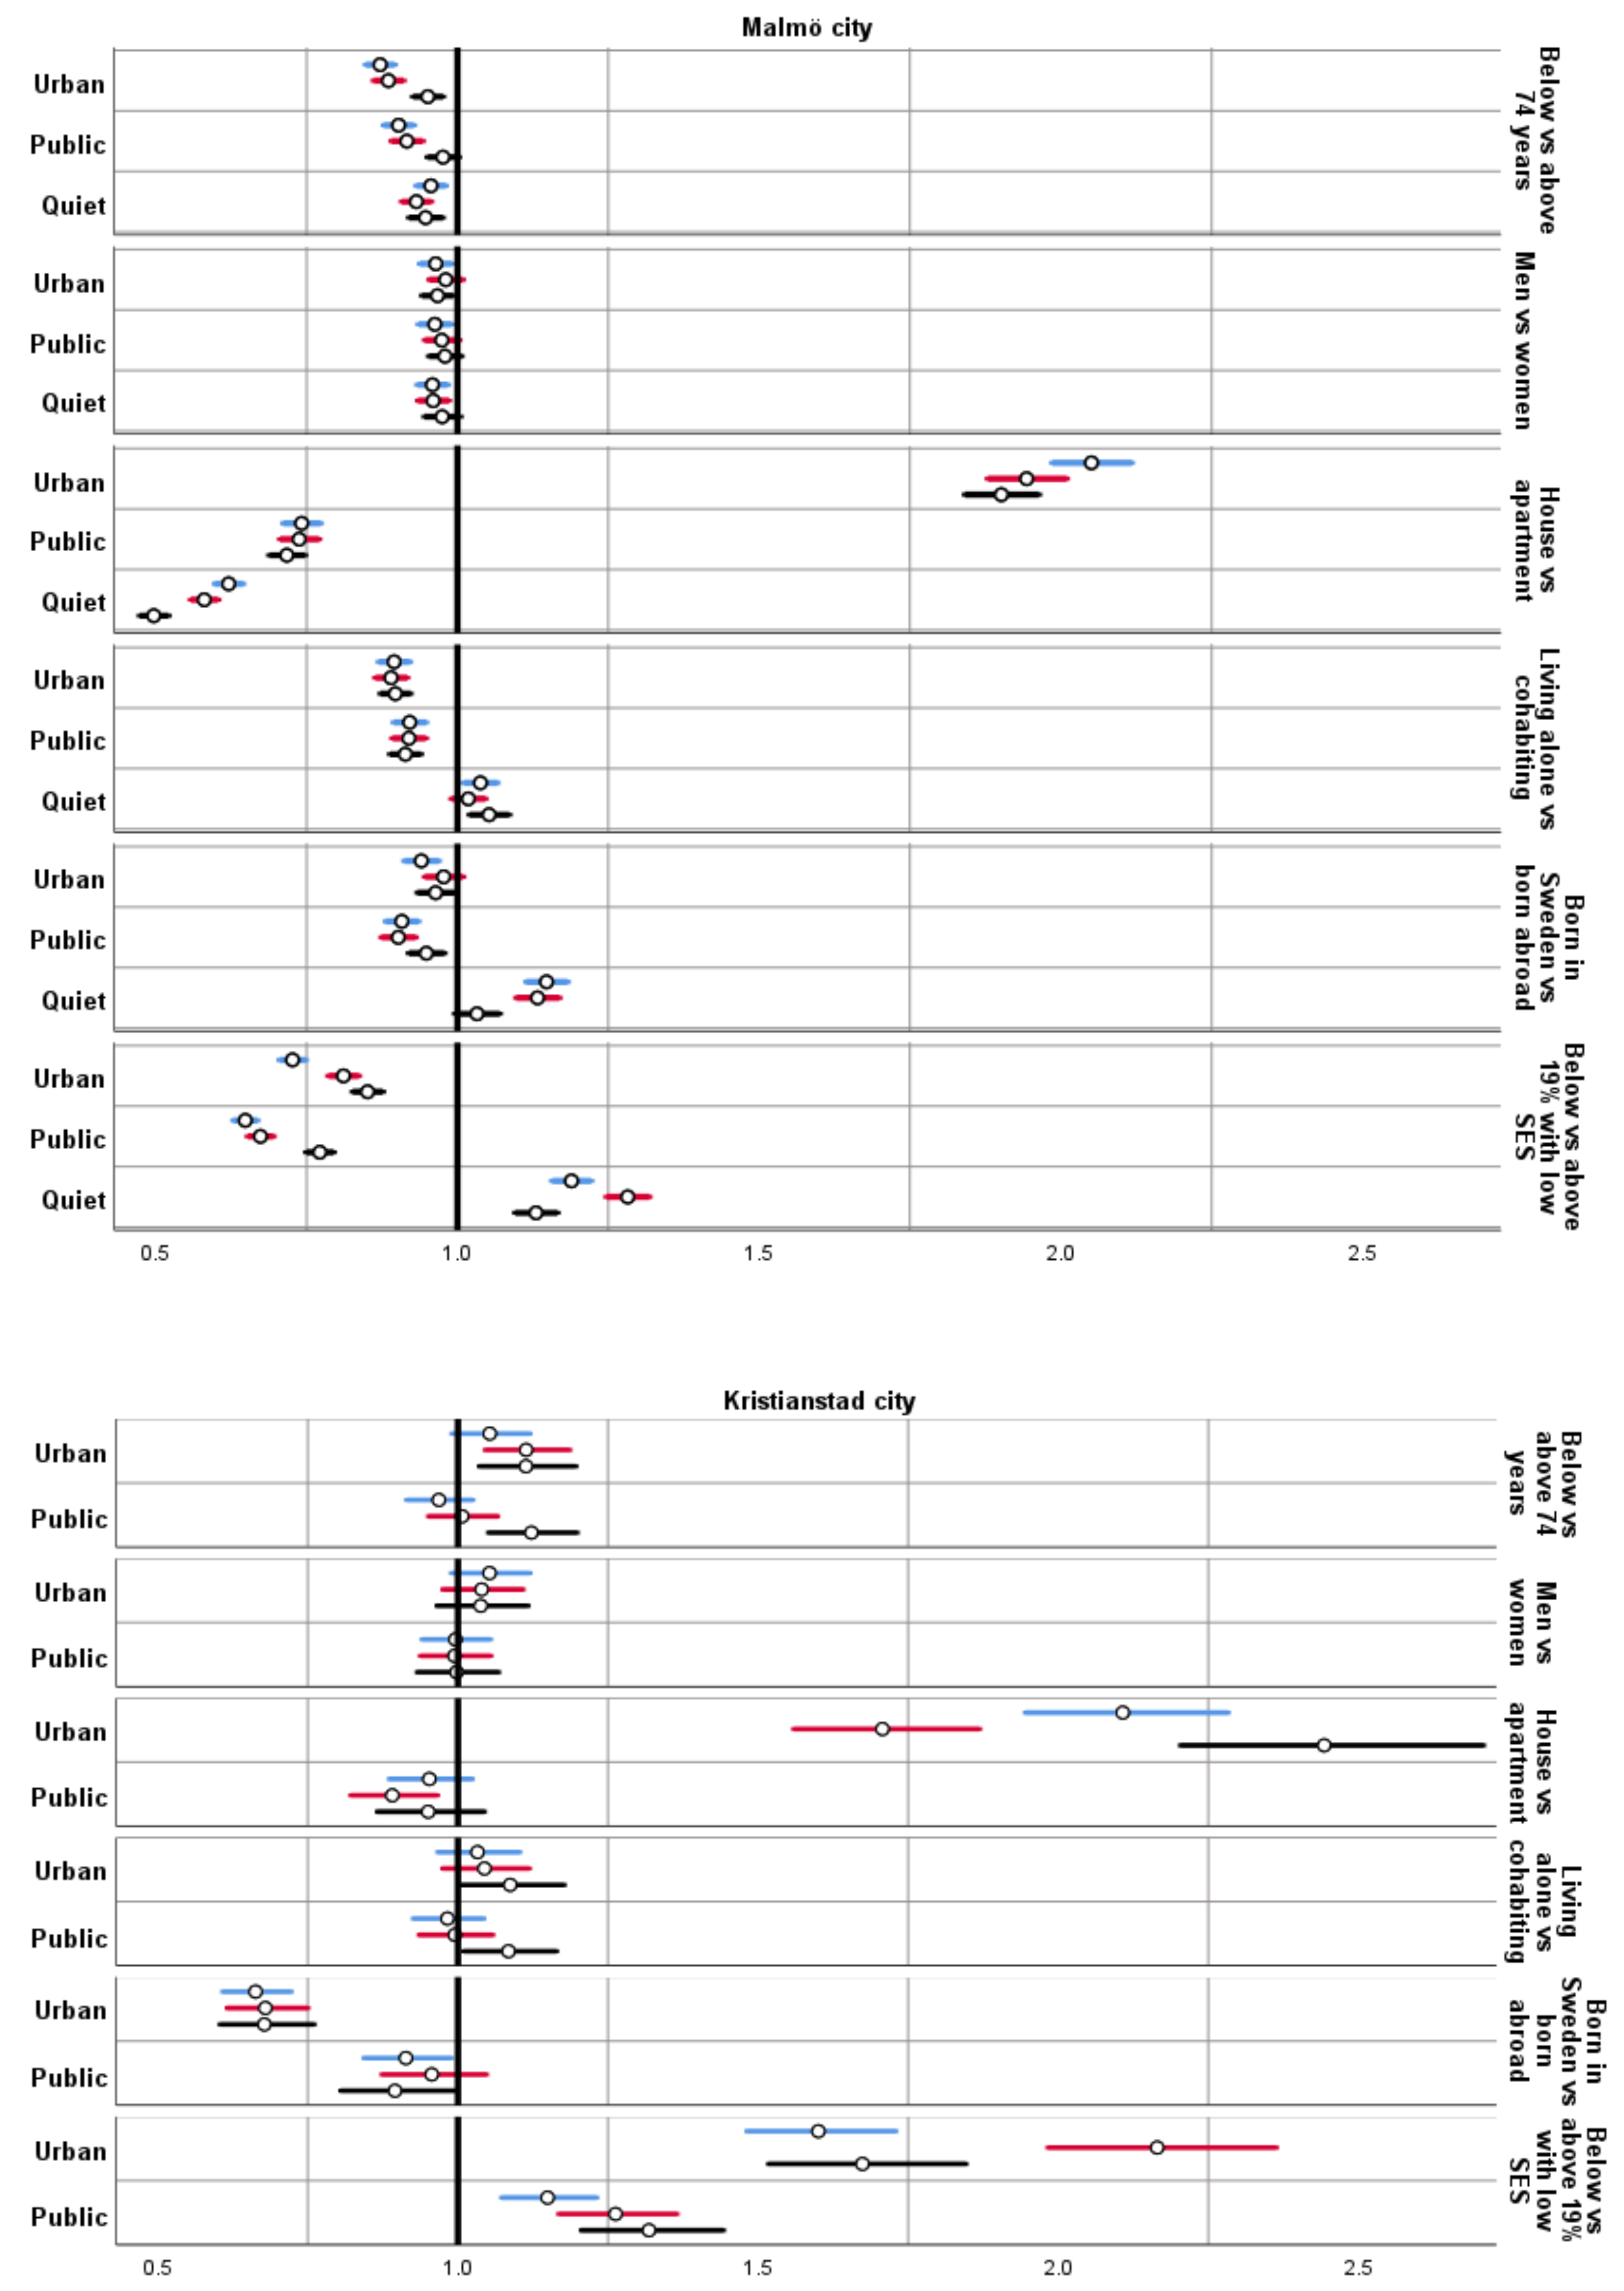
In Malmö, the younger old (aged 65–74 years), people living in apartments, and men consistently had lower availability of UGS within 300 m. People living alone, being born in Sweden, and residing in high SES areas, had lower availability to UGS and PGS within 300 m, but higher availability to QGS. In contrast, living in high SES areas in Kristianstad was associated with higher availability to UGS and PGS within 300 m.
Overall, the results found within Malmö and Kristianstad city were stable across model (crude and adjusted) and for all years for most associations between all measures of UGS within 300 m and the sociodemographic variables. The geographical context seemed to be of some importance as the associations were different for the two municipalities for some of the variables (age, cohabiting, and area level SES), but similar for others (sex, housing, and place of birth). The influence of the geographical context on these associations is complex, and most likely include differences in both the spatial distribution of UGS and sociodemographic groups.
The older part of the Malmö study population (i.e., those aged 74+, depending on year) had more of UGS, PGS, and QGS within 300 m available than those 65–74 years, respectively. As increasing age is associated with increased limitations in mobility, having more green space near your residence may be more beneficial the older a person becomes. A Chinese study on persons aged 65 years or older (with an oversampling of those aged 80 years or older) found that the quartile with the highest residential green (measured as NDVI within 500 m from the residence) had 14% lower odds of frailty then the lowest quartile [
34]. This indicates a protective effect on health from availability of UGS. The high availability among 74+ in Malmö is thereby positive from a health perspective.
There was only small difference between men and women in availability of all measures of UGS within 300 m, although men in Malmö had slightly lower availability. A recent review conclude that women’s physical health is more positively affected by having availability to UGS [
17]. Even so recent research from the UK has found sex difference in the protective effect from green spaces, in that men seemed to benefit more in relation to some health outcomes [
35].
Those living in single-family houses had more UGS within 300 m but less PGS and QGS available. The higher availability of UGS is to be expected as private gardens are included in this measure. Moreover, it is fair to assume that city planners are more likely to place PGS and QGS in residential areas where few residents have their own garden. Even so, public parks and recreational areas may provide opportunities for physical activity, social interaction and recovery that are not possible in private gardens in the same way as the opposite can be true. Thus, high availability of UGS may not necessarily balance out low availability of PGS and QGS or vice versa.
Those living alone in Malmö had less UGS and PGS within 300 m available. This can be considered as negative from a wellbeing perspective as those living alone has been found to have a stronger protective effect against from UGS in relation to loneliness [
36].
Being born abroad was associated with having more UGS and PGS within 300 m available in general. Thus, our findings did not indicate any environmental injustice in relation to country of origin, but rather the opposite. However, people born abroad were less likely to have more QGS within 300 m available. Thus, when including a qualitative measure of green space, environmental injustice was evident. A possible explanation for this is that being born abroad is a proxy of SES, and that areas with low SES in general are located closer to the ring roads in Malmö, i.e., areas where quiet space is scarce. The group of older people (65+ years) being born abroad is heterogenous and includes people from all countries other than Sweden, including, e.g., EU and other western countries. However, in Malmö in 2019, the three largest groups of non-Swedish born were from Iraq, Syria, and former Yugoslavia [
27]. Thus, most of the people being born abroad in the study population can be assumed to be people from low income and/or conflict areas who have been forced to migrate and are more likely to have low SES.
In Malmö, those living in a high SES area had availability to less UGS and PGS within 300 m compared to those living in low SES areas. In contrast, in Kristianstad, with more UGS and PGS within 300 m found for those living in area with high SES. This is in line with findings from a study from Stockholm that showed a negative association with socioeconomic status and greenness (less green) for larger municipalities and the opposite for smaller ones [
4]. Interestingly, in contrast to UGS and PGS within 300 m, in our study, living in low SES areas was associated with less QGS. This could potentially indicate environmental injustice when including a qualitative measure of the green space.
4.1. Strengths and Weaknesses
In the present study, we based all measures of greenness on amount of vegetation. We also tried to introduce quality aspects by including noise levels as well as publicly availability. Even so, these are only a few of the many aspects related to the usage and quality of UGS. Other important aspects include aesthetics and attractions, biodiversity, amenities, safety, usage, and facilities [
37]. Thus, the measures used in the present study cover only a part of UGS quality. Even so, considering the complexity of actual impact on health of different qualities of UGS, including a large number of potential pathways, we believe that assessing total and publicly available UGS provides a collected measure of potential pathways, even though it does not allow us to differentiate between them.
There is currently no golden standard for measuring UGS. A recent review found that when studying associations with mental health, buffer distances of 300 m or shorter were often used, and for physical health between 300 m and 1000 m (not focusing specifically on older persons) [
33]. In the present study, as the study population was 65 years or older, a buffer distance in the lower end of this range was considered as most relevant in relation to mobility (especially among the old-old). Thus, we chose to use the percentage of total, publicly available, and quiet green spaces, respectively, within a 300 m buffer from the residential address. We also included sensitivity analyses using a 100 m buffer. The correlations between 100 m and 300 m were high and the patterns of the RRs across the different measures of UGS were similar, thus strengthening the results.
Modelled noise levels were only available for 2016. Assuming that the noise levels were the same in 2010, 2015 and 2019, may cause a certain degree of misclassification. A study from Gothenburg studying historical noise levels found that noise exposure for individuals over time had increased [
38], suggesting that there might be some over estimation of noise levels in 2010 and underestimation in 2019. However, the cohorts in the present study are rather close in time to modelled noise levels, so the extent of this error is most likely limited.
4.2. Generalizability and Future Studies
The results from this study, and similar studies, can be used as a basis for decision-making in relation to interventions for specific sociodemographic groups may be in greatest need of interventions. If doing so, it is important to consider that there is a risk of driving gentrification through increasing UGS, i.e., making neighborhoods more attractive and pushing away residents with lower SES [
39].
In this study the availability of UGS, PGS and QGS within 300 m were used as measures of different types of UGS. However, further studies should include qualitative aspects to provide urban planners with better basis for decisions. Such qualities may include aspects such as serenity, wilderness, species richness, spaciousness, and cultural history [
12] as well as maintenance and perceived security are also important [
40]. With this said, potential pathways by which UGS can have a positive effect on health include increased physical activity, more social interaction, improved air quality and stress reduction [
41]. Understanding the complexity of qualities of UGS and their importance for health requires further investigation to better be understood. Even so, we believe that the measures of different types of UGS could be used to better understand the associations between green space and health. Other important aspects could be to measure accessibility or actual usage of the UGS to provide even better basis for decision-makers.


 ,
, 


