
A Systematic Review of Salt Taste Function and Perception Impairments in Adults with Chronic Kidney Disease

 ,
,  ,
,
Abstract
:1. Introduction
2. Materials and Methods
2.1. Search Strategy
2.2. Study Screening and Selection
2.3. Eligibility Criteria
2.4. Data Extraction
2.5. Assessment of Study Quality
3. Results
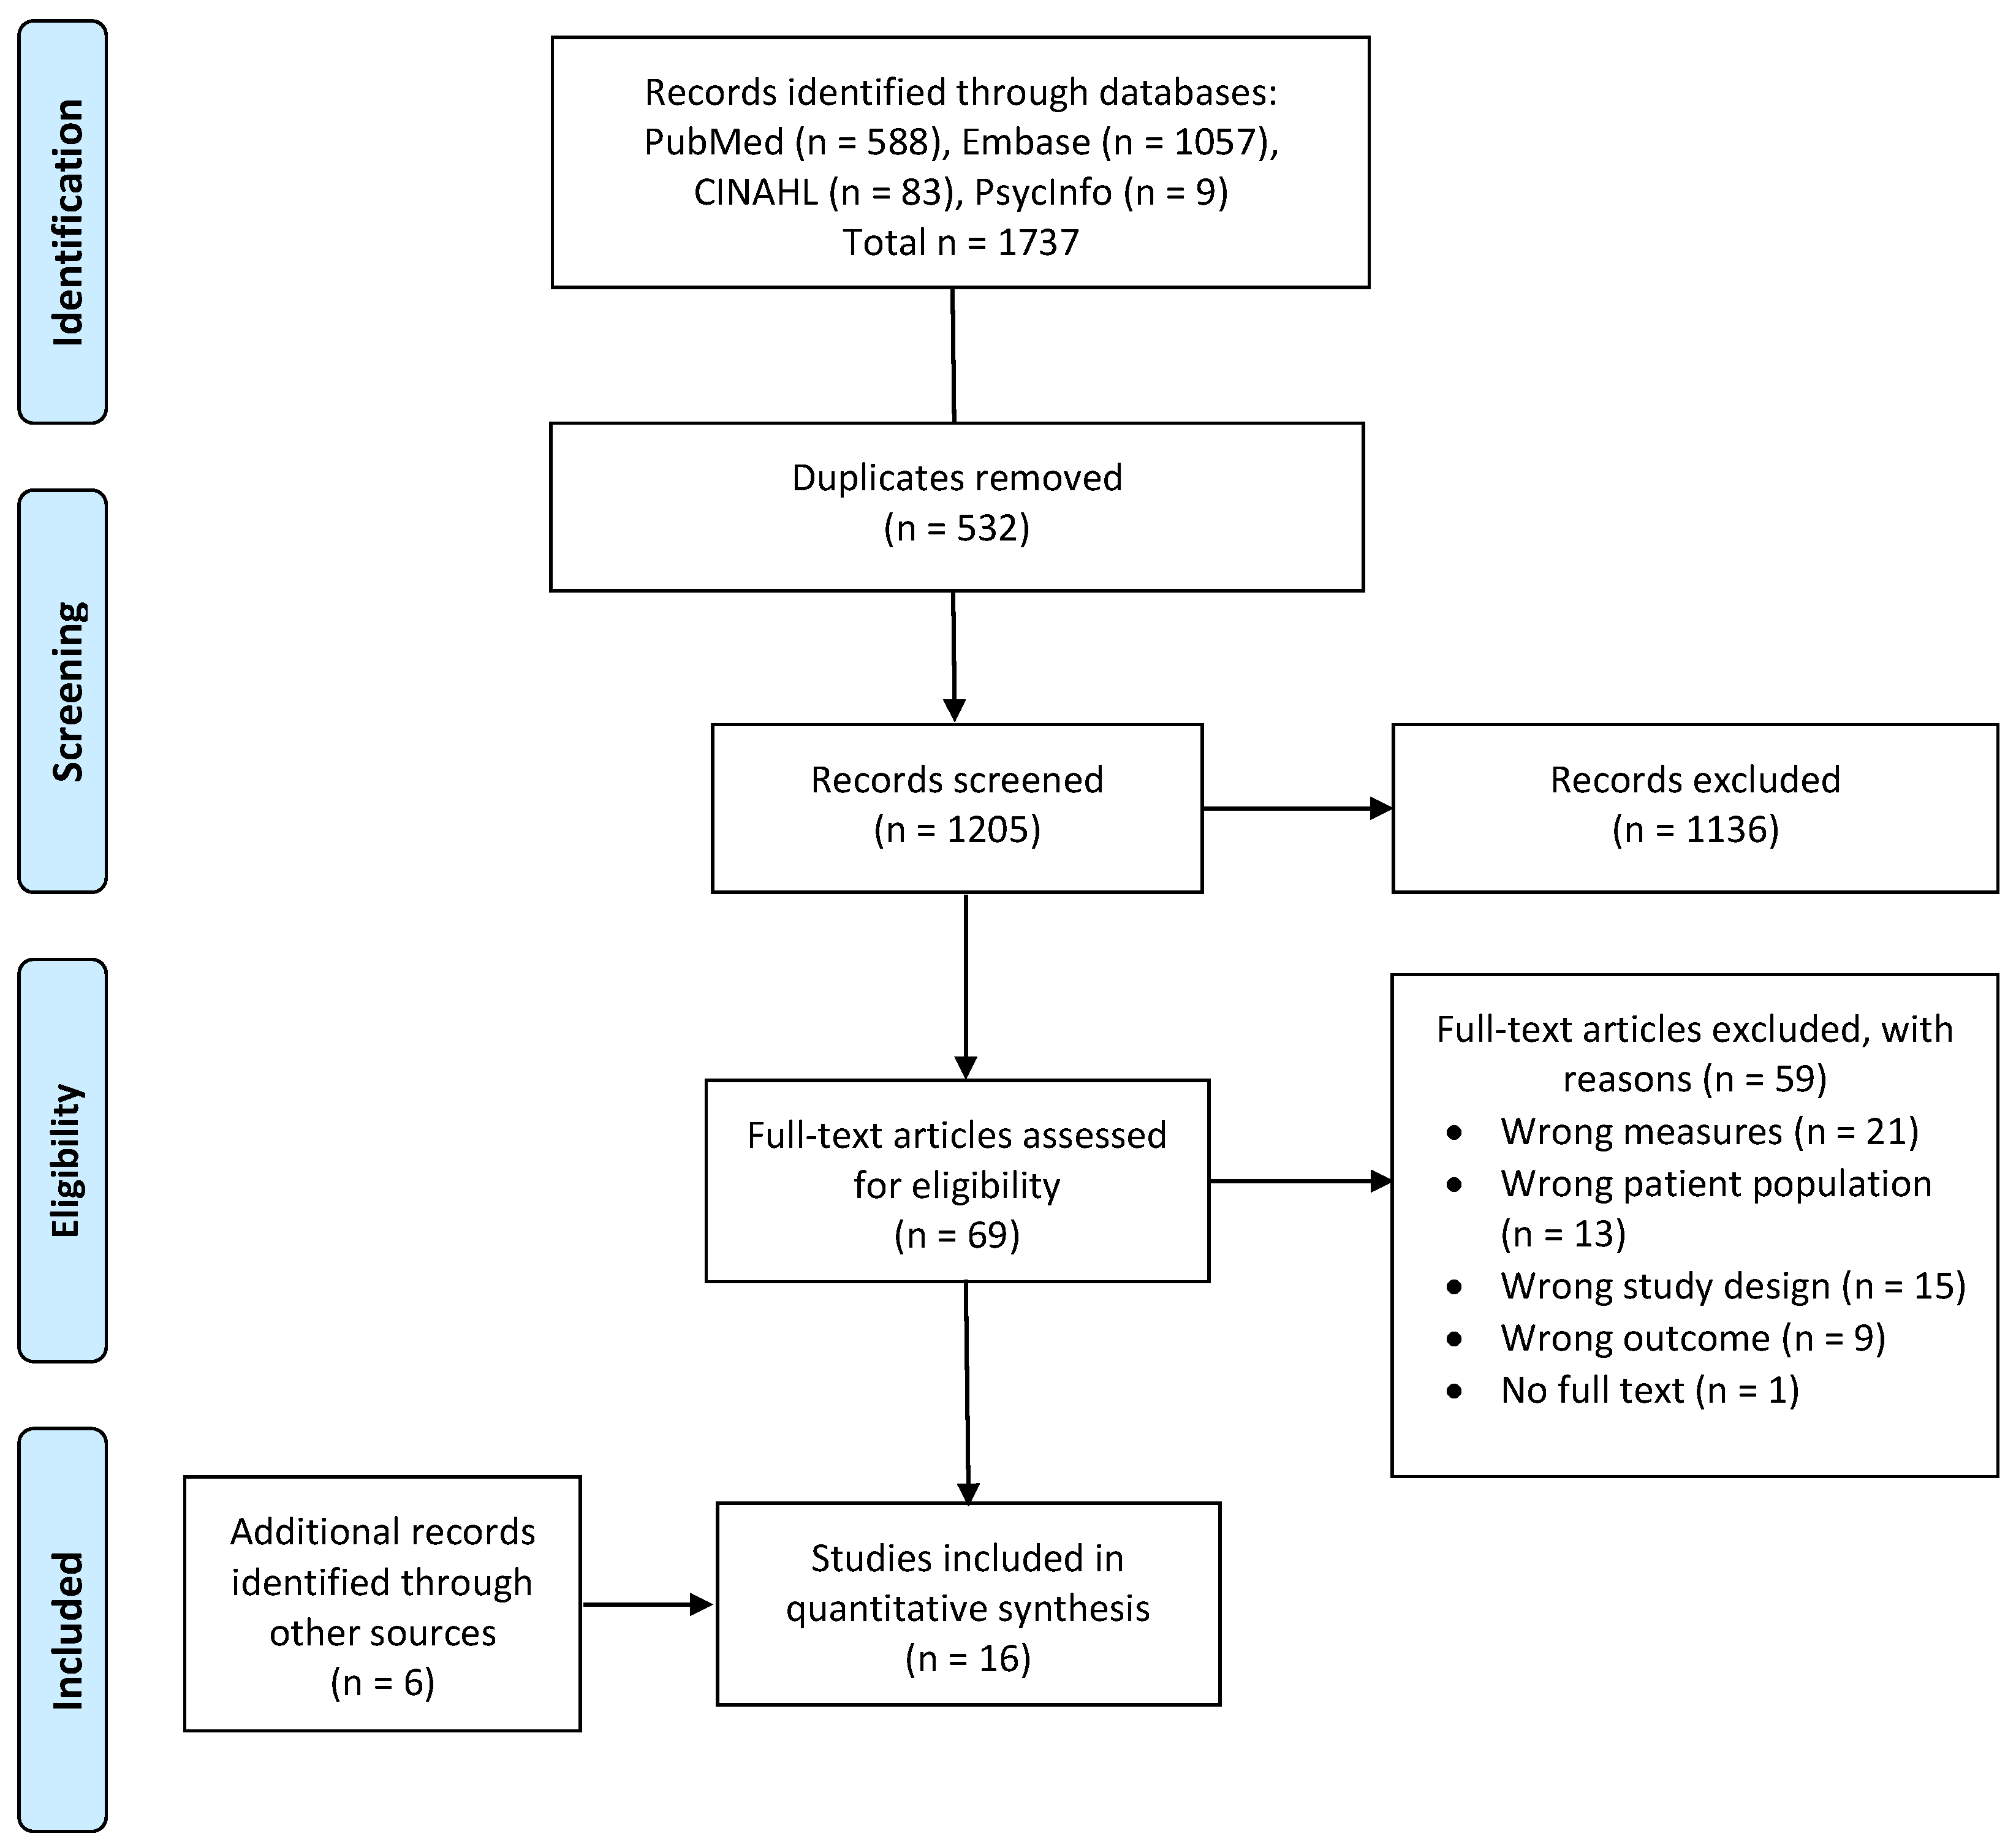
3.1. Search Results and Study Quality
3.2. Study Characteristics
3.3. Detection Threshold, Recognition Threshold, and Perceived Salt Taste Intensity
3.4. Salt Taste Hedonics
3.5. Other Relevant Findings
4. Discussion
5. Conclusions
Author Contributions
Funding
Institutional Review Board Statement
Informed Consent Statement
Data Availability Statement
Conflicts of Interest
References
- Bikbov, B.; Purcell, C.A.; Levey, A.S.; Smith, M.; Abdoli, A.; Abebe, M.; Adebayo, O.M.; Afarideh, M.; Agarwal, S.K.; Agudelo-Botero, M. Global, regional, and national burden of chronic kidney disease, 1990–2017: A systematic analysis for the Global Burden of Disease Study 2017. Lancet 2020, 395, 709–733. [Google Scholar] [CrossRef] [Green Version]
- Levey, A.S.; Coresh, J. Chronic kidney disease. Lancet 2012, 379, 165–180. [Google Scholar] [CrossRef]
- Webster, A.C.; Nagler, E.V.; Morton, R.L.; Masson, P. Chronic kidney disease. Lancet 2017, 389, 1238–1252. [Google Scholar] [CrossRef]
- Cheung, A.K.; Chang, T.I.; Cushman, W.C.; Furth, S.L.; Ix, J.H.; Pecoits-Filho, R.; Perkovic, V.; Sarnak, M.J.; Tobe, S.W.; Tomson, C.R.; et al. Blood pressure in chronic kidney disease: Conclusions from a Kidney Disease: Improving Global Outcomes (KDIGO) Controversies Conference. Kidney Int. 2019, 95, 1027–1036. [Google Scholar] [CrossRef]
- Ravera, M.; Re, M.; Deferrari, L.; Vettoretti, S.; Deferrari, G. Importance of Blood Pressure Control in Chronic Kidney Disease. J. Am. Soc. Nephrol. 2006, 17, S98–S103. [Google Scholar] [CrossRef] [Green Version]
- Lewis, J.B. Blood pressure control in chronic kidney disease: Is less really more? J. Am. Soc. Nephrol. 2010, 21, 1086–1092. [Google Scholar] [CrossRef] [Green Version]
- Garofalo, C.; Borrelli, S.; Provenzano, M.; De Stefano, T.; Vita, C.; Chiodini, P.; Minutolo, R.; De Nicola, L.; Conte, G. Dietary Salt Restriction in Chronic Kidney Disease: A Meta-Analysis of Randomized Clinical Trials. Nutrients 2018, 10, 732. [Google Scholar] [CrossRef] [Green Version]
- Borrelli, S.; Provenzano, M.; Gagliardi, I.; Michael, A.; Liberti, M.E.; De Nicola, L.; Conte, G.; Garofalo, C.; Andreucci, M. Sodium Intake and Chronic Kidney Disease. Int. J. Mol. Sci. 2020, 21, 4744. [Google Scholar] [CrossRef]
- Krikken, J.A.; Laverman, G.D.; Navis, G. Benefits of dietary sodium restriction in the management of chronic kidney disease. Curr. Opin. Nephrol. Hypertens. 2009, 18, 531–538. [Google Scholar] [CrossRef]
- McMahon, E.J.; Campbell, K.L.; Mudge, D.W.; Bauer, J.D. Achieving Salt Restriction in Chronic Kidney Disease. Int. J. Nephrol. 2012, 2012, 720429. [Google Scholar] [CrossRef]
- Tan, S.-Y.; Sotirelis, E.; Bojeh, R.; Maan, I.; Medalle, M.; Chik, X.S.F.; Keast, R.; Tucker, R.M. Is dietary intake associated with salt taste function and perception in adults? A systematic review. Food Qual. Prefer. 2021, 92, 104174. [Google Scholar] [CrossRef]
- Tanaka, M.; Nishiwaki, H.; Kado, H.; Doi, Y.; Ihoriya, C.; Omae, K.; Tamagaki, K. Impact of salt taste dysfunction on interdialytic weight gain for hemodialysis patients; a cross-sectional study. BMC Nephrol. 2019, 20, 121. [Google Scholar] [CrossRef] [Green Version]
- Astback, J.; Fernstrom, A.; Hylander, B.; Arvidson, K.; Johansson, O. Taste buds and neuronal markers in patients with chronic renal failure. Perit. Dial. Int. 1999, 19 (Suppl. S2), S315–S323. [Google Scholar] [CrossRef]
- Matsuo, R. Role of Saliva in the Maintenance of Taste Sensitivity. Crit. Rev. Oral Biol. Med. 2000, 11, 216–229. [Google Scholar] [CrossRef] [Green Version]
- Kaushik, A.; Reddy, S.; Umesh, L.; Devi, B.K.Y.; Santana, N.; Rakesh, N. Oral and salivary changes among renal patients undergoing hemodialysis: A cross-sectional study. Indian J. Nephrol. 2013, 23, 125–129. [Google Scholar] [CrossRef]
- Anuradha, B.R.; Katta, S.; Kode, V.S.; Praveena, C.; Sathe, N.; Sandeep, N.; Penumarty, S. Oral and salivary changes in patients with chronic kidney disease: A clinical and biochemical study. J. Indian Soc. Periodontol. 2015, 19, 297–301. [Google Scholar] [CrossRef]
- Kho, H.-S.; Lee, S.-W.; Chung, S.-C.; Kim, Y.-K. Oral manifestations and salivary flow rate, pH, and buffer capacity in patients with end-stage renal disease undergoing hemodialysis. Oral Surg. Oral Med. Oral Pathol. Oral Radiol. Endodontol. 1999, 88, 316–319. [Google Scholar] [CrossRef]
- Tomás, I.; Marinho, J.; Limeres, J.; Santos, M.; Araújo, L.; Diz, P. Changes in salivary composition in patients with renal failure. Arch. Oral Biol. 2008, 53, 528–532. [Google Scholar] [CrossRef]
- Martins, C.; Siqueira, W.L.; Oliveira, E.; Primo, L.S.d.S.G.; Nicolau, J. Salivary analysis of patients with chronic renal failure undergoing hemodialysis. Spéc. Care Dent. 2006, 26, 205–208. [Google Scholar] [CrossRef]
- Manley, K.J. Saliva composition and upper gastrointestinal symptoms in chronic kidney disease. J. Ren. Care 2014, 40, 172–179. [Google Scholar] [CrossRef]
- Keast, R.S.; Breslin, P.A.; Beauchamp, G.K. Suppression of bitterness using sodium salts. Chim. Int. J. Chem. 2001, 55, 441–447. [Google Scholar] [CrossRef]
- Kim, S.M.; Kim, M.; Lee, E.K.; Kim, S.B.; Chang, J.W.; Kim, H.W. The effect of zinc deficiency on salt taste acuity, preference, and dietary sodium intake in hemodialysis patients. Hemodial. Int. 2016, 20, 441–446. [Google Scholar] [CrossRef]
- Shepherd, R.; Farleigh, C.A.; Pryor, J.S. Changes in Salt Taste in Dialysis and Their Relationship to Blood Constituents. Percept. Mot. Ski. 1986, 62, 343–347. [Google Scholar] [CrossRef]
- Atkin-Thor, E.; Goddard, B.W.; O’Nion, J.; Stephen, R.L.; Kolff, W.J. Hypogeusia and zinc depletion in chronic dialysis patients. Am. J. Clin. Nutr. 1978, 31, 1948–1951. [Google Scholar] [CrossRef]
- Brennan, F.; Stevenson, J.; Brown, M. The Pathophysiology and Management of Taste Changes in Chronic Kidney Disease: A Review. J. Ren. Nutr. 2020, 30, 368–379. [Google Scholar] [CrossRef]
- Academy of Nutrition and Dietetics Evidence Analysis Manual: Steps in the Academy Evidence Analysis Process. Available online: https://www.andeal.org/evidence-analysis-manual (accessed on 21 August 2022).
- Burge, J.C.; Park, H.S.; Whitlock, C.P.; Schemmel, R.A. Taste acuity in patients undergoing long-term hemodialysis. Kidney Int. 1979, 15, 49–53. [Google Scholar] [CrossRef] [Green Version]
- Ciechanover, M.; Peresecenschi, G.; Aviram, A.; Steiner, J.E. Malrecognition of Taste in Uremia. Nephron Exp. Nephrol. 1980, 26, 20–22. [Google Scholar] [CrossRef]
- Kim, T.H.; Kim, Y.H.; Bae, N.Y.; Kang, S.S.; Lee, J.B.; Kim, S.B. Salty taste thresholds and preference in patients with chronic kidney disease according to disease stage: A cross-sectional study. Nutr. Diet. 2017, 75, 59–64. [Google Scholar] [CrossRef] [PubMed]
- Kusaba, T.; Mori, Y.; Masami, O.; Hiroko, N.; Adachi, T.; Sugishita, C.; Sonomura, K.; Kimura, T.; Kishimoto, N.; Nakagawa, H.; et al. Sodium restriction improves the gustatory threshold for salty taste in patients with chronic kidney disease. Kidney Int. 2009, 76, 638–643. [Google Scholar] [CrossRef] [PubMed] [Green Version]
- Manley, K.J.; Haryono, R.Y.; Keast, R.S. Taste changes and saliva composition in chronic kidney disease. Ren. Soc. Australas. J. 2012, 8, 56–60. [Google Scholar]
- Márquez-Herrera, R.M.; Núñez-Murillo, G.K.; Ruíz-Gurrola, C.G.; Gómez-García, E.F.; Orozco-González, C.N.; Cortes-Sanabria, L.; Cueto-Manzano, A.M.; Rojas-Campos, E. Clinical Taste Perception Test for Patients With End-Stage Kidney Disease on Dialysis. J. Ren. Nutr. 2020, 30, 79–84. [Google Scholar] [CrossRef]
- McMahon, E.J.; Campbell, K.L.; Bauer, J.D. Taste perception in kidney disease and relationship to dietary sodium intake. Appetite 2014, 83, 236–241. [Google Scholar] [CrossRef]
- Middleton, R.A.; Allman-Farinelli, M.A. Taste Sensitivity Is Altered in Patients with Chronic Renal Failure Receiving Continuous Ambulatory Peritoneal Dialysis. J. Nutr. 1999, 129, 122–125. [Google Scholar] [CrossRef] [Green Version]
- Tavares, A.P.D.S.R.; Mafra, D.; Leal, V.D.O.; Gama, M.D.S.; Vieira, R.M.M.D.F.; Brum, I.D.S.D.C.; Borges, N.A.; Silva, A.A. Zinc Plasma Status and Sensory Perception in Nondialysis Chronic Kidney Disease Patients. J. Ren. Nutr. 2021, 31, 257–262. [Google Scholar] [CrossRef]
- Vreman, H.J.; Venter, C.; Leegwater, J.; Oliver, C.; Weiner, M.W. Taste, Smell and Zinc Metabolism in Patients with Chronic Renal Failure. Nephron Exp. Nephrol. 1980, 26, 163–170. [Google Scholar] [CrossRef]
- Fernström, A.; Hylander, B.; Rössner, S. Taste acuity in patients with chronic renal failure. Clin. Nephrol. 1996, 45, 169–174. [Google Scholar]
- Fitzgerald, C.; Wiese, G.; Moorthi, R.N.; Moe, S.M.; Gallant, K.H.; Running, C. Characterizing Dysgeusia in Hemodialysis Patients. Chem. Senses 2019, 44, 165–171. [Google Scholar] [CrossRef]
- Hurley, R.S.; Hebert, L.A.; Rypien, A.B. A comparison of taste acuity for salt in renal patients vs. normal subjects. J. Am. Diet. Assoc. 1987, 87, 1531–1534. [Google Scholar] [CrossRef]
- Shepherd, R.; Farleigh, C.; Atkinson, C.; Pryor, J. Effects of haemodialysis on taste and thirst. Appetite 1987, 9, 79–88. [Google Scholar] [CrossRef]
- Yusuf, T.; Raji, Y.R.; Lasisi, T.J.; Daniel, A.; Bamidele, O.T.; Fasunla, A.J.; Lasisi, O.A. Effect of Chronic Kidney Disease on Taste Function: A Case Control Study among Nigerian. Indian J. Otolaryngol. Head Neck Surg. 2021, 1–8. [Google Scholar] [CrossRef]
- Dobell, E.; Chan, M.; Williams, P.; Allman, M. Food preferences and food habits of patients with chronic renal failure undergoing dialysis. J. Am. Diet. Assoc. 1993, 93, 1129–1135. [Google Scholar] [CrossRef]
- Magriplis, E.; Farajian, P.; Pounis, G.D.; Risvas, G.; Panagiotakos, D.B.; Zampelas, A. High sodium intake of children through ‘hidden’ food sources and its association with the Mediterranean diet: The GRECO study. J. Hypertens. 2011, 29, 1069–1076. [Google Scholar] [CrossRef] [PubMed]
- Anderson, C.A.; Appel, L.J.; Okuda, N.; Brown, I.J.; Chan, Q.; Zhao, L.; Ueshima, H.; Kesteloot, H.; Miura, K.; Curb, J.D.; et al. Dietary Sources of Sodium in China, Japan, the United Kingdom, and the United States, Women and Men Aged 40 to 59 Years: The INTERMAP Study. J. Am. Diet. Assoc. 2010, 110, 736–745. [Google Scholar] [CrossRef] [PubMed] [Green Version]
- Oka, Y.; Butnaru, M.; von Buchholtz, L.; Ryba, N.J.P.; Zuker, C.S. High salt recruits aversive taste pathways. Nature 2013, 494, 472–475. [Google Scholar] [CrossRef] [Green Version]
- Dougher, C.E.; Rifkin, D.; Anderson, C.A.; Smits, G.; Persky, M.S.; A. Block, G.; Ix, J.H. Spot urine sodium measurements do not accurately estimate dietary sodium intake in chronic kidney disease. Am. J. Clin. Nutr. 2016, 104, 298–305. [Google Scholar] [CrossRef] [Green Version]
- Charlton, K.; Schutte, A.; Wepener, L.; Corso, B.; Kowal, P.; Ware, L. Correcting for Intra-Individual Variability in Sodium Excretion in Spot Urine Samples Does Not Improve the Ability to Predict 24 h Urinary Sodium Excretion. Nutrients 2020, 12, 2026. [Google Scholar] [CrossRef]
- Burrowes, J.D.; Larive, B.; Cockram, D.B.; Dwyer, J.; Kusek, J.W.; McLeroy, S.; Poole, D.; Rocco, M.V. Effects of dietary intake, appetite, and eating habits on dialysis and non-dialysis treatment days in hemodialysis patients: Cross-sectional results From the HEMO study. J. Ren. Nutr. 2003, 13, 191–198. [Google Scholar] [CrossRef]
- Tan, S.-Y.; Hack, C.; Yu, C.; Rennick, I.; Ohanian, J.; Dezan, M.; Mott, N.; Manibo, R.; Tucker, R.M. Alterations in sweet taste function in adults with diabetes mellitus: A systematic review and potential implications. Crit. Rev. Food Sci. Nutr. 2021, 1–13. [Google Scholar] [CrossRef]
- Schiffman, S.S.; Lockhead, E.; Maes, F.W. Amiloride reduces the taste intensity of Na+ and Li+ salts and sweeteners. Proc. Natl. Acad. Sci. USA 1983, 80, 6136–6140. [Google Scholar] [CrossRef] [Green Version]
- Golik, A.; Modai, D.; Weissgarten, J.; Cohen, N.; Averbukh, Z.; Sigler, E.; Zaidenstein, R.; Shaked, U. Hydrochlorothiazide-amiloride causes excessive urinary zinc excretion. Clin. Pharmacol. Ther. 1987, 42, 42–44. [Google Scholar] [CrossRef]
- Wester, P.O. Urinary Zinc Excretion during Treatment with Different Diuretics. Acta Med. Scand. 2009, 208, 209–212. [Google Scholar] [CrossRef]
- Mountokalakis, T.; Dourakis, S.; Karatzas, N.; Maravelias, C.; Koutselinis, A. Zinc deficiency in mild hypertensive patients treated with diuretics. J. Hypertens. Suppl. Off. J. Int. Soc. Hypertens. 1984, 2, S571–S572. [Google Scholar]
- Chiba, M.; Katayama, K.; Takeda, R.; Morita, R.; Iwahashi, K.; Onishi, Y.; Kita, H.; Nishio, A.; Kanno, T.; Saito, T.; et al. Diuretics aggravate zinc deficiency in patients with liver cirrhosis by increasing zinc excretion in urine. Hepatol. Res. 2012, 43, 365–373. [Google Scholar] [CrossRef]


| Author | Relevance 1 | Validity 1 | Quality Rating | ||||||||||||
|---|---|---|---|---|---|---|---|---|---|---|---|---|---|---|---|
| Q1 | Q2 | Q3 | Q4 | Q1 | Q2 | Q3 | Q4 | Q5 | Q6 | Q7 | Q8 | Q9 | Q10 | ||
| Burge 1979 [27] | Y | Y | Y | N/A | Y | N | Y | N | U | Y | Y | U | Y | U | Neutral |
| Ciechanover 1980 [28] | Y | Y | Y | N/A | Y | U | Y | N/A | N | U | N | Y | Y | U | Neutral |
| Dobell 1993 [42] | N/A | Y | Y | N/A | Y | Y | Y | N/A | N | Y | N | Y | Y | N | Neutral |
| Fernstrom 1996 [37] | N/A | Y | Y | N/A | Y | Y | Y | N/A | Y | Y | Y | Y | Y | N | Positive |
| Fitzgerald 2019 [38] | Y | Y | Y | NA | Y | Y | Y | U | U | Y | Y | Y | Y | Y | Positive |
| Hurley 1987 [39] | Y | Y | Y | N/A | Y | Y | Y | N | N | Y | Y | Y | Y | Y | Positive |
| Kim 2018 [29] | Y | Y | Y | N/A | Y | Y | Y | N/A | N | Y | Y | Y | Y | Y | Positive |
| Kusaba 2009 [30] | Y | Y | Y | N/A | Y | Y | Y | N | N | Y | Y | Y | Y | Y | Positive |
| Manley 2012 [31] | N/A | Y | Y | N/A | Y | Y | Y | N/A | N | Y | Y | Y | Y | Y | Positive |
| Márquez-Herrera 2020 [32] | N/A | Y | Y | N/A | Y | Y | Y | N/A | Y | Y | Y | Y | Y | Y | Positive |
| McMahon 2014 [33] | N/A | Y | Y | N/A | Y | Y | Y | N/A | U | Y | Y | Y | Y | Y | Positive |
| Middleton 1999 [34] | Y | Y | Y | N/A | Y | Y | Y | N/A | U | Y | Y | Y | Y | N | Positive |
| Shephard 1987 [40] | Y | Y | Y | N/A | Y | Y | Y | Y | U | Y | Y | Y | Y | Y | Positive |
| Tavares 2021 [35] | N/A | Y | Y | N/A | Y | Y | Y | N | Y | Y | Y | Y | Y | Y | Positive |
| Vreman 1980 [36] | N/A | Y | Y | N/A | Y | Y | N | N/A | Y | Y | Y | Y | Y | N | Neutral |
| Yusuf 2021 [41] | N/A | Y | Y | N/A | Y | Y | Y | N/A | Y | Y | Y | Y | Y | N | Positive |
| Author, Year | Country | Study Design | CKD Participants 1 | Controls | Salt Taste Measurements 2 | Other Tastes 2 | Dietary Intake 2 | ||
|---|---|---|---|---|---|---|---|---|---|
| DT/RT | Intensity | Hedonics | |||||||
| Burge 1979 [27] | USA | Cross-sectional | n = 18 (9 Males 9 Females) Mean age = 46.5 years (range 17–65 years) | n = 10, age- and sex-matched with CKD Mean age = 45.8 years | RT | - | - | ✓ | - |
| Ciechanover 1980 [28] | Israel | Cross-sectional | Various stages of CKD (creatinine clearance 8–60 mL/min), n = 20, age range 25–77 years CKD with HD for >1 year, n = 23, age range 24–73 years | Controls consisted of:
| RT | - | - | ✓ | - |
| Dobell 1993 [42] | Australia | Cross-sectional | HD: n = 33 (19 Males 14 Females). Age: 19–59 years (n = 23); ≥60 years (n = 10), BMI: <20 kgm−2 (n = 6), 20–25 kgm−2 (n = 14), >25 kgm−2 (n = 13), time on dialysis: <1 year (n = 4), 1–5 years (n = 18), >5 years (n = 11) CAPD: n = 17 (9 Males 8 Females). Age: 19–59 years (n = 3); ≥60 years (n = 14), BMI: <20 kgm−2 (n = 3), 20–25 kgm−2 (n = 8), >25 kgm−2 (n = 6), time on dialysis: <1 year (n = 10), 1–5 years (n = 6), >5 years (n = 1) | n = 30 (14 Males 16 Females), adults with normal renal function. Age: 19–59 years (n = 10); ≥60 years (n = 20), BMI: 20–25 kgm−2 (n = 17), >25 kgm−2 (n = 13) | - | - | ✓ | ✓ | - |
| Fernstrom 1996 [37] | Sweden | Cross-sectional | n = 57, consisted of:
| Healthy non-diabetic, n = 57, age, sex, BMI matched with CKD | RT | - | - | ✓ | - |
| Fitzgerald 2019 [38] | USA | Cross-sectional | CKD on maintenance HD, n = 17 (10 Males 7 Females) Age = 61 (range 23–87 years) | Control, n = 29 (13 Males 16 Females) Age = 32 years (range 21–61 years) | - | ✓ | ✓ | - | - |
| Hurley 1987 [39] | USA | Cross-sectional | CAPD, n = 10 HD, n = 10 Transplant, n = 10 Mean age of all groups 31.9–34.1 years | n = 10 | - | ✓ | ✓ | - | ✓ (3 d food records) |
| Kim 2018 [29] | Korea | Cross-sectional | CKD Stage 1–5, all non-dialysis, n = 436 (221 Males 215 Females), age = 55.5 ± 14.5 years
| n = 74 (35 Males 39 Females) Age = 57.5 ± 11.5 years, GFR = 95.2 ± 13.1 ml/min/1.73 m2 | DT & RT | - | ✓ | - | ✓ (spot urinary sodium excretion) |
| Kusaba 2009 [30] | Japan | RCT (baseline data used) | n = 29 (19 Males 10 Females) Age: 62.9 ± 15.9 years, diabetic nephropathy n = 10 | n = 11 (3 Males 8 Females) Age: 37.7 ± 8.62 years | DT & RT | - | - | - | ✓ (24 h urinary sodium excretion) |
| Manley 2012 [31] | Australia | Cross-sectional | n = 30 (24 Males 6 Females) Age = 69.7 ± 14.2 years, GFR = 16.53 ± 5.21 mL/min | n = 5 (1 Male 4 Females) Age = 44.6 ± 10.3 years, GFR = 85.20 ± 6.50 mL/min | RT | ✓ | ✓ | ✓ | - |
| Márquez-Herrera 2020 [32] | Mexico | Cross-sectional | n = 75 (43 HD 32 CAPD) Age = 30 (range 26–43 years), 45% males | n = 112 Age = 22 (range 21–30 years), 30% males | RT | ✓ | - | ✓ | - |
| McMahon 2014 [33] | Australia | Cross-sectional | CKD stage 3–5, GFR = 33.1 ± 12.7 mL/min/1.73 m2, n = 91 (71 Males 20 Females) Age = 65.9 ± 13.5 years, eight = 89.3 ± 22.1 kg, BMI = 30.6 ± 6.4 kgm−2 | n = 30 (14 Males 16 Females) Age = 55.2 ± 7.4 years, weight = 87.3 ± 19.0 kg, BMI = 29.7 ± 6.2 kgm−2 | RT | ✓ | - | ✓ | ✓ (40-item FFQ) |
| Middleton 1999 [34] | Australia | Cross-sectional | CKD on CAPD, n = 18 (11 Males 7 Females) Age = 52 ± 19.9 years, BMI = 23.6 ± 4.3 kgm−2, time receiving CAPD = 22 ± 14.3 months | n = 18 (11 Males 7 Females) Age = 52 ± 18.7 years, BMI = 24.1 ± 3.4 kgm−2 | DT | - | - | ✓ | - |
| Shephard 1987 [40] | UK | Prospective | CKD on HD, n = 15 (9 Males 6 Females) Age = 47 years (range 17–62 years), time on dialysis = 2.8 years (range 0.25–6.7 years), time on reduced sodium diets = 0.25–10 years | n = 14, were staff at research institute, matched for age with CKD | - | ✓ | ✓ | ✓ | - |
| Tavares 2021 [35] | Brazil | Cross-sectional | CKD (non-dialysis), n = 21 (11 Males 10 Females) Age = 51.1 ± 7.1 years, BMI = 27.92 ± 7.07 kgm−2 | n = 22 (10 Males 12 Females) Age = 49.8 ± 8.3 years, BMI = 28.48 ± 5.37 kgm−2 | RT | - | - | ✓ | - |
| Vreman 1980 [36] | USA | Cross-sectional | CKD, n = 7 (all males), age: 58 ± 3 years CKD on HD, n = 26 (20 Males 6 Females), age = 41 ± 9 years | n = 48 (23 Males 25 Females), age = 65 ± 3 years | DT | - | - | ✓ | - |
| Yusuf, 2021 [41] | Nigeria | Cross-sectional | GFR < 60 mL/min/ 1.73 m2 n = 100 (56 Males 44 Females) Age = 46.3 ± 13.9 years (range 19–86 y), weight = 64.6 ± 12.6 kg | Healthy controls n= 100 (52 Males, 48 Females), age, sex matched with CKD Age = 43.4 ± 14.9 years (range 20–85 years), weight = 70.7 ± 13.2 kg | RT | - | - | ✓ | - |
| (A) Detection Thresholds (n = 4) | |||
|---|---|---|---|
| Study | Assessment Methods | Salt Taste Findings | Other Relevant Findings |
| Kim 2018 [29] | Salt taste thresholds were tested using NaCl solutions at 0.01, 0.025, 0.05, 0.075, 0.10,0.125, 0.15, 0.20, 0.3, 0.4, and 0.5% (11 stages). Beginning with the lowest concentration, participants swished and expectorated 1 test solution + 2 water controls in random order. The lowest concentration that was correctly detected twice consecutively was determined as DT. | DT was significantly higher in CKD Stage 3 and Stage 5 participants than controls (p < 0.05). | DT did not correlate with spot urinary sodium concentrations (proxy indicator of sodium intake). |
| Kusaba 2009 [30] | Sodium-impregnated taste strips (0%, 0.6%, 0.8%, 1.0%, 1.2%, 1.4%, and 1.6%) were placed in the mouth (in increasing order), where participants were asked if a taste was detected, and if yes, which. Test was repeated until participants correctly identified the taste twice. | Significantly higher DT in CKD (0.74 ± 0.21%) than controls (0.64 ± 0.08%) (p < 0.05). A total of 39% CKD vs. 18% controls had DT > 0.8%. | DT did not correlate with 24 h urinary sodium excretion in CKD (proxy indicator of sodium intake). Serum zinc negatively associated with DT in CKD (r = −0.67, p < 0.05). Significant higher DT in diabetic nephropathy (0.88 ± 0.28%) than non-diabetic CKD (0.66 ± 0.12%) (p < 0.05). Significantly higher DT in CKD treated with diuretics. |
| Middleton 1999 [34] | Multiple forced-choice solution presentation was performed in ascending order. Three cups (1 test solution + 2 controls) were presented in a pre-randomised order. Participants swished and expectorated the solutions and chose the one that was perceived to be different. NaCl solutions were presented in 11 concentrations ranging from 0.1 mmol/L to 31 mmol/L. | Significantly higher DT for salt taste was found in CAPD than controls (p = 0.001). | Significantly higher DT for bitter taste in CAPD than controls (p = 0.01). No differences were found for sweet and sour tastes. No significant correlations between DT and the length of CAPD, serum urea, and creatinine. |
| Vreman 1980 [36] | In ascending fashion, one of 14 NaCl solutions (ranging from 0.244 mM to 2000 mM) was presented together with 2 water controls in random order, and participants indicated which solution differed from water (3-alternative forced-choice method). Each NaCl solution was presented twice. The previous concentration presented to the subjects was determined as the threshold when both selections were incorrect. All participants were tested at least on 2 days, separated by 1 or more weeks. Mean DT was calculated. | DT was not significantly different between controls and CKD (with or without HD). | DT for sweet taste was significantly lower in CKD males than male controls. DT for sour taste was significantly lower in male CKD, and all CKD on HD. DT for bitter taste was significantly lower in male CKD on HD only. No significant correlation between tastes and blood zinc/copper concentrations in CKD HD. |
| (B) Recognition Thresholds (n = 10) | |||
| Study | Assessment Methods | Salt Taste Findings | Other Findings |
| Burge 1979 [27] | Taste tests performed up to 30 min pre- and post- dialysis. Participants swished and expectorated NaCl solutions (0.005 M, 0.010 M, 0.020 M, 0.030 M, 0.040 M, 0.050 M, 0.060 M, 0.070 M, 0.080 M, 0.090 M, and 0.100 M), and were asked to describe the taste as being sweet, sour, bitter, salty, or no taste. RT was determined as the lower concentration when a taste was correctly identified twice consecutively. | RT for salt taste did not differ significantly between controls and CKD (both pre- and post-dialysis). It was noted that 4 CKD participants failed to recognise salt taste even at the highest concentration of 0.100 M. | RT for sweet and sour solutions of subjects pre-dialysis were significantly higher than those of the control subjects. |
| Ciechanover 1980 [28] | Salt taste solutions (5 NaCl concentrations: 0.030 M, 0.051 M, 0.079 M, 0.120 M, and 0.342 M) were dropped over the anterior dorsal surface of tongue. Following solution presentation, the tongue was retracted for 30 s, and participants were asked to swallow the solution and identify the taste. | RT for salt taste were significantly higher in both dialysed (p = 0.005) and non-dialysed (p = 0.01) CKD participants, but only in those <55 years. | Impairment also found in sweet, sour, and bitter tastes in CKD (dialysed and non-dialysed) adults < 55 years. In those >55 years, sour taste impairment was found in CKD (dialysed and non-dialysed). No correlation was found between severity of CKD and RT. Dialysis (pre- vs. post-) improved sour and bitter taste recognition, but in CKD < 55 years only. No association between RT and plasma zinc level. |
| Fernstrom 1996 [37] | A forced-choice ascending concentration series method measured DT. Participants swished and expectorated NaCl solutions at 0.01, 0.032, 0.10, 0.32, and 1.0 M, and recognition of taste was made on 6-point scales based on their ability to recognise the salt solutions. | RT was significantly higher (less sensitive) in pre-uremics and HD, but not in CAPD, than controls. | No association between salt taste function and age. No significant impairment in sweet and sour tastes was observed. Pre-uremics and CAPD were also less sensitive to bitter taste. |
| Kim 2018 [29] | Salt taste thresholds were tested using NaCl solutions at 0.01, 0.025, 0.05, 0.075, 0.10,0.125, 0.15, 0.20, 0.3, 0.4 and 0.5% (11 stages). Beginning with the lowest concentration, participants swished and expectorated 1 test solution + 2 water controls in random order. The lowest concentration that was correctly recognised twice consecutively was determined as RT. | RT was significantly higher in CKD Stage 3 than controls only. | RT did not correlate with spot urinary sodium level in CKD (proxy of dietary sodium intake). |
| Kusaba 2009 [30] | Sodium-impregnated taste strips (0%, 0.6%, 0.8%, 1.0%, 1.2%, 1.4%, and 1.6%) were used to assess salt taste thresholds. Taste strips in an increasing order were placed in the mouth and participants were asked if a taste was detected, and if yes, which taste it was. Test was repeated until participants correctly identified the taste twice. | Significantly higher RT in CKD (0.86 ± 0.26%) than controls (0.68 ± 0.14%) (p < 0.05). A total of 71% CKD vs. 27% controls had RT > 0.8%. | RT positively correlated with 24 h urinary sodium excretion in CKD (indicator of sodium intake) (r = 0.57, p < 0.01). No correlation between RT and serum zinc or diabetes status in CKD. Significantly higher RT in CKD treated with diuretics. |
| Manley 2012 [31] | Participants swished and expectorated 10 mL of salt solution (concentrations not reported) and identified taste by selecting one of 5 tastes or none if taste not perceived. | Salt taste recognition did not differ between CKD and controls (100% correct identification). | Significantly lower proportion of correct identification of sour, umami, and bitter tastes were found in CKD group. |
| Márquez-Herrera 2020 [32] | A taste perception test (TPT) of 5 taste qualities was developed in healthy controls and applied in CKD participants. Participants tasted the solutions (NaCl 0.5%) and were asked to identify. | Only CKD on HD were marginally (p = 0.06) less able to identify salty tastes. | CKD on CAPD were less able to recognise sweet and umami tastes (p < 0.05). |
| McMahon 2014 [33] | Participants were asked to identify the taste of a salt solution (200 mol/L NaCl) and rated the intensity on a VAS from 0 to 10. | Significantly lower proportion of CKD identified salt taste solution correctly (p = 0.01). This difference diminished when data were adjusted for age and gender (OR 3.9, 95%CI 0.8–18.7). | Sour was misidentified more frequently in CKD than control (p < 0.01), even after adjusting for age and gender differences (OR 4.8, 95%CI 1.8–13.0). 71% (n = 70) of CKD exceeded sodium intake recommendations (based on 40-item FFQ). A significantly larger proportion of CKD participants who met sodium intake recommendations identified salt and umami tastes correctly than those who exceeded recommendations (p < 0.01). |
| Tavares 2021 [35] | Three drops of NaCl solutions (4 concentrations 0.25, 0.1, 0.04, 0.016 g/mL) were placed on the tongue. Participants reported the perceived taste. The lowest NaCl concentration was recorded, and participants were also scored (range 0–4) based on the number of correctly identified solutions. | Recognition thresholds were not significantly different between CKD and controls (p = 0.590). | Significant correlations between plasma zinc and salt taste (r = 0.30, p = 0.048) and bitter taste (r = 0.49, p = 0.001) scores were found for all participants. No significant difference in sweet and sour taste function, but impaired bitter taste function in CKD (p < 0.001). |
| Yusuf 2021 [41] | Strips impregnated with 0.016, 0.04, 0.1, or 0.25 g/mL NaCl applied 1.5 cm from the tip of the tongue in increasing order. Taste function was obtained as the number of correctly identified tastes, with the highest scores given to the lowest NaCl concentration. | Significantly lower salt taste scores (less sensitive) in CKD (2.82 ± 1.1) than controls (3.7 ± 0.7) (p = 0.001). | Significantly lower scores in sour, sweet, bitter and total (all 4 taste qualities) taste scores in CKD than controls (all p = 0.001). Taste dysfunction was more severe with longer duration of CKD (p = 0.028) but not the stages of CKD (p = 0.629). |
| (C) Intensity Ratings (n = 6) | |||
| Study | Assessment Methods | Salt Taste Findings | Other Findings |
| Fitzgerald 2019 [38] | Three salt solutions were used: NaCl 0.2 M, KCl 0.01 M, and Na3PO4 0.0063 M. On haemodialysis days, participants swished and expectorated taste solutions for 10 s. After tasting each solution, participants reported perceived taste intensity. | Unadjusted intensity ratings were not significantly different (p = 0.73) between CKD and controls. After adjustment for ratings of water control, significantly higher intensity ratings were found for NaCl (p = 0.0018) and Na3PO4 (p = 0.017) in CKD than controls. | - |
| Hurley 1987 [39] | NaCl solutions at 0, 75, 150, 300, and 600 mmol/L concentrations were swished and expectorated, and the intensity ratings were assessed using modified magnitude estimation using a continuous scale 1 to 6. | No significant differences in intensity ratings between controls and HD, CAPD, and transplant. | - |
| Manley 2012 [31] | Participants swished and expectorated 10 mL of salt solution (concentrations not reported), identified taste, and then rated the perceived intensity on a 100 mm VAS from “water like” to “very strong”. | Salt intensity ratings did not significantly differ between CKD and controls. | Intensity ratings for sour and bitter were significantly lower in CKD than controls (both p < 0.05). Salivary bicarbonate was negatively associated with the intensity ratings of umami (r = −0.317, p = 0.002) and sour (r = −0.288, p = 0.03) tastes in CKD. Salivary urea was negatively associated with the intensity rating of bitter taste in CKD (r = −0.381, p = 0.04). Salivary zinc was negatively correlated with sweet taste intensity in CKD (r = 0.317, p = 0.02). |
| Márquez-Herrera 2020 [32] | A taste perception test (TPT) of 5 taste qualities was developed in healthy controls and applied in CKD participants. Participants tasted the solutions (NaCl 0.5%) and were asked to rate the intensity from 0 to 10 using a VAS. | No significant differences were found on salt taste intensity ratings between CKD and controls. | All CKD perceived sour taste to be less intense than controls (p < 0.05). |
| McMahon, 2014 [33] | Participants were asked to rate the intensity of the salt solution (200 mol/L NaCl) taste on a VAS from 0 to 10. | Intensity rating for salt taste did not differ between CKD and controls (p = 0.20). | Umami taste was rated significantly less intense in CKD than controls. CKD participants who met sodium intake recommendations rated umami and bitter tastes to be more intense (p < 0.01 and p = 0.03, respectively). |
| Shephard 1987 [40] | Participants tasted pea soup with 6 NaCl concentrations: 103, 155, 233, 349, 524, and 786 mg Na/l00 g soup in random order and rated intensity on a seven-category intensity scale from “No taste” to “Extremely strong”. | No significant differences in intensity ratings between CKD and controls. | No significant difference for sweet taste intensity. In CKD, salt taste intensity ratings were significantly higher after HD. |
| (D) Hedonic Ratings (n = 6) | |||
| Study | Assessment Methods | Salt Taste Findings | Other Findings |
| Dobell 1993 [42] | A 88-item questionnaire including foods allowed on renal diets was used. Participants rated each food as “never tried it”, or how much they liked or disliked each food on a 9-point hedonic scale. These foods were then grouped into categories such as sweet foods, sour foods, salty foods, bitter foods (basic tastes), and other food groupings such as fruit, vegetables, red meat, cereal products, eggs, etc. | No significant difference in the mean liking of salty foods between HD (6.0 ± 0.2), CAPD (6.4 ± 1.0) and controls (6.1 ± 0.2) was found. | Liking of sweet foods was significantly lower in HD (6.0 ± 0.3) than control (7.1 ± 0.1) (p < 0.05). No significant differences were found in the liking of bitter and sour foods. |
| Fitzgerald 2019 [38] | Three salt solutions were used: NaCl 0.2 M, KCl 0.01 M, and Na3PO4 0.0063 M. On haemodialysis days, participants swished and expectorated taste solutions for 10 s. After tasting each solution, participants reported their liking/disliking of the solutions. | Unadjusted liking ratings were not significantly different (p = 0.37) between CKD and controls. After adjustment for water control, significantly lower disliking score was found for NaCl (p = 0.045), KCl (p = 0.014), and Na3PO4 (p = 0.042) in CKD compared to controls. | Liking ratings for KCl were positively correlated with serum potassium levels in CKD (r = 0.57, p = 0.027). |
| Hurley 1987 [39] | Participants selected from a list of two-food combinations (one higher in sodium than another) | CAPD preferred salty foods more than controls (p < 0.01). | - |
| Kim 2018 [29] | Bean sprout soup containing 0.15% and 1.0% NaCl were used. Participants were instructed to add 1.0% NaCl soup to the 0.15% NaCl soup until a preferred salt concentration was reached. The final salt concentration was determined using a digital handheld salt tester. Test was conducted twice and sodium concentrations averaged. | Preferred salt concentration in soup was significantly lower in CKD Stage 5 (0.31 ± 0.09%) than controls (0.35 ± 0.12%) (p < 0.05). | Preferred salt concentration was positively associated with spot urinary sodium level (proxy of dietary sodium intake) (beta = 0.17, p = 0.022). |
| Manley 2012 [31] | Participants swished and expectorated 10 mL of salt solution (concentrations not reported) and rated their liking of taste solutions using a 9-point hedonic scale ranging from 1 “dislike extremely” to 9 “like extremely”. | Liking of salt solution did not differ between CKD and controls. | No significant differences in the liking of other taste solutions between CKD and controls. Salivary bicarbonate was negatively associated with umami taste liking in CKD (r = −0.307, p = 0.02). |
| Shephard 1987 [40] | Participants tasted pea soup with 6 NaCl concentrations, e.g., 103, 155, 233, 349, 524, and 786 mg Na/l00 g soup in a random order and rated on a 100 mm relative-to-ideal scale, which consisted of a 100 mm line anchored at the centre with the label “Just right”, at the left end with “Not nearly salty enough”, and at the right end with “Much too salty”. | No significant differences in preference between CKD and controls. | No significant difference was found for sweet taste preference between CKD and controls. In CKD, preferred salt concentrations in soup were significantly lower after HD. |
Publisher’s Note: MDPI stays neutral with regard to jurisdictional claims in published maps and institutional affiliations. |
© 2022 by the authors. Licensee MDPI, Basel, Switzerland. This article is an open access article distributed under the terms and conditions of the Creative Commons Attribution (CC BY) license (https://creativecommons.org/licenses/by/4.0/).
Share and Cite
Tan, S.-Y.; Tuli, P.; Thio, G.; Noel, B.; Marshall, B.; Yu, Z.; Torelli, R.; Fitzgerald, S.; Chan, M.; Tucker, R.M. A Systematic Review of Salt Taste Function and Perception Impairments in Adults with Chronic Kidney Disease. Int. J. Environ. Res. Public Health 2022, 19, 12632. https://doi.org/10.3390/ijerph191912632
Tan S-Y, Tuli P, Thio G, Noel B, Marshall B, Yu Z, Torelli R, Fitzgerald S, Chan M, Tucker RM. A Systematic Review of Salt Taste Function and Perception Impairments in Adults with Chronic Kidney Disease. International Journal of Environmental Research and Public Health. 2022; 19(19):12632. https://doi.org/10.3390/ijerph191912632
Chicago/Turabian StyleTan, Sze-Yen, Paridhi Tuli, Giecella Thio, Breannah Noel, Bailey Marshall, Zhen Yu, Rachael Torelli, Sarah Fitzgerald, Maria Chan, and Robin M. Tucker. 2022. "A Systematic Review of Salt Taste Function and Perception Impairments in Adults with Chronic Kidney Disease" International Journal of Environmental Research and Public Health 19, no. 19: 12632. https://doi.org/10.3390/ijerph191912632
APA StyleTan, S.-Y., Tuli, P., Thio, G., Noel, B., Marshall, B., Yu, Z., Torelli, R., Fitzgerald, S., Chan, M., & Tucker, R. M. (2022). A Systematic Review of Salt Taste Function and Perception Impairments in Adults with Chronic Kidney Disease. International Journal of Environmental Research and Public Health, 19(19), 12632. https://doi.org/10.3390/ijerph191912632