
Quantifying the Carbon Reduction Potential of Recycling Construction Waste Based on Life Cycle Assessment: A Case of Jiangsu Province


 ,
,
Abstract
1. Introduction
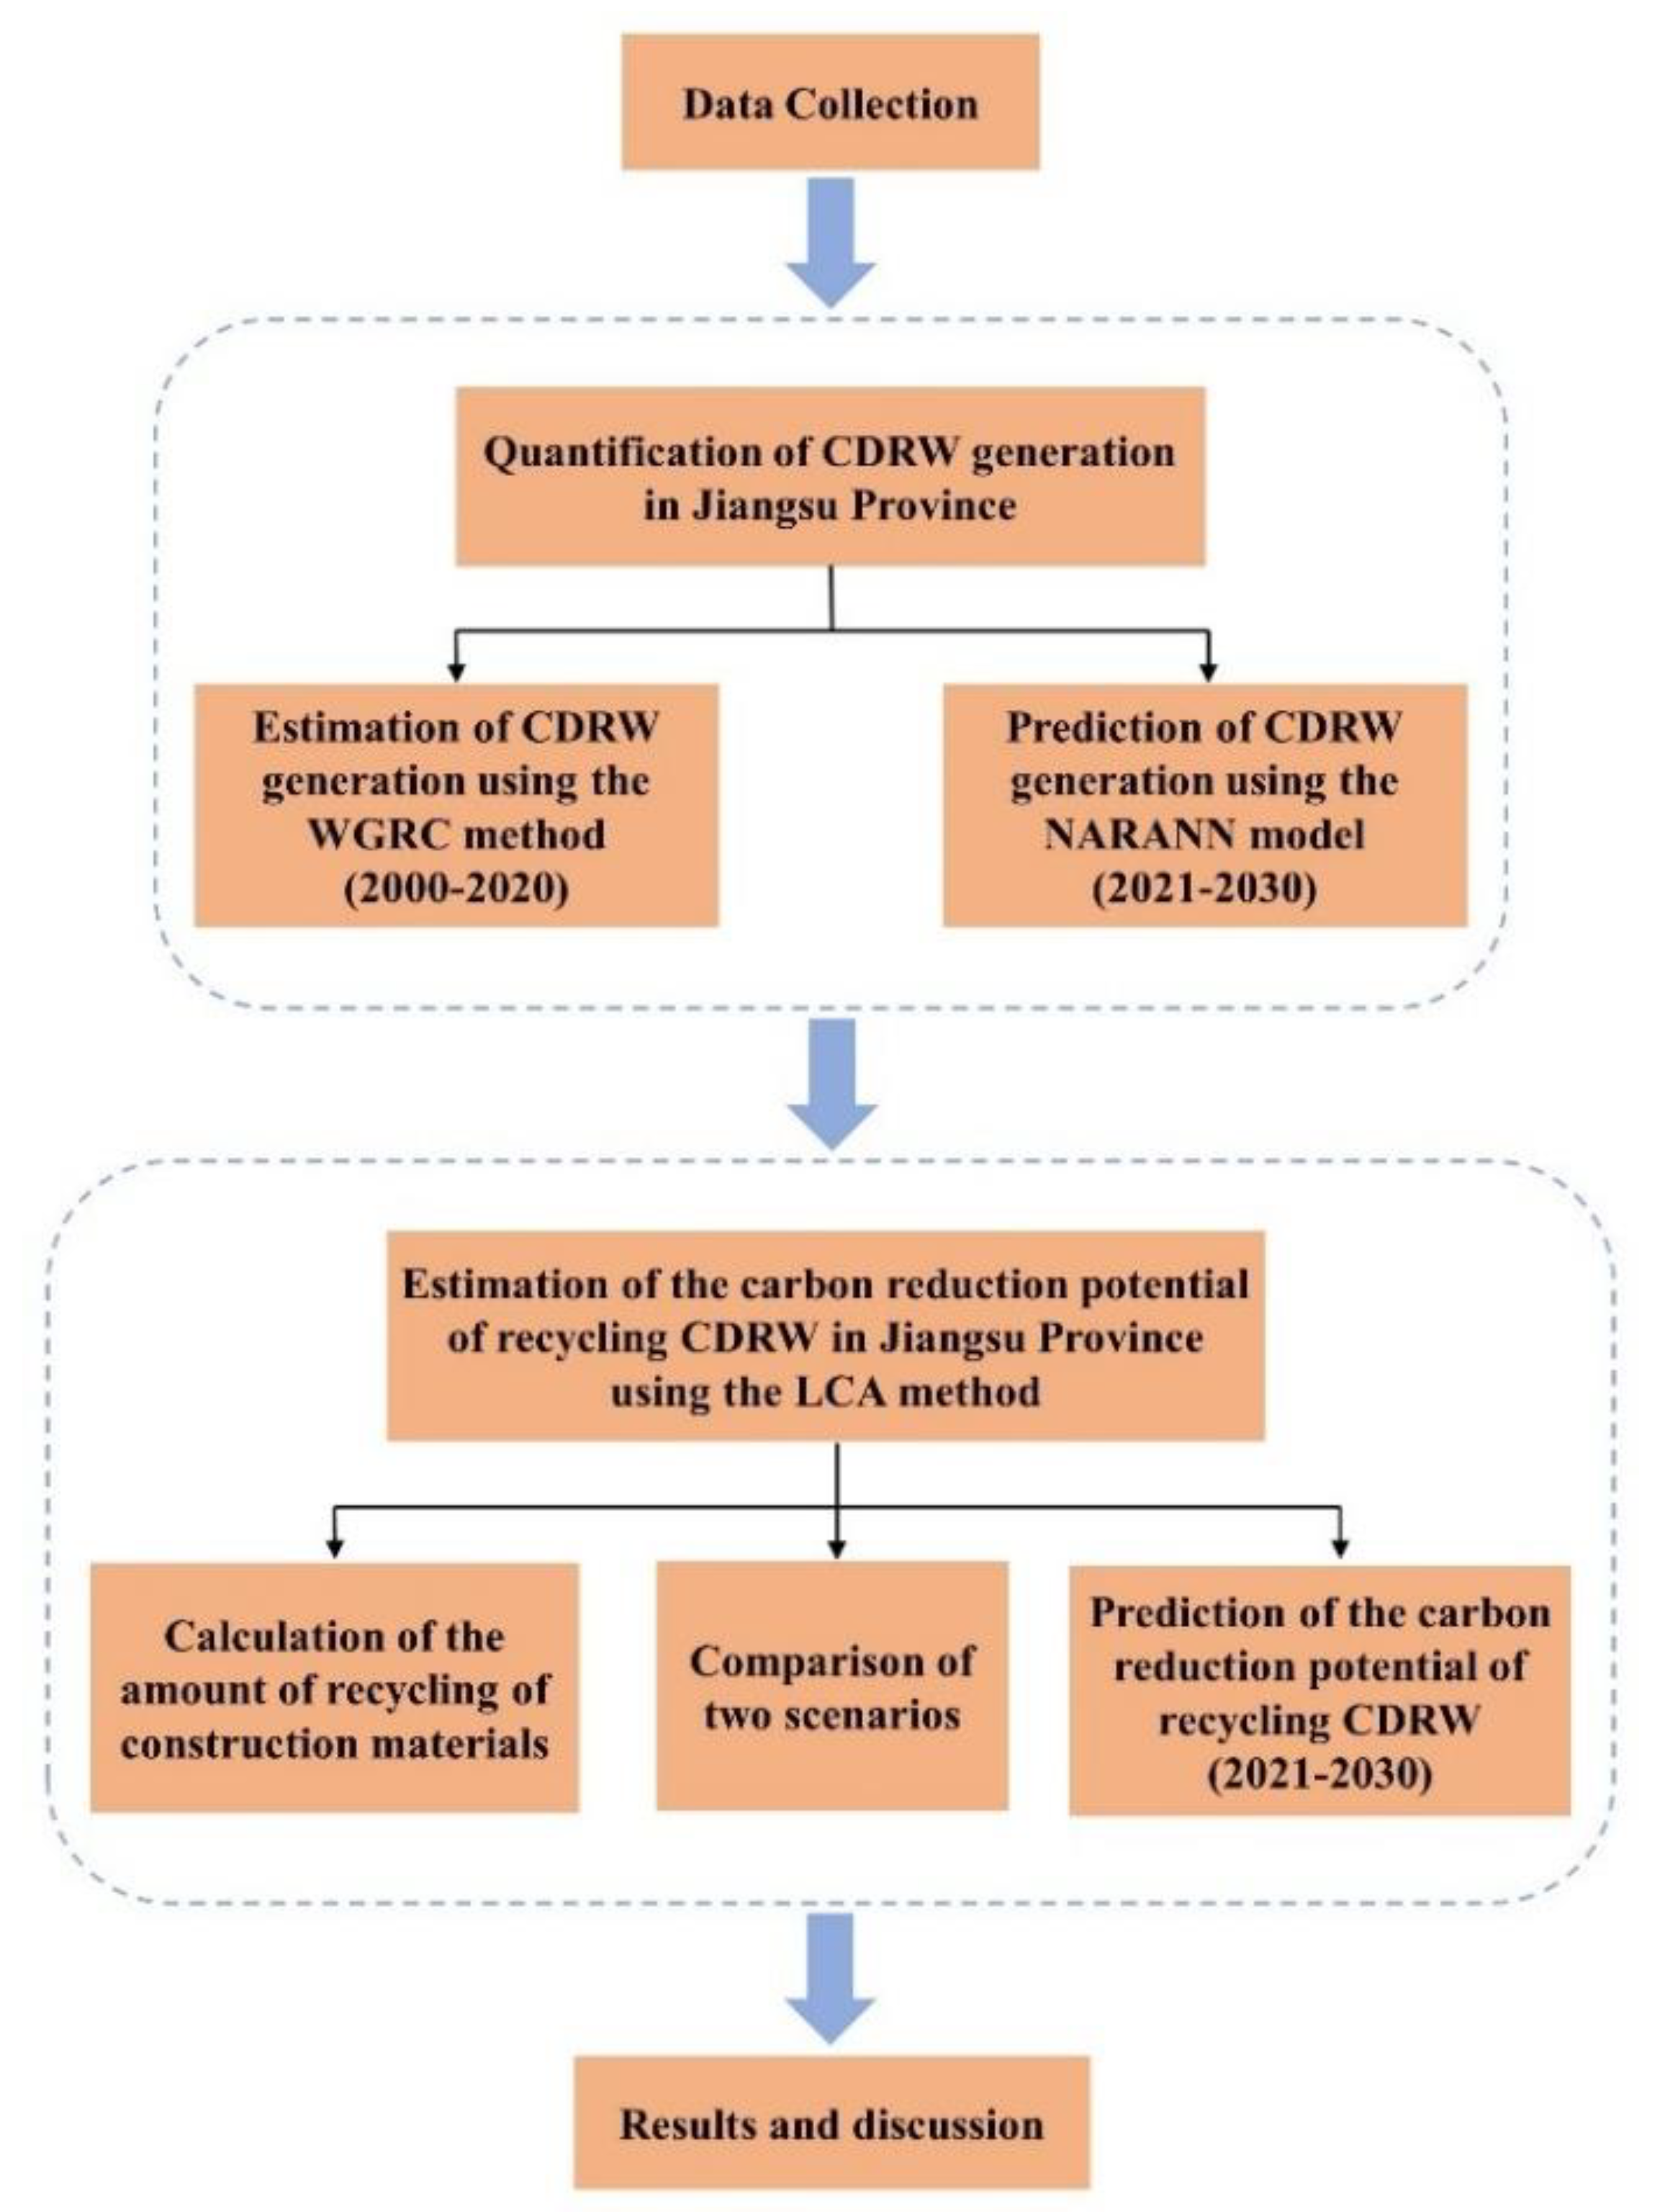
2. Methodology
2.1. CDRW Generation Estimation
2.1.1. Waste Generation Rate Calculation Method
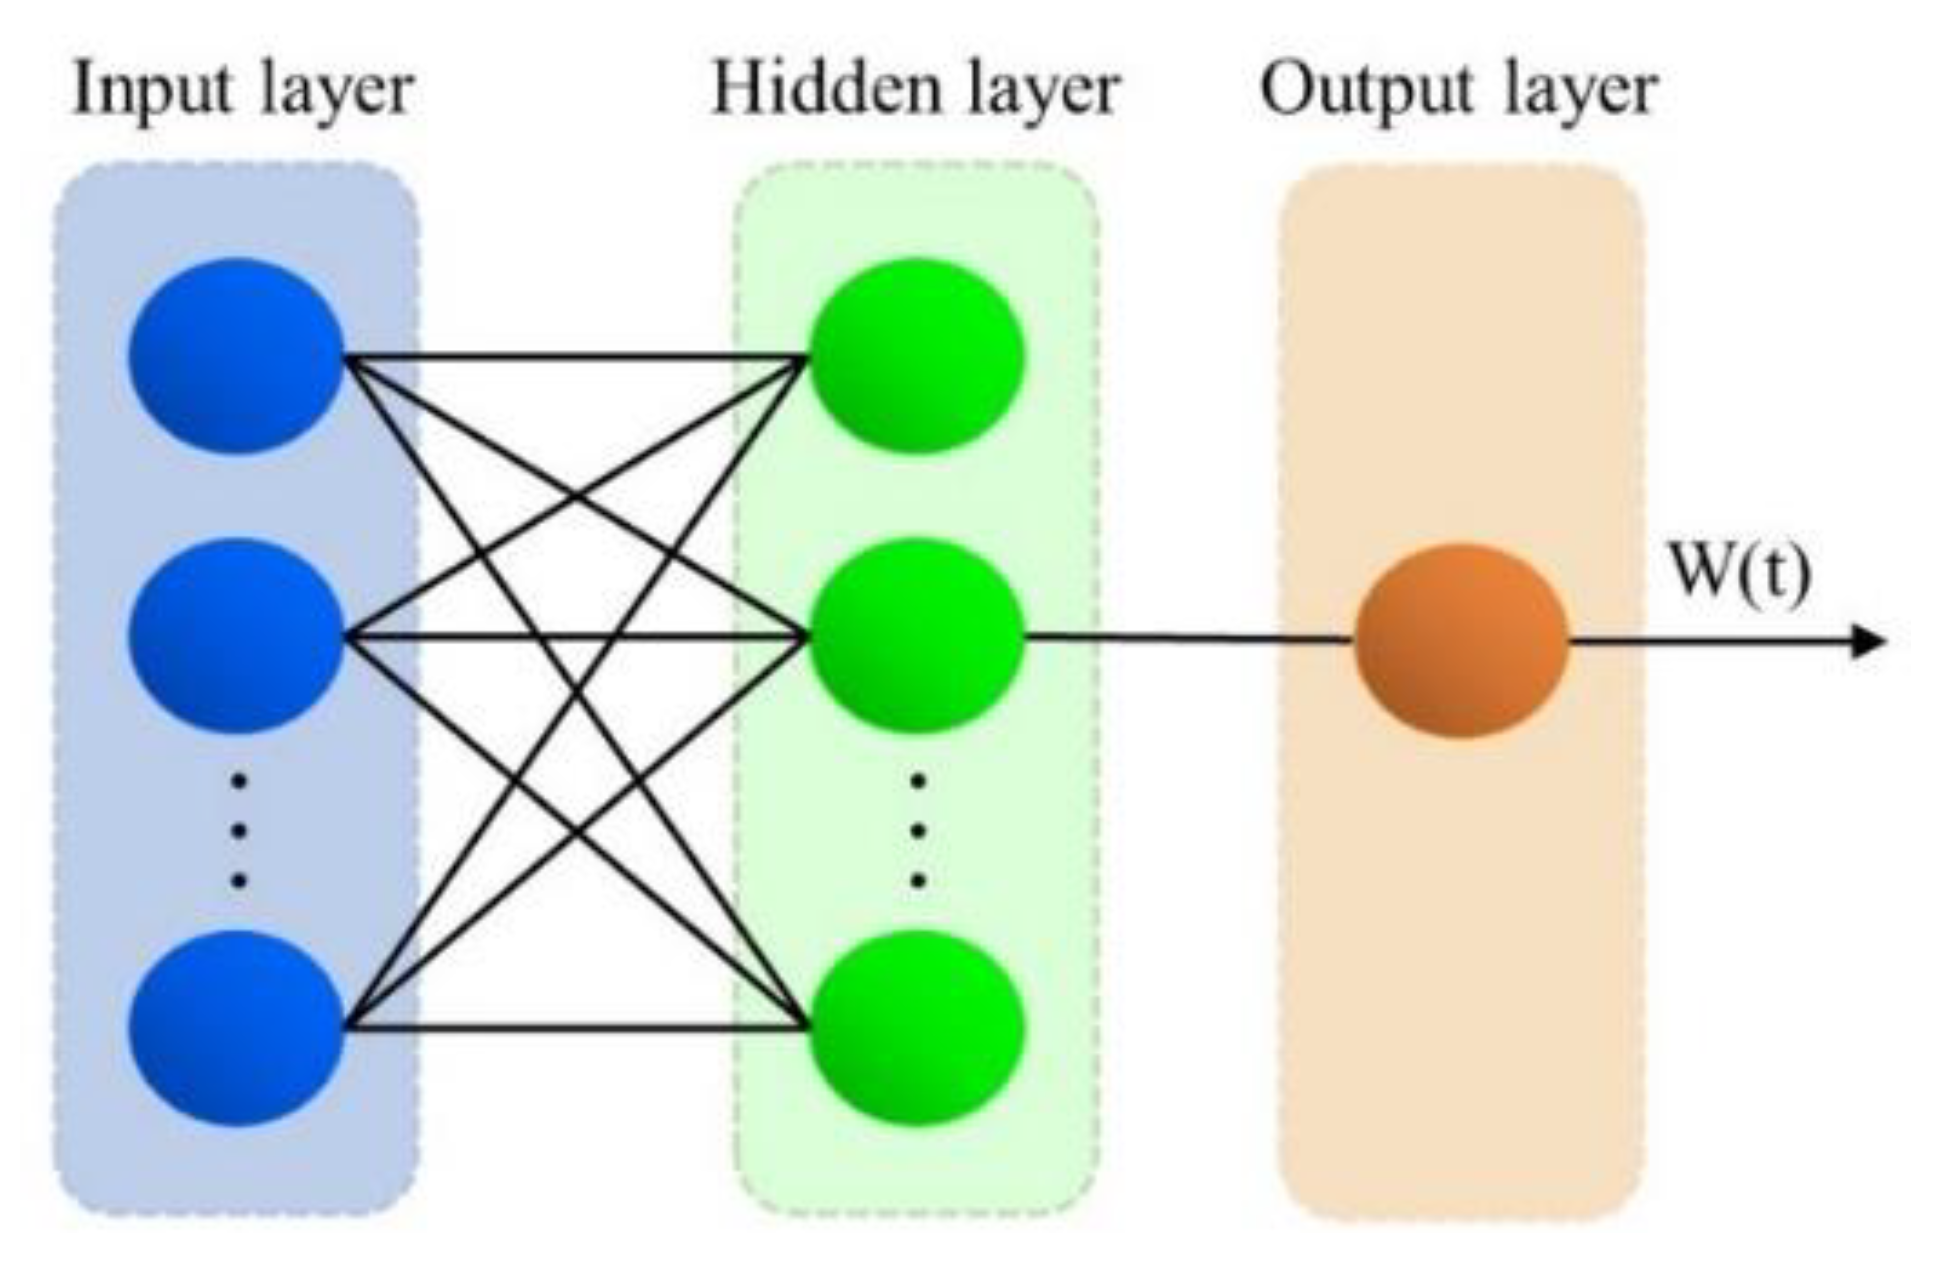
2.1.2. Nonlinear Autoregressive Artificial Neural Network Model
2.2. Assessment of Carbon Reduction Potential from Recycling CDRW
2.3. Data Sources
3. Results and Discussion
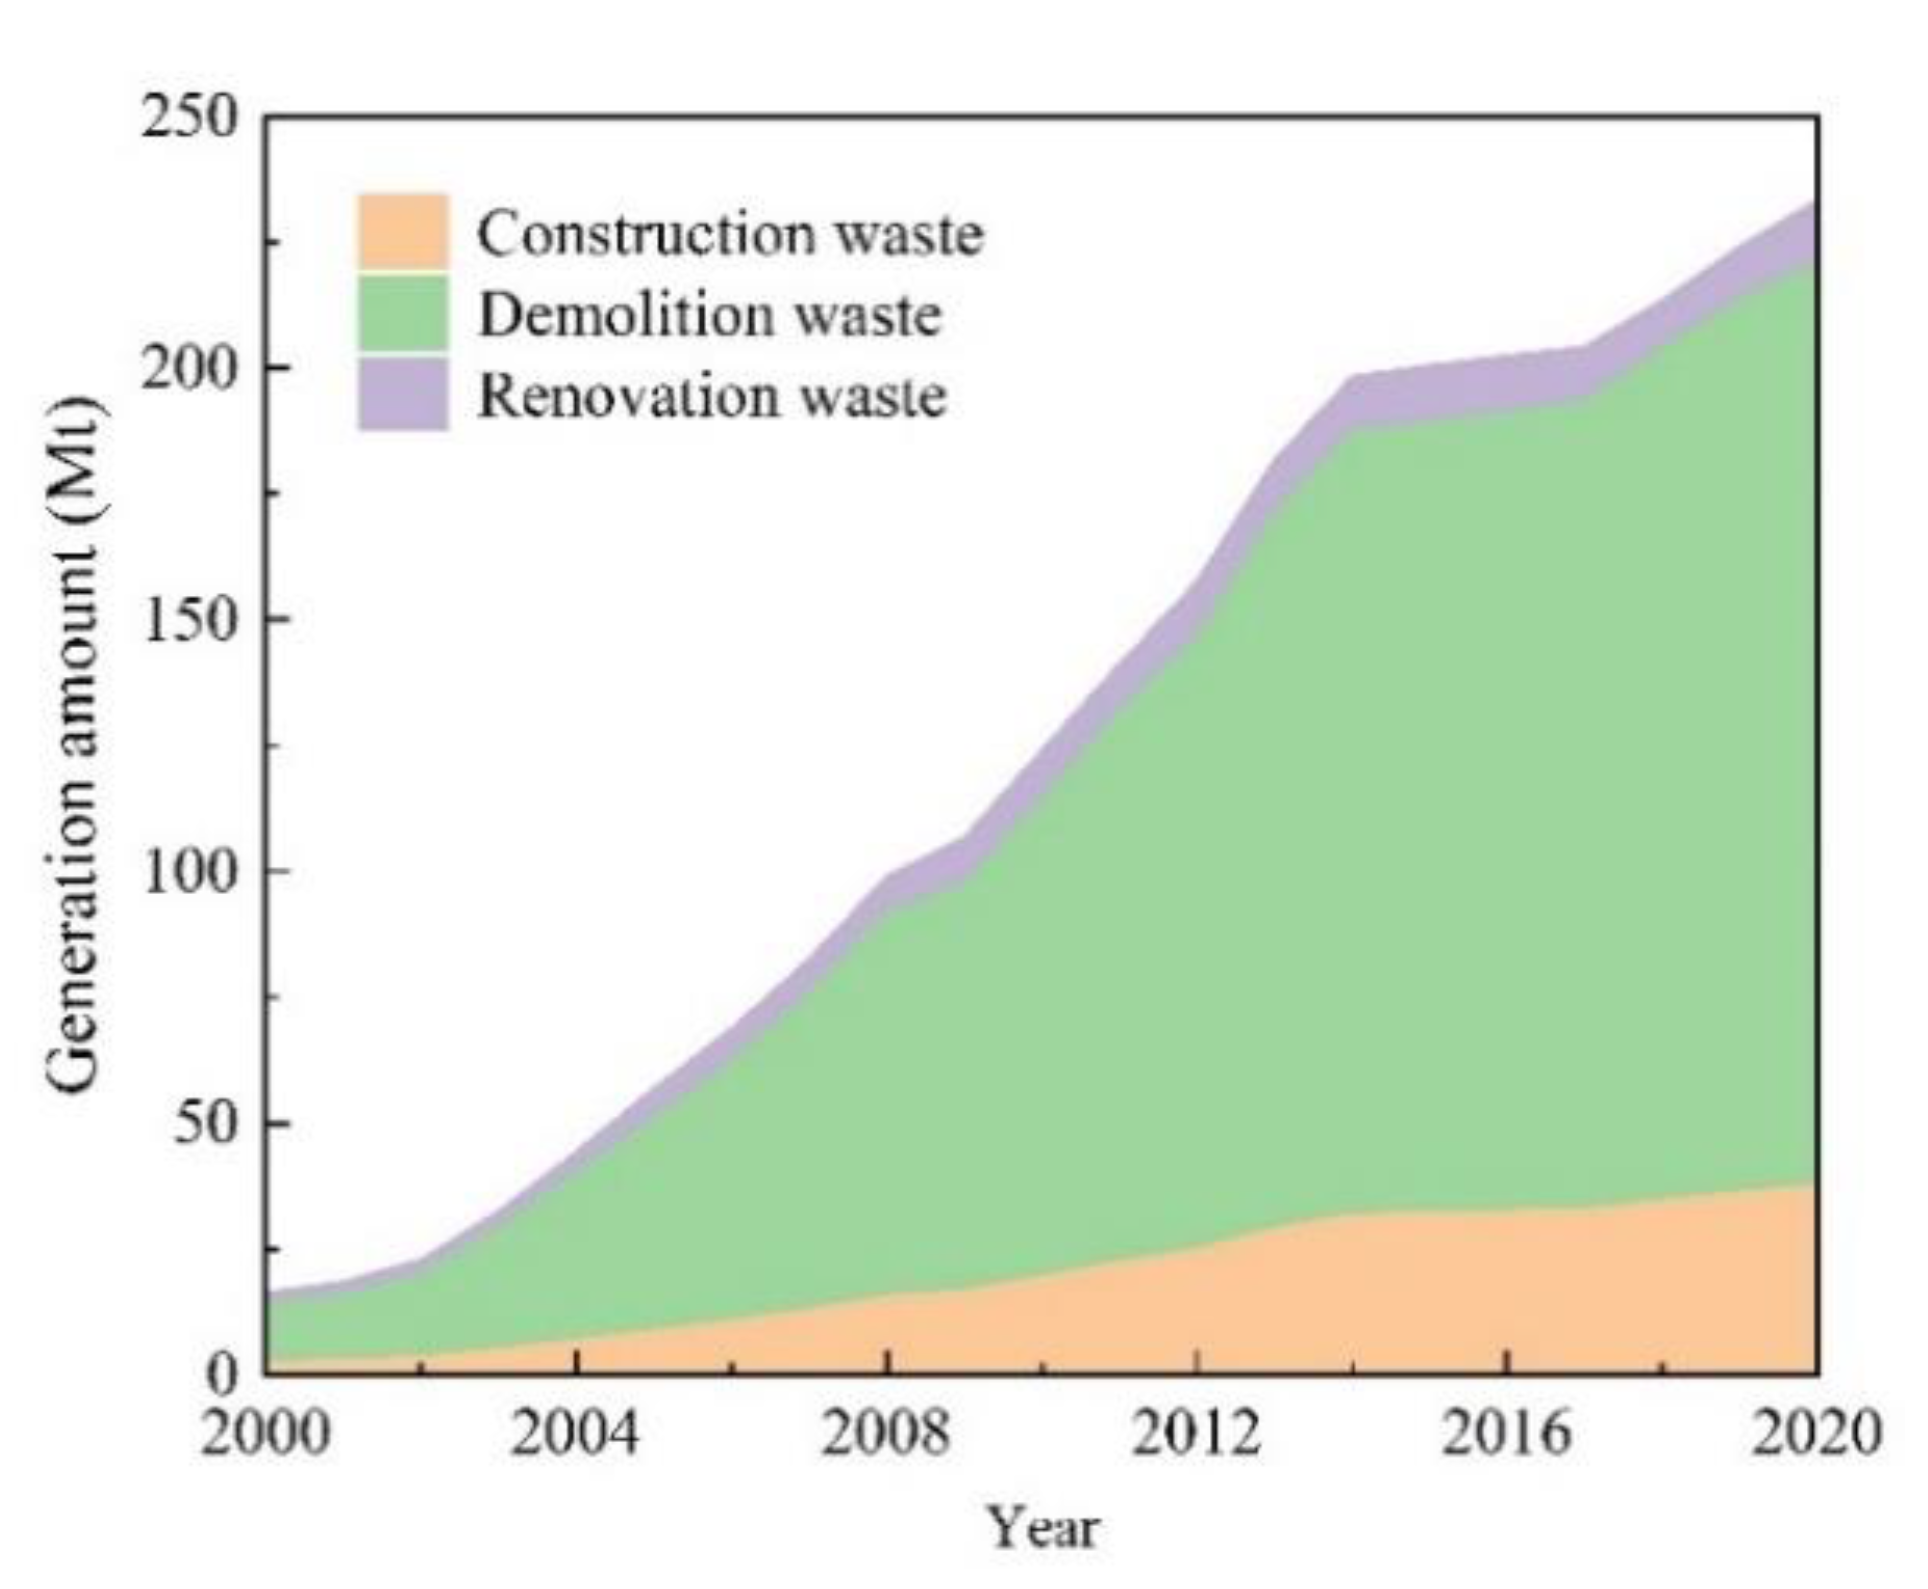
3.1. CDRW Generation in Jiangsu Province
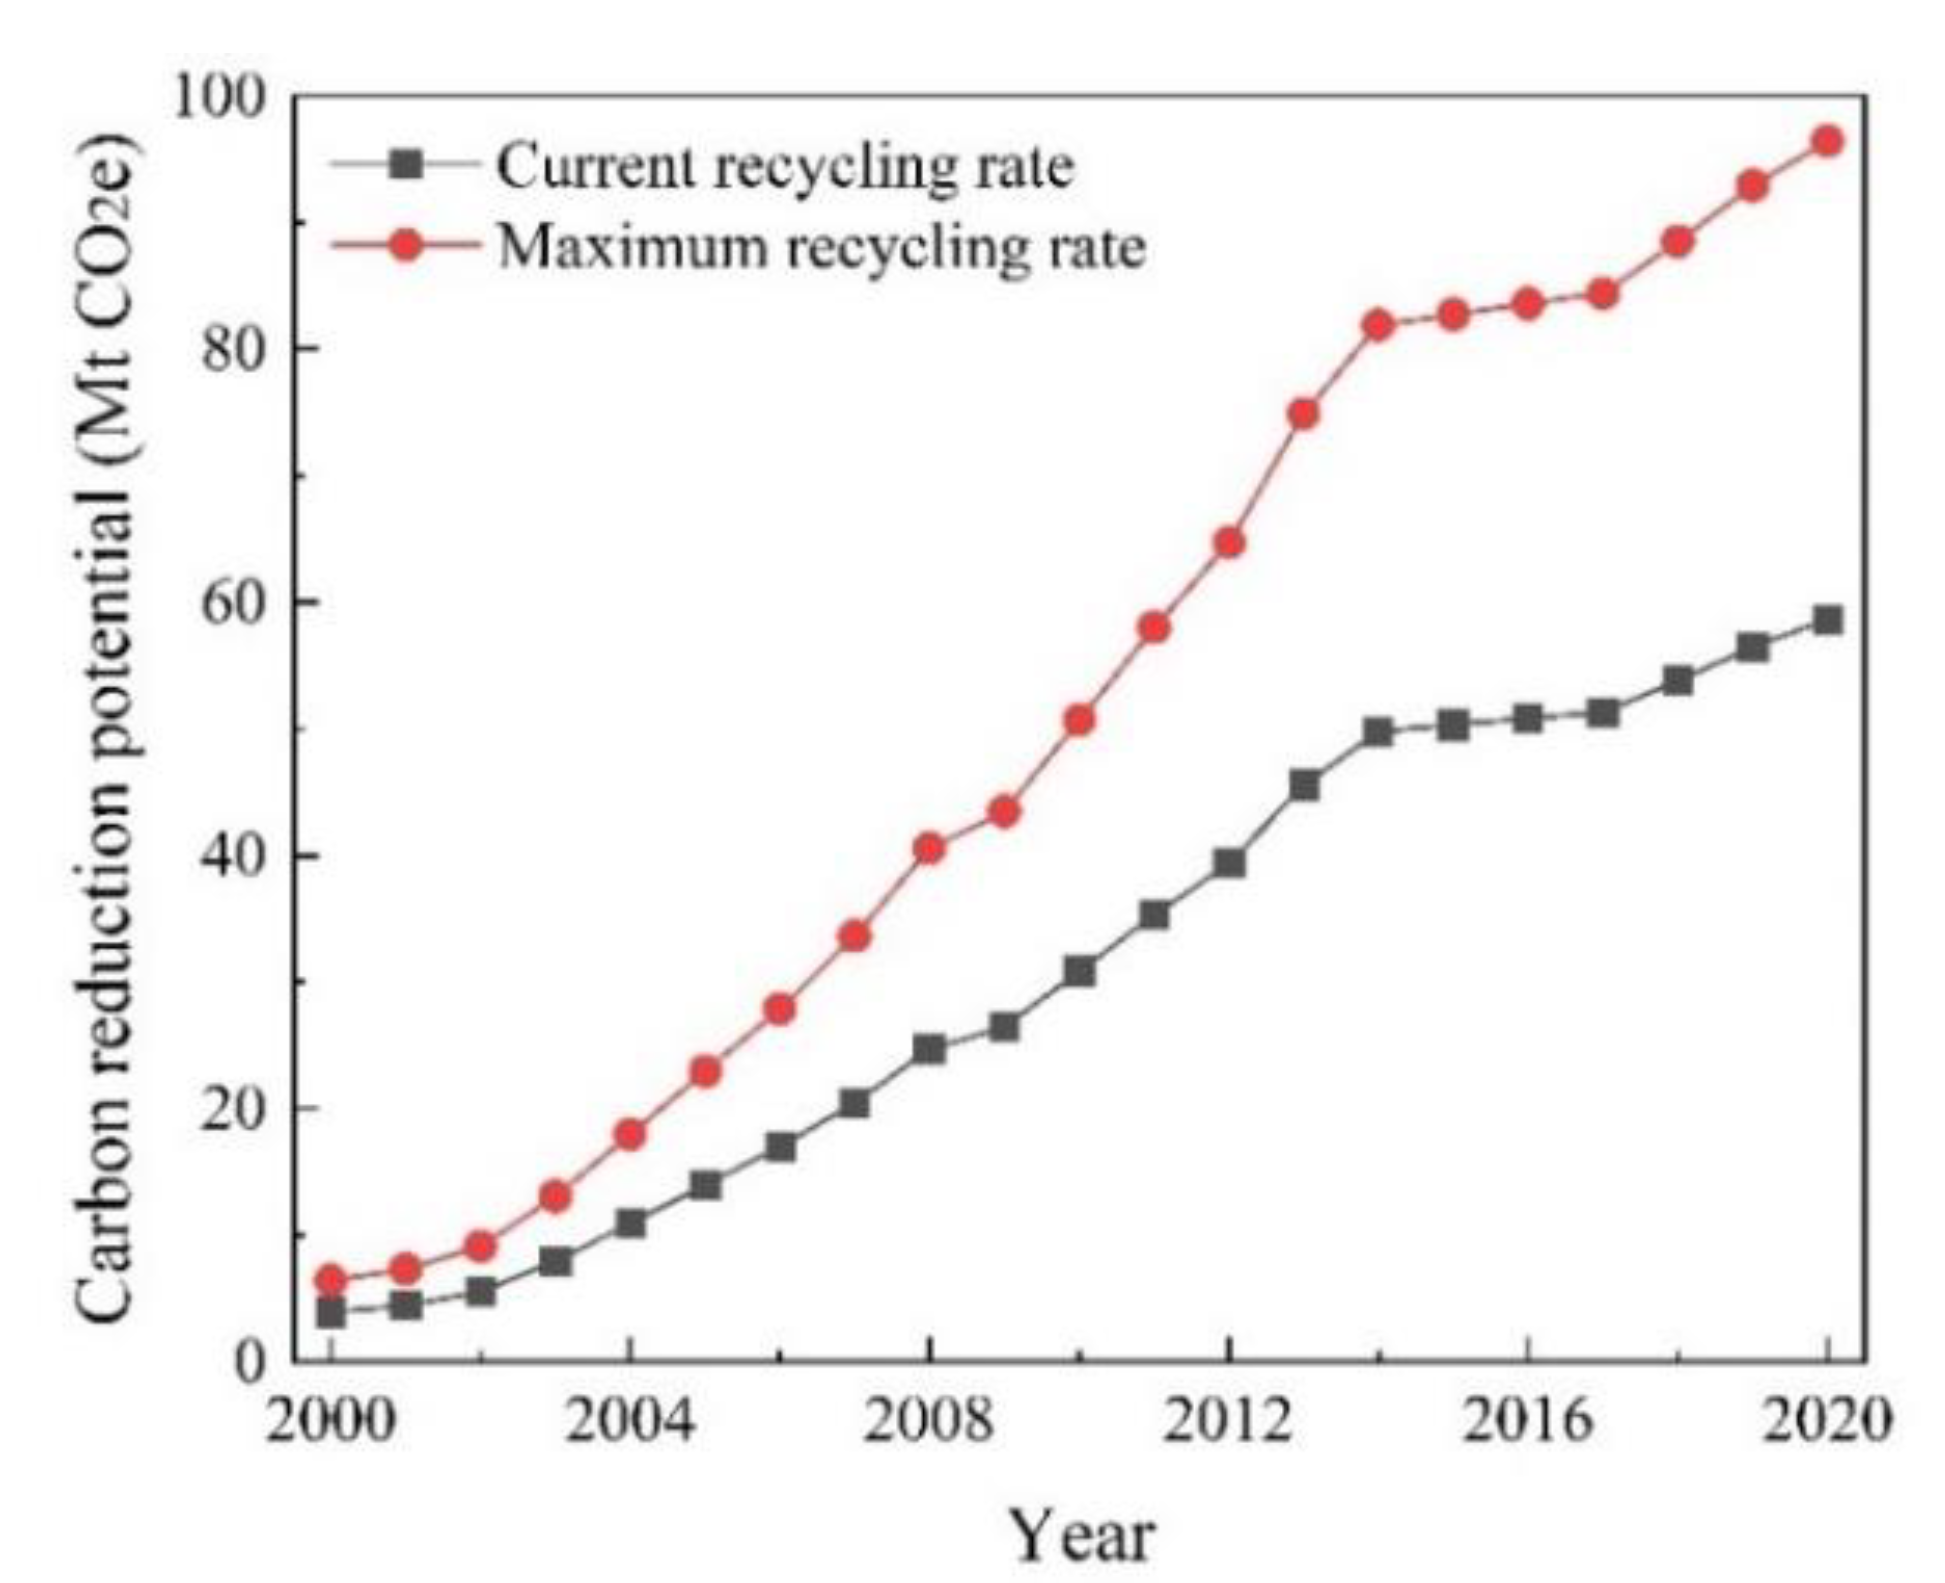
3.2. Carbon Reduction Potential of Recycling CDRW
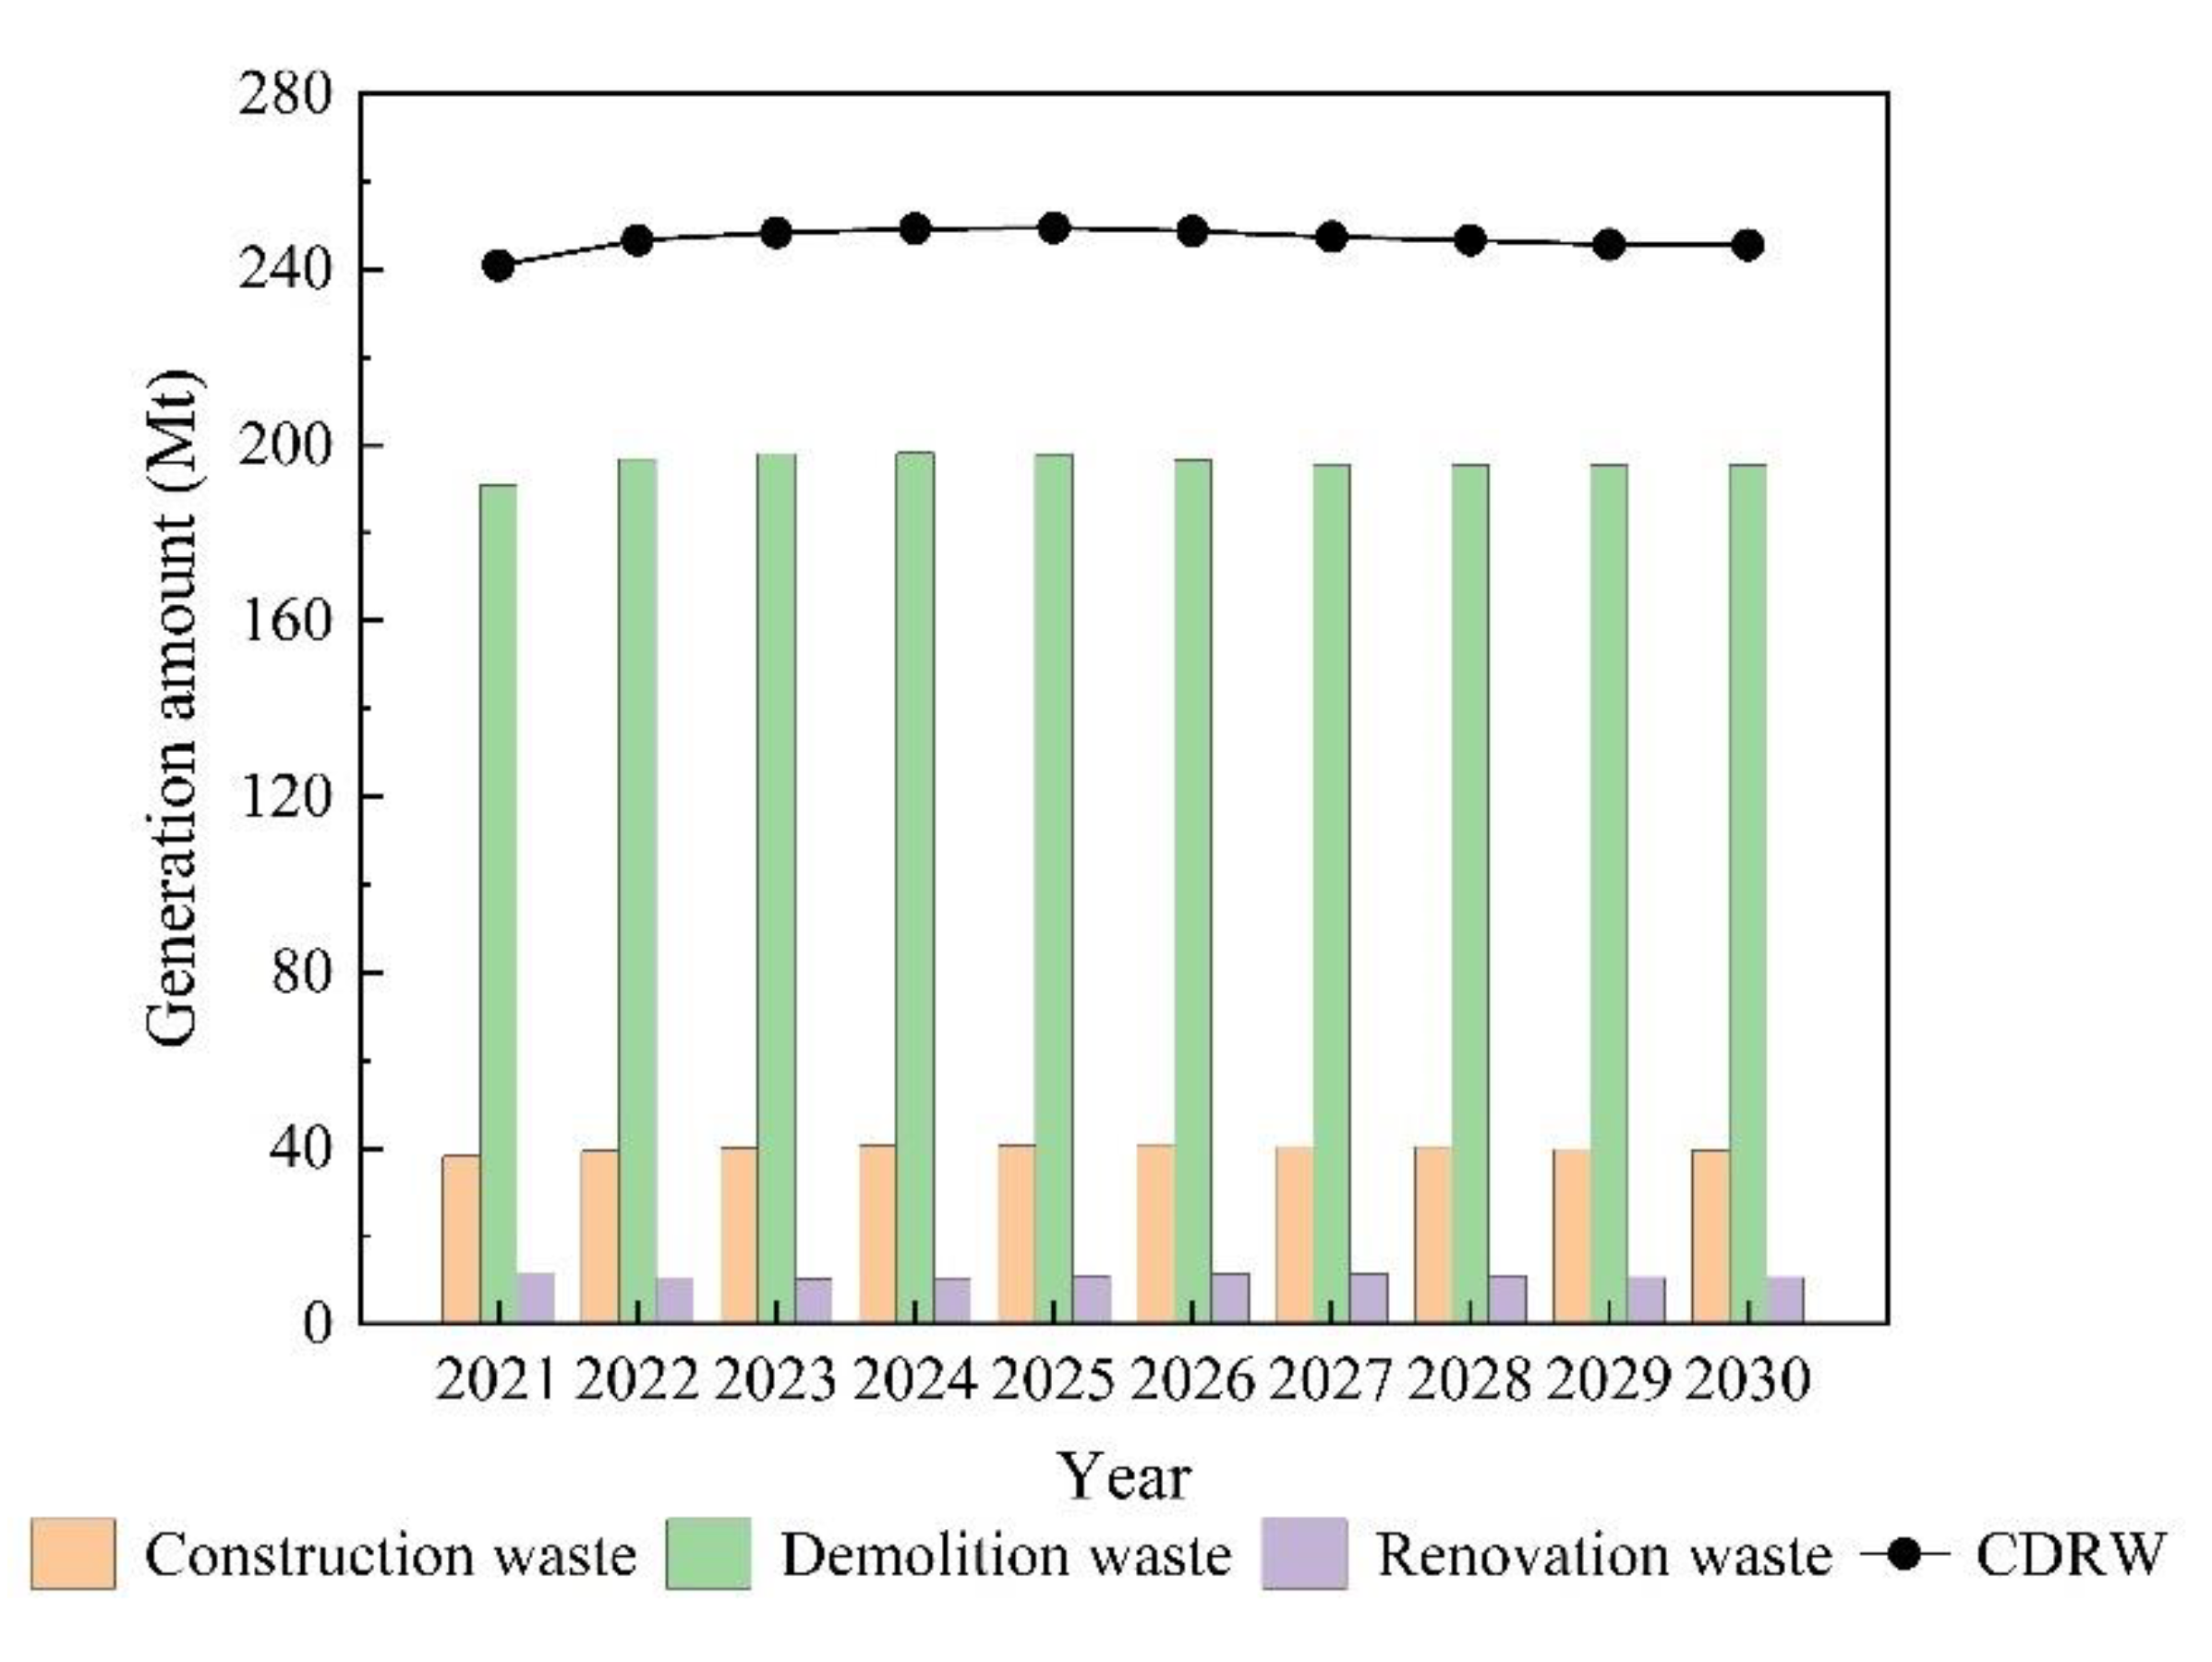
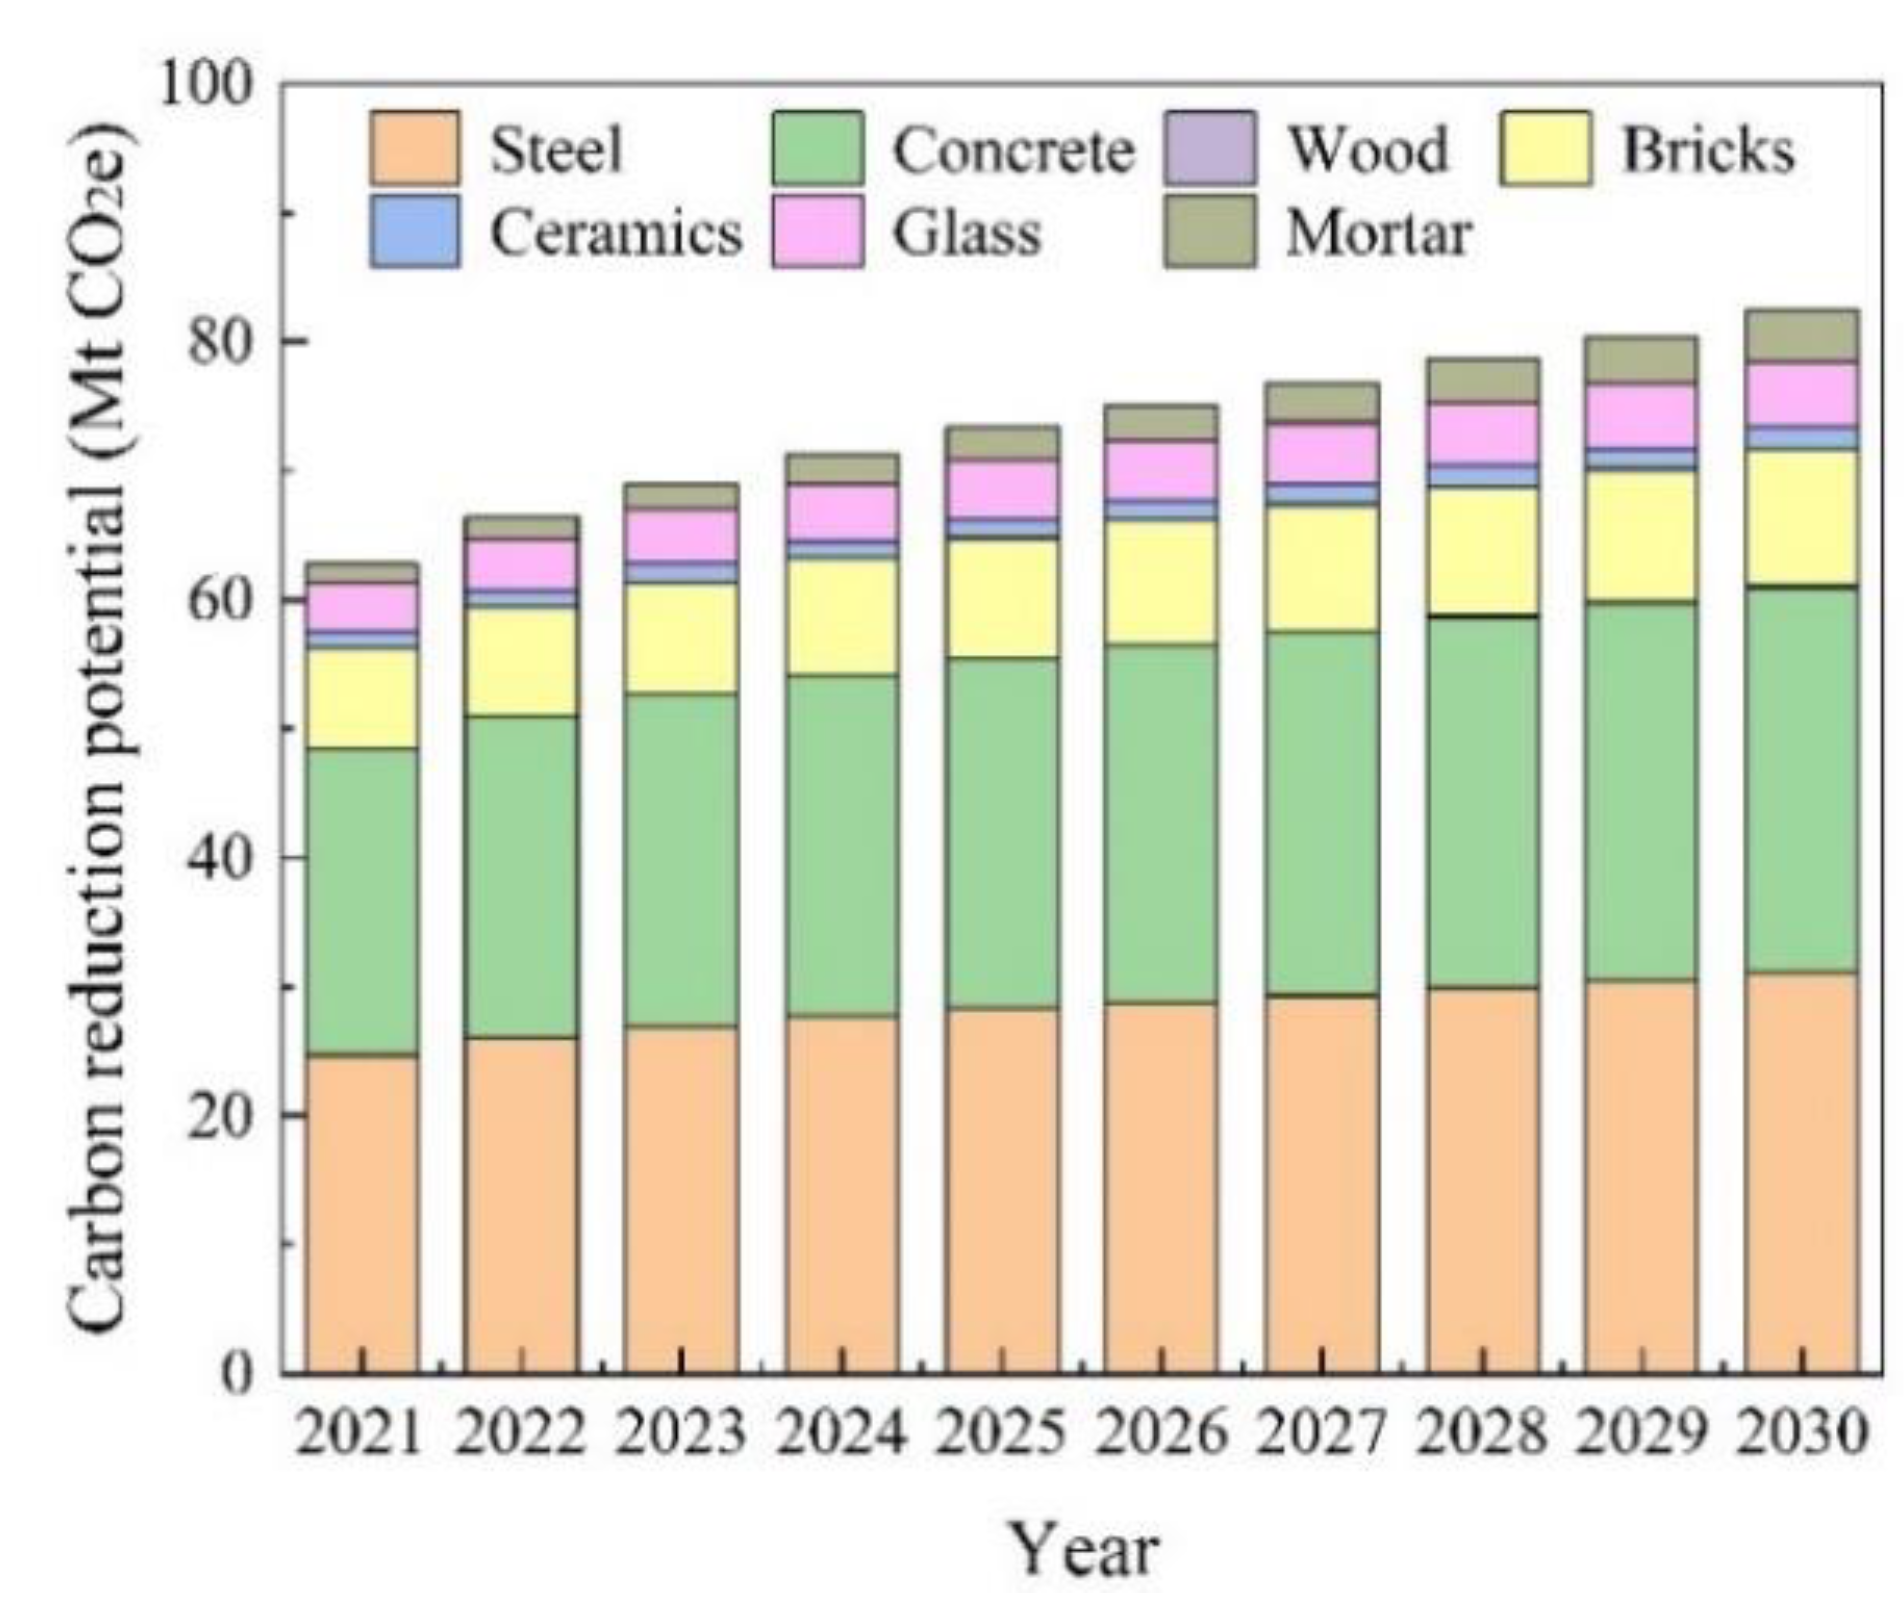
3.3. Future Carbon Reduction Potential Prediction for CDRW Recycling
4. Conclusions
Author Contributions
Funding
Institutional Review Board Statement
Informed Consent Statement
Data Availability Statement
Conflicts of Interest
References
- Benhelal, E.; Shamsaei, E.; Rashid, M.I. Challenges against CO2 abatement strategies in cement industry: A review. J Environ. Sci 2021, 104, 84–101. [Google Scholar] [CrossRef] [PubMed]
- Jafary Nasab, T.; Monavari, S.M.; Jozi, S.A.; Majedi, H. Assessment of carbon footprint in the construction phase of high-rise constructions in Tehran. Int. J. Environ. Sci. Technol. 2019, 17, 3153–3164. [Google Scholar] [CrossRef]
- Liang, X.; Lin, S.; Bi, X.; Lu, E.; Li, Z. Chinese construction industry energy efficiency analysis with undesirable carbon emissions and construction waste outputs. Environ. Sci Pollut. Res. Int. 2021, 28, 15838–15852. [Google Scholar] [CrossRef] [PubMed]
- Cheng, M.; Lu, Y.; Zhu, H.; Xiao, J. Measuring CO2 emissions performance of China’s construction industry: A global Malmquist index analysis. Environ. Impact Assess. Rev. 2022, 92, 106673. [Google Scholar] [CrossRef]
- Ma, D.; Zhao, N.; Zhang, F.; Xiao, Y.; Guo, Z.; Liu, C. Green Total-Factor Energy Efficiency of Construction Industry and Its Driving Factors: Spatial-Temporal Heterogeneity of Yangtze River Economic Belt in China. Int. J. Environ. Res. Public Health 2022, 19, 9972. [Google Scholar] [CrossRef]
- Du, Q.; Shao, L.; Zhou, J.; Huang, N.; Bao, T.; Hao, C. Dynamics and scenarios of carbon emissions in China’s construction industry. Sustain. Cities Soc. 2019, 48, 101556. [Google Scholar] [CrossRef]
- Peng, X. Comprehensive Evaluation of High Quality Development of Construction Industry Based on Entropy Method Taking Three Provinces and One City in Yangtze River Delta as Example. In Proceedings of the 26th International Symposium on Advancement of Construction Management and Real Estate, Beijing, China, 20–22 November 2021; pp. 1592–1607. [Google Scholar] [CrossRef]
- Wang, D. From Green Building to Green City: The Practice in Jiangsu Province, China. In Chinese Urban Planning and Construction; Springer: Cham, Switzerland, 2021; pp. 225–241. [Google Scholar] [CrossRef]
- Jiangsu Province Statistics. Available online: http://tj.jiangsu.gov.cn/ (accessed on 5 July 2022).
- Li, D.; Huang, G.; Zhang, G.; Wang, J. Driving factors of total carbon emissions from the construction industry in Jiangsu Province, China. J. Clean. Prod. 2020, 276, 123179. [Google Scholar] [CrossRef]
- Li, D.; Huang, G.; Zhu, S.; Chen, L.; Wang, J. How to peak carbon emissions of provincial construction industry? Scenario analysis of Jiangsu Province. Renew. Sustain. Energy Rev. 2021, 144, 110953. [Google Scholar] [CrossRef]
- Wang, Z.; Zhang, Z.; Liu, J. Exploring spatial heterogeneity and factors influencing construction and demolition waste in China. Environ. Sci. Pollut. Res. Int. 2022, 29, 53269–53292. [Google Scholar] [CrossRef]
- Padilla-Rivera, A.; Amor, B.; Blanchet, P. Evaluating the Link between Low Carbon Reductions Strategies and Its Performance in the Context of Climate Change: A Carbon Footprint of a Wood-Frame Residential Building in Quebec, Canada. Sustainability 2018, 10, 2715. [Google Scholar] [CrossRef]
- Wang, J.; Chen, L.; Chen, L.; Zhao, X.; Wang, M.; Ju, Y.; Xin, L. City-Level Features of Energy Footprints and Carbon Dioxide Emissions in Sichuan Province of China. Energies 2019, 12, 2025. [Google Scholar] [CrossRef]
- Lin, B.; Li, Z. Spatial analysis of mainland cities’ carbon emissions of and around Guangdong-Hong Kong-Macao Greater Bay area. Sustain. Cities Soc. 2020, 61, 102299. [Google Scholar] [CrossRef]
- Ma, M.; Ma, X.; Cai, W.; Cai, W. Low carbon roadmap of residential building sector in China: Historical mitigation and prospective peak. Appl. Energy 2020, 273, 115247. [Google Scholar] [CrossRef]
- Hong, T.; Ji, C.; Jang, M.; Park, H. Assessment Model for Energy Consumption and Greenhouse Gas Emissions during Building Construction. J. Manag. Eng. 2014, 30, 226–235. [Google Scholar] [CrossRef]
- Syngros, G.; Balaras, C.A.; Koubogiannis, D.G. Embodied CO2 Emissions in Building Construction Materials of Hellenic Dwellings. Procedia Environ. Sci. 2017, 38, 500–508. [Google Scholar] [CrossRef]
- Chi, B.; Lu, W.; Ye, M.; Bao, Z.; Zhang, X. Construction waste minimization in green building: A comparative analysis of LEED-NC 2009 certified projects in the US and China. J. Clean. Prod. 2020, 256, 120749. [Google Scholar] [CrossRef]
- Asgari, A.; Ghorbanian, T.; Yousefi, N.; Dadashzadeh, D.; Khalili, F.; Bagheri, A.; Raei, M.; Mahvi, A.H. Quality and quantity of construction and demolition waste in Tehran. J. Environ. Health Sci. Eng. 2017, 15, 14. [Google Scholar] [CrossRef]
- Li, Y.; Li, M.; Sang, P. A bibliometric review of studies on construction and demolition waste management by using CiteSpace. Energy Build. 2022, 258, 111822. [Google Scholar] [CrossRef]
- Li, Z.; Deng, Q.; Bai, J.; Li, Y.; Wang, Y.; Liu, N.; Gong, Y. Management system for engineering and decoration waste: An exploratory study in Shenzhen. J. Environ. Manag. 2022, 314, 115085. [Google Scholar] [CrossRef]
- Mohanty, M.; Mohapatra, S.S.; Nayak, S. Efficacy of C&D waste in base/subbase layers of pavement—Current trends and future prospectives: A systematic review. Constr. Build. Mater. 2022, 340, 127726. [Google Scholar] [CrossRef]
- Jin, R.; Li, B.; Zhou, T.; Wanatowski, D.; Piroozfar, P. An empirical study of perceptions towards construction and demolition waste recycling and reuse in China. Resour. Conserv. Recycl. 2017, 126, 86–98. [Google Scholar] [CrossRef]
- Islam, R.; Nazifa, T.H.; Yuniarto, A.; Shanawaz Uddin, A.S.M.; Salmiati, S.; Shahid, S. An empirical study of construction and demolition waste generation and implication of recycling. Waste Manag. 2019, 95, 10–21. [Google Scholar] [CrossRef] [PubMed]
- Wang, T.; Li, K.; Liu, D.; Yang, Y.; Wu, D. Estimating the Carbon Emission of Construction Waste Recycling Using Grey Model and Life Cycle Assessment: A Case Study of Shanghai. Int. J. Environ. Res. Public Health 2022, 19, 8507. [Google Scholar] [CrossRef] [PubMed]
- Peng, Z.; Lu, W.; Webster, C.J. Quantifying the embodied carbon saving potential of recycling construction and demolition waste in the Greater Bay Area, China: Status quo and future scenarios. Sci. Total Environ. 2021, 792, 148427. [Google Scholar] [CrossRef]
- Cabeza, L.F.; Boquera, L.; Chàfer, M.; Vérez, D. Embodied energy and embodied carbon of structural building materials: Worldwide progress and barriers through literature map analysis. Energy Build. 2021, 231, 110612. [Google Scholar] [CrossRef]
- Lamnatou, C.; Notton, G.; Chemisana, D.; Cristofari, C. Life cycle analysis of a building-integrated solar thermal collector, based on embodied energy and embodied carbon methodologies. Energy Build. 2014, 84, 378–387. [Google Scholar] [CrossRef]
- Su, X.; Zhang, X. A detailed analysis of the embodied energy and carbon emissions of steel-construction residential buildings in China. Energy Build. 2016, 119, 323–330. [Google Scholar] [CrossRef]
- Moncaster, A.M.; Symons, K.E. A method and tool for ‘cradle to grave’ embodied carbon and energy impacts of UK buildings in compliance with the new TC350 standards. Energy Build. 2013, 66, 514–523. [Google Scholar] [CrossRef]
- Hoang, N.H.; Ishigaki, T.; Kubota, R.; Tong, T.K.; Nguyen, T.T.; Nguyen, H.G.; Yamada, M.; Kawamoto, K. Waste generation, composition, and handling in building-related construction and demolition in Hanoi, Vietnam. Waste Manag. 2020, 117, 32–41. [Google Scholar] [CrossRef]
- Tong, K.T.; Nguyen, N.T.; Nguyen, G.H.; Ishigaki, T.; Kawamoto, K. Management Assessment and Future Projections of Construction and Demolition Waste Generation in Hai Phong City, Vietnam. Sustainability 2022, 14, 9628. [Google Scholar] [CrossRef]
- Li, J.; Ding, Z.; Mi, X.; Wang, J. A model for estimating construction waste generation index for building project in China. Resour. Conserv. Recycl. 2013, 74, 20–26. [Google Scholar] [CrossRef]
- Shi, J.; Xu, Y. Estimation and forecasting of concrete debris amount in China. Resour. Conserv. Recycl. 2006, 49, 147–158. [Google Scholar] [CrossRef]
- Maués, L.M.F.; Nascimento, B.d.M.O.d.; Lu, W.; Xue, F. Estimating construction waste generation in residential buildings: A fuzzy set theory approach in the Brazilian Amazon. J. Clean. Prod. 2020, 265, 121779. [Google Scholar] [CrossRef]
- Cochran, K.; Townsend, T.; Reinhart, D.; Heck, H. Estimation of regional building-related C&D debris generation and composition: Case study for Florida, US. Waste Manag. 2007, 27, 921–931. [Google Scholar] [CrossRef] [PubMed]
- Domingo, N.; Batty, T. Construction waste modelling for residential construction projects in New Zealand to enhance design outcomes. Waste Manag. 2021, 120, 484–493. [Google Scholar] [CrossRef] [PubMed]
- Lu, W.; Lou, J.; Webster, C.; Xue, F.; Bao, Z.; Chi, B. Estimating construction waste generation in the Greater Bay Area, China using machine learning. Waste Manag. 2021, 134, 78–88. [Google Scholar] [CrossRef] [PubMed]
- Kumar, S.; Kumar, R. Forecasting of municipal solid waste generation using non-linear autoregressive (NAR) neural models. Waste Manag. 2021, 121, 206–214. [Google Scholar] [CrossRef]
- Saba, A.I.; Elsheikh, A.H. Forecasting the prevalence of COVID-19 outbreak in Egypt using nonlinear autoregressive artificial neural networks. Process. Saf. Environ. Prot. 2020, 141, 1–8. [Google Scholar] [CrossRef]
- Liu, J.; Wu, P.; Jiang, Y.; Wang, X. Explore potential barriers of applying circular economy in construction and demolition waste recycling. J. Clean. Prod. 2021, 326, 129400. [Google Scholar] [CrossRef]
- Yuan, J.; Zeng, X.; Chen, M. Estimating the construction waste generation in Jinan using the grey system theory. China Environ. Sci. 2020, 40, 3894–3902. (In Chinese) [Google Scholar] [CrossRef]
- Ding, S.; Dang, Y.-G.; Li, X.-M.; Wang, J.-J.; Zhao, K. Forecasting Chinese CO2 emissions from fuel combustion using a novel grey multivariable model. J. Clean. Prod. 2017, 162, 1527–1538. [Google Scholar] [CrossRef]
- Nguyen, X.C.; Nguyen, T.T.H.; La, D.D.; Kumar, G.; Rene, E.R.; Nguyen, D.D.; Chang, S.W.; Chung, W.J.; Nguyen, X.H.; Nguyen, V.K. Development of machine learning—Based models to forecast solid waste generation in residential areas: A case study from Vietnam. Resour. Conserv. Recycl. 2021, 167, 105381. [Google Scholar] [CrossRef]
- Wang, J.; Wu, H.; Duan, H.; Zillante, G.; Zuo, J.; Yuan, H. Combining life cycle assessment and Building Information Modelling to account for carbon emission of building demolition waste: A case study. J. Clean. Prod. 2018, 172, 3154–3166. [Google Scholar] [CrossRef]
- Wu, H.; Duan, H.; Zheng, L.; Wang, J.; Niu, Y.; Zhang, G. Demolition waste generation and recycling potentials in a rapidly developing flagship megacity of South China: Prospective scenarios and implications. Constr. Build. Mater. 2016, 113, 1007–1016. [Google Scholar] [CrossRef]
- Zheng, L.; Wu, H.; Zhang, H.; Duan, H.; Wang, J.; Jiang, W.; Dong, B.; Liu, G.; Zuo, J.; Song, Q. Characterizing the generation and flows of construction and demolition waste in China. Constr. Build. Mater. 2017, 136, 405–413. [Google Scholar] [CrossRef]
- Wang, J.; Teng, Y.; Chen, Z.; Bai, J.; Niu, Y.; Duan, H. Assessment of carbon emissions of building interior decoration and renovation waste disposal in the fast-growing Greater Bay Area, China. Sci. Total Environ. 2021, 798, 149158. [Google Scholar] [CrossRef]
- Luo, X.; Ren, M.; Zhao, J.; Wang, Z.; Ge, J.; Gao, W. Life cycle assessment for carbon emission impact analysis for the renovation of old residential areas. J. Clean. Prod. 2022, 367, 132930. [Google Scholar] [CrossRef]
- MOHURD. Building Carbon Emission Calculation Standard. 2019. Available online: https://www.mohurd.gov.cn/gongkai/fdzdgknr/tzgg/201905/20190530_240723.html (accessed on 20 July 2022).
- NDRC. “Fourteen Five” Circular Economy Development Plan. 2021. Available online: https://www.ndrc.gov.cn/xxgk/zcfb/ghwb/202107/t20210707_1285527.html (accessed on 25 July 2022).
- HURDD. Urban Old Neighborhood Renovation Work Notice. 2022. Available online: http://jsszfhcxjst.jiangsu.gov.cn/art/2022/3/16/art_81994_10380425.html (accessed on 25 July 2022).
- Kofoworola, O.F.; Gheewala, S.H. Estimation of construction waste generation and management in Thailand. Waste Manag. 2009, 29, 731–738. [Google Scholar] [CrossRef]
- Lu, W.; Tam, V.W.Y. Construction waste management policies and their effectiveness in Hong Kong: A longitudinal review. Renew. Sustain. Energy Rev. 2013, 23, 214–223. [Google Scholar] [CrossRef]
- Duan, H.; Yu, D.; Zuo, J.; Yang, B.; Zhang, Y.; Niu, Y. Characterization of brominated flame retardants in construction and demolition waste components: HBCD and PBDEs. Sci Total Environ. 2016, 572, 77–85. [Google Scholar] [CrossRef]
- Wang, M.; Li, Z.; Chen, L.; Liu, P.; Zhang, R.; Liu, W.; Ma, Y.; Wang, Y.; Li, X. Energy conservation and carbon reduction potential for solid waste in China. Environ. Sci Pollut. Res. Int. 2020, 27, 42158–42167. [Google Scholar] [CrossRef] [PubMed]
- Duan, H.; Hou, C.; Yang, W.; Song, J. Towards lower CO2 emissions in iron and steel production: Life cycle energy demand-LEAP based multi-stage and multi-technique simulation. Sustain. Prod. Consum. 2022, 32, 270–281. [Google Scholar] [CrossRef]
- Dong, H.; Geng, Y.; Yu, X.; Li, J. Uncovering energy saving and carbon reduction potential from recycling wastes: A case of Shanghai in China. J. Clean. Prod. 2018, 205, 27–35. [Google Scholar] [CrossRef]


| Parameter | Unit | Value | Reference |
|---|---|---|---|
| Construction waste generation rate per unit area | t/m2 | 0.055 | Liu et al. [42] |
| Demolition waste generation rate per unit area | t/m2 | 1.35 | Liang et al. [3] |
| Residential renovation waste generation rate per unit area | t/m2 | 0.1 | Liang et al. [3] |
| Non-residential renovation waste generation rate per unit area | t/m2 | 0.15 | Liang et al. [3] |
| Construction demolition area coefficient | % | 20 | Yuan et al. [43] |
| Year | Construction Area | Completed Residential Area | Completed Non-Residential Area |
|---|---|---|---|
| 2000 | 42.68 | 17.75 | 3.68 |
| 2001 | 48.58 | 19.24 | 4.18 |
| 2002 | 61.16 | 22.63 | 4.34 |
| 2003 | 89.25 | 26.21 | 5.00 |
| 2004 | 123.16 | 32.17 | 6.89 |
| 2005 | 156.19 | 44.98 | 10.02 |
| 2006 | 191.08 | 47.46 | 11.88 |
| 2007 | 232.22 | 51.61 | 11.79 |
| 2008 | 281.88 | 54.90 | 12.15 |
| 2009 | 299.54 | 67.31 | 17.11 |
| 2010 | 351.07 | 65.54 | 21.43 |
| 2011 | 405.00 | 64.77 | 19.71 |
| 2012 | 450.98 | 76.87 | 21.61 |
| 2013 | 525.74 | 75.84 | 21.27 |
| 2014 | 576.38 | 72.59 | 23.61 |
| 2015 | 581.18 | 79.30 | 23.67 |
| 2016 | 587.62 | 76.03 | 24.71 |
| 2017 | 594.64 | 70.90 | 24.92 |
| 2018 | 626.73 | 63.60 | 21.76 |
| 2019 | 656.87 | 69.69 | 24.00 |
| 2020 | 678.89 | 82.73 | 28.78 |
| Material | Construction and Demolition Waste Percentage | Renovation Waste Percentage | CDRW Recycling Rate |
|---|---|---|---|
| Steel | 7 | 2 | 75 |
| Concrete | 48 | 31 | 75 |
| Wood | 2 | 3 | 20 |
| Bricks | 21 | 42 | 55 |
| Ceramics | 10 | 18 | 55 |
| Glass | 4 | 0.5 | 50 |
| Mortar | 8 | − | 8 |
| Material | Carbon Emission Factor of Product Stage (kg CO2e/t) | Distance (km) | Carbon Emission Factor of Transportation Stage (kg CO2e/(t·km)) | Carbon Emission Factor of Process Stage (kg CO2e/t) |
|---|---|---|---|---|
| Steel | 2380 | 500 | 0.057 | 430 |
| Concrete | 295 | 40 | 0.057 | 15 |
| Wood | 200 | 500 | 0.057 | 190 |
| Bricks | 292 | 40 | 0.179 | 1 |
| Ceramics | 620 | 500 | 0.057 | 550 |
| Glass | 1130 | 500 | 0.129 | 380 |
| Mortar | 735 | 500 | 0.057 | 15 |
| Material | Current Scenario (Mt CO2e) | Percentage (%) | Maximum Scenario (Mt CO2e) | Percentage (%) |
|---|---|---|---|---|
| Steel | 23.16 | 39.48 | 30.88 | 32.02 |
| Concrete | 22.31 | 38.04 | 29.75 | 30.84 |
| Wood | 0.03 | 0.04 | 0.13 | 0.13 |
| Bricks | 7.45 | 12.70 | 13.54 | 14.04 |
| Ceramics | 1.17 | 1.99 | 2.12 | 2.20 |
| Glass | 3.51 | 5.98 | 7.01 | 7.27 |
| Mortar | 1.04 | 1.77 | 13.01 | 13.49 |
| Total | 58.65 | 100 | 96.44 | 100 |
Publisher’s Note: MDPI stays neutral with regard to jurisdictional claims in published maps and institutional affiliations. |
© 2022 by the authors. Licensee MDPI, Basel, Switzerland. This article is an open access article distributed under the terms and conditions of the Creative Commons Attribution (CC BY) license (https://creativecommons.org/licenses/by/4.0/).
Share and Cite
Liu, H.; Guo, R.; Tian, J.; Sun, H.; Wang, Y.; Li, H.; Yao, L. Quantifying the Carbon Reduction Potential of Recycling Construction Waste Based on Life Cycle Assessment: A Case of Jiangsu Province. Int. J. Environ. Res. Public Health 2022, 19, 12628. https://doi.org/10.3390/ijerph191912628
Liu H, Guo R, Tian J, Sun H, Wang Y, Li H, Yao L. Quantifying the Carbon Reduction Potential of Recycling Construction Waste Based on Life Cycle Assessment: A Case of Jiangsu Province. International Journal of Environmental Research and Public Health. 2022; 19(19):12628. https://doi.org/10.3390/ijerph191912628
Chicago/Turabian StyleLiu, Hongmei, Rong Guo, Junjie Tian, Honghao Sun, Yi Wang, Haiyan Li, and Lu Yao. 2022. "Quantifying the Carbon Reduction Potential of Recycling Construction Waste Based on Life Cycle Assessment: A Case of Jiangsu Province" International Journal of Environmental Research and Public Health 19, no. 19: 12628. https://doi.org/10.3390/ijerph191912628
APA StyleLiu, H., Guo, R., Tian, J., Sun, H., Wang, Y., Li, H., & Yao, L. (2022). Quantifying the Carbon Reduction Potential of Recycling Construction Waste Based on Life Cycle Assessment: A Case of Jiangsu Province. International Journal of Environmental Research and Public Health, 19(19), 12628. https://doi.org/10.3390/ijerph191912628