


Spatiotemporal of the Coupling Relationship between Ecosystem Services and Human Well-Being in Guanzhong Plain Urban Agglomeration


Abstract
:1. Introduction
2. Literature Review and Research Framework
2.1. Literature Review
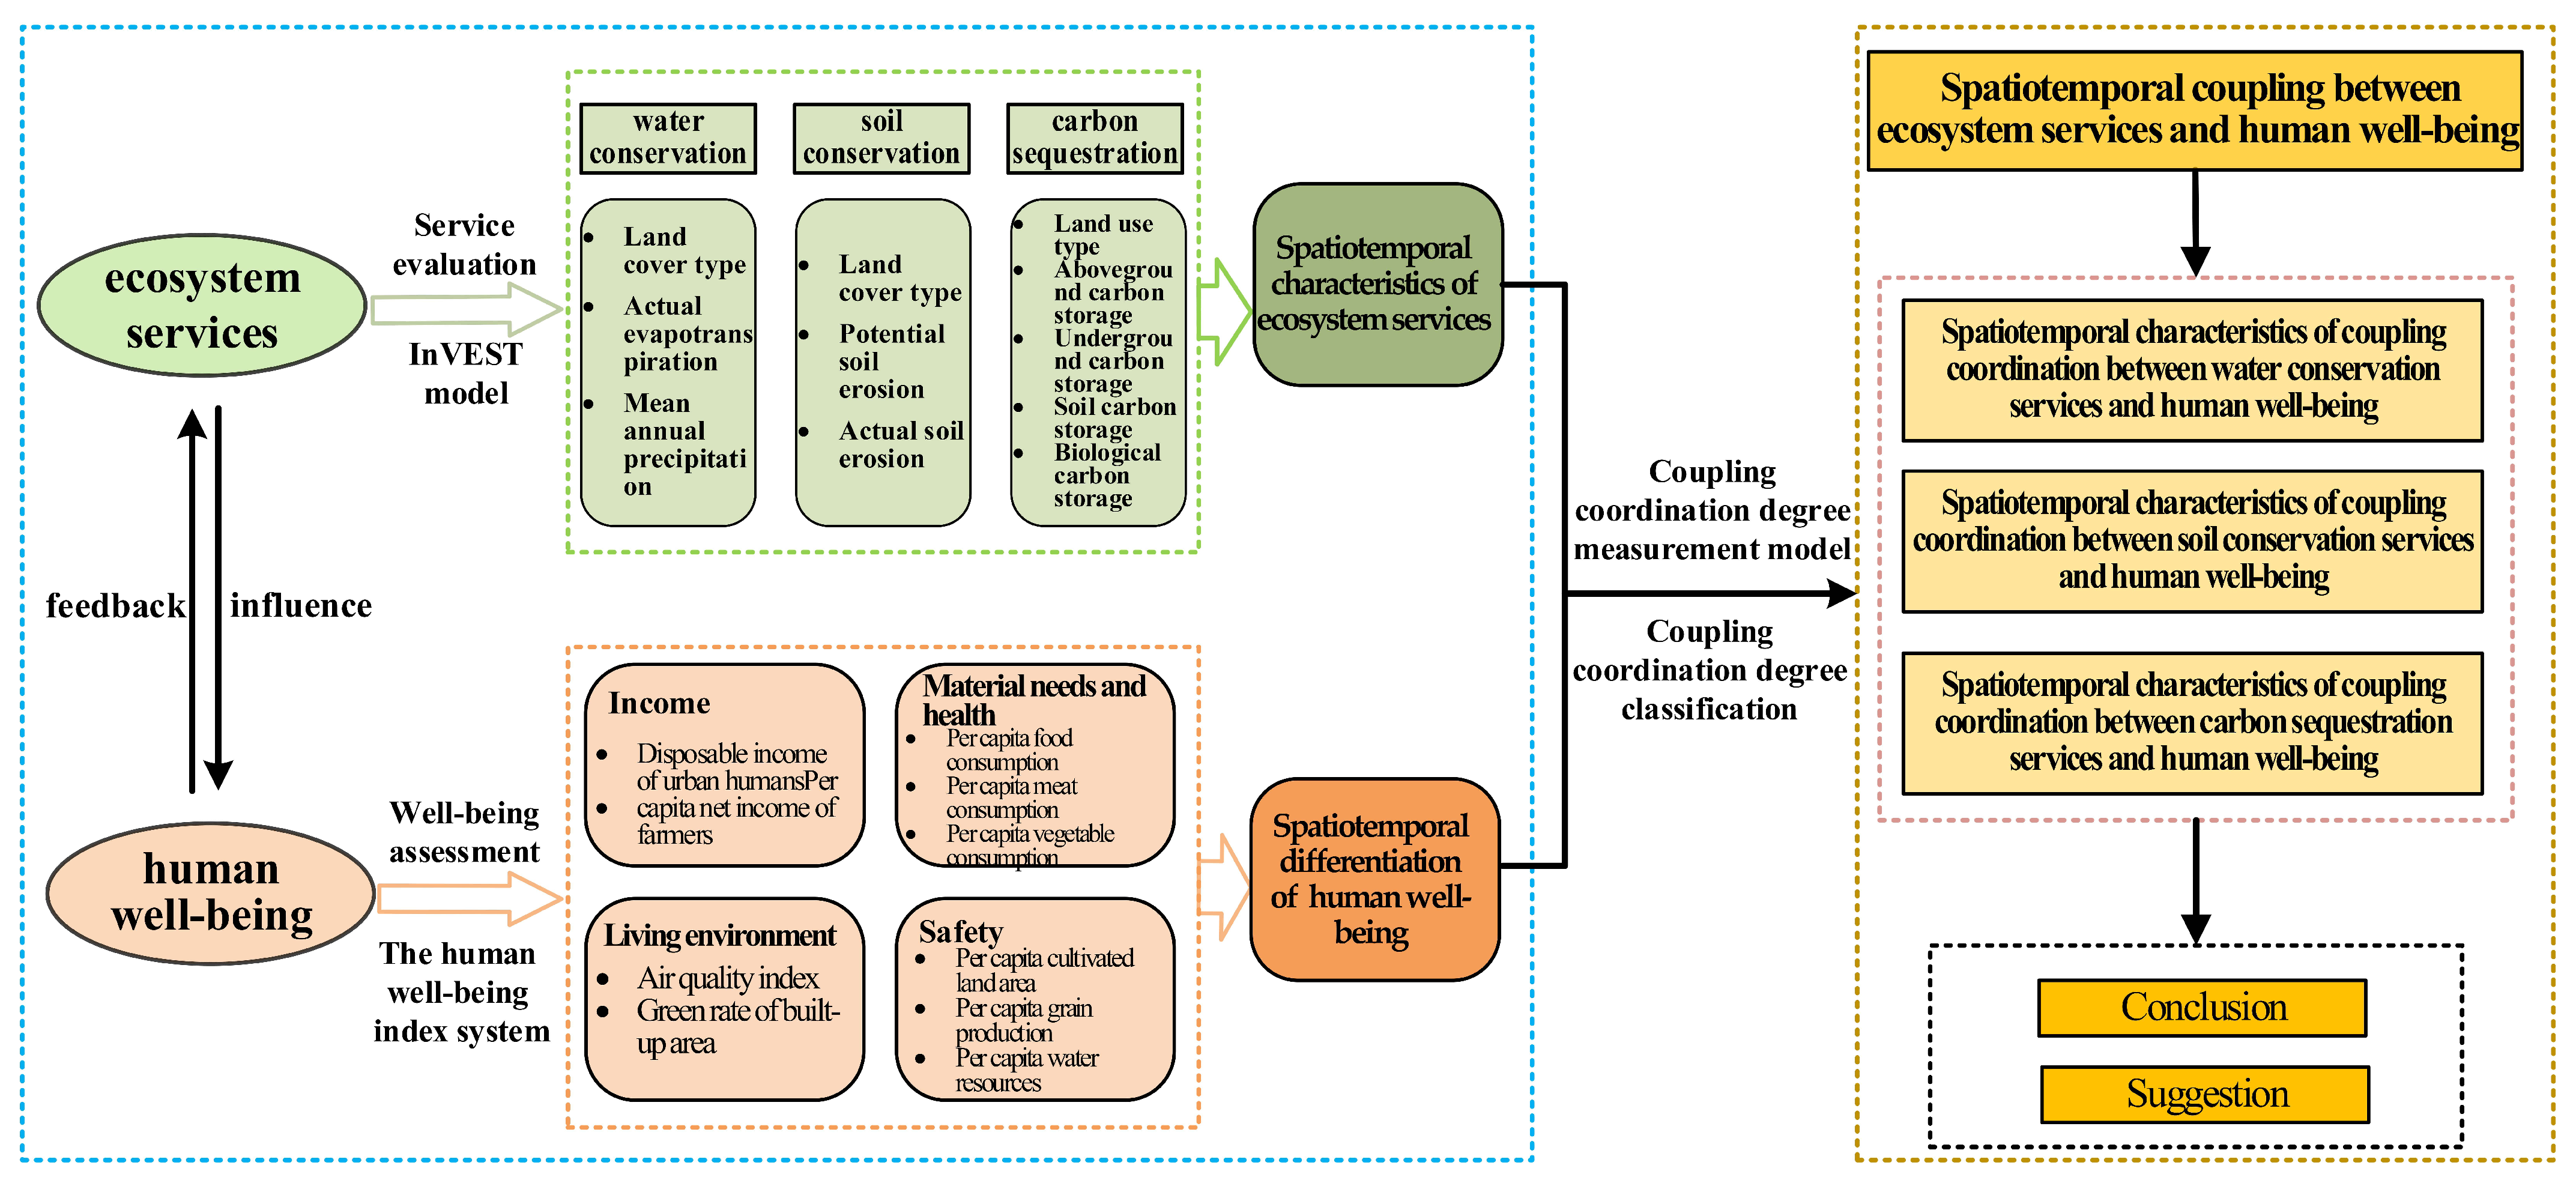
2.2. Research Framework
3. Materials and Methods
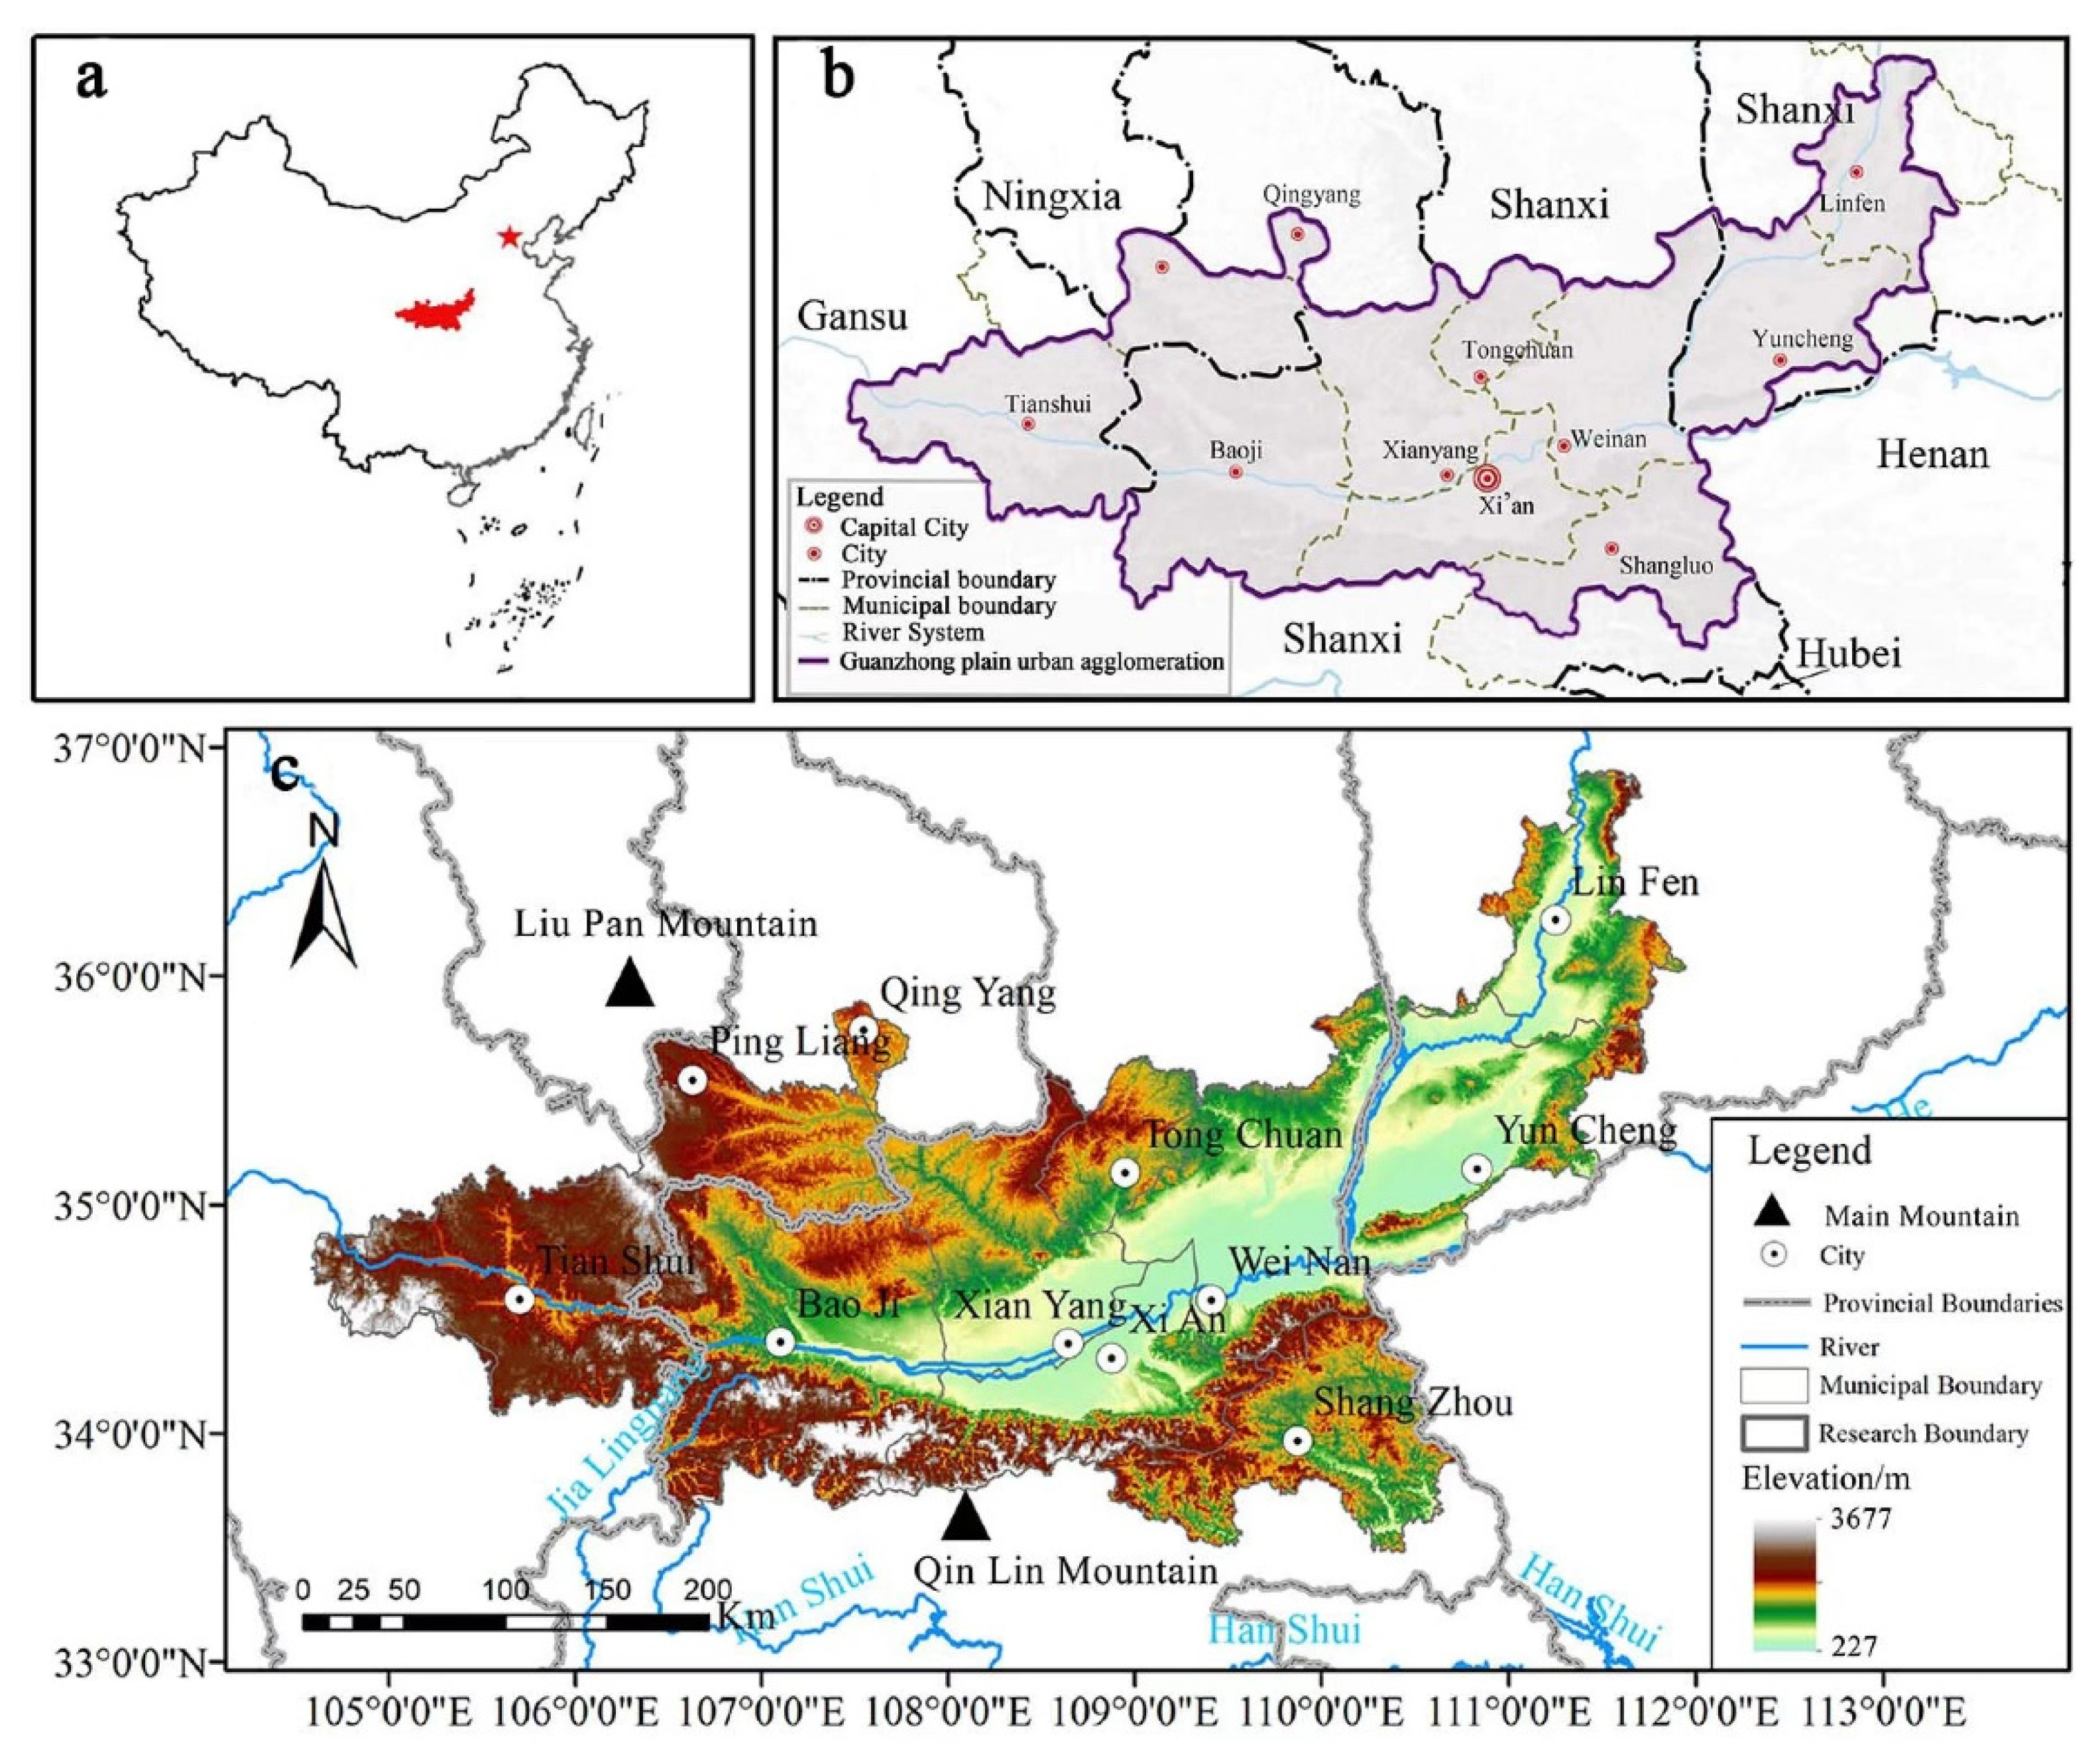
3.1. Study Area
3.2. Data Sources
3.3. Research Methods
3.3.1. Ecosystem Services
- Water Yield model
- 2.
- Sediment Delivery Ratio (SDR) model
- 3.
- Carbon Storage and Sequestration model
3.3.2. Human Well-Being Level
- The construction and evaluation of human well-being indicators
- 2.
- Analysis of hot and cold spots
3.3.3. The Coupling Relationship between Ecosystem Services and Human Well-Being
4. Results
4.1. Spatial–Temporal Characteristics of Ecosystem Services
4.1.1. Spatial–Temporal Characteristics of Water Conservation Services
4.1.2. Spatial–Temporal Characteristics of Soil Conservation Services
4.1.3. Spatial–Temporal Characteristics of Carbon Sequestration Services
4.2. Spatial-Temporal Differentiation of Human Well-Being
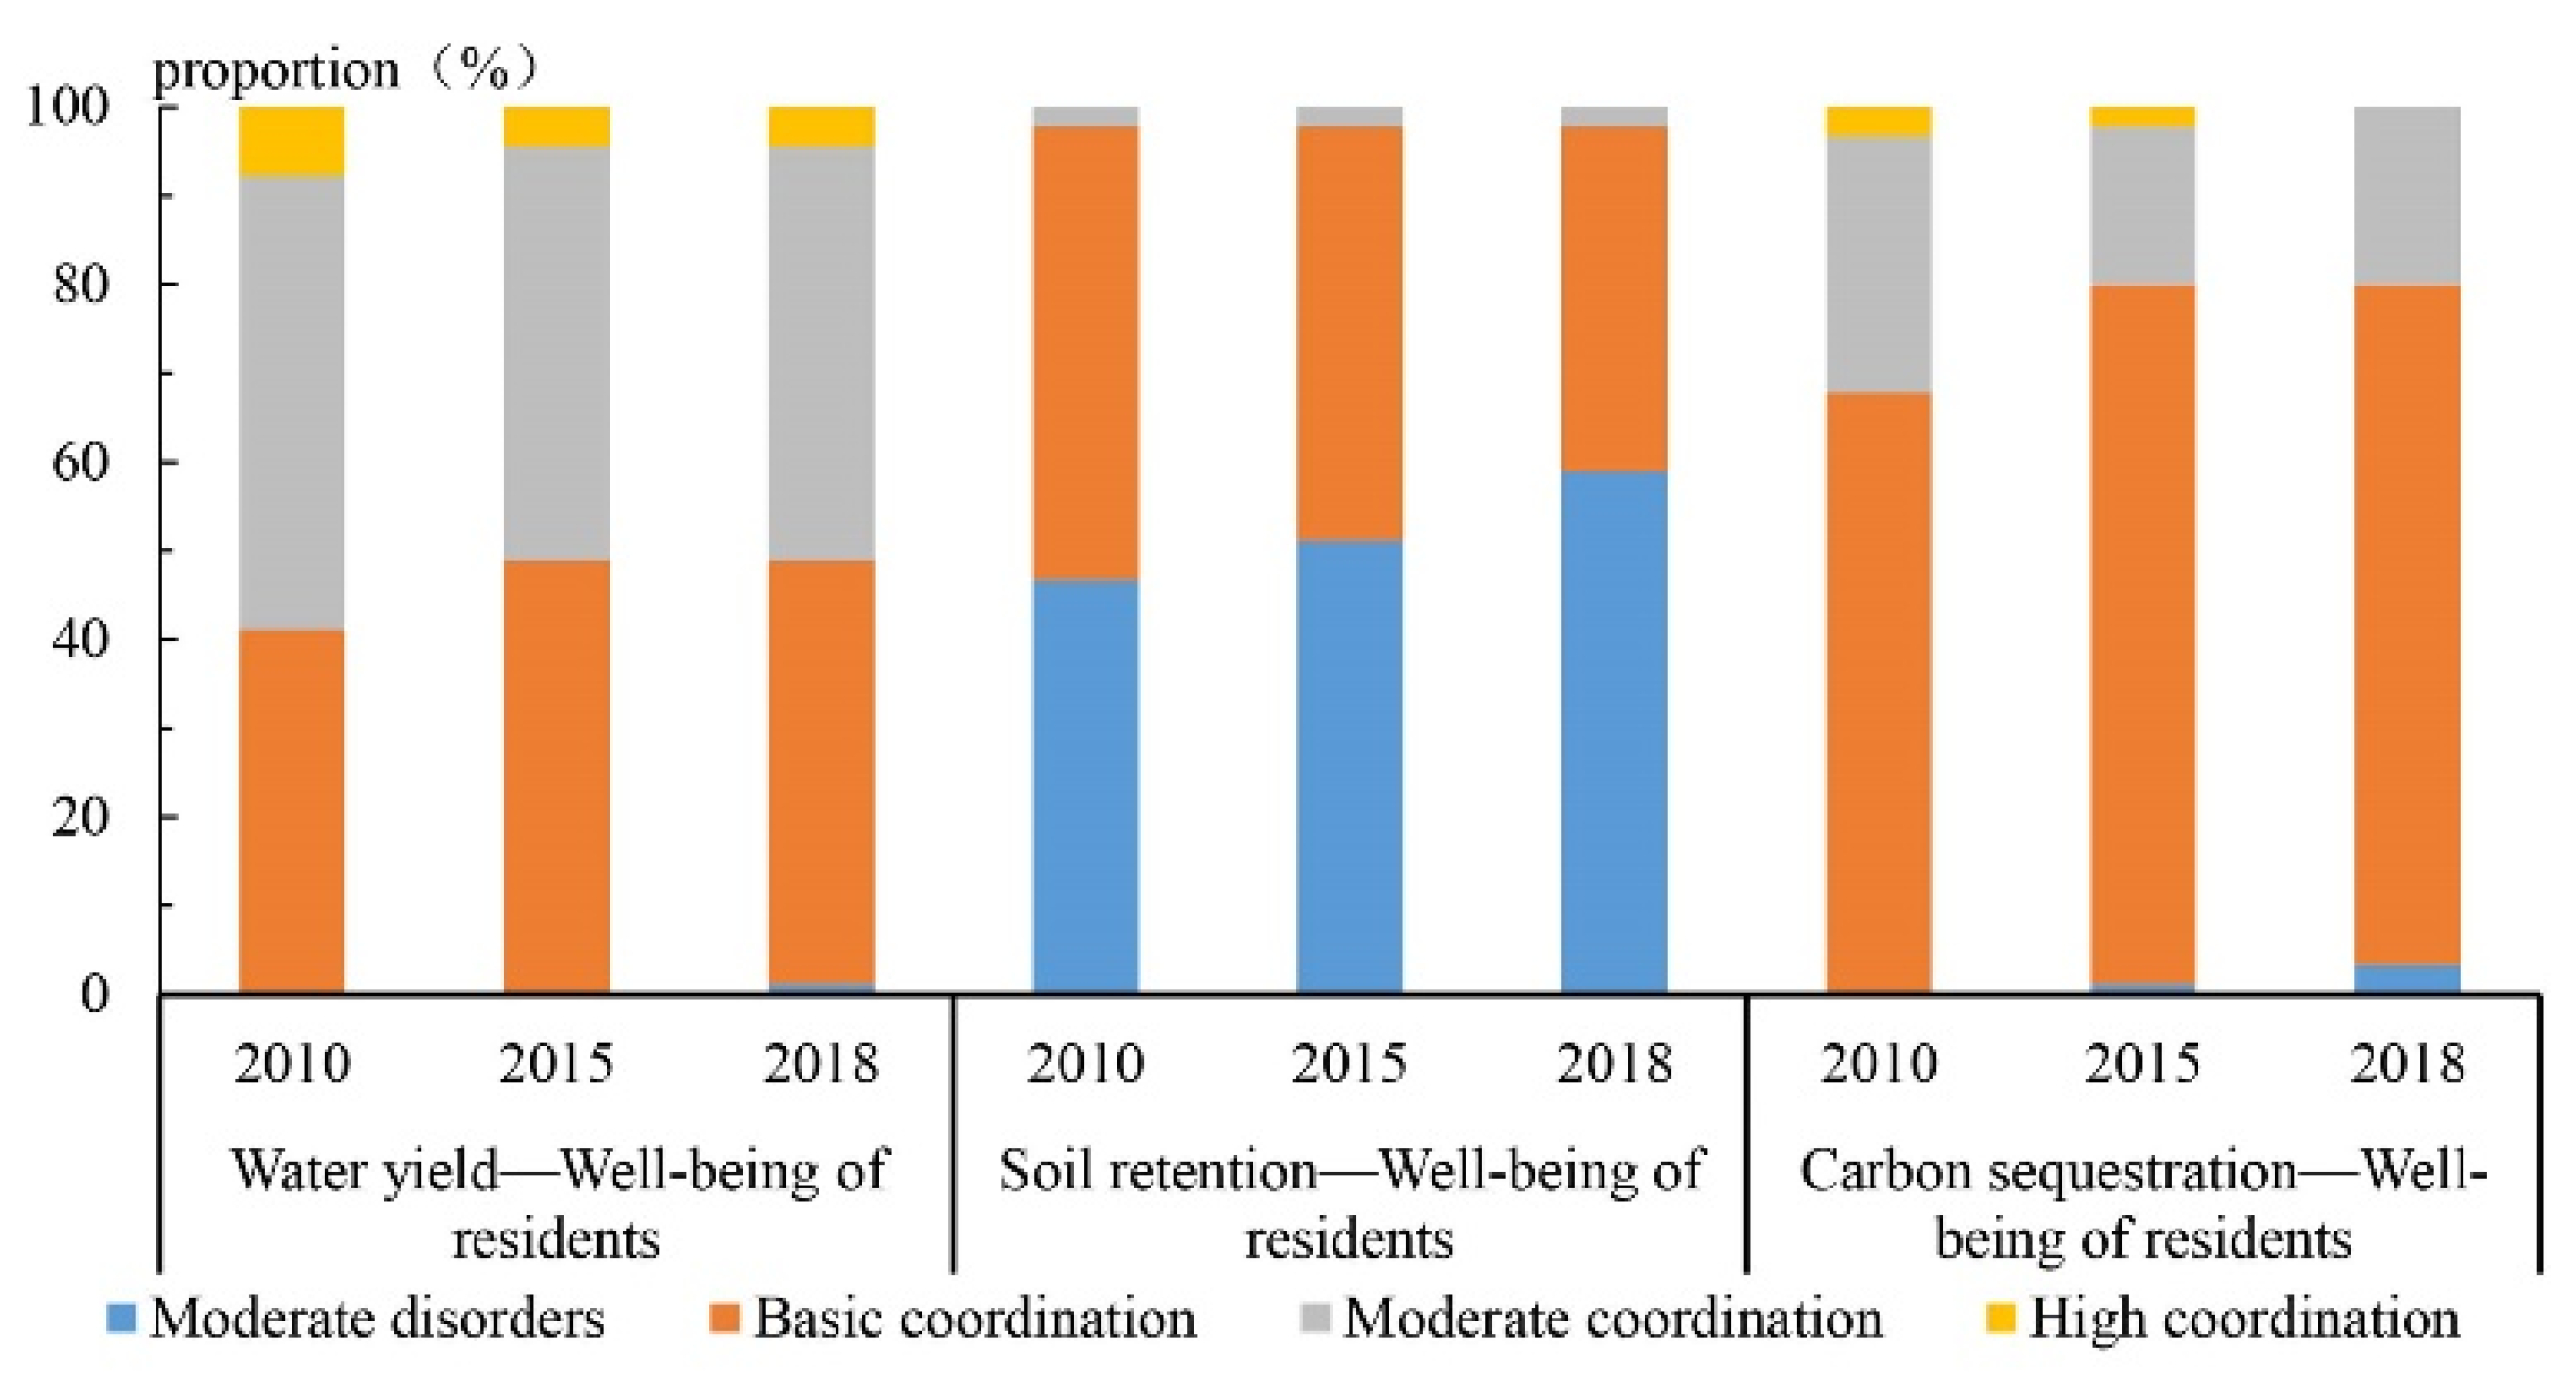
4.3. Spatiotemporal Coupling between Ecosystem Services and Human Well-Being
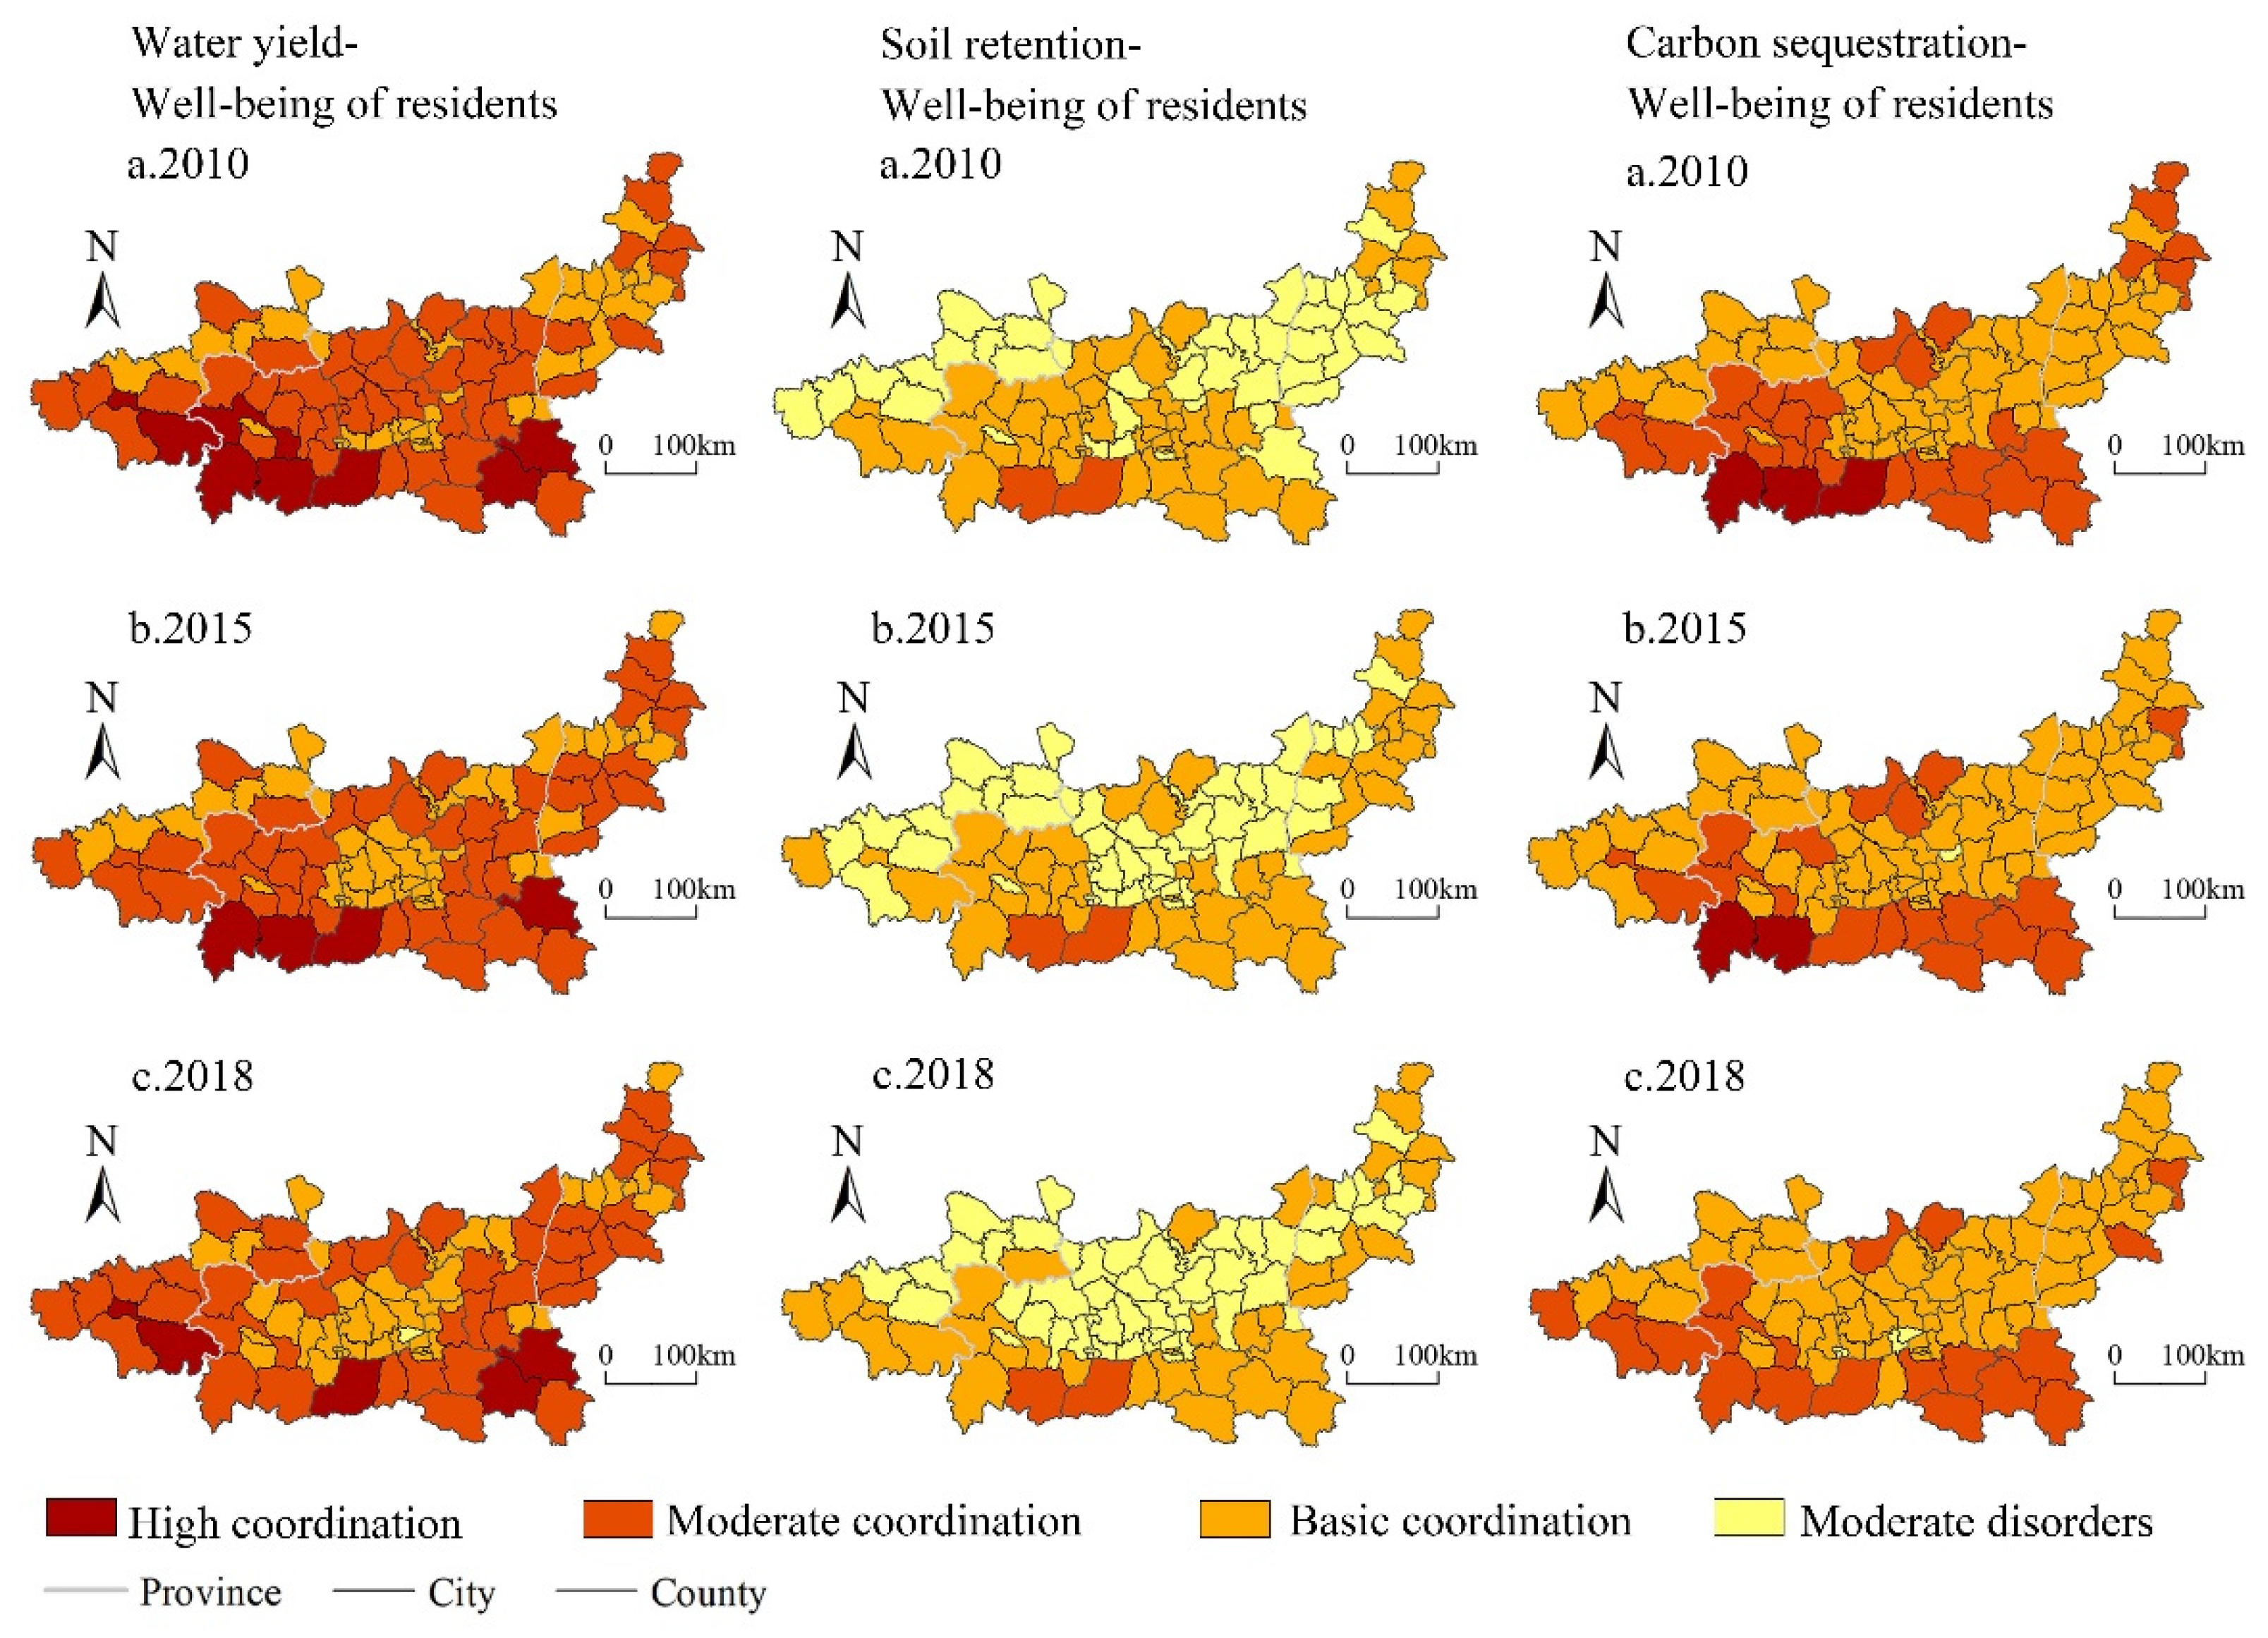
4.3.1. Spatial–Temporal Characteristics of Coupling Coordination between Water Conservation Services and Human Well-Being
4.3.2. Spatial–Temporal Characteristics of Coupling Coordination between Soil Conservation Services and Human Well-Being
4.3.3. Spatial–Temporal Characteristics of Coupling Coordination between Carbon Sequestration Services and Human Well-Being
5. Discussion
6. Conclusions and Suggestion
6.1. Conclusions
- (1)
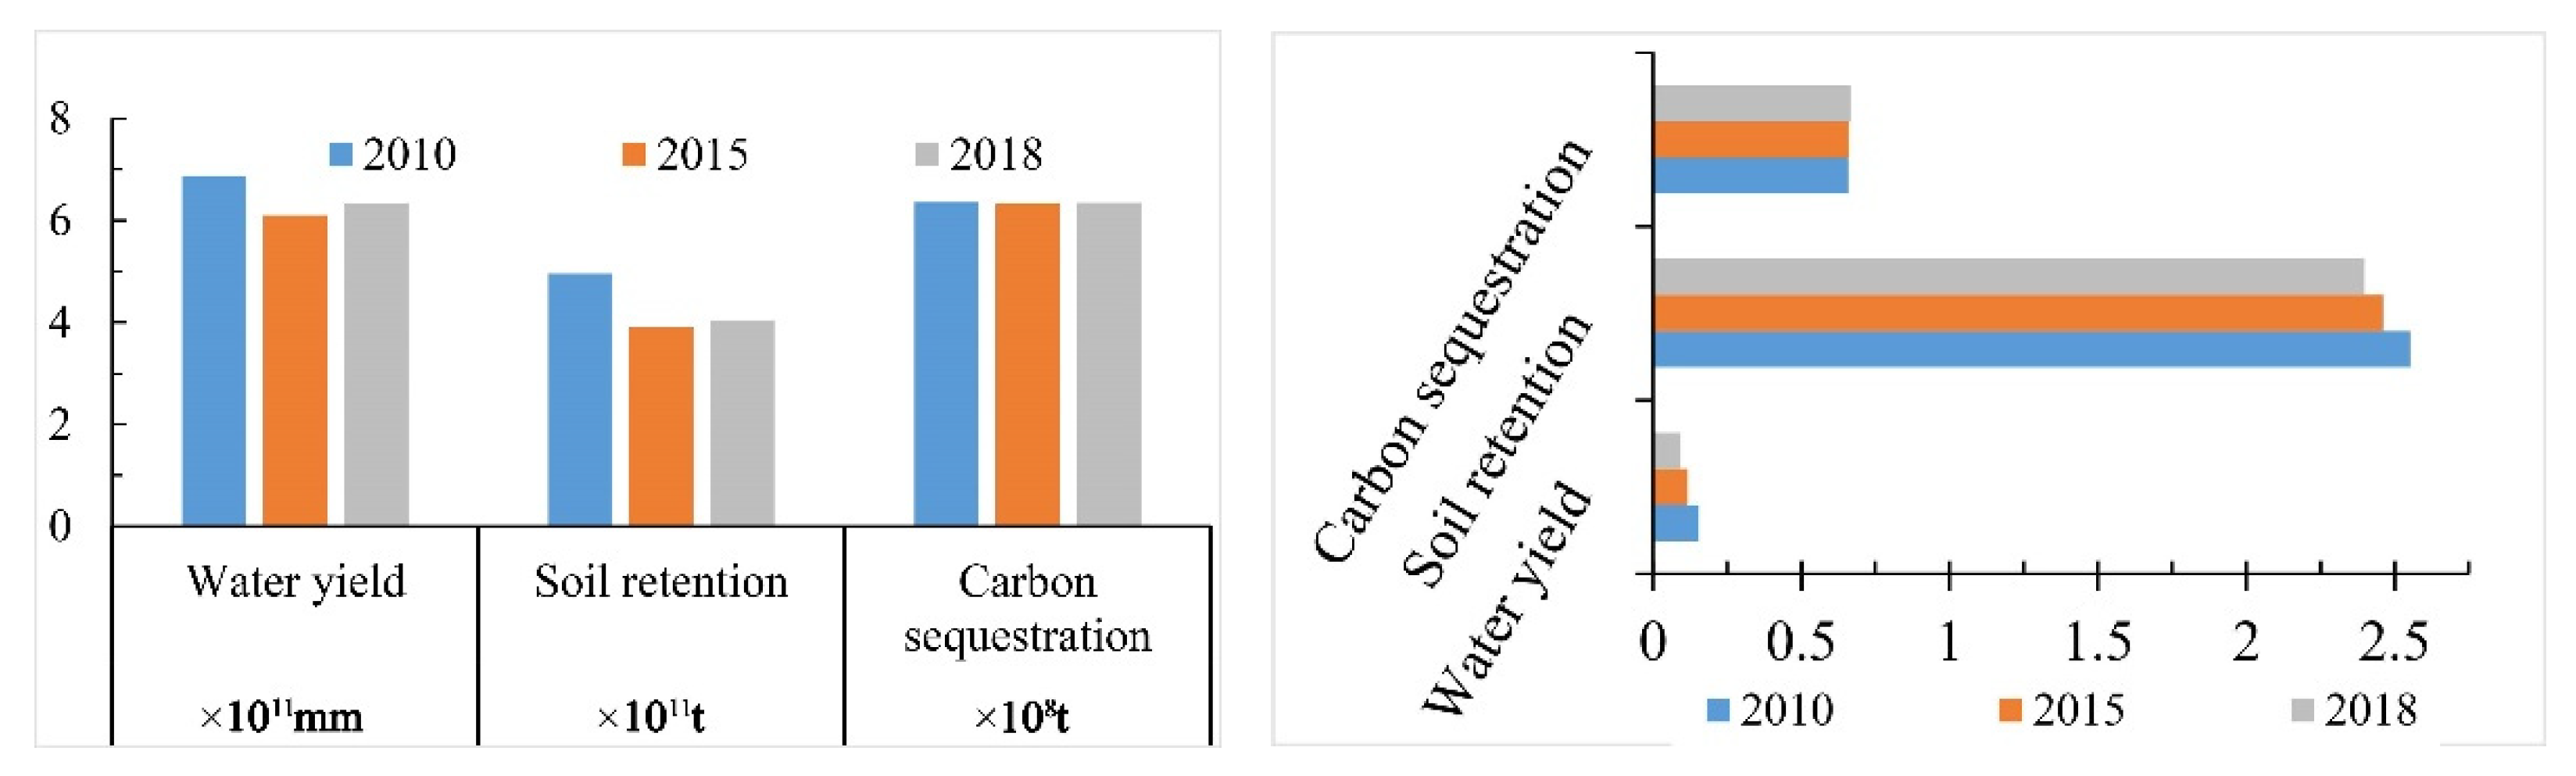
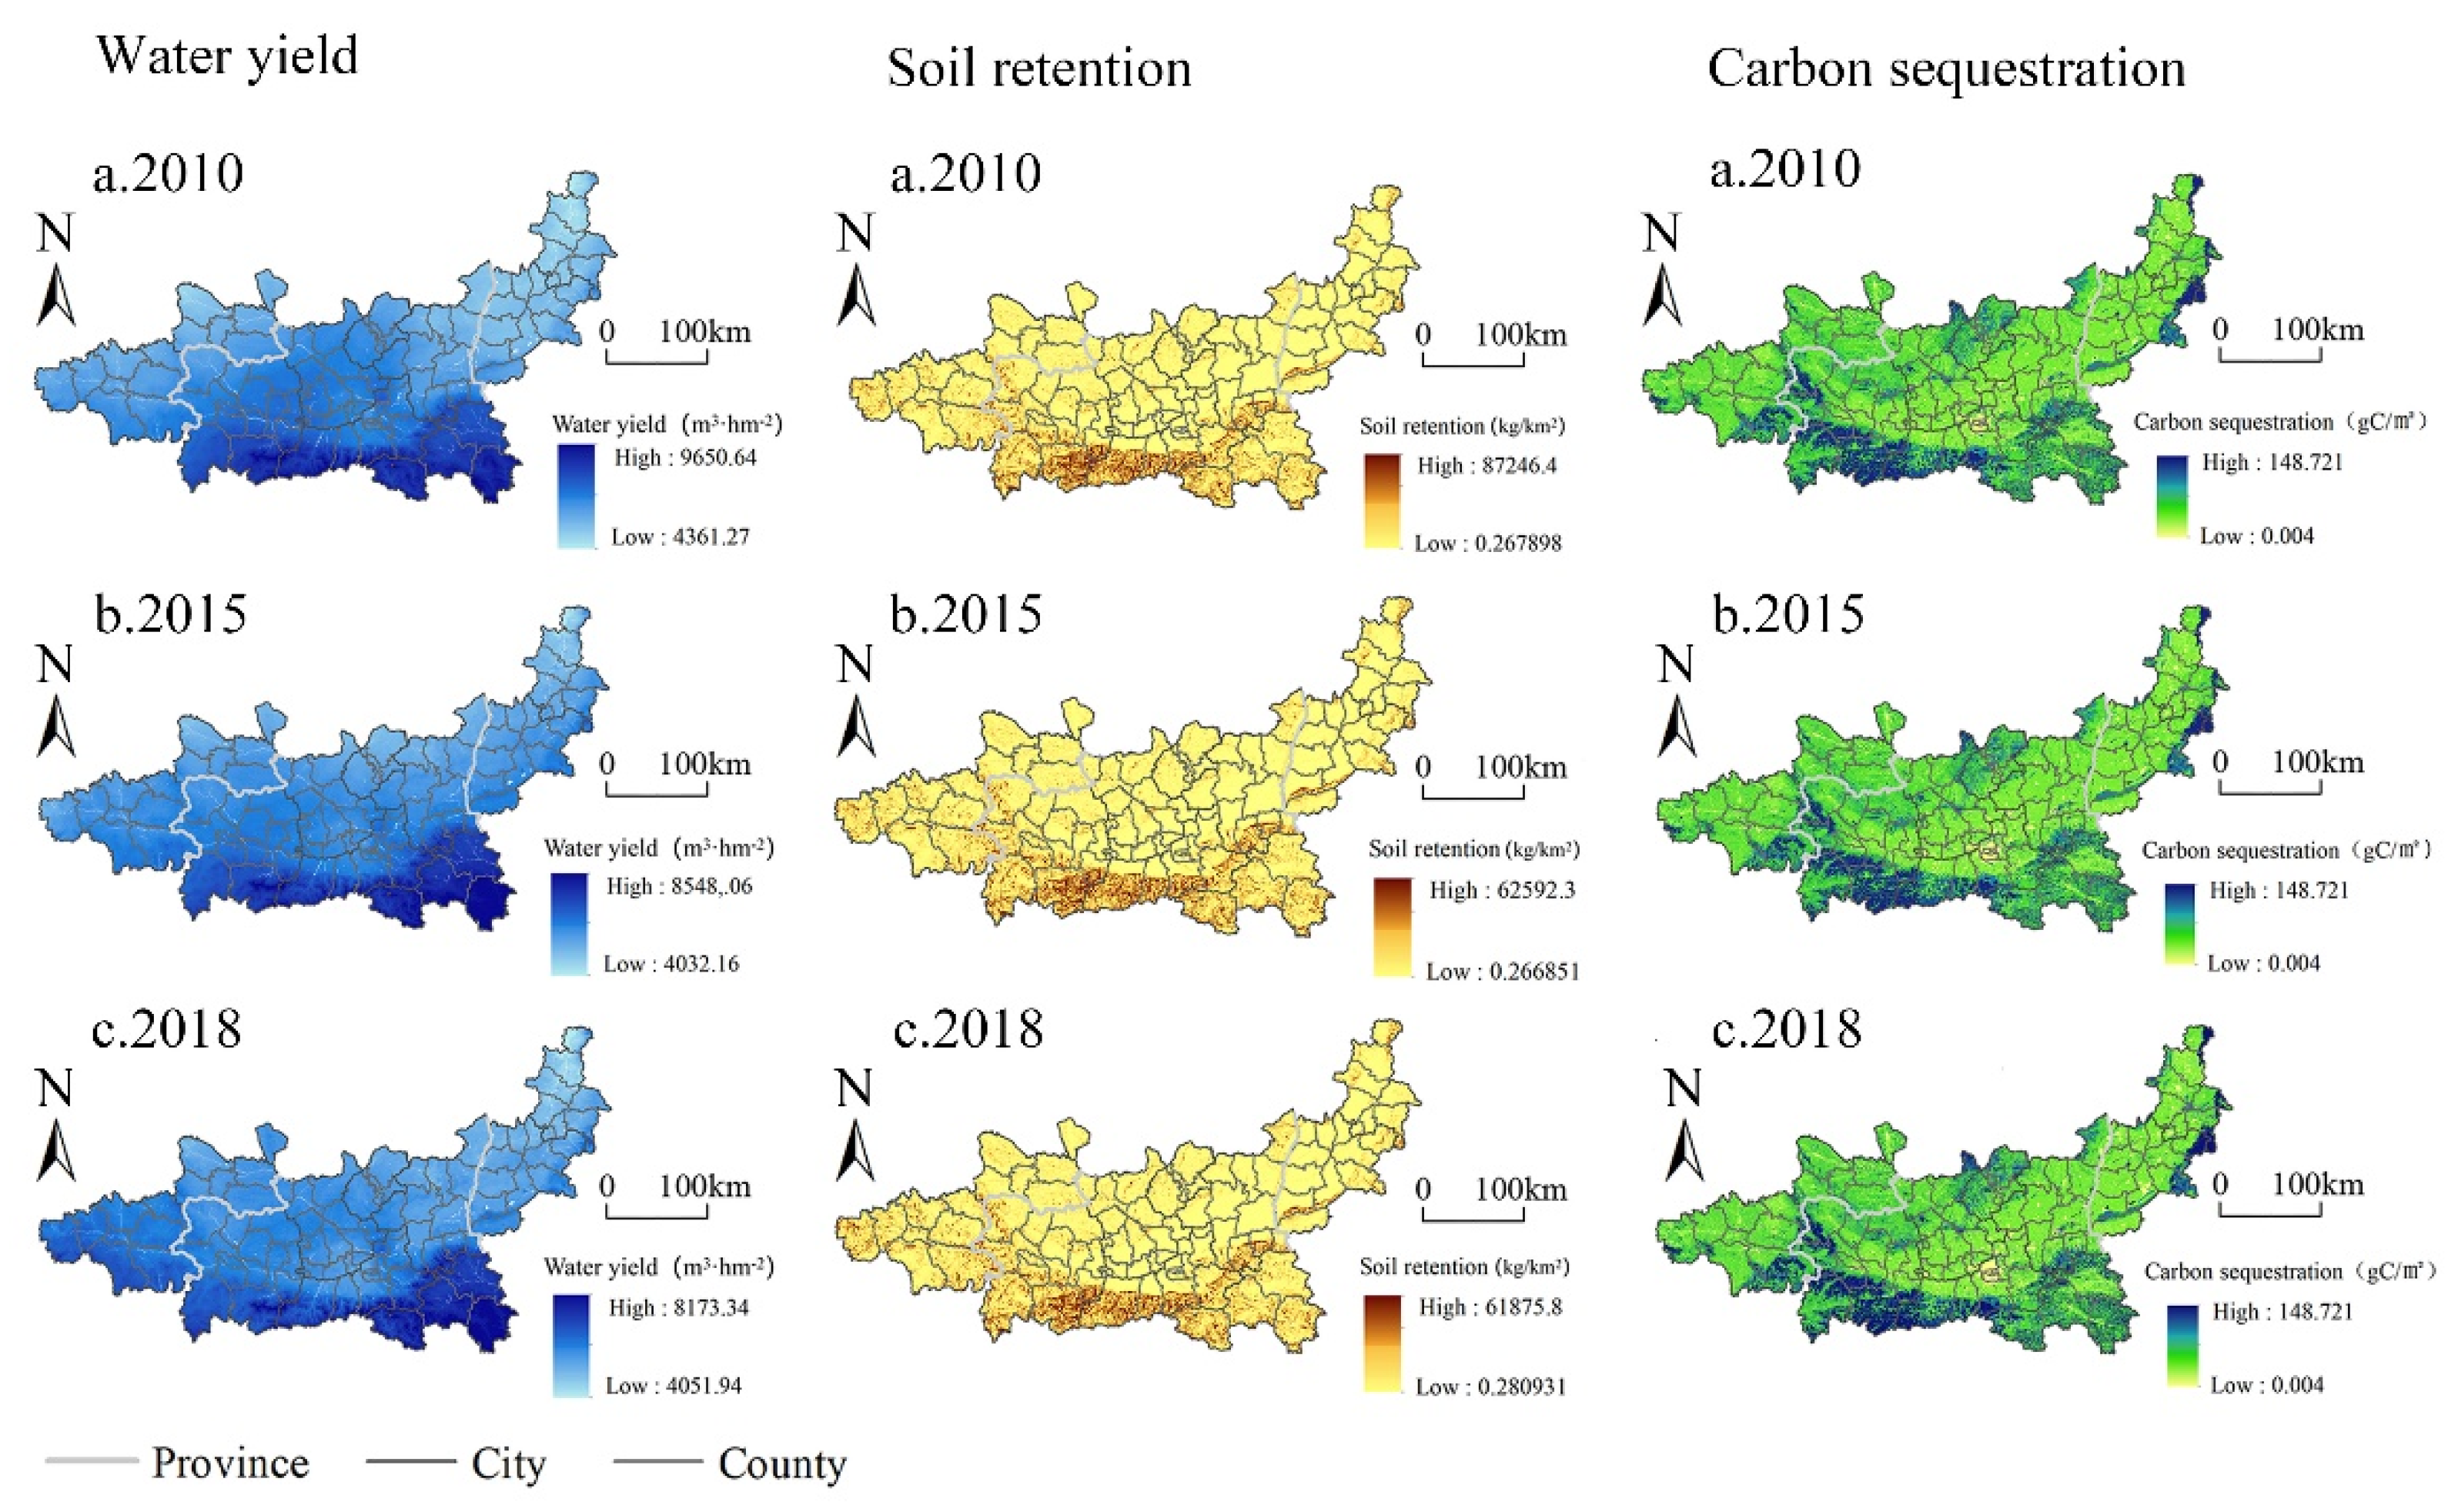
- From 2010 to 2018, three types of ecosystem services in the Guanzhong Plain urban agglomeration showed a downward trend. The amount of water conservation services showed a fluctuating downward trend, with a decrease of 7.8%. It showed a spatial distribution of “high in the south and low in the north, decreasing from south to north”. The amount of soil conservation services showed a fluctuating downward trend, with a decrease of 18.3%. It showed a spatial distribution of “higher in the south and lower in the north, higher in the west and lower in the east”. The carbon sequestration services showed a fluctuating downward trend, with a decrease of less than 1%. It showed a spatial distribution of “high in the southwest and low in the northeast”, and the regional differences tended to expand.
- (2)
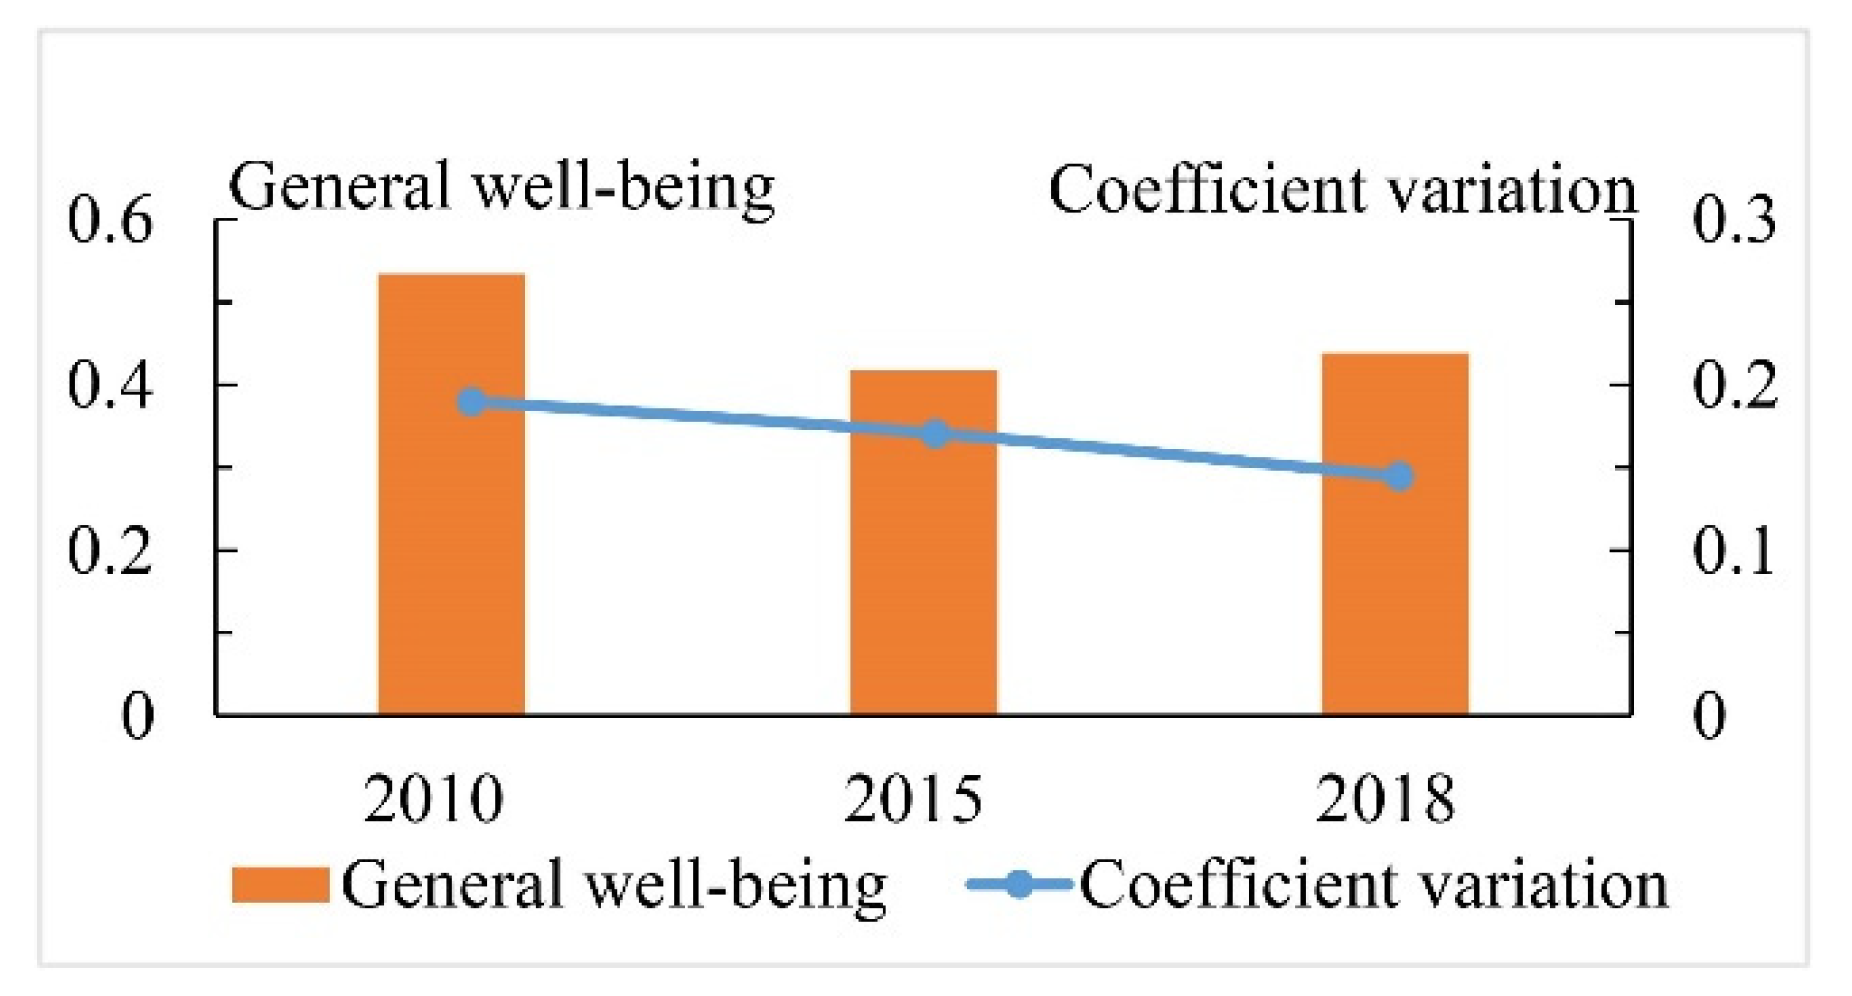
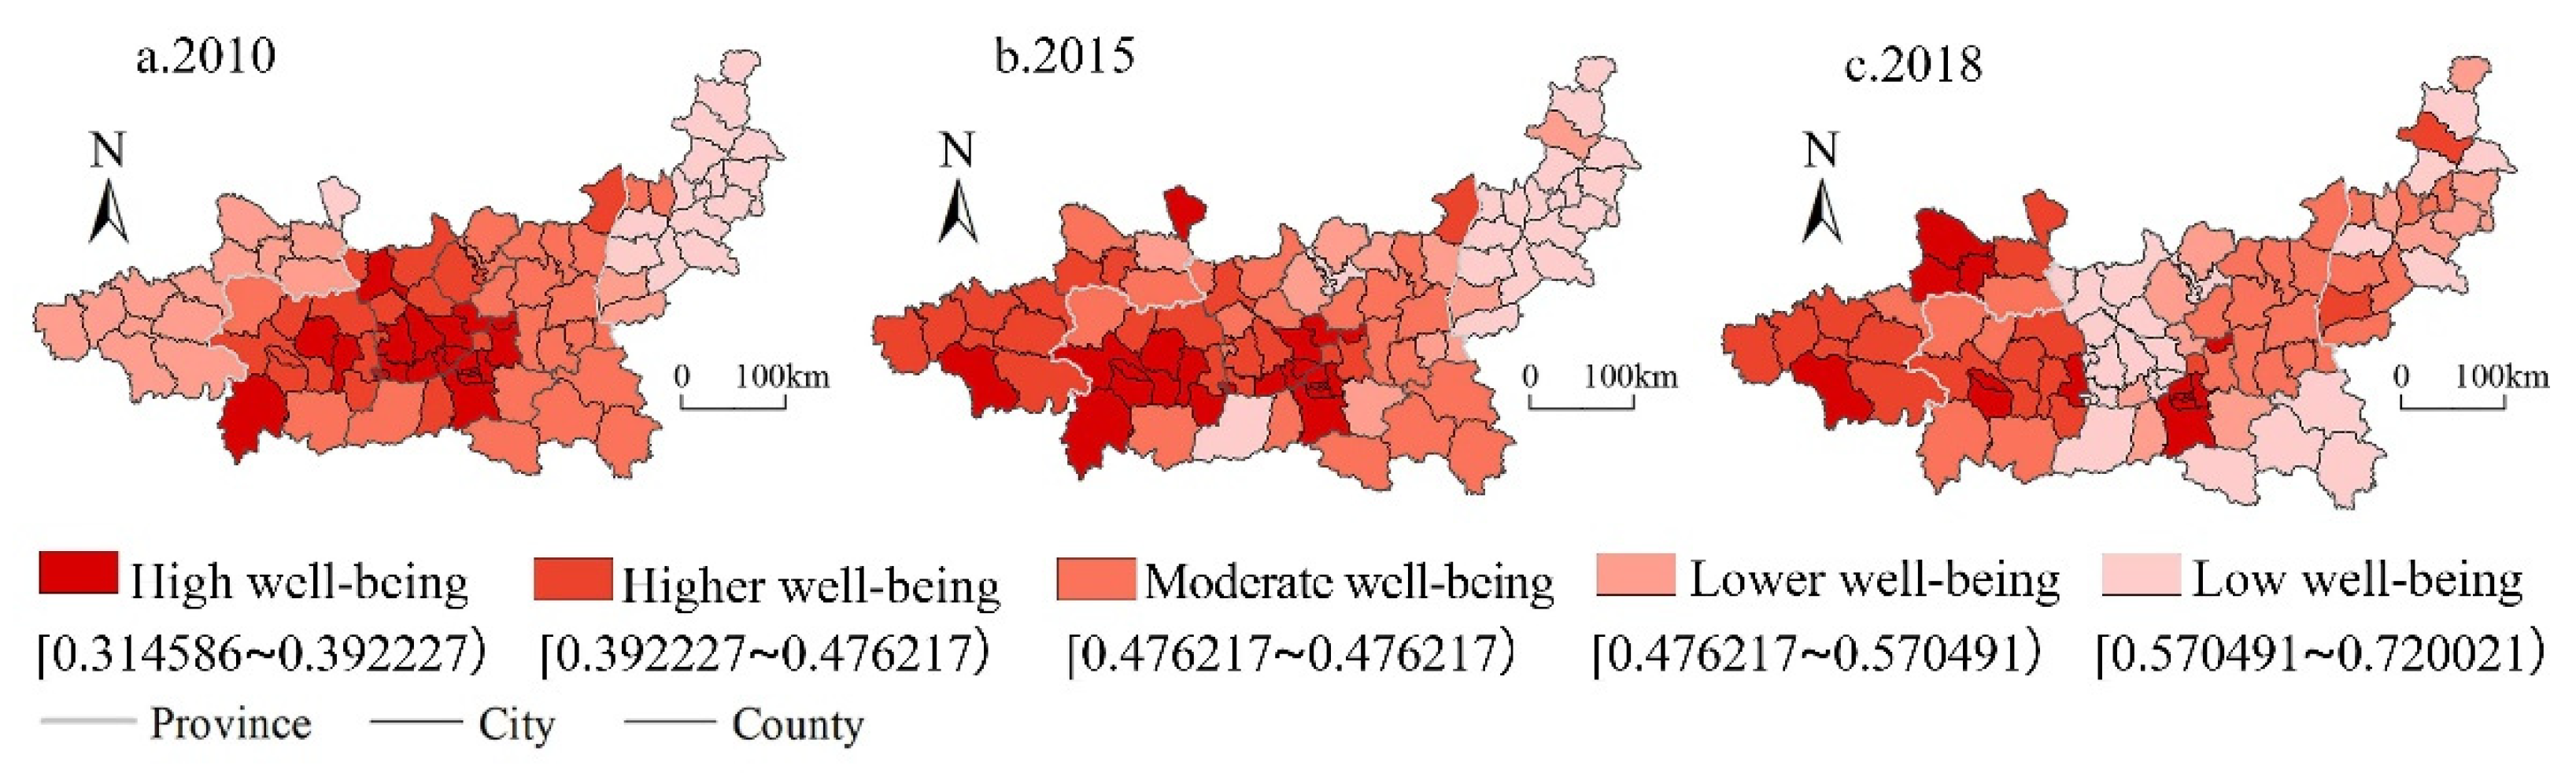
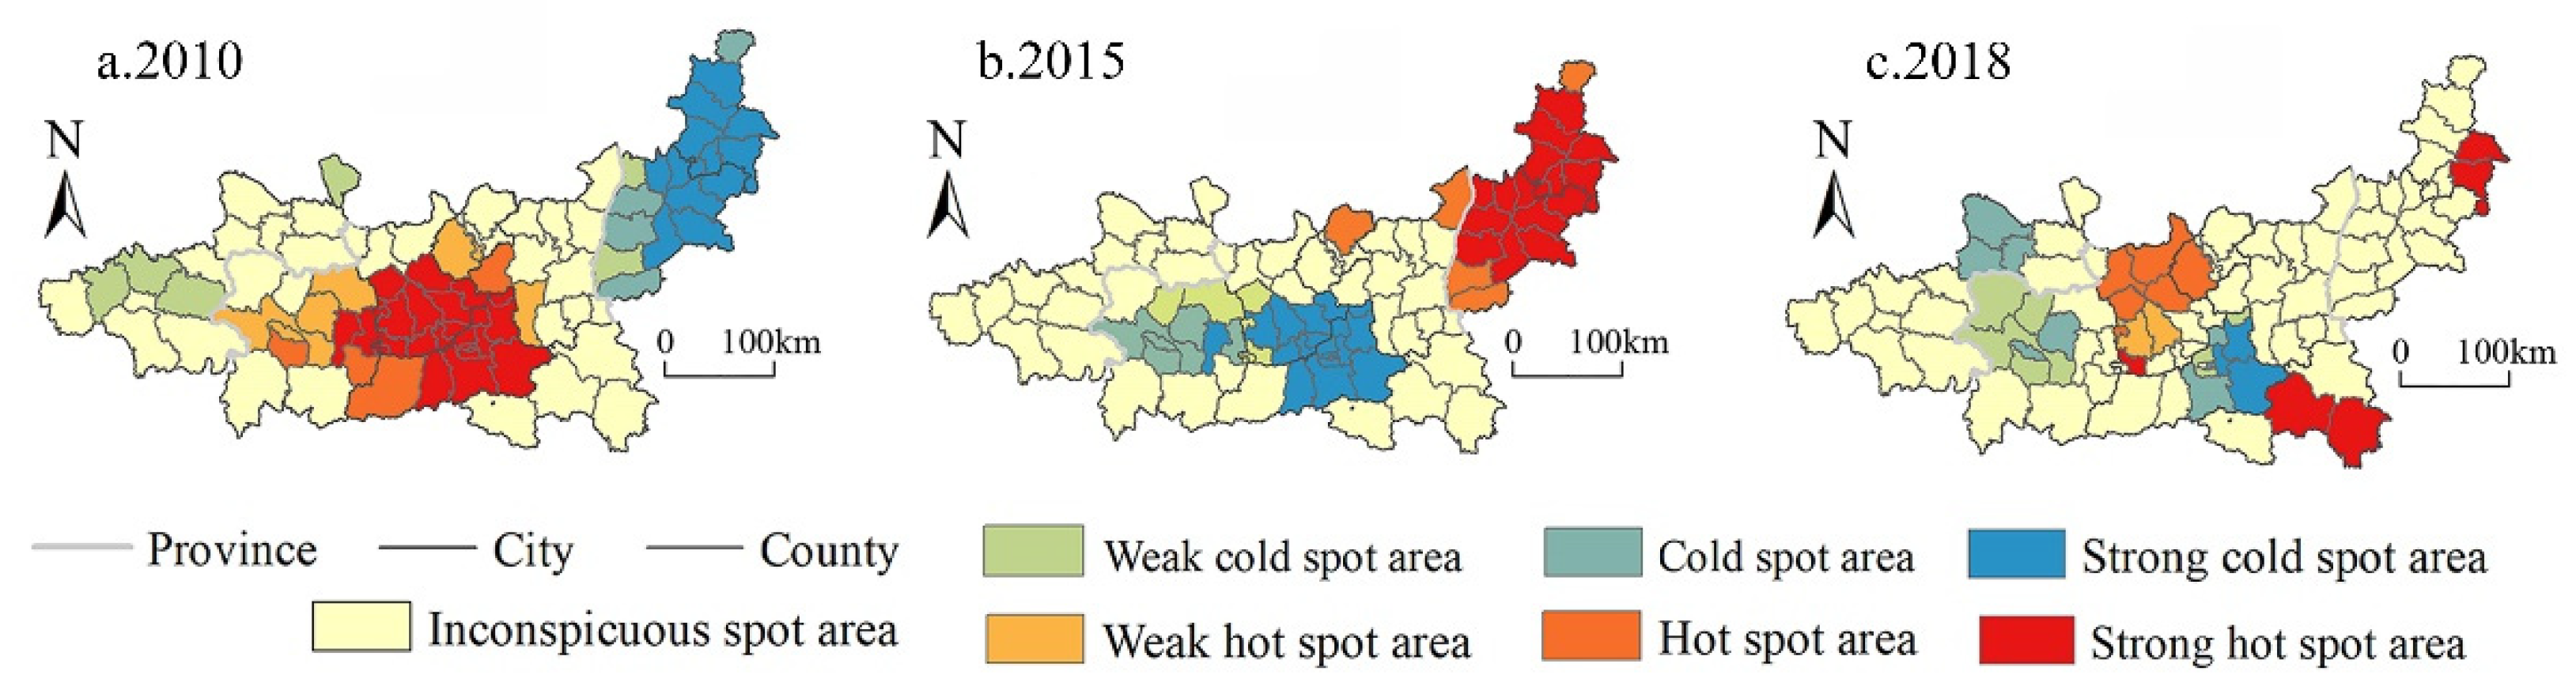
- From 2010 to 2018, human well-being in the Guanzhong Plain urban agglomeration showed a fluctuating downward trend, with a decrease of 17%. It showed a spatial distribution of “high in the middle and low around”. Regional differences tended to narrow, and the agglomeration of high-level and low-level areas of human well-being tended to weaken.
- (3)
- From 2010 to 2018, the coupling coordination degree between ecosystem services and human well-being in the Guanzhong Plain urban agglomeration showed a downward trend. The coupling coordination degree of “water conservation services and human well-being” showed a spatial distribution of “high around and low in the middle”. The overall coordination decreased from moderate to basic coordination. The coupling coordination degree of “soil conservation services-human well-being” showed a distribution of “high in the south and low in the north”. Different regions showed different evolution trends. The overall trend decreased from basic coordination to moderate imbalance. The coupling coordination degree of “carbon sequestration services and human well-being” showed a significant distribution of “higher in the south and lower in the north, higher in the west and lower in the east”. The overall level was slightly degraded while maintaining the basic coordination state.
6.2. Suggestion
Author Contributions
Funding
Institutional Review Board Statement
Informed Consent Statement
Conflicts of Interest
References
- Mendoza-González, G.; Martínez, M.; Lithgow, D.; Pérez-Maqueo, O.; Simonin, P. Land use change and its effects on the value of ecosystem services along the coast of the Gulf of Mexico. Ecol. Econ. 2012, 82, 23–32. [Google Scholar] [CrossRef]
- Li, W.Q.; Zhang, X.Y.; Du, Y.X.; Ma, P.Y. Spatio-temporal changes of the coupling relationship between ecosystem services and human well-being in Qinba Mountains Area. J. Nat. Resour. 2021, 36, 2522–2540. [Google Scholar]
- Fang, C.L.; Zhang, G.Y.; Xue, D.S. High-quality development of urban agglomerations in China and construction of science and technology collaborative innovation community. Acta Geogr. Sin. 2021, 76, 2898–2908. [Google Scholar]
- Costanza, R.; d’Arge, R.; De Groot, R.; Farber, S.; Grasso, M.; Hannon, B.; Van Den Belt, M. The value of the world’s ecosystem services and natural capital. Nature 1997, 387, 3–15. [Google Scholar] [CrossRef]
- Board, M.E.A. Millenium Ecosystem Assessment-Ecosystems and human well-being: A framework for assessment. Phys. Teach. 2003, 34, 534. [Google Scholar]
- Daily, G.C. Nature’s Services: Societal Dependence on Natural Ecosystems; Island Press: Washington, DC, USA, 1997. [Google Scholar]
- Ouyang, Z.Y.; Wang, R.S.; Zhao, J.Z. Ecosystem services and their economicvaluation. Chin. J. Appl. Ecol. 1999, 10, 635–640. [Google Scholar]
- Li, W.H.; Zhang, B.; Xie, G.D. Research on ecosystem services in China: Progress and perspectives. J. Nat. Resour. 2009, 24, 1–10. [Google Scholar]
- Mao, Q.Z.; Huang, G.L.; Wu, J.G. Urban ecosystem services: A review. Ying Yong Sheng Tai Xue Bao 2015, 26, 1023–1033. [Google Scholar]
- Summers, J.K.; Smith, L.M.; Case, J.L.; Linthurst, R.A. A review of the elements of human well-being with an emphasis on the contribution of ecosystem services. Ambio 2012, 41, 327–340. [Google Scholar] [CrossRef] [Green Version]
- Wang, B.J.; Tang, H.P. Human Well-Being and Its Applications and Prospects in Ecology. J. Ecol. Rural. Environ. 2016, 32, 697–702. [Google Scholar]
- Li, Y.; Yang, Y.Y.; Shi, R.G.; Hu, S.W.; Mi, C.H. Research progress on human well-being and its relationship with ecosystem services. J. Agric. Resour. Environ. 2022, 9, 1–14. [Google Scholar]
- Ma, L.; Jin, T.T.; Wen, Y.H. The Research Progress of InVEST Model. Ecol. Econ. 2015, 31, 126–131+179. [Google Scholar]
- Wang, S.; Luo, Y.; Han, Y.; Li, J. Regional difference and determinants of human well-being in China: Based on the analysis of human development index. Prog. Geogr. 2018, 37, 1150–1158. [Google Scholar]
- Otoiu, A.; Titan, E.; Dumitrescu, R. Are the variables used in building composite indicators of well-being relevant? Validating composite indexes of well-being. Ecol. Indic. 2014, 46, 575–585. [Google Scholar] [CrossRef]
- Yang, X.T.; Qiu, X.P.; Xv, Y. Spatial heterogeneity and dynamic features of the ecosystem services influence on human well being in the West Sichuan Mountain Areas. Acta Ecol. Sin. 2021, 41, 7555–7567. [Google Scholar]
- Liu, Z.W.; Yin, D.; Huang, Q.X.; He, C.Y.; Xue, F. Research and application progress of ecosystem services in land use planning: A bibliometric and textual analysis. Prog. Geogr. 2019, 38, 236–247. [Google Scholar]
- Willis, C. The contribution of cultural ecosystem services to understanding the tourism–nature wellbeingnexus. J. Outdoor Recreat. Tour. 2015, 10, 38–43. [Google Scholar] [CrossRef]
- Kosanic, A.; Petzold, J. A systematic review of cultural ecosystem services and human wellbeing. Ecosyst. Serv. 2020, 45, 101168. [Google Scholar] [CrossRef]
- Li, J.; Jiang, H.; Bai, Y.; Alatalo, J.M.; Li, X.; Jiang, H.; Xu, J. Indicators for spatial–temporal comparisons of ecosystem service status between regions: A case study of the Taihu River Basin, China. Ecol. Indic. 2016, 60, 1008–1016. [Google Scholar] [CrossRef]
- Wei, H.; Liu, H.; Xu, Z.; Ren, J.; Lu, N.; Fan, W.; Dong, X. Linking ecosystem services supply, social demand and human well-being in a typical mountain–oasis–desert area, Xinjiang, China. Ecosyst. Serv. 2018, 31, 44–57. [Google Scholar] [CrossRef]
- Robinson, B.E.; Zheng, H.; Peng, W.J. Disaggregating liveli-hood dependence on ecosystem services to inform land management. Ecosyst. Serv. 2019, 36, 100902. [Google Scholar] [CrossRef]
- Fulford, R.S.; Smith, L.M.; Harwell, M.; Dantin, D.; Russell, M.; Harvey, J. Human well-being differs by community type: Toward reference points in a human well-being indicator useful for decision support. Ecol. Indic. 2015, 56, 194–204. [Google Scholar] [CrossRef]
- Wang, S.Y. Multidimensional turns and research frame reconstruction of well- being geography. Prog. Geogr. 2011, 30, 739–745. [Google Scholar]
- Carpenter, S.R.; Mooney, H.A.; Agard, J.; Capistrano, D.; DeFries, R.S.; Díaz, S.; Whyte, A. Science for managing ecosystem services: Beyond the Millennium Ecosystem Assessment. Proc. Natl. Acad. Sci. USA 2009, 106, 1305–1312. [Google Scholar] [CrossRef] [PubMed] [Green Version]
- Qiu, J.J.; Liu, Y.H.; Yuan, L.; Chen, C.J.; Huang, Q.Y. Research progress and prospect of the interrelationship between ecosystem services and human well-being in the context of coupled human and natural system. Prog. Geogr. 2021, 40, 1060–1072. [Google Scholar] [CrossRef]
- Li, Y.; Li, S.C.; Gao, Y.; Wang, Y. Ecosystem services and hierarchic human well-being: Concepts and service classification framework. Acta Geogr. Sin. 2013, 68, 1038–1047. [Google Scholar]
- Bao, Y.B.; Li, T.; Liu, H.; Ma, T.; Wang, H.X.; Liu, K.; Liu, X.H. Spatial and temporal changes of water conservation of Loess Plateau in northern Shaanxi province by InVEST model. Geogr. Res. 2016, 35, 664–676. [Google Scholar]
- Pan, X.; Wu, N.; Xu, Z. Coordination Difference Between Ecosystem Service and Multidimensional Poverty Under Precise Poverty Alleviation Standpoints: A Case Study of Gansu Qinba Mountain Poverty-stricken Core Areas. J. Ecol. Rural. Environ. 2020, 36, 879–889. [Google Scholar]
- Chen, S.; Liu, K.; Li, T.; Yuan, J. Evaluation of Ecological Service Function of Soil Conservation in Shangluo City Based on InVEST Model. Bull. Soil Sci. Soc. China 2016, 53, 800–807. [Google Scholar]
- Li, M.; Shang, G.Z.; Deng, L. Spatial distribution of carbon storages in the terrestrial ecosystems and its influencing factors on the loess plateau. Acta Ecol. Since 2021, 41, 6786–6799. [Google Scholar]
- Huang, G.L.; Jiang, Y.Q.; Liu, Z.F.; Nie, M.; Liu, Y.; Li, J.W.; Wu, J. Advances in human well-being research: A sustainability science perspective. Acta Ecol. Since 2016, 36, 7519–7527. [Google Scholar]
- Xu, Z.; Wei, H.; Fan, W.; Wang, X.; Zhang, P.; Ren, J.; Kong, W. Relationships between ecosystem services and human well-being changes based on carbon flow—A case study of the Manas River Basin, Xinjiang, China. Ecosyst. Serv. 2019, 37, 100934. [Google Scholar] [CrossRef]
- Wei, H.L.; Wang, G.Y. Life satisfaction degrees of rural households in desertification-land control areas and the influential factors—Based on data collected from 12 counties of Gansu Province. J. Arid. Land Resour. Environ. 2017, 31, 1–8. [Google Scholar]
- Cheng, L. A preliminary study on sustainable development ability of Jinhu County Agricultural ecological Demonstration Area in Jiangsu Province. Chin. Rural. Econ. 2004, 6, 54–60. [Google Scholar]
- Ni, M.X.; An, Z.R.; Xia, J.X. Melting of mountain glacier and its risk to future water resources in Southern Xinjiang, China. Mt. Res. 2022, 40, 329–342. [Google Scholar]
- Guan, S.Q.; Dong, R.T.; Tang, Z. Study on the Herders’ Overgrazing Behavior-Based on the Perspective of Sustainable Livelihoods. Chin. J. Grassl. 2021, 43, 86–94. [Google Scholar]
- Han, H.; Guo, L.; Zhang, J.; Zhang, K.; Cui, N. Spatiotemporal analysis of the coordination of economic development, resource utilization, and environmental quality in the Beijing-Tianjin-Hebei urban agglomeration. Ecol. Indic. 2021, 127, 107724. [Google Scholar] [CrossRef]
- Li, W.; Wang, Y.; Xie, S.; Cheng, X. Coupling coordination analysis and spatiotemporal heterogeneity between urbanization and ecosystem health in Chongqing municipality, China. Sci. Total Environ. 2021, 791, 148311. [Google Scholar] [CrossRef]
- Wang, X.; Yang, C.; Liu, T.; Chen, G.; Yue, H. Assessment spatio-temporal coupling coordination relationship between mountain rural ecosystem health and urbanization in Chongqing municipality, China. Environ. Sci. Pollut. Res. 2022, 29, 48388–48410. [Google Scholar] [CrossRef]
- Wu, J.; Li, K.; Zhao, Y. The use of land natural capital in the Guanzhong region based on a revised three-dimensional ecological footprint model. Prog. Geogr. 2020, 39, 1345–1355. [Google Scholar] [CrossRef]
- Bai, Y.; Hong, Z.; Xue, X.; Shi, W. Coupling study of land intensive use and ecological civilization construction in Guanzhong Plain urban agglomeration. Res. Soil Water Conserv. 2021, 28, 272–280. [Google Scholar]
- Yang, K.; Zhou, Z. Effect of landscape pattern index on PM2.5 simulation in Guanzhong Plain Urban Agglomeration. J. Shanxi Norm. Univ. Nat. Sci. Ed. 2022, 50, 115–124. [Google Scholar]


| The Target Layer | Level Indicators | The Secondary Indicators | Weight |
|---|---|---|---|
| Human well-being | Income | Disposable income of urban humans | 19.00% |
| Per capita net income of farmers | 17.00% | ||
| Material needs and health | Per capita food consumption | 13.00% | |
| Per capita meat consumption | 7.00% | ||
| Per capita vegetable consumption | 9.00% | ||
| Living environment | Air quality index | 15.00% | |
| Green rate of built-up area | 1.00% | ||
| Safety | Per capita cultivated land area | 5.00% | |
| Per capita grain production | 3.00% | ||
| Per capita water resources | 11.00% |
| Coupling Coordination Degree | Coupling Coordination Type | Characteristics |
|---|---|---|
| D ∈ (0, 0.2] | Serious imbalance | Ecosystem services and human well-being are mutually restricted. Excessive and disorderly development of urban agglomeration has seriously squeezed ecological space. This is contrary to human well-being. |
| D ∈ (0.2, 0.4] | Moderate imbalance | There are certain constraints on ecosystem services and human well-being. The ecological problems arising from the construction of urban agglomeration have become prominent, with a negative impact on human well-being. |
| D ∈ (0.4, 0.6] | Basic coordination | The relationship between ecosystem services and human well-being is basically harmonious. The construction of urban agglomeration can maintain healthy development. |
| D ∈ (0.6, 0.8] | Moderate coordination | Ecosystem services and human well-being can promote each other at a high level, and the construction of urban agglomerations can healthy develop. |
| D ∈ (0.8, 1.0] | High coordination | Ecosystem services and human well-being mutually promote each other at a high level, and urban agglomeration construction is developing in an orderly manner. |
Publisher’s Note: MDPI stays neutral with regard to jurisdictional claims in published maps and institutional affiliations. |
© 2022 by the authors. Licensee MDPI, Basel, Switzerland. This article is an open access article distributed under the terms and conditions of the Creative Commons Attribution (CC BY) license (https://creativecommons.org/licenses/by/4.0/).
Share and Cite
Yang, J.; Ma, X.; Zhao, X.; Li, W. Spatiotemporal of the Coupling Relationship between Ecosystem Services and Human Well-Being in Guanzhong Plain Urban Agglomeration. Int. J. Environ. Res. Public Health 2022, 19, 12535. https://doi.org/10.3390/ijerph191912535
Yang J, Ma X, Zhao X, Li W. Spatiotemporal of the Coupling Relationship between Ecosystem Services and Human Well-Being in Guanzhong Plain Urban Agglomeration. International Journal of Environmental Research and Public Health. 2022; 19(19):12535. https://doi.org/10.3390/ijerph191912535
Chicago/Turabian StyleYang, Jianxiu, Xing Ma, Xueyan Zhao, and Wenqing Li. 2022. "Spatiotemporal of the Coupling Relationship between Ecosystem Services and Human Well-Being in Guanzhong Plain Urban Agglomeration" International Journal of Environmental Research and Public Health 19, no. 19: 12535. https://doi.org/10.3390/ijerph191912535
APA StyleYang, J., Ma, X., Zhao, X., & Li, W. (2022). Spatiotemporal of the Coupling Relationship between Ecosystem Services and Human Well-Being in Guanzhong Plain Urban Agglomeration. International Journal of Environmental Research and Public Health, 19(19), 12535. https://doi.org/10.3390/ijerph191912535