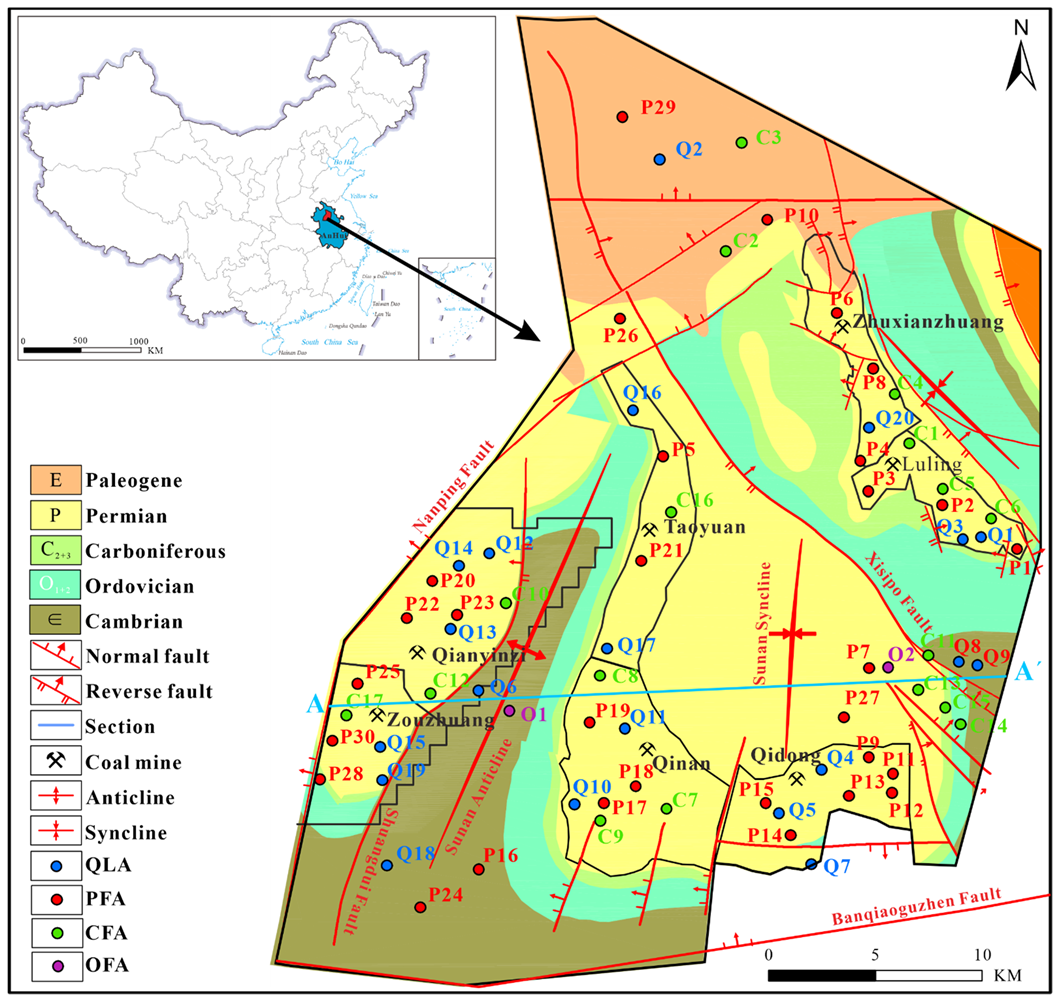
Figure 1.
General geological map of the study area and sampling sites (QLA, PFA, CFA, and OFA represent the Quaternary loose aquifer, Permian fracture sandstone aquifer, Carboniferous fracture limestone aquifer, and fracture limestone aquifer, respectively).
Figure 1.
General geological map of the study area and sampling sites (QLA, PFA, CFA, and OFA represent the Quaternary loose aquifer, Permian fracture sandstone aquifer, Carboniferous fracture limestone aquifer, and fracture limestone aquifer, respectively).
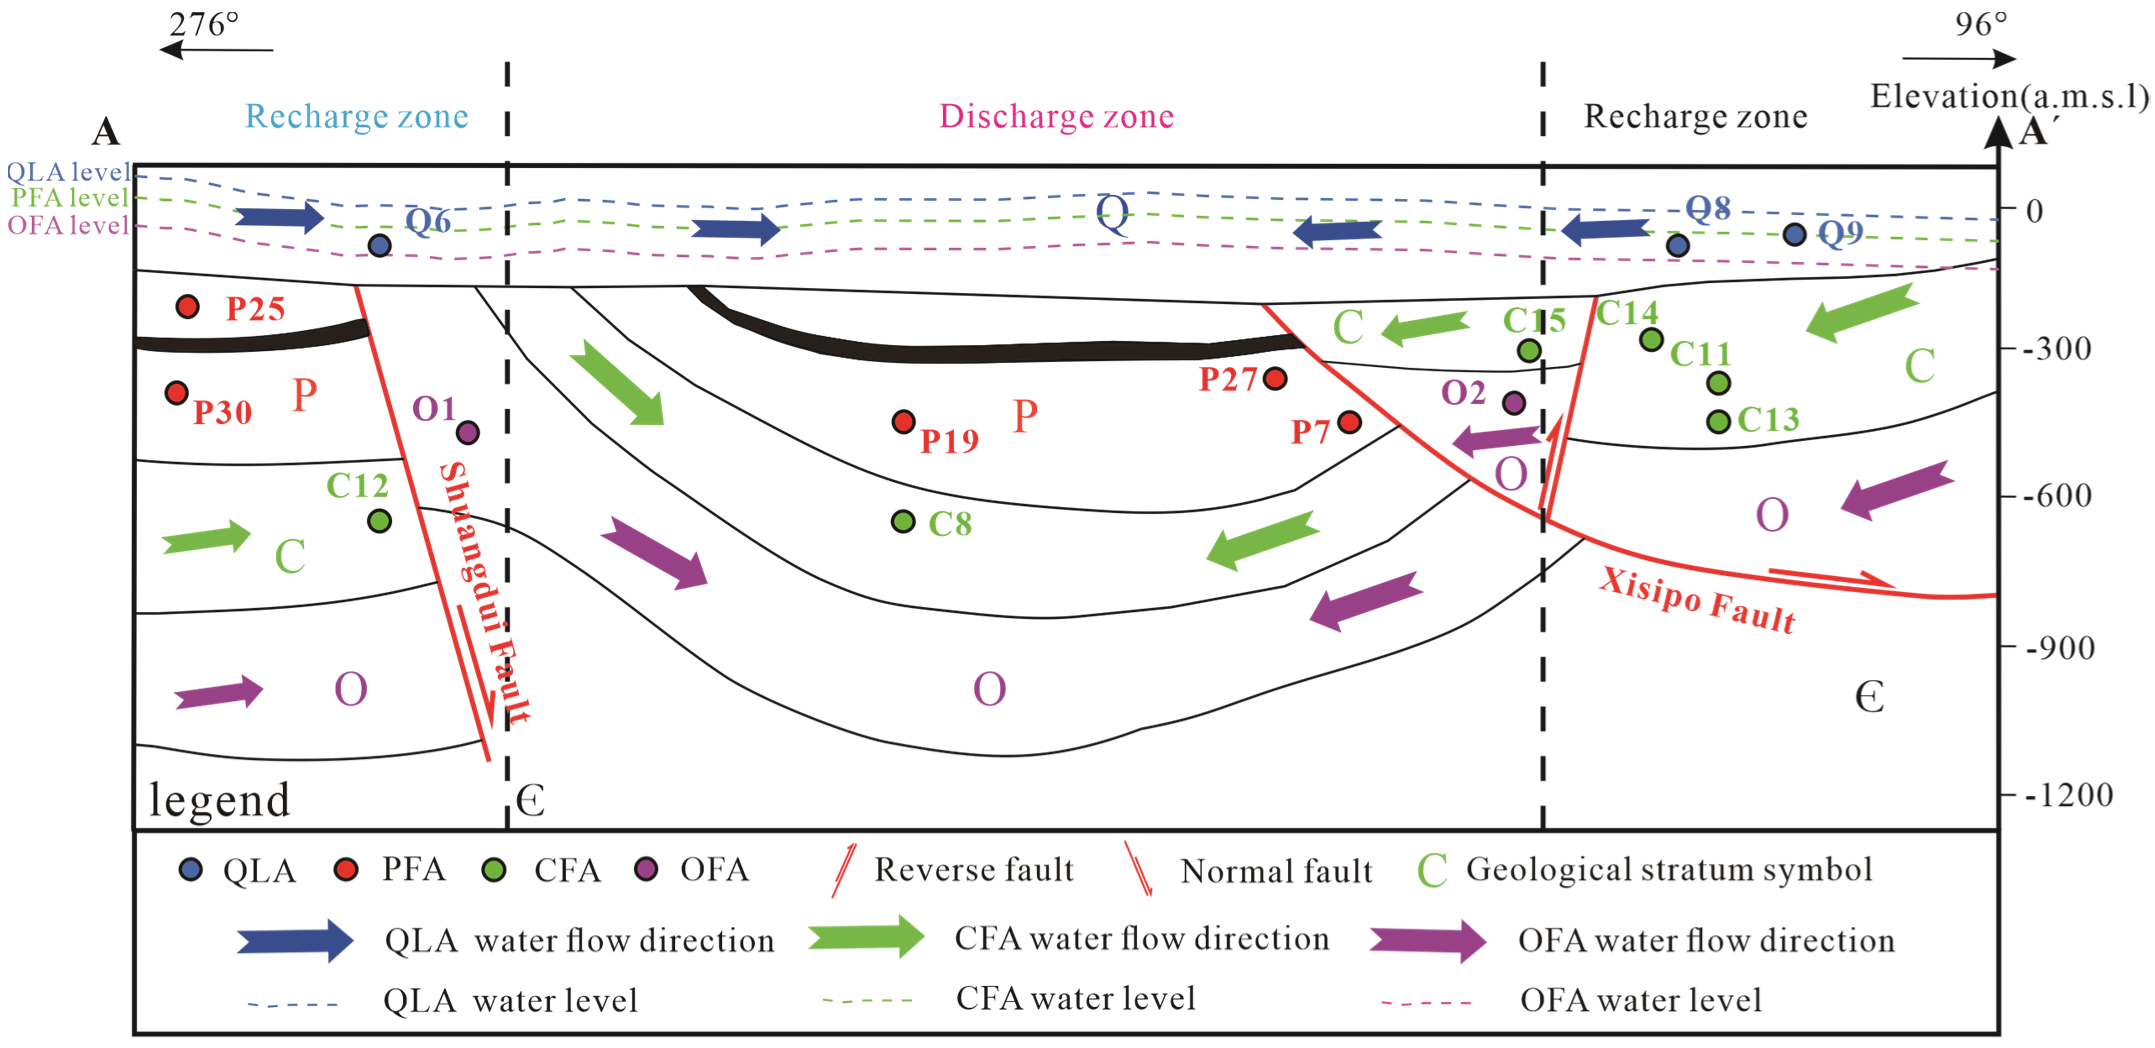
Figure 2.
Cross section A–A’ and hydrogeological map of the mining area (Note: Some sampling points are projected positions, see
Figure 1).
Figure 2.
Cross section A–A’ and hydrogeological map of the mining area (Note: Some sampling points are projected positions, see
Figure 1).
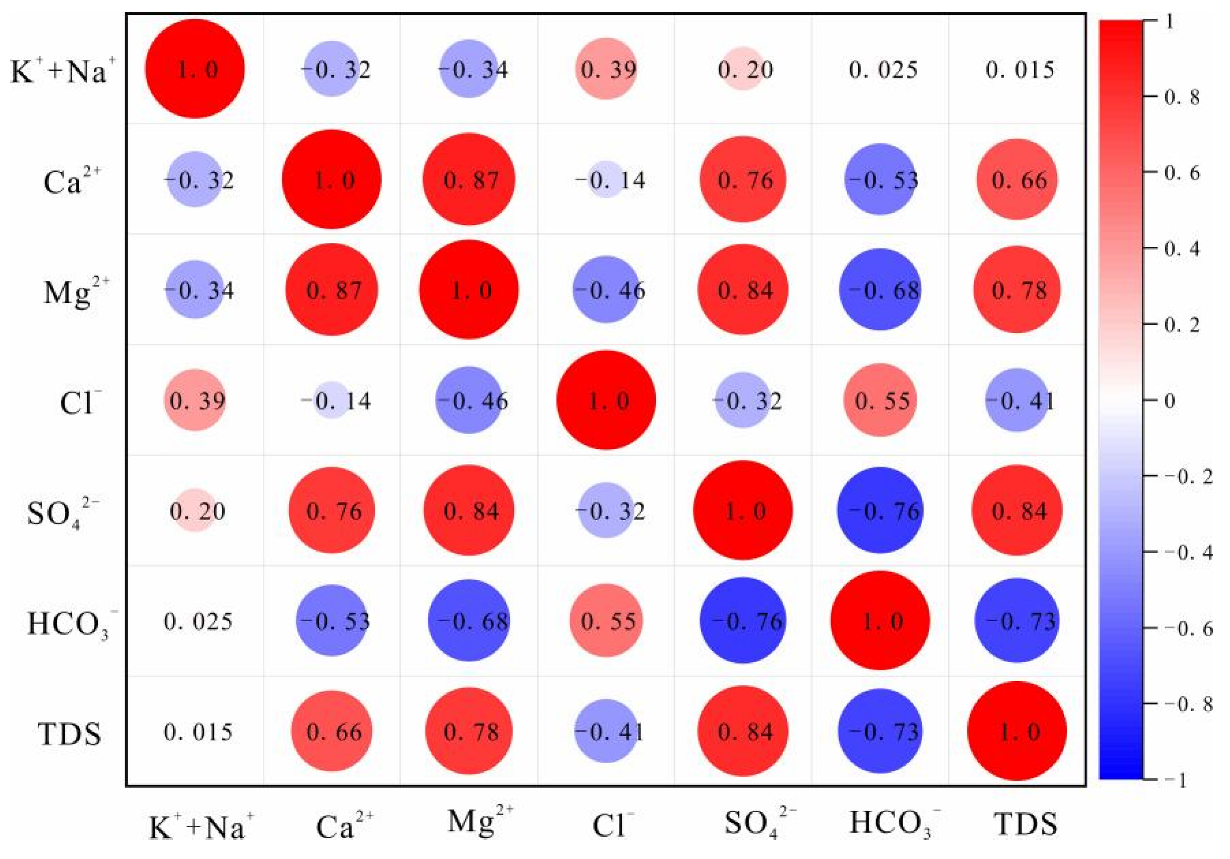
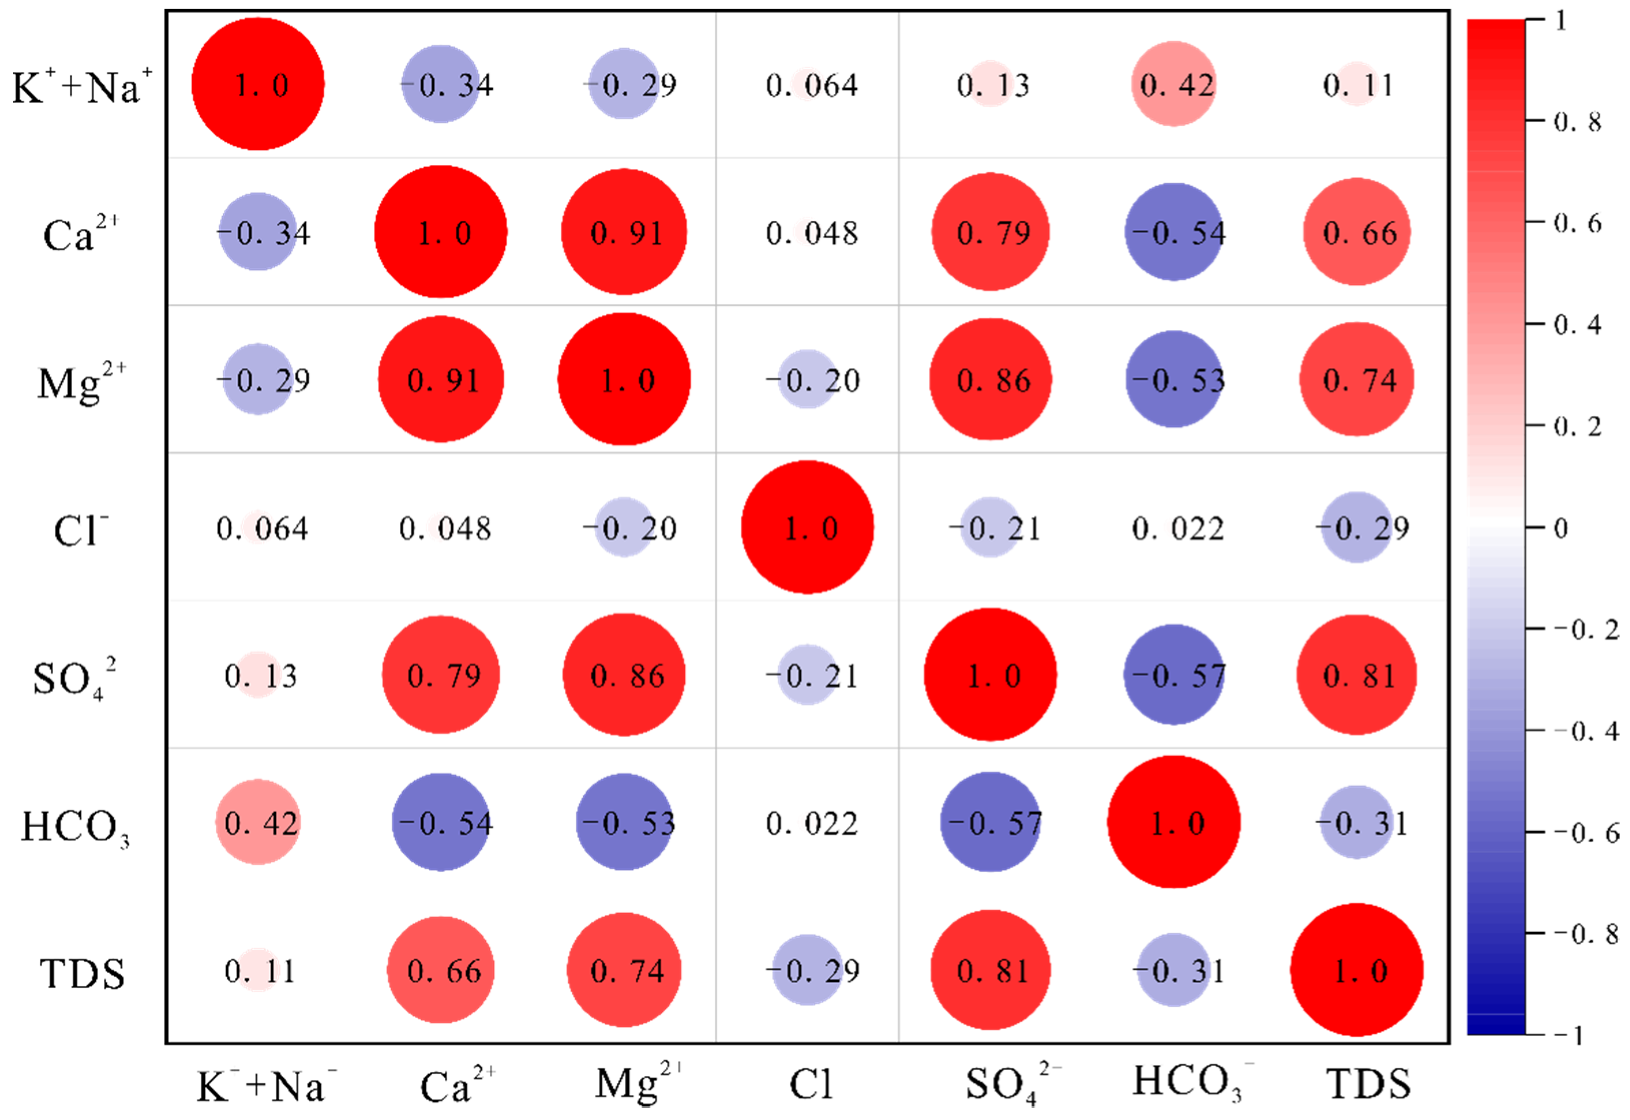
Figure 3.
Correlation heat plot for the Quaternary aquifer.
Figure 3.
Correlation heat plot for the Quaternary aquifer.
Figure 4.
Correlation heat plot for the Permian aquifer.
Figure 4.
Correlation heat plot for the Permian aquifer.
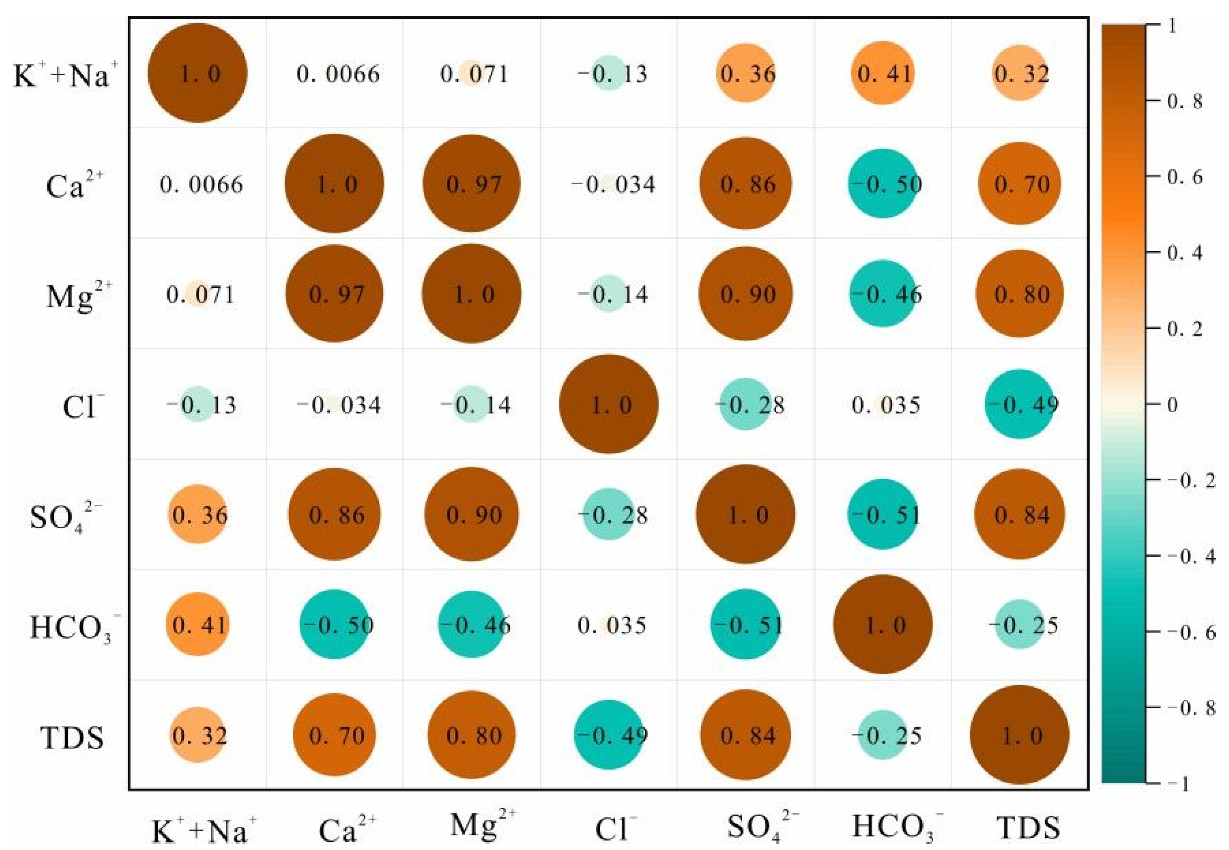
Figure 5.
Correlation heat plot for Carboniferous aquifer.
Figure 5.
Correlation heat plot for Carboniferous aquifer.
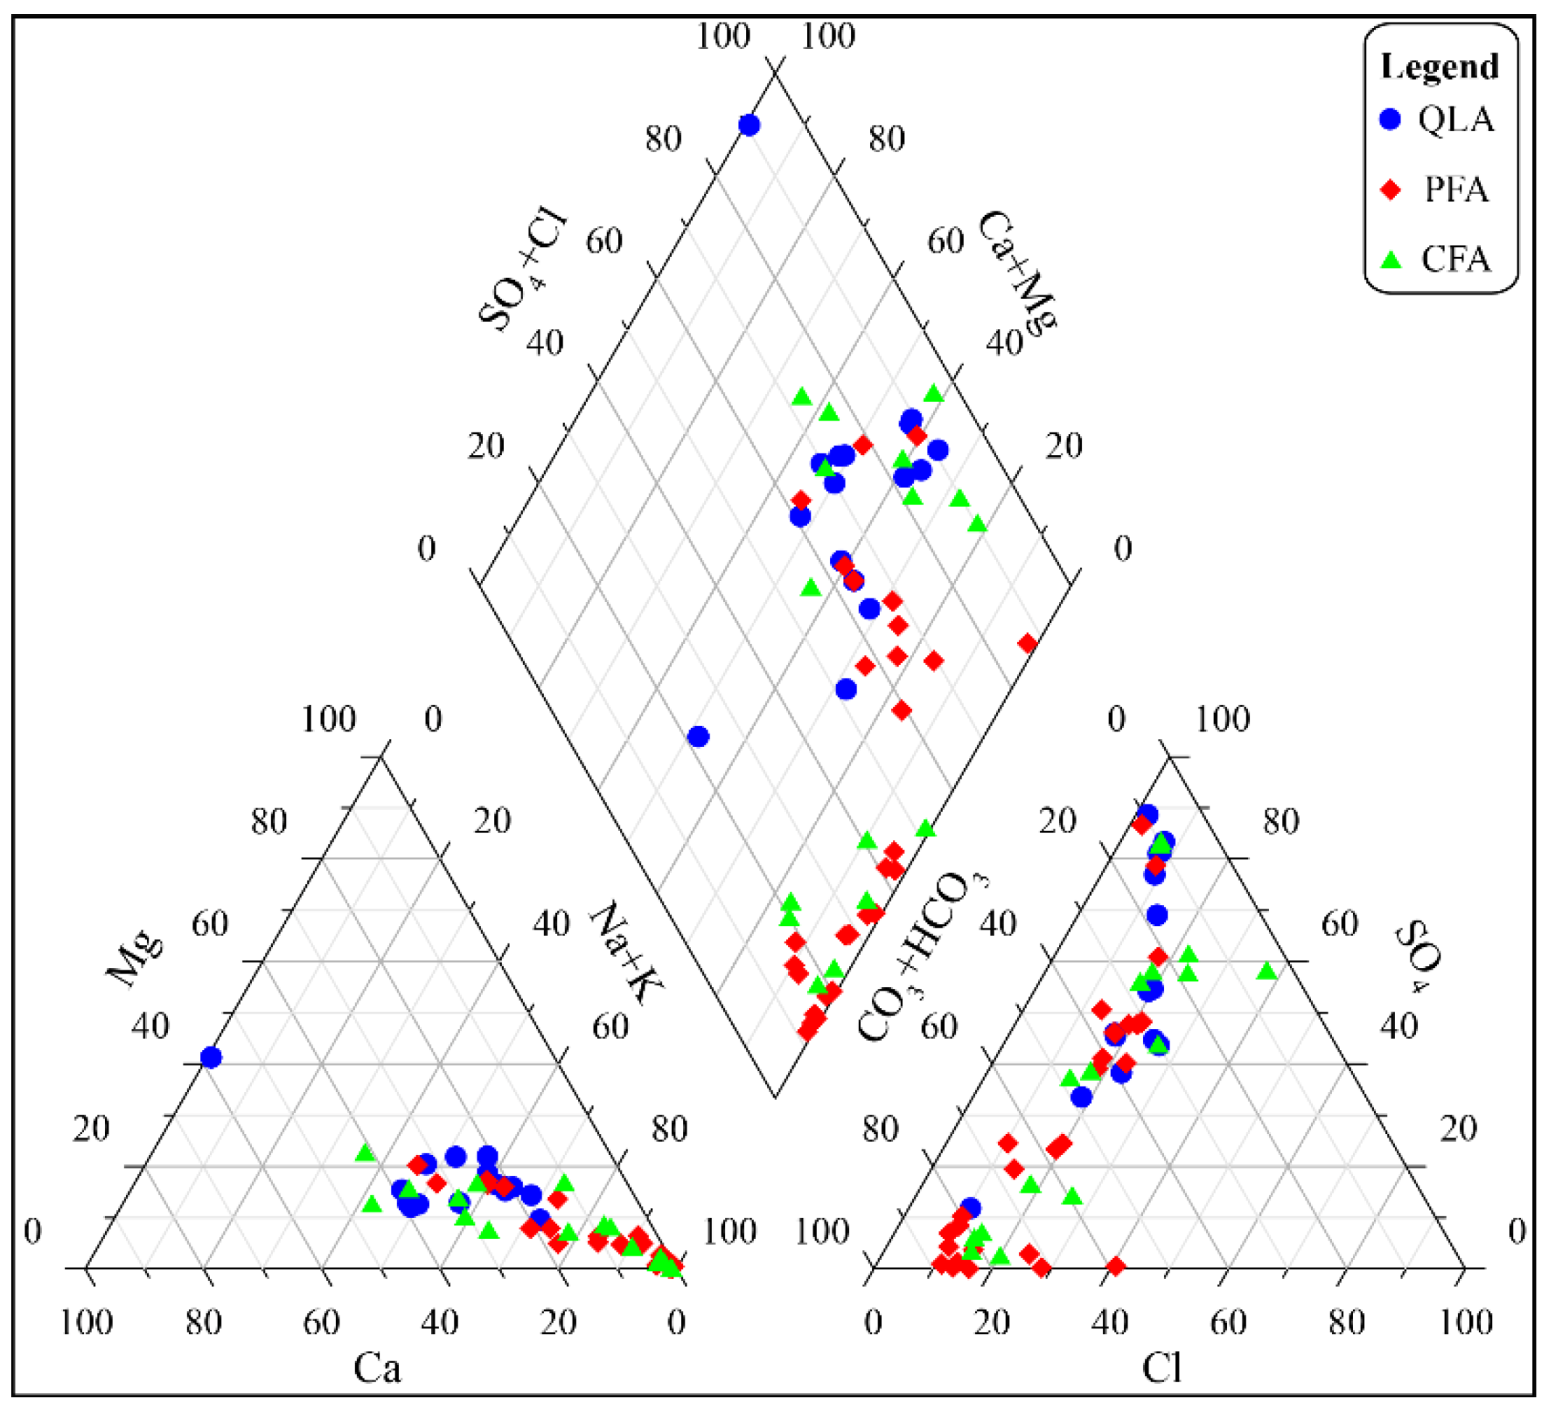
Figure 6.
Piper diagram of all water samples.
Figure 6.
Piper diagram of all water samples.
Figure 7.
Scatter plots of major ions: (a) (Ca2++Mg2+) versus (SO42−+0.5HCO3−), (b) (SO42− + Cl−) versus HCO3−, (c) (K++Na+) versus Cl−, (d) (Ca2++Mg2+−SO42−−HCO3−) versus (K++Na+ − Cl−), (e) (Ca2++Mg2+) versus SO42−, (f) HCO3− versus Ca2+.
Figure 7.
Scatter plots of major ions: (a) (Ca2++Mg2+) versus (SO42−+0.5HCO3−), (b) (SO42− + Cl−) versus HCO3−, (c) (K++Na+) versus Cl−, (d) (Ca2++Mg2+−SO42−−HCO3−) versus (K++Na+ − Cl−), (e) (Ca2++Mg2+) versus SO42−, (f) HCO3− versus Ca2+.
Figure 8.
Scatter plots of major ions with respected carbonates minerals SI values: (a) Correlations of Ca2+ with respected calcite SI values, (b) Correlations of HCO3− with respected calcite SI values, (c) Correlations of Ca2+ and Mg2+ with respected dolomite SI values, (d) Correlations of HCO3− with respected dolomite SI values, (e) Correlations of Ca2+ and SO42− with respected gypsum SI values, (f) Correlations of K++Na+ and Cl− with respected halite SI values.
Figure 9.
Comprehensive correlation heat plot.
Figure 9.
Comprehensive correlation heat plot.
Figure 10.
Scatter plots of principal factor scores: (a) F1 versus F2, (b) F1 versus F3, (c) F2 versus F3.
Figure 10.
Scatter plots of principal factor scores: (a) F1 versus F2, (b) F1 versus F3, (c) F2 versus F3.
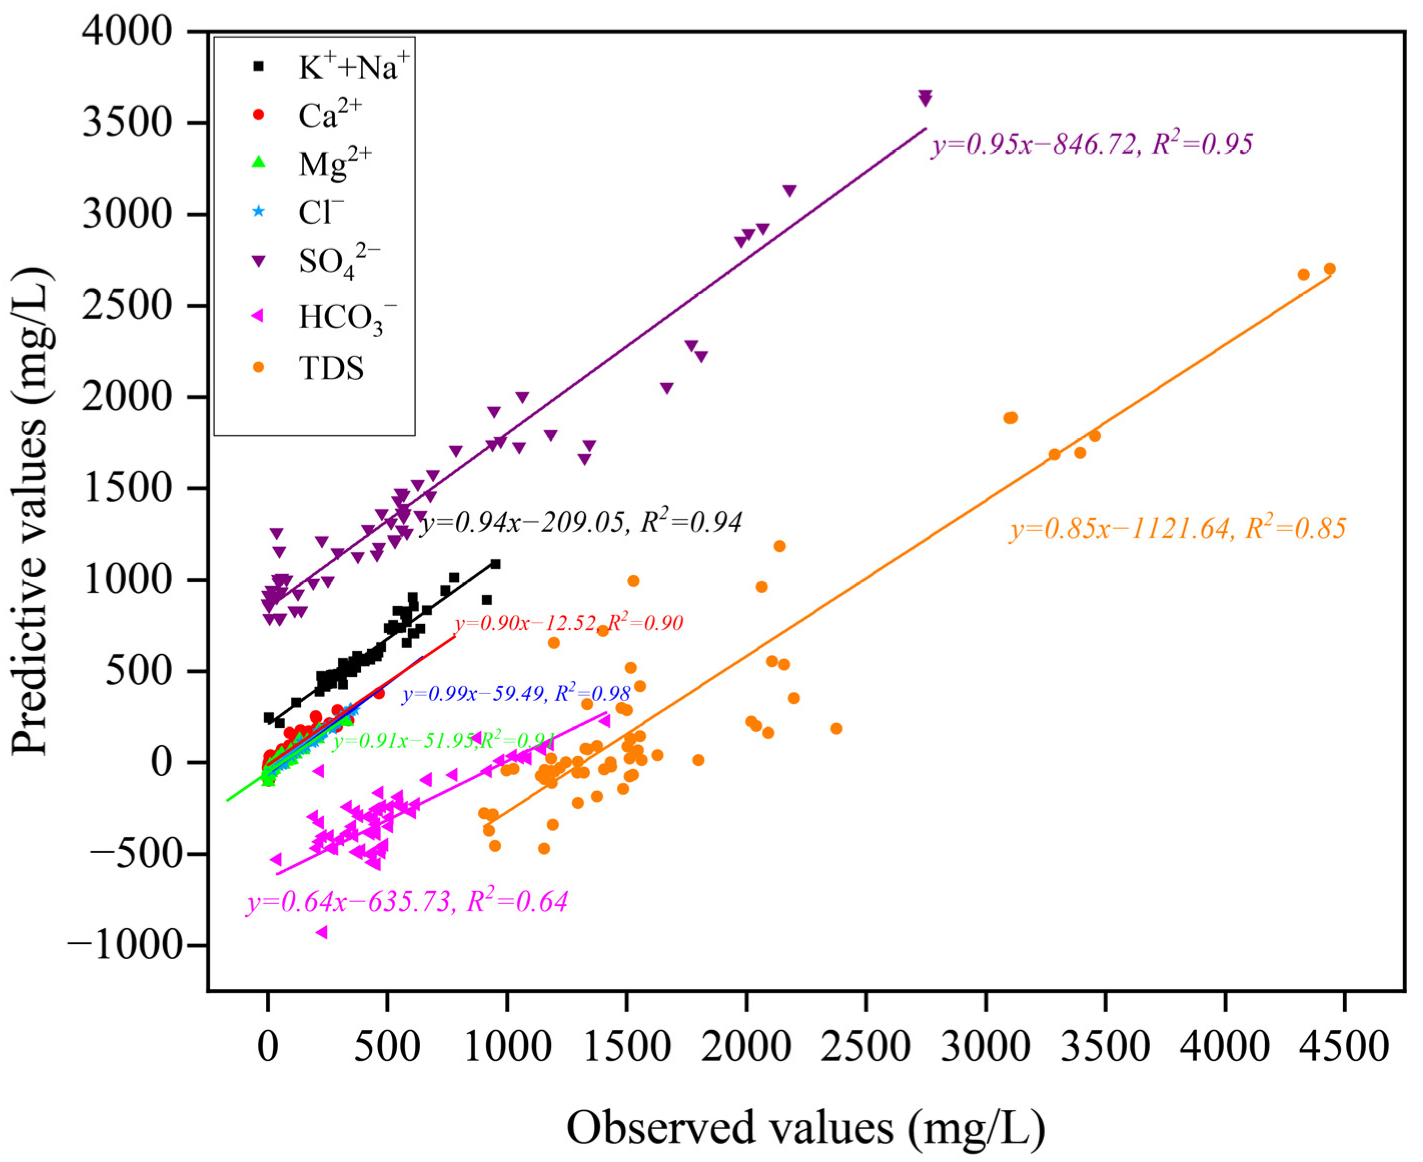
Figure 11.
Scatter plots of predicted and observed concentration.
Figure 11.
Scatter plots of predicted and observed concentration.
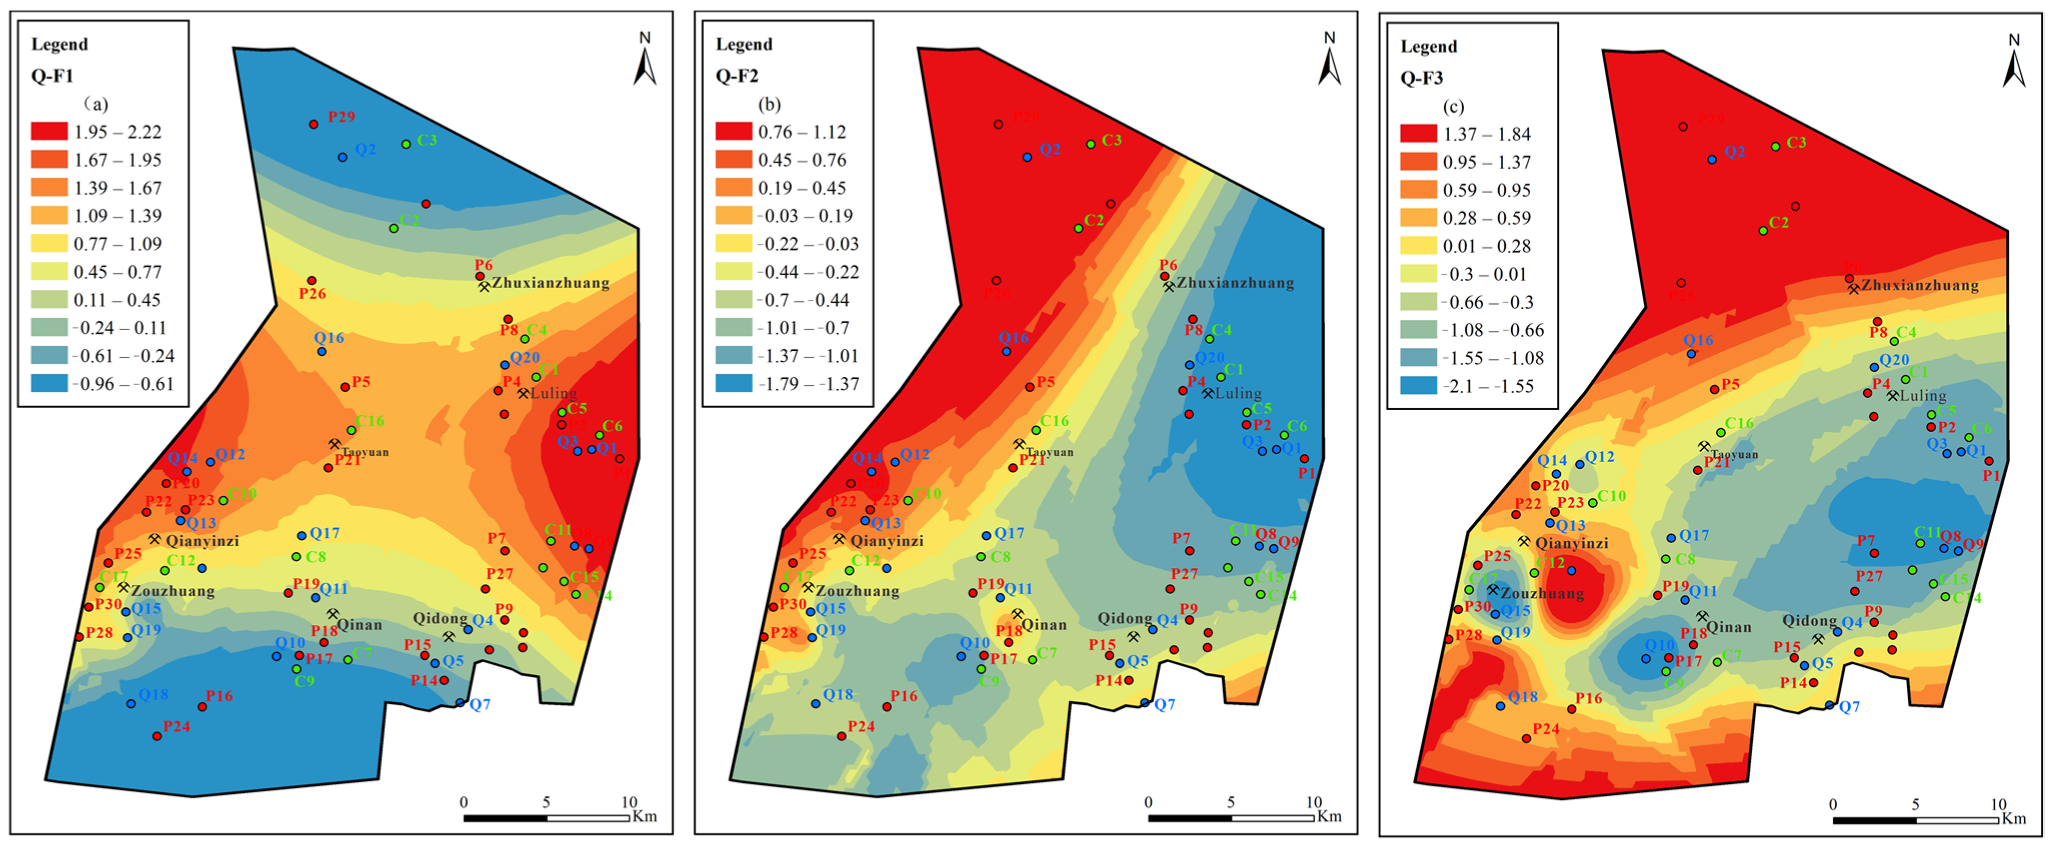
Figure 12.
Contours of principal factors loading scores for Quaternary aquifer: (a) sulfate dissolution and cation exchange, (b) carbonate dissolution and sulfate reduction, (c) external input factor.
Figure 12.
Contours of principal factors loading scores for Quaternary aquifer: (a) sulfate dissolution and cation exchange, (b) carbonate dissolution and sulfate reduction, (c) external input factor.
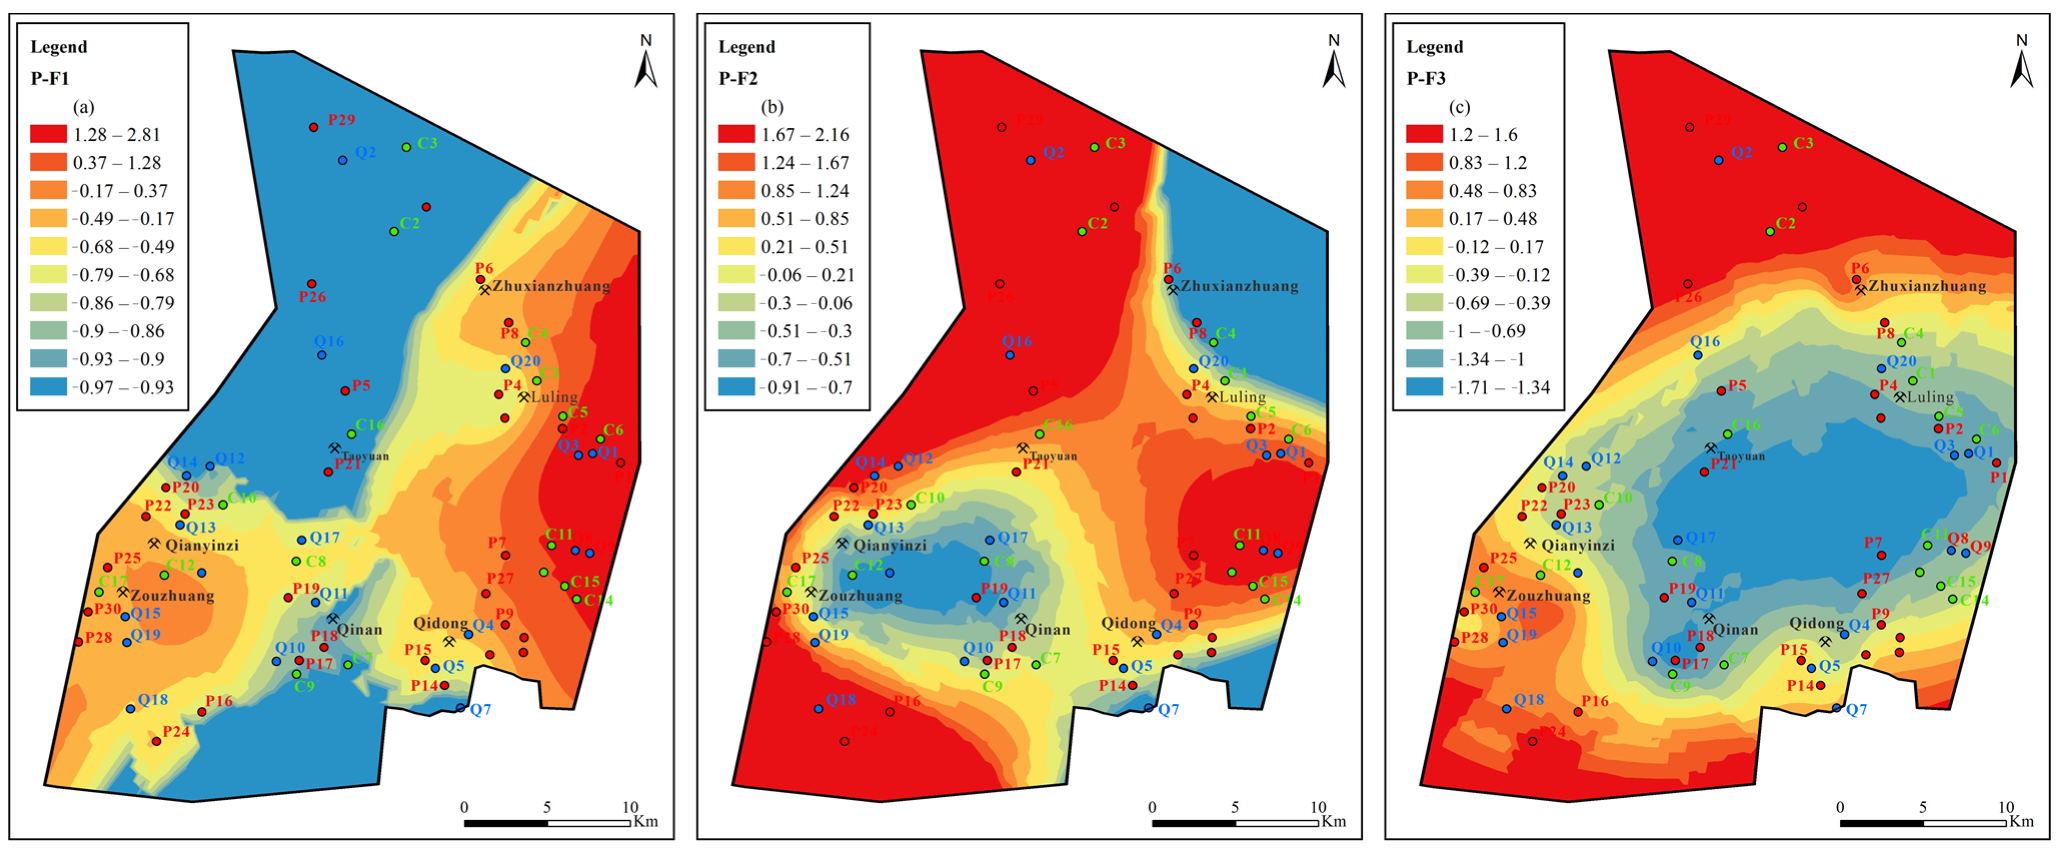
Figure 13.
Contours of principal factors loading scores for Permian aquifer: (a) sulfate dissolution and cation exchange, (b) carbonate dissolution and sulfate reduction, (c) external input factor.
Figure 13.
Contours of principal factors loading scores for Permian aquifer: (a) sulfate dissolution and cation exchange, (b) carbonate dissolution and sulfate reduction, (c) external input factor.
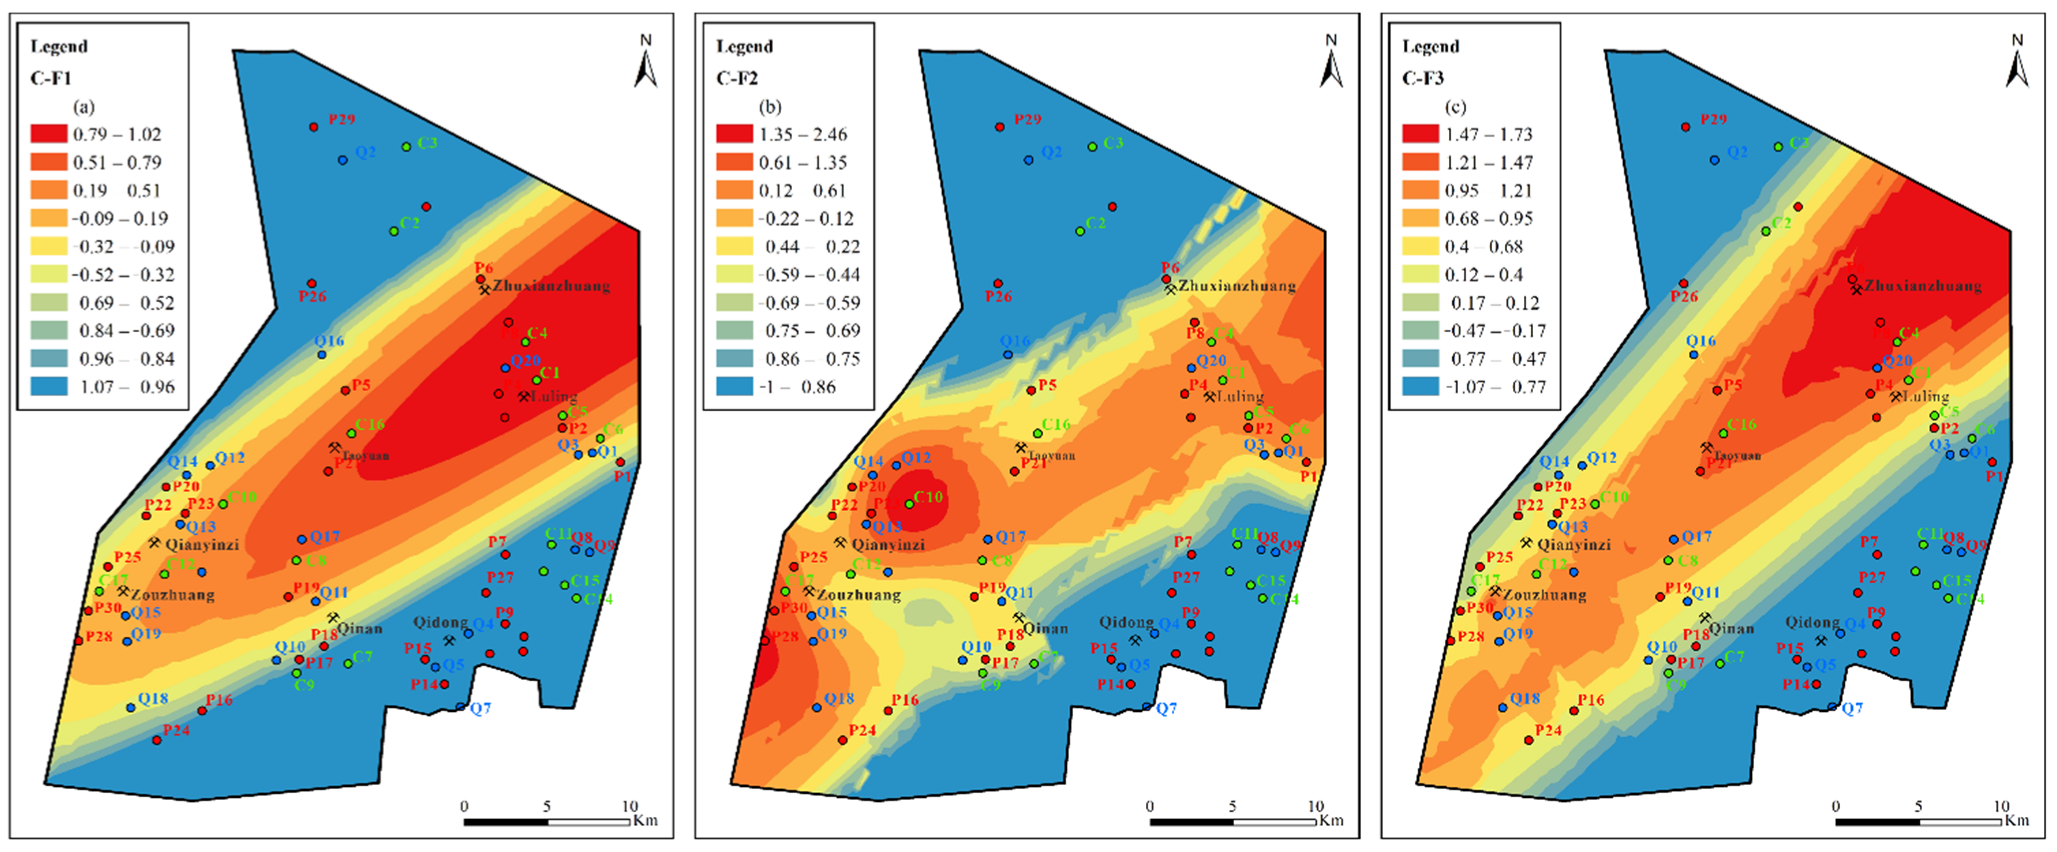
Figure 14.
Contours of principal factors loading scores for Carboniferous aquifer: (a) sulfate dissolution and cation exchange, (b) carbonate dissolution and sulfate reduction, (c) external input factor.
Figure 14.
Contours of principal factors loading scores for Carboniferous aquifer: (a) sulfate dissolution and cation exchange, (b) carbonate dissolution and sulfate reduction, (c) external input factor.
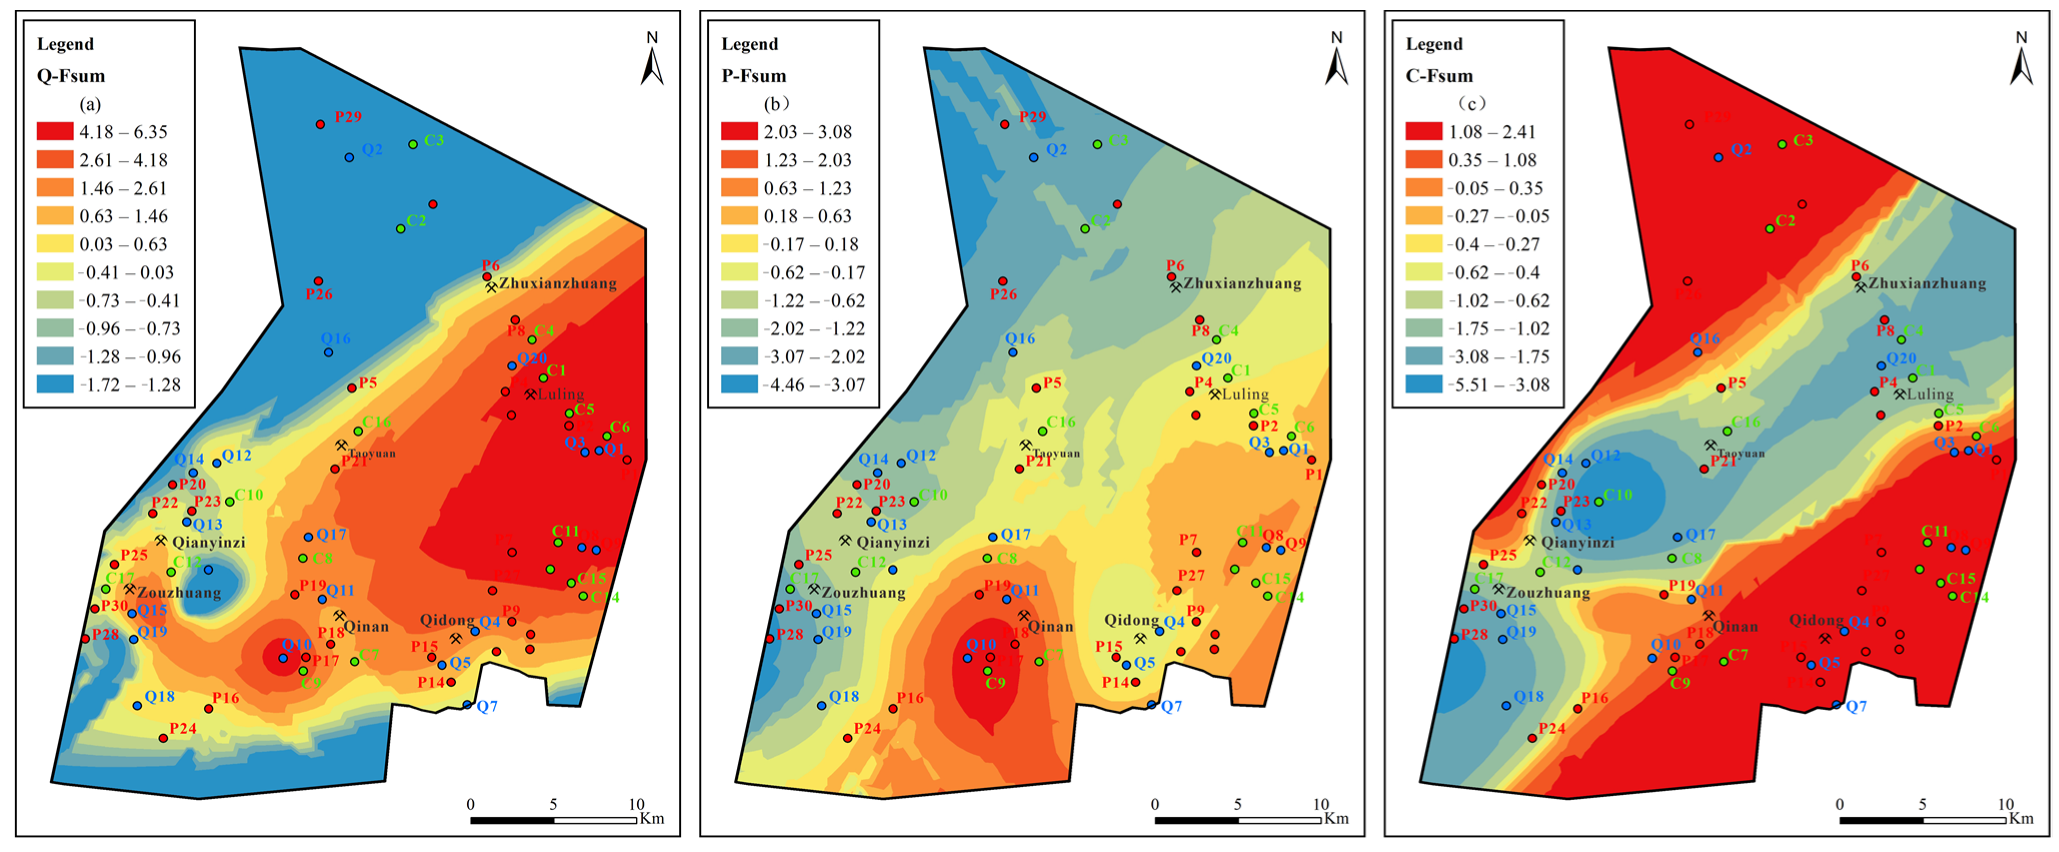
Figure 15.
Contours of comprehensive principal factors loading scores for Quaternary, Permian, and Carboniferous aquifers: (a) sulfate dissolution and cation exchange, (b) carbonate dissolution and sulfate reduction, (c) external input factor.
Figure 15.
Contours of comprehensive principal factors loading scores for Quaternary, Permian, and Carboniferous aquifers: (a) sulfate dissolution and cation exchange, (b) carbonate dissolution and sulfate reduction, (c) external input factor.
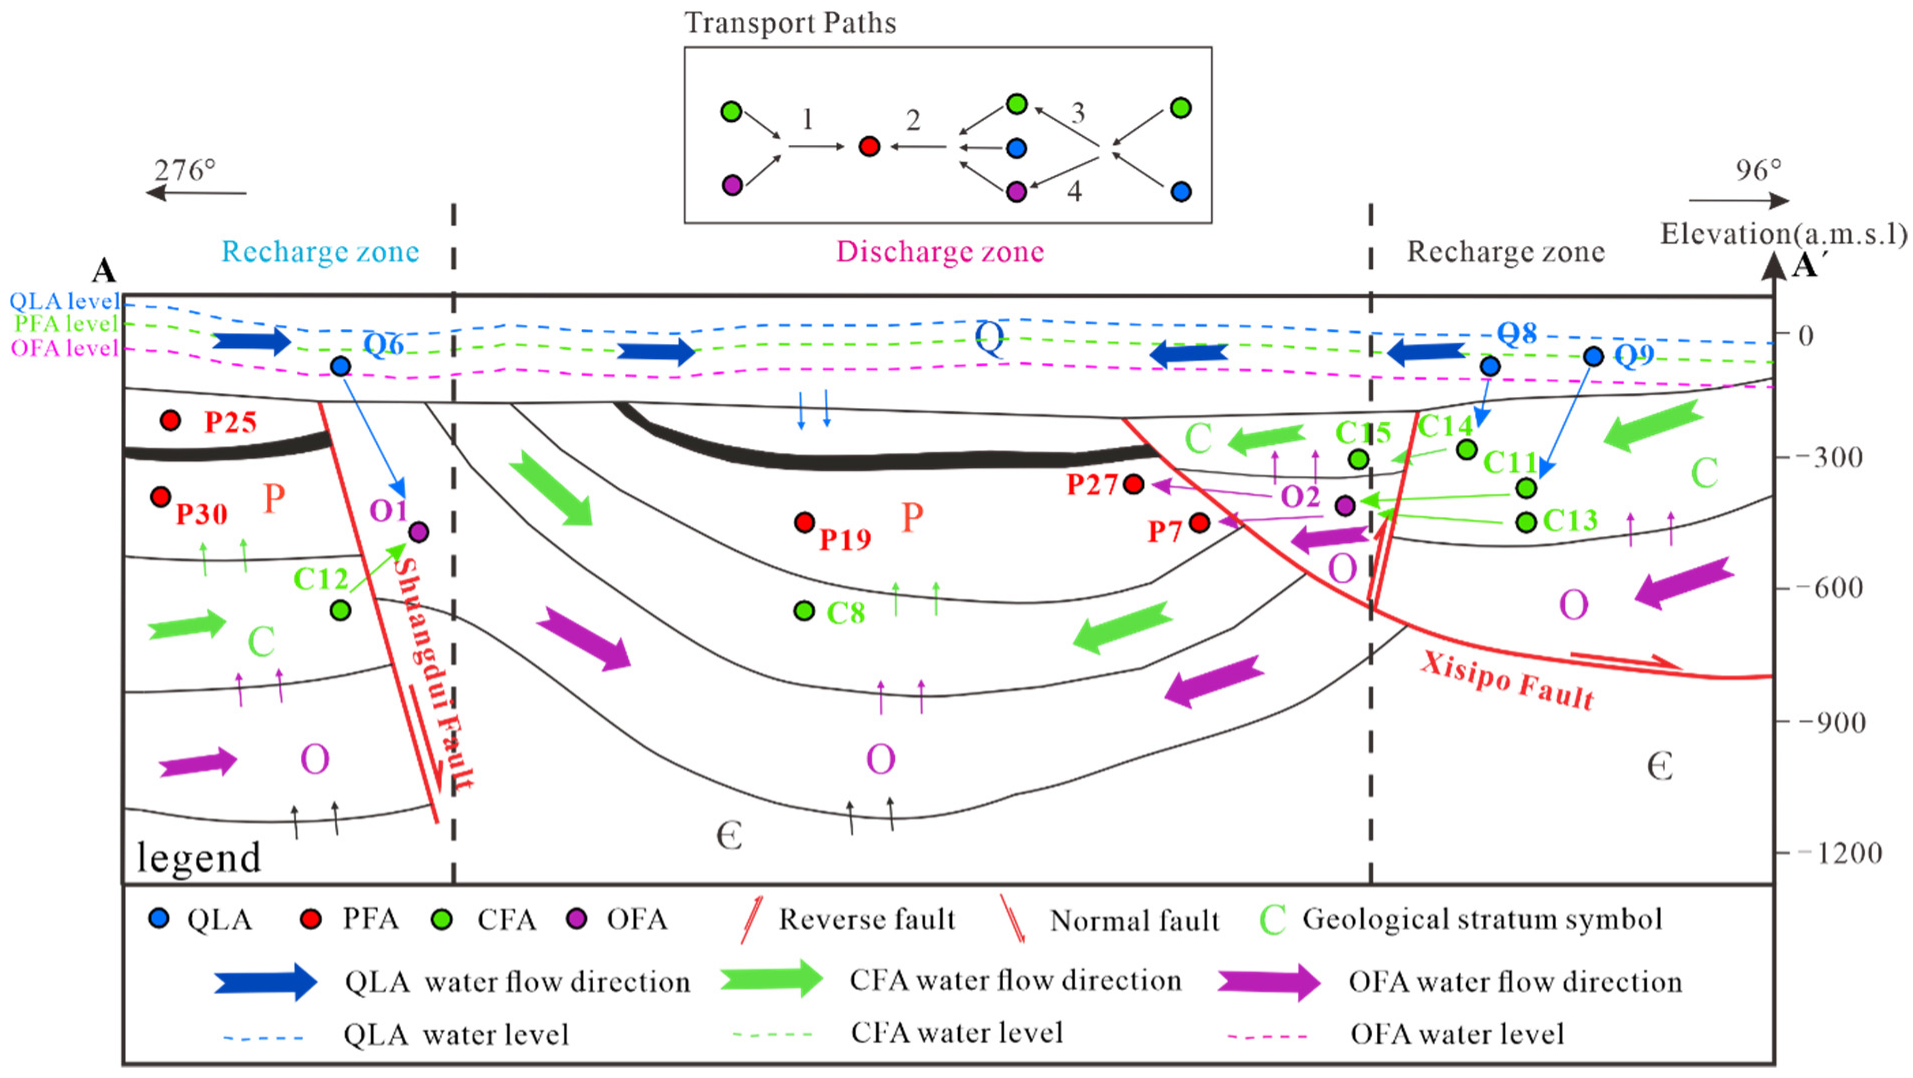
Figure 16.
Hydrogeochemical path of multi-layer groundwater system.
Figure 16.
Hydrogeochemical path of multi-layer groundwater system.
Table 1.
Measured values of major ions of the water samples in the study area.
Table 1.
Measured values of major ions of the water samples in the study area.
| Sample ID | K+ + Na+ | Ca2+ | Mg2+ | Cl− | SO42− | HCO3− | PH | TDS | Percent Error (%) | Sample ID | K+ + Na+ | Ca2+ | Mg2+ | Cl− | SO42− | HCO3− | PH | TDS | Percent Error (%) |
|---|
| Q1 | 5.5 | 464.92 | 330.62 | 49.08 | 2179.6 | 230.56 | 7.58 | 3098 | −1.11 | P16 | 456.21 | 5.54 | 3.84 | 155.22 | 189.34 | 466.23 | 9.44 | 1188 | 4.61 |
| Q2 | 5.3 | 464.62 | 330.69 | 49.27 | 2180.4 | 230.63 | 7.59 | 3106 | −1.18 | P17 | 241.80 | 8.73 | 17.32 | 59.94 | 44.86 | 541.86 | 8.78 | 1799.00 | −4.31 |
| Q3 | 5.26 | 464.58 | 330.67 | 49.27 | 2179.4 | 230.83 | 7.25 | 3109 | −1.16 | P18 | 248.93 | 19.79 | 13.44 | 68.79 | 57.21 | 549.32 | 7.96 | 1513.00 | −4.49 |
| Q4 | 347.58 | 88.58 | 73.31 | 221.47 | 572.12 | 451.35 | 7.55 | 1515 | −3.39 | P19 | 248.31 | 8.73 | 13.47 | 97.01 | 0.41 | 507.78 | 8.49 | 1377.00 | −2.21 |
| Q5 | 307.35 | 103.54 | 78.43 | 216.24 | 560.19 | 440.48 | 7.71 | 1518 | −3.44 | P20 | 353.37 | 79.99 | 22.57 | 138.66 | 531.38 | 380.36 | 7.97 | 1329 | −3.35 |
| Q6 | 288.93 | 111.41 | 91.74 | 226.57 | 567.6 | 454.93 | 8.02 | 1337 | −3.49 | P21 | 584.73 | 6.34 | 0.96 | 188.18 | 46.92 | 1022.75 | 9.13 | 1436 | −1.75 |
| Q7 | 374.53 | 95.04 | 49.95 | 230.44 | 420.24 | 602.9 | 7.76 | 1547 | −4.44 | P22 | 579.03 | 1.58 | 2.88 | 181.58 | 16.88 | 1145.31 | 8.92 | 1406 | −5.43 |
| Q8 | 274.99 | 205.47 | 69.41 | 344 | 567.53 | 389.48 | 7.92 | 1563 | −2.74 | P23 | 610.26 | 4.76 | 4.81 | 145.26 | 60.09 | 1179.12 | 9.38 | 1504 | −3.23 |
| Q9 | 264.18 | 223.18 | 88.82 | 350.88 | 628.03 | 425.42 | 7.41 | 1535 | −2.88 | P24 | 229.03 | 167.53 | 100.68 | 289.46 | 514.5 | 477.42 | 8.31 | 1142.00 | −3.82 |
| Q10 | 49.82 | 21.57 | 35.75 | 17.88 | 36.22 | 258.72 | 8.3 | 1486 | −2.04 | P25 | 434.56 | 101.34 | 46.02 | 257.36 | 637.57 | 441.62 | 8.46 | 1377.00 | −3.12 |
| Q11 | 581.3 | 94.34 | 67.63 | 74.89 | 1343.46 | 333.16 | 8.6 | 1402 | −1.88 | P26 | 462.32 | 58.73 | 28.68 | 256.09 | 582 | 368.27 | 8.12 | 1297.00 | −2.66 |
| Q12 | 544.09 | 200.38 | 209.88 | 184.36 | 1976.91 | 277.14 | 7.62 | 3287 | −1.2 | P27 | 357.47 | 225.25 | 116.96 | 304.26 | 1049.58 | 369.78 | 8.77 | 1335.00 | −2.34 |
| Q13 | 582.38 | 309.68 | 132.55 | 194.99 | 2010.25 | 262.55 | 7.44 | 3395 | −1.09 | P28 | 779.68 | 4.79 | 3.39 | 215.38 | 6.17 | 1412.39 | 8.73 | 1027 | 0.01 |
| Q14 | 665.09 | 204.33 | 165.2 | 184.36 | 2069.94 | 228.52 | 8.54 | 3457 | −0.17 | P29 | 915.35 | 7.21 | 8.75 | 139.77 | 1324.94 | 217.54 | 8.7 | 1197 | 6.83 |
| Q15 | 119.42 | 60.91 | 50.5 | 68.03 | 76.97 | 505.25 | 8.22 | 1526 | −5.06 | P30 | 779.68 | 4.79 | 3.39 | 215.38 | 6.17 | 1412.39 | 8.44 | 999 | 0.01 |
| Q16 | 357.21 | 289.27 | 94.83 | 347.08 | 973.02 | 474.89 | 7.83 | 1480 | −2.71 | C1 | 252.68 | 20.95 | 24.62 | 107.69 | 47.75 | 617.88 | 7.93 | 942 | −7.8 |
| Q17 | 229.61 | 155.54 | 98.87 | 283.43 | 477.46 | 485.72 | 8.33 | 1433 | −3.79 | C2 | 242.33 | 22.88 | 25.4 | 106.83 | 52.68 | 568.83 | 8.35 | 935 | −6.03 |
| Q18 | 357.74 | 283.82 | 88.23 | 341.22 | 940.09 | 438.28 | 7.55 | 1502 | −1.53 | C3 | 314.75 | 137.55 | 91.64 | 347.47 | 544.89 | 40.39 | 7.65 | 1320.68 | 4.9 |
| Q19 | 429.66 | 156.33 | 115.77 | 229.27 | 1183.76 | 300.73 | 7.71 | 1518.00 | −1.81 | C4 | 244.44 | 194.93 | 82.08 | 330 | 556.35 | 378.81 | 7.23 | 1630.4 | −2.76 |
| Q20 | 612.38 | 206.09 | 147.47 | 211.96 | 1812.27 | 330.09 | 7.27 | 1528 | −1.54 | C5 | 637.39 | 92.17 | 149.09 | 147.14 | 1770.6 | 216.17 | 7.44 | 2139.883 | −0.99 |
| P1 | 742.44 | 293.06 | 215.67 | 61.92 | 2747.64 | 360.26 | 7.6 | 4438 | −1.48 | C6 | 605.81 | 113.49 | 57.16 | 135.17 | 1667.17 | 192.27 | 7.2 | 2065.036 | −5.15 |
| P2 | 742.44 | 293.06 | 215.67 | 61.92 | 2747.64 | 360.26 | 7.7 | 4328 | −1.48 | C7 | 268.92 | 21.75 | 15.14 | 225.43 | 8.23 | 418.42 | 7.16 | 951.35 | −3.01 |
| P3 | 520.28 | 3.05 | 1.07 | 119.2 | 125.1 | 971.3 | 8.49 | 1222 | −5.28 | C8 | 369.98 | 10.29 | 4.8 | 152.45 | 140.36 | 547.01 | 7.14 | 904.5 | −3.32 |
| P4 | 474.74 | 1.18 | 4.31 | 106.78 | 251.9 | 667.84 | 8.62 | 1246 | −1.29 | C9 | 311.44 | 18.21 | 15.36 | 206.37 | 113.19 | 463.92 | 7.5 | 925.32 | −5.32 |
| P5 | 505.63 | 3.89 | 8.02 | 163.09 | 227.2 | 775.66 | 8.5 | 2041 | −4.25 | C10 | 951.63 | 6.57 | 3.43 | 263.25 | 679.55 | 874.18 | 9.18 | 1557 | 3.81 |
| P6 | 351.83 | 64.07 | 65.82 | 218.04 | 465.93 | 507.44 | 5.59 | 1157 | −4.52 | C11 | 216.68 | 115.65 | 54.17 | 168.74 | 377.44 | 428.81 | 7.8 | 1157 | −4.17 |
| P7 | 574.15 | 12.44 | 8.15 | 363.22 | 2.88 | 919.37 | 8.44 | 1192 | −4.46 | C12 | 314.87 | 337.47 | 96.25 | 329.28 | 1064.4 | 436.34 | 8.1 | 2108.139 | −2.66 |
| P8 | 383.25 | 12.16 | 2.74 | 329.64 | 4.53 | 476.44 | 8.43 | 1156 | −3.91 | C13 | 224.02 | 257.48 | 142.49 | 285.97 | 946.27 | 453.47 | 8.55 | 2158.53 | −4.45 |
| P9 | 405.17 | 48.9 | 30.88 | 200.94 | 456.88 | 452.29 | 8.55 | 1185 | −3.69 | C14 | 331.09 | 171.63 | 57.77 | 286.46 | 787.39 | 204.15 | 7.46 | 2198.355 | −1.7 |
| P10 | 307.35 | 103.54 | 78.43 | 216.24 | 560.19 | 440.48 | 8.55 | 1185 | −3.5 | C15 | 344.29 | 149.28 | 41.42 | 287.88 | 690.66 | 214.11 | 7.01 | 2021.338 | −2.01 |
| P11 | 294.4 | 116.67 | 81.14 | 216.47 | 568.83 | 448.02 | 10.96 | 1557 | −4.03 | C16 | 605.57 | 8.64 | 8.58 | 272.77 | 36.63 | 1053.15 | 6.88 | 2376.129 | −3.59 |
| P12 | 346.31 | 100.55 | 38.41 | 229.3 | 528.91 | 350.83 | 8.55 | 1198 | −2.9 | C17 | 542.78 | 8.71 | 13.44 | 195.79 | 47.33 | 1084.8 | 6.97 | 2091.107 | −5.77 |
| P13 | 523.85 | 3.50 | 2.23 | 133.17 | 11.52 | 1068.50 | 8.54 | 1295.00 | −4.62 | O1 | 207.20 | 152.06 | 66.72 | 216.83 | 490.06 | 337.18 | 7.3 | 1045.07 | −2.43 |
| P14 | 382.86 | 5.53 | 10.53 | 187.81 | 21.81 | 545.92 | 7.7 | 1297.00 | 3.33 | O2 | 211.84 | 148.51 | 70.3 | 126.32 | 491.76 | 333.67 | 7.97 | 1043.26 | 5.22 |
| P15 | 558.19 | 6.73 | 16.18 | 234.59 | 291.41 | 664.73 | 8.61 | 1513.00 | −0.04 | | | | | | | | | | |
Table 2.
Statistics of all water samples.
Table 2.
Statistics of all water samples.
| Aquifers | Statistics | K+ + Na+ | Ca2+ | Mg2+ | Cl− | SO42− | HCO3− | pH | TDS |
|---|
| QLA | Mean | 320.12 | 210.18 | 132.52 | 193.73 | 1137.77 | 367.58 | 7.81 | 2017.1 |
| Median | 327.47 | 202.36 | 93.29 | 214.1 | 956.56 | 361.32 | 7.71 | 1527 |
| Standard deviation | 209.66 | 134.28 | 94.86 | 109.92 | 761.25 | 112.92 | 0.4 | 828.41 |
| Skewness | 0.05 | 0.82 | 1.41 | 0.14 | 0.23 | 0.27 | 0.63 | 0.97 |
| Min. | 5.26 | 21.57 | 35.75 | 17.88 | 36.22 | 228.52 | 7.25 | 1337 |
| Max. | 665.09 | 464.92 | 330.69 | 350.88 | 2180.4 | 602.9 | 8.6 | 3457 |
| PFA | Mean | 479.79 | 59.11 | 38.88 | 185.16 | 469.35 | 650.05 | 8.48 | 1531.2 |
| Median | 459.27 | 10.45 | 13.46 | 188 | 239.55 | 507.61 | 8.52 | 1297 |
| Standard deviation | 180.76 | 84.68 | 57.47 | 79.91 | 700.9 | 332.34 | 0.83 | 804.39 |
| Skewness | 0.64 | 1.78 | 2.2 | 0.25 | 2.5 | 1.06 | 0.58 | 3.25 |
| Min. | 229.03 | 1.18 | 0.96 | 59.94 | 0.41 | 217.54 | 5.59 | 999 |
| Max. | 915.35 | 293.06 | 215.67 | 363.22 | 2747.64 | 1412.39 | 10.96 | 4438 |
| CFA | Mean | 398.75 | 99.27 | 51.93 | 226.39 | 560.64 | 481.92 | 7.62 | 1616.57 |
| Median | 314.87 | 92.17 | 41.42 | 225.43 | 544.89 | 436.34 | 7.46 | 1630.4 |
| Standard deviation | 201.44 | 99.41 | 46.33 | 80.45 | 556.12 | 295.06 | 0.63 | 557.01 |
| Skewness | 1.53 | 1.01 | 0.96 | 0.07 | 1.01 | 0.82 | 1.09 | 0.17 |
| Min. | 216.68 | 6.57 | 3.43 | 106.83 | 8.23 | 40.39 | 6.88 | 904.5 |
| Max. | 951.63 | 337.47 | 149.09 | 347.47 | 1770.6 | 1084.8 | 9.18 | 2376.13 |
Table 3.
Total variance explained.
Table 3.
Total variance explained.
| Component | Extraction Sums of Squared Loadings |
|---|
| Total | % Of Variance | Cumulative/% |
|---|
| F1 | 3.564 | 50.914 | 50.914 |
| F2 | 1.541 | 22.011 | 72.926 |
| F3 | 1.087 | 15.529 | 88.455 |
Table 4.
Rotating component matrix and contribution rate of principal factors.
Table 4.
Rotating component matrix and contribution rate of principal factors.
| Variables | Principal Factors | Contribution Rate (%) |
|---|
| F1 | F2 | F3 | F1 | F2 | F3 |
|---|
| K+ + Na+ | 0.05 | 0.97 | 0.07 | 4.43 | 89.44 | 6.13 |
| Ca2+ | 0.87 | −0.37 | 0.15 | 62.68 | 26.44 | 10.88 |
| Mg2+ | 0.90 | −0.31 | −0.11 | 68.44 | 23.37 | 8.19 |
| Cl− | −0.11 | 0.03 | 0.99 | 9.35 | 2.52 | 88.13 |
| SO42− | 0.97 | 0.04 | −0.09 | 88.70 | 3.48 | 7.83 |
| HCO3− | −0.53 | 0.60 | −0.08 | 43.72 | 49.31 | 6.97 |
| TDS | 0.88 | 0.16 | −0.24 | 68.86 | 12.21 | 18.94 |
Table 5.
Statistical results of the percentage of variation (PV) calculated between the values measured in the laboratory and those estimated by the interpolation applied to the sampling points, for all groundwater samples.
Table 5.
Statistical results of the percentage of variation (PV) calculated between the values measured in the laboratory and those estimated by the interpolation applied to the sampling points, for all groundwater samples.
| | QF1 | QF2 | QF3 | QFsum | PF1 | PF2 | PF3 | PFsum | CF1 | CF2 | CF3 | CFsum |
|---|
| min | 0.00 | 0.00 | 0.01 | 0.03 | 0.03 | 0.09 | 0.03 | 0.01 | 0.14 | 0.02 | 0.08 | 0.05 |
| max | 10.07 | 12.63 | 2.02 | 44.28 | 8.02 | 61.78 | 10.99 | 18.62 | 2.09 | 1.87 | 10.04 | 72.02 |
| mean | 1.33 | 1.29 | 0.72 | 3.54 | 1.33 | 3.18 | 1.75 | 2.31 | 0.99 | 0.98 | 1.81 | 6.18 |
| median | 0.61 | 0.32 | 0.70 | 1.08 | 0.42 | 0.63 | 0.67 | 0.89 | 1.06 | 1.16 | 0.64 | 0.64 |
Table 6.
Potential hydrogeochemical reaction phase.
Table 6.
Potential hydrogeochemical reaction phase.
| Phase | Formula | Reaction |
|---|
| Calcite | CaCO3 | CaCO3 = Ca2+ + CO32– |
| Dolomite | CaMg(CO3)2 | CaMg(CO3)2 = Ca2+ + Mg2+ + 2CO32– |
| Gypsum | CaSO4·2H2O | CaSO4·2H2O = Ca2+ + SO42−+ 2H2O |
| Halite | (Na + K)Cl | (Na + K)Cl = (Na + K)+ + Cl− |
| NaX | NaX | NaX = Na+ + X− |
| CaX2 | CaX2 | CaX2= Ca2+ + 2X− |
| MgX2 | MgX2 | MgX2= Mg2+ + 2X− |
| H2O(g) | H2O(g) | H2O(g) = H2O(a) |
| CO2(g) | CO2(g) | CO2(g) = CO2(a) |
| O2(g) | O2(g) | O2(g) = O2(a) |
Table 7.
Result for the inverse geochemical modeling of Permian fractured aquifer connections.
Table 7.
Result for the inverse geochemical modeling of Permian fractured aquifer connections.
| Water Sample and Phases | Formula | Flow and Mixing Path: | Indications |
|---|
| Origin 1 | | C13/O2→P7 | |
| | | Fractions and mole transfer (mol/L) | |
| C13 | - | 0.620 | |
| O1 | - | 0.370 | |
| P7 | - | 1 | |
| CO2 (g) | CO2 (g) | 5.41 × 10⁻³ | |
| Gypsum | CaSO4·2H2O | −7.67 × 10⁻³ | |
| Halit | (Na + K)Cl | 2.66 × 10⁻³ | |
| MgX2 | MgX2 | −6.88 × 10⁻³ | |
| NaX | NaX | 1.38 × 10⁻² | |
| Dolomite | CaMg(CO3)2 | 2.32 × 10⁻³ | |
| Origin 2 | | Q9/C11/O2 → P27 | |
| | | Fractions and mole transfer (mol/L) | |
| Q9 | - | 0.018 | |
| C11 | - | 1.068 | |
| O2 | - | 0.499 | |
| P27 | - | 1 | |
| Calcite | CaCO3 | −2.244 × 10⁻³ | |
| CO2 (g) | CO2 (g) | −3.008 × 10⁻³ | |
| Gypsum | CaSO4·2H2O | 1.431 × 10⁻³ | |
| H2O (g) | H2O (g) | −32.54 | |
Table 8.
Result for the inverse geochemical modeling of Carboniferous fractured limestone aquifer connections.
Table 8.
Result for the inverse geochemical modeling of Carboniferous fractured limestone aquifer connections.
| Water Sample and Phases | Formula | Flow and Mixing Path: | Indications |
|---|
| | | C10/Q8 → C15 | |
| | | Fractions and mole transfer (mol/L) | |
| C10 | - | 0.670 | |
| Q8 | - | 0.320 | |
| C15 | - | 1 | |
| Calcite | CaCO3 | 1.161 ×10⁻³ | |
| NaX | NaX | 2.386 × 10⁻³ | |
| MgX2 | MgX2 | −4.88 × 10⁻³ | |
| CO2(g) | CO2(g) | 1.072 × 10⁻⁴ | |
| Dolomite | CaMg(CO3)2 | −8.275 × 10⁻⁴ | |
| Halite | (Na + K)Cl | −4.815 × 10⁻⁴ | |
Table 9.
Result for the inverse geochemical modeling of Ordovician fractured limestone aquifer connections.
Table 9.
Result for the inverse geochemical modeling of Ordovician fractured limestone aquifer connections.
| Water Sample and Phases | Formula | Flow and Mixing Path: | Indications |
|---|
| | | C12/Q6 → O1 | |
| | | Fractions and mole transfer (mol/L) | |
| C12 | - | 0.572 | |
| Q6 | - | 0.428 | |
| O1 | - | 1 | |
| Calcite | CaCO3 | 1.229 × 10⁻³ | |
| Gypsum | CaSO4·2H2O | −3.847 × 10⁻³ | |
| CO2 (g) | CO2(g) | −4.689 × 10⁻⁴ | |
| Dolomite | CaMg(CO3)2 | −1.089 × 10⁻³ | |
| Halite | (Na + K)Cl | −3.447 × 10⁻³ | |


