
Incidence and Risk Factors for Low Birthweight and Preterm Birth in Post-Conflict Northern Uganda: A Community-Based Cohort Study

 , , , ,
Abstract
1. Background
2. Methods
2.1. Study Procedures
2.2. Statistical Analysis
3. Results
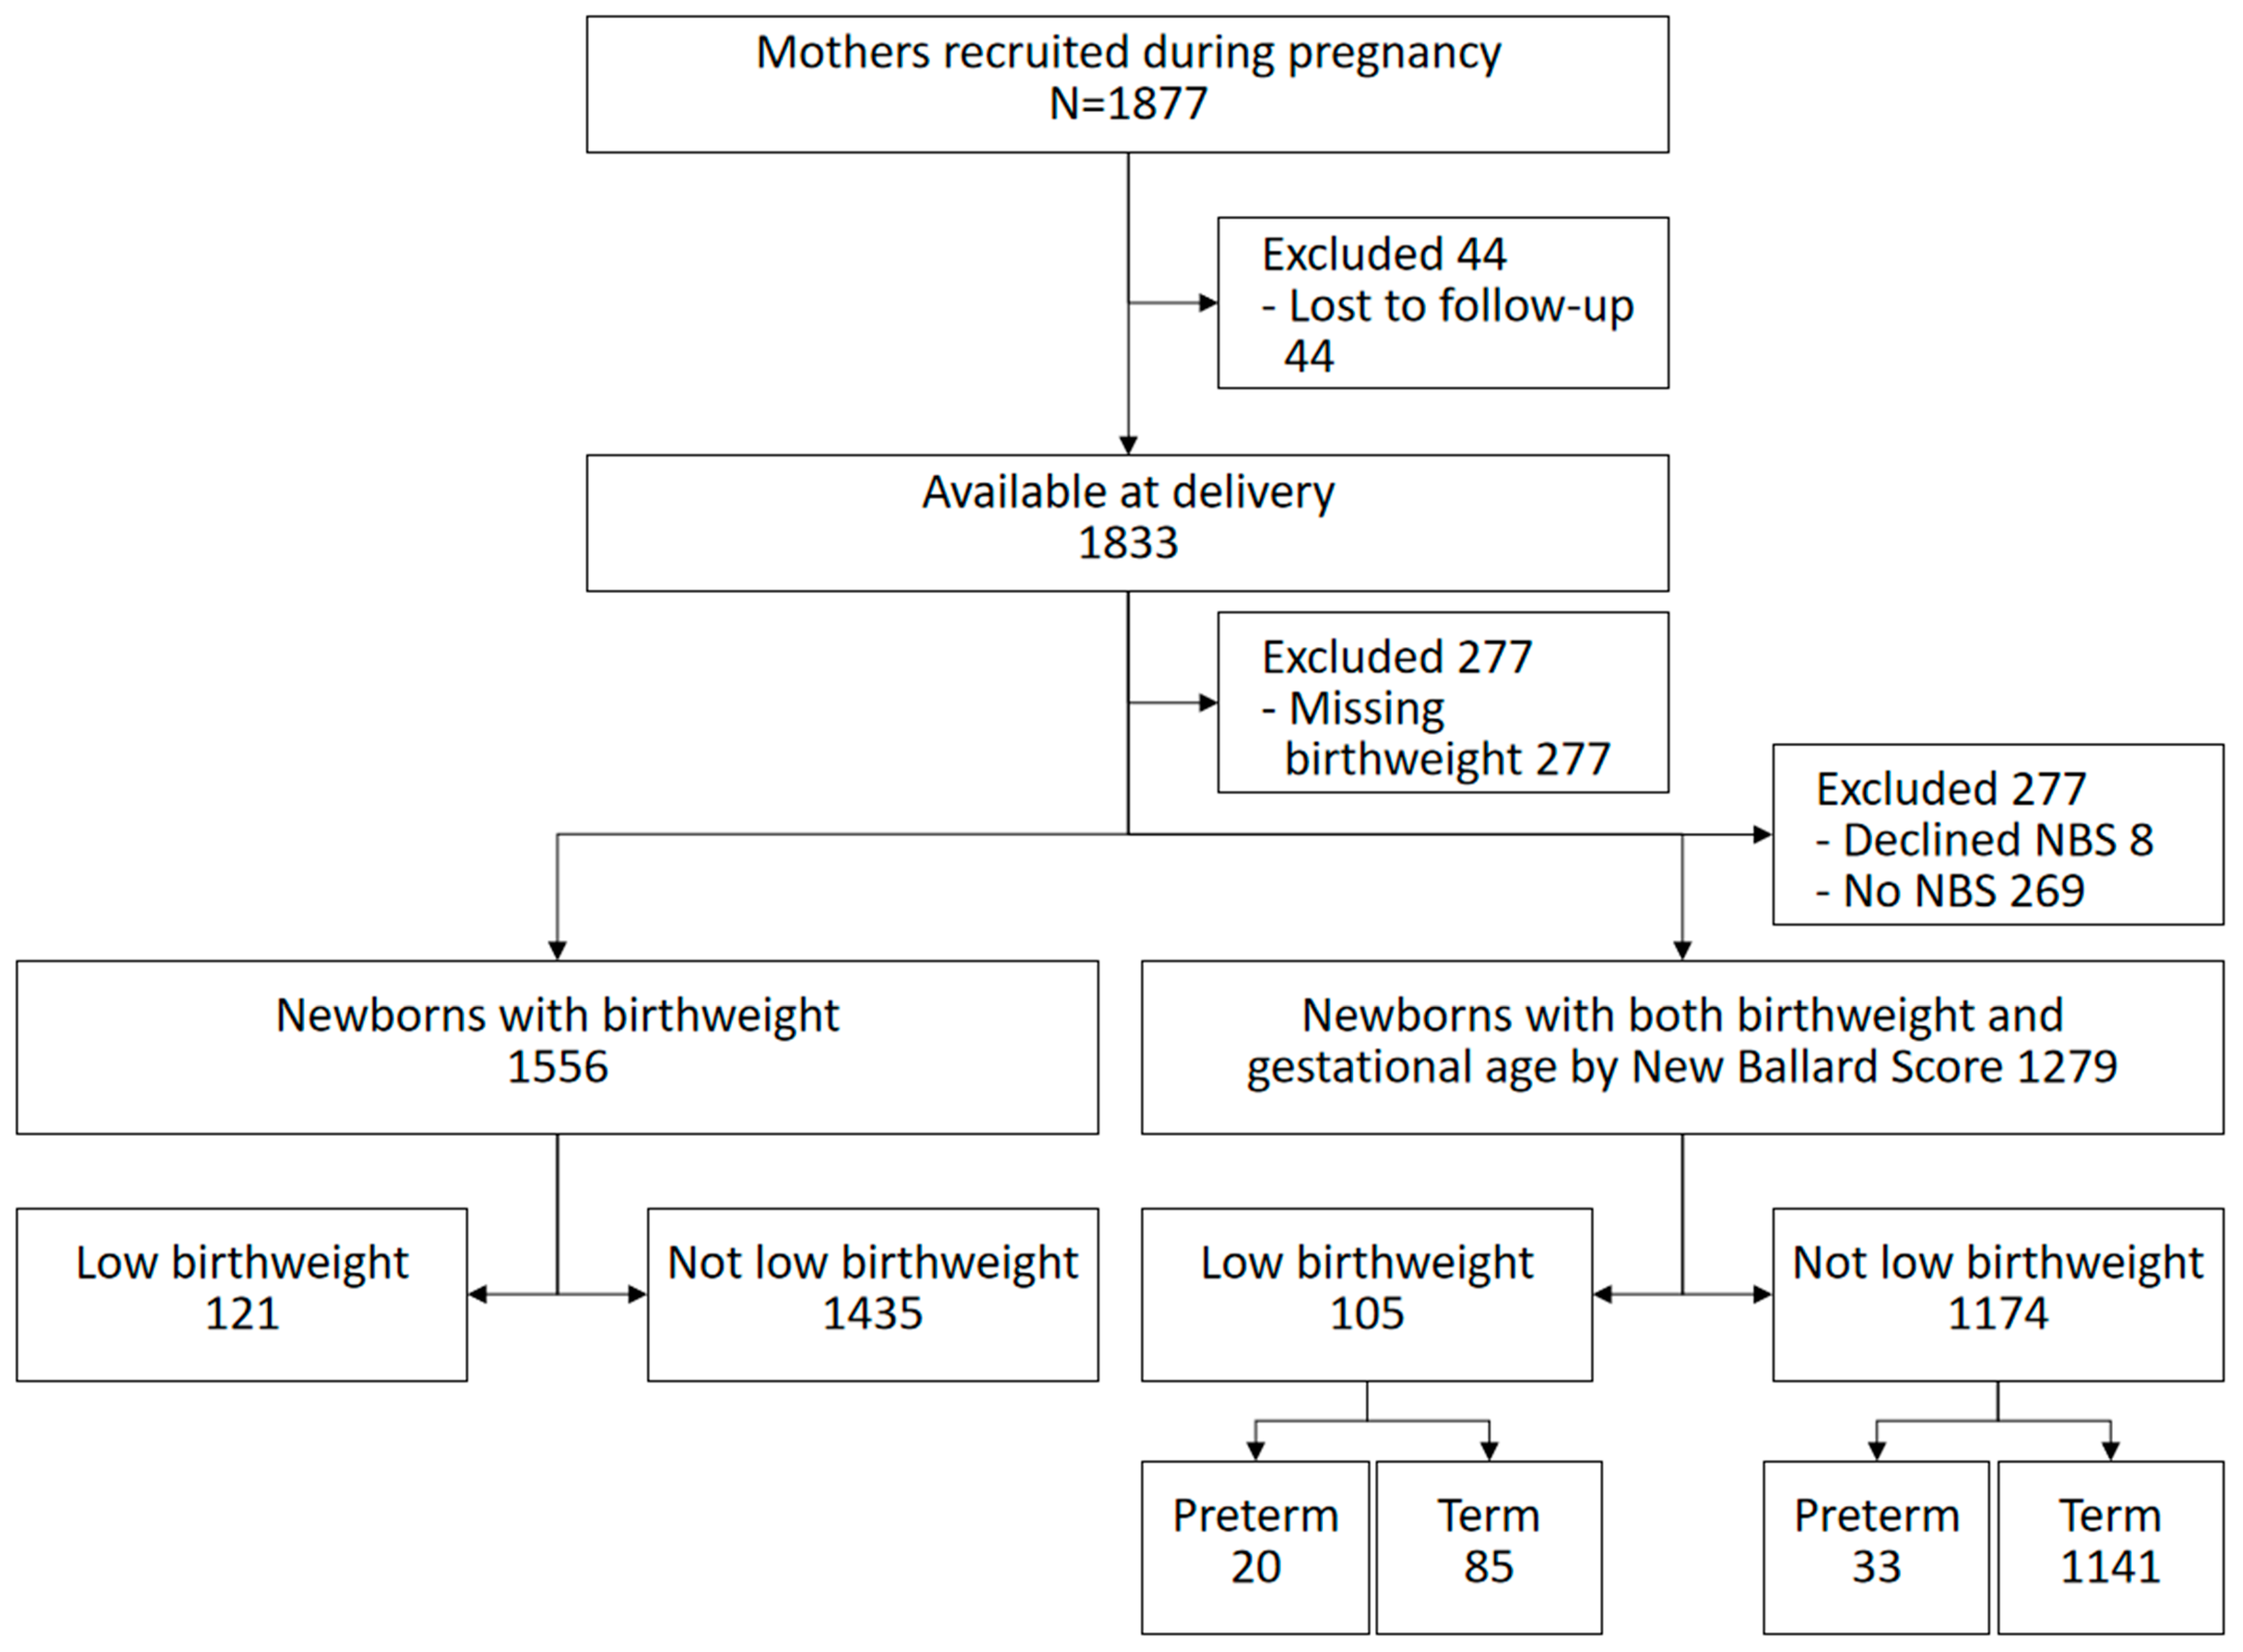
3.1. Study Profile
3.2. Baseline and Clinical Characteristics of Study Participants
3.3. The Incidence of Low Birthweight and Preterm Birth
3.3.1. Low Birthweight
3.3.2. Preterm Birth

| Crude Incidence of Preterm Birth (95% CI) | Cluster and Adjusted Incidence of Preterm Birth (95% CI) | |
|---|---|---|
| Using the original New Ballard Score | 4.1% (3.0–5.8%) | 5.0% (3.2–7.7%) |
| Subtracting 1 score point from the New Ballard Score | 5.5% (4.4–6.9%) | 6.4% (4.4–9.2%) |
| Subtracting 2 score points from the New Ballard Score | 7.8% (6.5–9.6%) | 8.6% (6.1–12.2%) |
| Subtracting 3 score points from the New Ballard Score | 12.1% (10.4–14.0%) | 13.1% (10.0–16.9%) |
| Subtracting 4 score points from the New Ballard Score | 17.1% (15.2–19.3%) | 17.8% (14.6–21.4%) |
3.4. Risk Factors for Low Birthweight and Preterm Birth
3.4.1. Low Birthweight
| Characteristics | All N = 1556 n (%) | LBW N = 121 n (%) | Crude RR (95% CI) N = 1556 | p Value | Adjusted RR (95% CI) N = 1556 | p Value |
|---|---|---|---|---|---|---|
| Maternal characteristics | ||||||
| Maternal age | ||||||
| 12–19 years | 415 (26.7) | 40 (33.1) | 1.4 (1.0–2.0) | 0.048 | 1.3 (0.8–2.1) | 0.351 |
| 20–34 years | 982 (63.1) | 67 (55.4) | Ref | |||
| ≥35 years | 159 (10.2) | 14 (11.6) | 1.3 (0.9–1.9) | 0.183 | 1.9 (1.1–3.4) | 0.021 |
| Maternal education | ||||||
| 0–6 years | 1246 (80.1) | 91 (75.2) | Ref | |||
| ≥7 years | 310 (19.9) | 30 (24.8) | 1.3 (0.9–2.0) | 0.190 | 1.4 (0.9–2.3) | 0.102 |
| Maternal vocational education | ||||||
| No | 1371 (88.1) | 103 (85.1) | Ref | |||
| Yes | 185 (11.9) | 18 (14.9) | 1.3 (0.8–2.1) | 0.297 | ||
| Marital status | ||||||
| Married | 1417 (91.1) | 110 (90.9) | 1.0 (0.5–1.8) | 0.951 | ||
| Single/separated/divorced/widowed | 139 (8.9) | 11 (9.1) | Ref | |||
| Wealth index groups | ||||||
| Lower 40% | 708 (45.5) | 62 (51.2) | Ref | |||
| Middle 40% | 547 (35.2) | 40 (33.1) | 0.8 (0.6–1.3) | 0.379 | 0.8 (0.6–1.3) | 0.402 |
| Upper 20% | 301 (19.3) | 19 (15.7) | 0.7 (0.5–1.2) | 0.171 | 0.7 (0.4–1.2) | 0.255 |
| Father’s occupation | ||||||
| Farmer | 1058 (68.0) | 87 (71.9) | Ref | |||
| Employed | 348 (22.4) | 22 (18.2) | 1.0 (0.5–1.8) | 0.929 | ||
| Unemployed | 150 (9.6) | 12 (9.9) | 0.8 (0.5–1.2) | 0.237 | ||
| Domestic water source | ||||||
| Tap/Borehole | 977 (62.8) | 72 (59.5) | Ref | |||
| Spring/river/well/stream/pond | 579 (37.2) | 49 (40.5) | 1.1 (0.8–1.7) | 0.476 | ||
| Intervention | ||||||
| No | 740 (47.6) | 60 (49.6) | Ref | |||
| Yes | 816 (52.4) | 61 (50.4) | 0.9 (0.6–1.3) | 0.656 | 0.9 (0.6–1.4) | 0.716 |
| Facility Delivery | ||||||
| No | 482 (31.1) | 42 (34.7) | ||||
| Yes | 1070 (68.9) | 79 (65.3) | 0.8 (0.6–1.1) | 0.251 | ||
| Maternal clinical characteristics | ||||||
| History of a small infant | ||||||
| No | 218 (14.0) | 19 (15.7) | Ref | |||
| Yes | 985 (63.3) | 68 (56.2) | 1.3 (0.7–2.1) | 0.386 | 2.1 (1.2–3.7) | 0.014 |
| Prime gravida | 353 (22.7) | 34 (28.1) | 1.4 (0.9–2.1) | 0.090 | 1.1 (0.6–1.8) | 0.778 |
| Parity | ||||||
| Prime gravida | 353 (22.7) | 34 (28.1) | Omitted | |||
| 1–6 | 1043 (67.0) | 77 (63.6) | Ref | |||
| 7 or more | 160 (10.3) | 10 (8.3) | 0.8 (0.5–1.5) | 0.573 | 0.6 (0.3–1.4) | 0.226 |
| Maternal HIV infection | ||||||
| No | 1455 (93.5) | 116 (95.9) | Ref | |||
| Yes | 73 (4.7) | 5 (4.1) | 0.9 (0.4–2.0) | 0.723 | 0.9 (0.4–1.8) | 0.719 |
| Unknown | 28 (1.8) | 0 (0.0) | Not applicable | |||
| Antennal attendance | ||||||
| No | 352 (22.6) | 30 (24.8) | Ref | |||
| Yes | 1204 (77.4) | 91 (75.2) | 0.9 (0.6–1.3) | 0.522 | ||
| IPT for malaria in pregnancy | ||||||
| No | 704 (45.2) | 69 (57.0) | Ref | |||
| Yes | 852 (54.8) | 52 (43.0) | 0.6 (0.4–0.8) | 0.003 | 0.6 (0.4–0.8) | 0.001 |
| Malaria in pregnancy | ||||||
| No | 502 (32.3) | 25 (20.7) | Ref | |||
| Yes | 388 (24.9) | 32 (26.4) | 1.7 (1.01–2.7) | 0.046 | 1.7 (1.01–2.9) | 0.045 |
| Unknown | 666 (42.8) | 64 (52.9) | 1.9 (1.2–3.0) | 0.005 | 1.9 (1.1–3.2) | 0.020 |
| Infant sex | ||||||
| Female | 757 (48.7) | 63 (52.1) | Ref | |||
| Male | 799 (51.3) | 58 (47.9) | 0.9 (0.6–1.2) | 0.393 | 0.9 (0.7–1.2) | 0.463 |
3.4.2. Preterm Birth
| Characteristics | All N = 1279 n (%) | PB N = 53 n (%) | Crude RR (95% CI) N = 1279 | p Value | Adjusted RR (95% CI) N = 1279 | p Value |
|---|---|---|---|---|---|---|
| Maternal characteristics | ||||||
| Maternal age | ||||||
| 12–19 years | 330 (25.8) | 18 (34.0) | 1.6 (0.9–2.9) | 0.142 | 2.0 (1.0–4.3) | 0.050 |
| 20–34 years | 815 (63.7) | 28 (52.8) | Ref | |||
| ≥35 years | 134 (10.5) | 7 (13.2) | 1.5 (0.7–3.5) | 0.295 | 1.2 (0.6–2.6) | 0.612 |
| Maternal education | ||||||
| 0–6 years | 1032 (80.7) | 50 (94.3) | Ref | |||
| ≥7 years | 247 (19.3) | 3 (5.7) | 0.2 (0.1–0.8) | 0.022 | 0.3 (0.1–0.98) | 0.047 |
| Maternal vocational education | ||||||
| No | 1131 (88.4) | 45 (84.9) | ||||
| Yes | 148 (11.6) | 8 (15.1) | ||||
| Marital status | ||||||
| Married | 1166 (91.2) | 47 (88.7) | 0.7 (0.3–1.5) | 0.393 | ||
| Single/separated/divorced/widowed | 113 (8.8) | 6 (11.3) | Ref | |||
| Wealth index | ||||||
| Lower 40% | 574 (44.9) | 26 (49.1) | Ref | |||
| Middle 40% | 465 (36.3) | 18 (34.0) | 0.8 (0.5–1.4) | 0.513 | 0.9 (0.6–1.5) | 0.815 |
| Upper 20% | 240 (18.8) | 9 (17.0) | 0.8 (0.4–1.9) | 0.650 | 1.1 (0.5–2.5) | 0.847 |
| Father’s occupation | ||||||
| Farmer | 883 (69.0) | 38 (71.7) | Ref | |||
| Employed | 274 (21.4) | 8 (15.1) | 1.4 (0.7–2.9) | 0.342 | ||
| Unemployed | 122 (9.5) | 7 (13.2) | 0.7 (0.4–1.4) | 0.305 | ||
| Domestic water source | ||||||
| Tap/Borehole | 802 (62.7) | 27 (50.9) | Ref | |||
| Spring/river/well/stream/pond | 477 (37.3) | 26 (49.1) | 1.1 (0.8–1.7) | 0.476 | 1.5 (0.9–2.6) | 0.121 |
| Intervention | ||||||
| No | 601 (47.0) | 23 (43.4) | Ref | |||
| Yes | 678 (53.0) | 30 (56.6) | 1.1 (0.6–2.1) | 0.670 | 1.2 (0.7–2.2) | 0.517 |
| Facility Delivery | ||||||
| No | 397 (31.0) | 23 (4.4) | Ref | |||
| Yes | 882 (69.0) | 30 (56.6) | 0.6 (0.3- 1.01) | 0.054 | 0.6 (0.4–1.0) | 0.045 |
| Maternal clinical factors | ||||||
| History of a small infant | ||||||
| No | 964 (75.4) | 39 (73.6) | Ref | |||
| Yes | 40 (3.1) | 2 (3.8) | 1.2 (0.2–5.7) | 0.927 | 1.0 (0.2–5.2) | 0.986 |
| Prime gravida | 275 (21.5) | 12 (22.6) | 1.1 (0.5–2.0) | 0.884 | 0.8 (0.3–1.8) | 0.557 |
| Parity | ||||||
| Prime gravida | 275 (21.5) | 12 (22.6) | Ref | |||
| 1–6 | 872 (68.2) | 34 (64.2) | 1.1 (0.6–2.1) | 0.790 | ||
| 7 or more | 132 (10.3) | 7 (13.2) | 1.4 (0.7–2.6) | 0.346 | ||
| Maternal HIV infection | ||||||
| No | 1205 (94.2) | 47 (88.7) | Ref | |||
| Yes | 61 (4.8) | 6 (11.3) | 2.2 (0.9–5.6) | 0.094 | 2.9 (1.1–7.3) | 0.026 |
| Unknown | 13 (1.0) | 0 (0.0) | NA | |||
| Antenatal attendance | ||||||
| No | 283 (22.1) | 14 (26.4) | Ref | |||
| Yes | 996 (77.9) | 39 (73.6) | 0.8 (0.4–1.4) | 0.451 | ||
| IPT for malaria in pregnancy | ||||||
| No | 695 (54.3) | 29 (54.7) | Ref | |||
| Yes | 584 (45.7) | 24 (45.3) | 0.9 (0.5–1.6) | 0.832 | 1.0 (0.6–1.8) | 0.886 |
| Malaria in pregnancy | ||||||
| No | 330 (25.8) | 15 (28.3) | Ref | |||
| Yes | 342 (26.7) | 13 (24.5) | 0.8 (0.5–1.5) | 0.568 | ||
| Unknown | 607 (47.5) | 25 (47.2) | 0.9 (0.5–1.6) | 0.785 | ||
| Infant sex | ||||||
| Female | 620 (48.5) | 20 (37.7) | Ref | |||
| Male | 659 (51.5) | 33 (62.3) | 1.6 (0.9–2.7) | 0.117 | 1.6 (1.0–2.8) | 0.070 |
4. Discussion
5. Limitations and Strengths
6. Conclusions
Author Contributions
Funding
Institutional Review Board Statement
Informed Consent Statement
Data Availability Statement
Conflicts of Interest
References
- Chawanpaiboon, S.; Vogel, J.P.; Moller, A.-B.; Lumbiganon, P.; Petzold, M.; Hogan, D.; Landoulsi, S.; Jampathong, N.; Kongwattanakul, K.; Laopaiboon, M.; et al. Global, regional, and national estimates of levels of preterm birth in 2014: A systematic review and modelling analysis. Lancet Glob. Health 2019, 7, e37–e46. [Google Scholar] [CrossRef]
- Lee, A.C.; Katz, J.; Blencowe, H.; Cousens, S.; Kozuki, N.; Vogel, J.P.; Adair, L.; Baqui, A.H.; A Bhutta, Z.; E Caulfield, L.; et al. National and regional estimates of term and preterm babies born small for gestational age in 138 low-income and middle-income countries in 2010. Lancet Glob. Health 2013, 1, e26–e36. [Google Scholar] [CrossRef]
- Barros, F.C.; Barros, A.J.; Villar, J.; Matijasevich, A.; Domingues, M.R.; Victora, C.G. How many low birthweight babies in low- and middle-income countries are preterm? Rev. Saúde Pública 2011, 45, 607–616. [Google Scholar] [CrossRef]
- Uganda Bureau of Statistics (UBOS). Uganda Demographic and Health Survey 2011; UBOS: Kampala, Uganda; ICF International Inc.: Calverton, MD, USA, 2012. [Google Scholar]
- Blencowe, H.; Cousens, S.; Oestergaard, M.Z.; Chou, D.; Moller, A.-B.; Narwal, R.; Adler, A.; Garcia, C.V.; Rohde, S.; Say, L.; et al. National, regional, and worldwide estimates of preterm birth rates in the year 2010 with time trends since 1990 for selected countries: A systematic analysis and implications. Lancet 2012, 379, 2162–2172. [Google Scholar] [CrossRef]
- Nabiwemba, E.; Marchant, T.; Namazzi, G.; Kadobera, D.; Waiswa, P. Identifying high-risk babies born in the community using foot length measurement at birth in Uganda. Child Care Health Dev. 2013, 39, 20–26. [Google Scholar] [CrossRef] [PubMed]
- Goldenberg, R.L.; Culhane, J.F.; Iams, J.D.; Romero, R. Epidemiology and causes of preterm birth. Lancet 2008, 371, 75–84. [Google Scholar] [CrossRef]
- Simonsen, S.E.; Lyon, J.L.; Stanford, J.B.; Porucznik, C.A.; Esplin, M.S.; Varner, M.W. Risk factors for recurrent preterm birth in multiparous Utah women: A historical cohort study. BJOG 2013, 120, 863–872. [Google Scholar] [CrossRef] [PubMed]
- Yadav, S.; Choudhary, D.; Kc, N.; Mandal, R.K.; Sharma, A.; Chauhan, S.S.; Agrawal, P. Adverse reproductive outcomes associated with teenage pregnancy. Mcgill J. Med. 2008, 11, 141–144. [Google Scholar] [CrossRef]
- Rubens, C.E.; Sadovsky, Y.; Muglia, L.; Gravett, M.G.; Lackritz, E.; Gravett, C. Prevention of preterm birth: Harnessing science to address the global epidemic. Sci. Transl. Med. 2014, 6, 262sr5. [Google Scholar] [CrossRef] [PubMed]
- Bell, R.; Lumley, J. Low birthweight and socioeconomic status. Aust. J. Public Health 1992, 16, 207. [Google Scholar]
- Kogan, M.D. Social causes of low birth weight. J. R. Soc. Med. 1995, 88, 611–615. [Google Scholar] [CrossRef]
- Han, Z.; Mulla, S.; Beyene, J.; Liao, G.; McDonald, S.D.; Knowledge Synthesis, G. Maternal underweight and the risk of preterm birth and low birth weight: A systematic review and meta-analyses. Int. J. Epidemiol. 2011, 40, 65–101. [Google Scholar] [CrossRef]
- Ojha, N. Maternal Factors for Low Birth Weight and Preterm Birth At Tertiary Care Hospital. JNMA J. Nepal. Med. Assoc. 2015, 53, 250–255. [Google Scholar] [CrossRef] [PubMed]
- Mahande, M.J.; Daltveit, A.K.; Obure, J.; Mmbaga, B.T.; Masenga, G.; Manongi, R.; Lie, R.T. Recurrence of preterm birth and perinatal mortality in northern Tanzania: Registry-based cohort study. Trop. Med. Int. Health 2013, 18, 962–967. [Google Scholar] [CrossRef] [PubMed]
- Bratton, S.L.; Shoultz, D.A.; Williams, M.A. Recurrence risk of low birthweight deliveries among women with a prior very low birthweight delivery. Am. J. Perinatol. 1996, 13, 147–150. [Google Scholar] [CrossRef] [PubMed]
- Ananth, C.V.; Getahun, D.; Peltier, M.R.; Salihu, H.M.; Vintzileos, A.M. Recurrence of spontaneous versus medically indicated preterm birth. Am. J. Obstet. Gynecol. 2006, 195, 643–650. [Google Scholar] [CrossRef] [PubMed]
- Palmer, K.T.; Bonzini, M.; Harris, E.C.; Linaker, C.; Bonde, J.P. Work activities and risk of prematurity, low birthweight and pre-eclampsia: An updated review with meta-analysis. Occup. Environ. Med. 2013, 70, 213–222. [Google Scholar] [CrossRef]
- James, W.H. Is male sex an independent risk factor for preterm birth? Am. J. Obstet. Gynecol. 2002, 186, 594. [Google Scholar] [CrossRef]
- Purisch, S.E.; DeFranco, E.A.; Muglia, L.J.; Odibo, A.O.; Stamilio, D.M. Preterm birth in pregnancies complicated by major congenital malformations: A population-based study. Am. J. Obstet. Gynecol. 2008, 199, 287.e1–287.e8. [Google Scholar] [CrossRef]
- ICF; UBoSUa. Uganda Demographic and Health Survey 2016; UBOS: Kampala, Uganda; ICF: Rockville, MD, USA, 2018. [Google Scholar]
- WHO. WHO: Recommended definitions, terminology and format for statistical tables related to the perinatal period and use of a new certificate for cause of perinatal deaths. Modifications recommended by FIGO as amended October 14, 1976. Acta Obstet. Gynecol. Scand. 1977, 56, 247–253. [Google Scholar]
- UNICEF. Maternal and Newborn Health Disparities in Uganda. Available online: https://data.unicef.org/resources/maternal-newborn-health-disparities-country-profiles/Uganda (accessed on 27 December 2021).
- Bater, J.; Lauer, J.M.; Ghosh, S.; Webb, P.; Agaba, E.; Bashaasha, B.; Turyashemererwa, F.M.; Shrestha, R.; Duggan, C.P. Predictors of low birth weight and preterm birth in rural Uganda: Findings from a birth cohort study. PLoS ONE 2020, 15, e0235626. [Google Scholar] [CrossRef] [PubMed]
- Pusdekar, Y.V.; Patel, A.B.; Kurhe, K.G.; Bhargav, S.R.; Thorsten, V.; Garces, A.; Goldenberg, R.L.; Goudar, S.S.; Saleem, S.; Esamai, F.; et al. Rates and risk factors for preterm birth and low birthweight in the global network sites in six low- and low middle-income countries. Reprod. Health 2020, 17 (Suppl. 3), 187. [Google Scholar] [CrossRef] [PubMed]
- Widiyanto, J.; Lismawati, G. Maternal age and anemia are risk factors of low birthweight of newborn. Enferm. Clin. 2019, 29 (Suppl. 1), 94–97. [Google Scholar] [CrossRef]
- Iams, J.D.; Goldenberg, R.L.; Mercer, B.M.; Moawad, A.; Thom, E.; Meis, P.J.; McNellis, D.; Caritis, S.; Miodovnik, M.; Menard, M.; et al. The Preterm Prediction Study: Recurrence risk of spontaneous preterm birth. Am. J. Obstet. Gynecol. 1998, 178, 1035–1040. [Google Scholar] [CrossRef]
- Morgan, H.G. Placental malaria and low birthweight neonates in urban Sierra Leone. Ann. Trop. Med. Parasitol. 1994, 88, 575–580. [Google Scholar] [CrossRef]
- Toure, O.A.; Konan, C.B.C.; Kouame, V.N.; A Gbessi, E.; Soumahoro, A.; Bassinka, I.; Jambou, R. Risk factors for placental malaria and associated low birth weight in a rural high malaria transmission setting of Cote d’Ivoire. Trop. Parasitol. 2020, 10, 102–108. [Google Scholar] [CrossRef]
- Sasidharan, K.; Dutta, S.; Narang, A. Validity of New Ballard Score until 7th day of postnatal life in moderately preterm neonates. Arch. Dis. Child Fetal Neonatal. Ed. 2009, 94, F39–F44. [Google Scholar]
- Araya, B.; Díaz, M.; Paredes, D.; Ortiz, J. Association between preterm birth and its subtypes and maternal sociodemographic characteristics during the post-transitional phase in a developing country with a very high human development index. Public Health 2017, 147, 39–46. [Google Scholar] [CrossRef]
- Delnord, M.; Blondel, B.; Prunet, C.; Zeitlin, J. Are risk factors for preterm and early-term live singleton birth the same? A population-based study in France. BMJ Open 2018, 8, e018745. [Google Scholar] [CrossRef]
- Rahman, A.; Rahman, M.; Pervin, J.; Razzaque, A.; Aktar, S.; Ahmed, J.U.; Selling, K.E.; Svefors, P.; El Arifeen, S.; Persson, L. Time trends and sociodemographic determinants of preterm births in pregnancy cohorts in Matlab, Bangladesh, 1990–2014. BMJ Glob. Health 2019, 4, e001462. [Google Scholar] [CrossRef]
- Cappelletti, M.; Della Bella, S.; Ferrazzi, E.; Mavilio, D.; Divanovic, S. Inflammation and preterm birth. J. Leukoc. Biol. 2016, 99, 67–78. [Google Scholar] [CrossRef] [PubMed]
- Grønvik, T.; Fossgard Sandøy, I. Complications associated with adolescent childbearing in Sub-Saharan Africa: A systematic literature review and meta-analysis. PLoS ONE 2018, 13, e0204327. [Google Scholar] [CrossRef] [PubMed]
- Kassa, G.M.; Arowojolu, A.O.; Odukogbe, A.A.; Yalew, A.W. Adverse neonatal outcomes of adolescent pregnancy in Northwest Ethiopia. PLoS ONE 2019, 14, e0218259. [Google Scholar] [CrossRef] [PubMed]
- Hediger, M.L.; Scholl, T.O.; Schall, J.I.; Krueger, P.M. Young maternal age and preterm labor. Ann. Epidemiol. 1997, 7, 400–406. [Google Scholar] [CrossRef]
- Shahabuddin, A.; De Brouwere, V.; Adhikari, R.; Delamou, A.; Bardaji, A.; Delvaux, T. Determinants of institutional delivery among young married women in Nepal: Evidence from the Nepal Demographic and Health Survey, 2011. BMJ Open 2017, 7, e012446. [Google Scholar] [CrossRef]
- Shahabuddin, A.; Nöstlinger, C.; Delvaux, T.; Sarker, M.; Delamou, A.; Bardají, A.; Broerse, J.E.W.; De Brouwere, V. Exploring Maternal Health Care-Seeking Behavior of Married Adolescent Girls in Bangladesh: A Social-Ecological Approach. PLoS ONE 2017, 12, e0169109. [Google Scholar] [CrossRef]
- Perez, M.J.; Chang, J.J.; Temming, L.A.; Carter, E.B.; López, J.D.; Tuuli, M.G.; Macones, G.A.; Stout, M.J. Driving Factors of Preterm Birth Risk in Adolescents. AJP Rep. 2020, 10, e247–e252. [Google Scholar] [CrossRef]
- Xu, H.; Dai, Q.; Xu, Y.; Gong, Z.; Dai, G.; Ding, M.; Duggan, C.; Hu, Z.; Hu, F.B. Time trends and risk factor associated with premature birth and infants deaths due to prematurity in Hubei Province, China from 2001 to 2012. BMC Pregnancy Childbirth 2015, 15, 329. [Google Scholar] [CrossRef]

| Characteristics | Low Birthweight | Preterm Birth | ||||||
|---|---|---|---|---|---|---|---|---|
| All N = 1877 n (%) | Analysed N = 1556 n (%) | Excluded N = 321 n (%) | p Value | All N = 1877 n (%) | Analysed N = 1279 n (%) | Excluded N = 598 n (%) | p Value | |
| Maternal characteristics | ||||||||
| Maternal age | ||||||||
| 12–19 years | 510 (27.2) | 415 (26.7) | 95 (29.6) | 510 (27.2) | 330 (25.8) | 180 (30.1) | ||
| 20–34 years | 1174 (62.5) | 982 (63.1) | 192 (59.8) | 0.325 | 1174 (62.5) | 815 (63.7) | 359 (60.0) | 0.017 |
| ≥35 years | 193 (10.3) | 159 (10.2) | 35 (10.6) | 193 (10.3) | 134 (10.5) | 59 ( 9.9) | ||
| Maternal education | ||||||||
| 0–6 years | 1515 (80.7) | 1246 (80.1) | 269 (83.8) | 1515 (80.7) | 1032 (80.7) | 483 (80.8) | ||
| ≥7 years | 362 (19.3) | 310 (19.9) | 52 (16.2) | 0.117 | 362 (19.3) | 247 (19.3) | 115 (19.2) | 0.896 |
| Maternal vocational education | ||||||||
| No | 1663 (88.6) | 1371 (88.1) | 292 (92.0) | 1663 (88.6) | 1131 (88.4) | 532 (89.0) | ||
| Yes | 214 (11.4) | 185 (11.9) | 29 ( 8.9) | 0.224 | 214 (11.4) | 148 (11.6) | 66 (11.0) | 0.700 |
| Marital status | ||||||||
| Married | 1708 (91.0) | 1417 (91.1) | 291 (90.7) | 0.495 | 1708 (91.0) | 1166 (91.2) | 542 (90.6) | 0.557 |
| Single/separated/divorced/widow | 169 ( 9.0) | 139 ( 8.9) | 30 ( 9.3) | 169 ( 9.0) | 113 (8.8) | 56 ( 9.4) | ||
| Wealth index | ||||||||
| Lower 40% | 837 (44.6) | 708 (45.5) | 129 (40.2) | 837 (44.6) | 574 (44.9) | 263 (44.0) | ||
| Middle 40% | 665 (35.4) | 547 (35.2) | 118 (36.8) | 0.329 | 665 (35.4) | 465 (36.4) | 200 (33.4) | 0.139 |
| Upper 20% | 375 (20.0) | 301 (19.3) | 74 (23.0) | 375 (20.0) | 240 (18.8) | 135 (22.6) | ||
| Father’s occupation | ||||||||
| Farmer | 1275 (67.9) | 1058 (68.0) | 217 (67.6) | 1275 (67.9) | 883 (69.1) | 392 (65.5) | ||
| Employed | 390 (20.8) | 348 (22.4) | 42 (13.1) | 0.022 | 390 (20.8) | 274 (21.4) | 116 (19.4) | 0.688 |
| Unemployed | 168 ( 9.0) | 150 ( 9.6) | 18 ( 5.6) | 168 ( 9.0) | 122 ( 9.5) | 46 ( 7.7) | ||
| Missing | 44 ( 2.3) | 0 ( 0.0) | 44 (13.7) | 44 ( 2.3) | 0 ( 0.0) | 44 ( 7.4) | ||
| Domestic water source | ||||||||
| Tap/Borehole | 1188 (63.3) | 977 (62.8) | 211 (65.7) | 0.459 | 1188 (63.3) | 802 (62.7) | 386 (64.6) | 0.268 |
| Spring/river/well/stream/pond | 689 (36.7) | 579 (37.2) | 110 (34.3) | 689 (36.7) | 477 (37.3) | 212 (35.4) | ||
| Intervention | ||||||||
| No | 855 (47.2) | 740 (47.6) | 145 (45.2) | 885 (47.2) | 601 (47.0) | 284 (47.5) | ||
| Yes | 992 (52.9) | 816 (52.4) | 176 (54.8) | 0.625 | 992 (52.8) | 678 (53.0) | 314 (52.5) | 0.956 |
| Facility Delivery | ||||||||
| No | 644 (34.3) | 484(31.1) | 160 (49.8) | 644 (34.3) | 397 (31.0) | 247 (41.3) | ||
| Yes | 1233 (65.7) | 1072(68.9) | 161 (50.2) | 0.000 | 1233 (65.7) | 882 (67.0) | 351 (58.7) | 0.000 |
| Maternal clinical characteristics | ||||||||
| History of small infant | ||||||||
| No | 1131 (60.2) | 985 (63.3) | 146 (45.5) | 1131 (60.3) | 964 (75.4) | 167 (30.2) | ||
| Yes | 317 (16.9) | 218 (14.0) | 99 (30.8) | 0.000 | 317 (16.9) | 40 ( 3.1) | 277 (50.0) | 0.000 |
| Prime gravida | 429 (22.9) | 353 (22.7) | 76 (23.7) | 429 (22.9) | 275 (21.5) | 154 (27.8) | ||
| Parity | ||||||||
| Prime gravida | 429 (22.9) | 353 (22.7) | 76 (23.7) | 429 (22.9) | 275 (21.5) | 154 (25.7) | ||
| 1–6 | 1257 (67.0) | 1043 (67.0) | 214 (66.8) | 0.857 | 1257 (67.0) | 872 (68.2) | 385 (64.4) | 0.025 |
| 7 or more | 191 (10.2) | 160 (10.3) | 31 ( 9.7) | 191 (10.2) | 132 (10.3) | 59 ( 9.9) | ||
| Maternal HIV infection | ||||||||
| No | 1708 (91.0) | 1455 (93.5) | 253 (78.8) | 1708 (91.0) | 1205 (94.2) | 503 (84.1) | ||
| Yes | 83 ( 4.4) | 73 ( 4.7) | 10 ( 3.1) | 0.000 | 83 ( 4.4) | 61 ( 4.8) | 22 ( 6.7) | 0.000 |
| Unknown | 86 ( 4.6) | 28 ( 1.8) | 58 (18.1) | 86 ( 4.6) | 13 ( 1.0) | 73 (12.2) | ||
| Antenatal attendance | ||||||||
| No | 395 (21.0) | 352 (22.6) | 43 (13.4) | 395 (21.0) | 283 (22.1) | 112 (18.7) | ||
| Yes | 1482 (79.0) | 1204 (77.4) | 278 (86.6) | 0.000 | 1482 (79.0) | 996 (77.9) | 486 (81.3) | 0.088 |
| IPT a for malaria in pregnancy | ||||||||
| No | 764 (40.7) | 704 (45.2) | 60(18.7) | 764 (40.7) | 695 (54.3) | 69 (11.5) | ||
| Yes | 1113 (59.3) | 852 (54.8) | 261 (81.3) | 0.000 | 1113 (59.3) | 584 (45.7) | 529 (88.5) | 0.000 |
| Maternal malaria in pregnancy | ||||||||
| No | 602 (32.1) | 502 (32.3) | 100 (31.2) | 602 (32.1) | 272 (45.5) | 330 (25.8) | ||
| Yes | 459 (24.4) | 388 (24.9) | 71 (22.1) | 0.245 | 459 (24.4) | 117 (19.6) | 342 (26.7) | 0.000 |
| Unknown | 816 (43.5) | 666 (42.8) | 150 (46.7) | 816 (43.5) | 209 (35.0) | 607 (47.5) | ||
| Infant sex | ||||||||
| Female | 892 (47.5) | 757 (48.7) | 135 (42.0) | 892 (47.5) | 620 (48.5) | 272 (45.5) | ||
| Male | 943 (50.2) | 799 (51.3) | 144 (44.9) | 0.950 | 943 (50.2) | 659 (51.5) | 284 (47.5) | 0.816 |
| Missing | 42 ( 2.3) | 0 ( 0.0) | 42 (13.1) | 42 (2.2) | 0 (0.0) | 42 (7.0) | ||
Publisher’s Note: MDPI stays neutral with regard to jurisdictional claims in published maps and institutional affiliations. |
© 2022 by the authors. Licensee MDPI, Basel, Switzerland. This article is an open access article distributed under the terms and conditions of the Creative Commons Attribution (CC BY) license (https://creativecommons.org/licenses/by/4.0/).
Share and Cite
Odongkara, B.; Nankabirwa, V.; Ndeezi, G.; Achora, V.; Arach, A.A.; Napyo, A.; Musaba, M.; Mukunya, D.; Tumwine, J.K.; Thorkild, T. Incidence and Risk Factors for Low Birthweight and Preterm Birth in Post-Conflict Northern Uganda: A Community-Based Cohort Study. Int. J. Environ. Res. Public Health 2022, 19, 12072. https://doi.org/10.3390/ijerph191912072
Odongkara B, Nankabirwa V, Ndeezi G, Achora V, Arach AA, Napyo A, Musaba M, Mukunya D, Tumwine JK, Thorkild T. Incidence and Risk Factors for Low Birthweight and Preterm Birth in Post-Conflict Northern Uganda: A Community-Based Cohort Study. International Journal of Environmental Research and Public Health. 2022; 19(19):12072. https://doi.org/10.3390/ijerph191912072
Chicago/Turabian StyleOdongkara, Beatrice, Victoria Nankabirwa, Grace Ndeezi, Vincentina Achora, Anna Agnes Arach, Agnes Napyo, Milton Musaba, David Mukunya, James K. Tumwine, and Tylleskar Thorkild. 2022. "Incidence and Risk Factors for Low Birthweight and Preterm Birth in Post-Conflict Northern Uganda: A Community-Based Cohort Study" International Journal of Environmental Research and Public Health 19, no. 19: 12072. https://doi.org/10.3390/ijerph191912072
APA StyleOdongkara, B., Nankabirwa, V., Ndeezi, G., Achora, V., Arach, A. A., Napyo, A., Musaba, M., Mukunya, D., Tumwine, J. K., & Thorkild, T. (2022). Incidence and Risk Factors for Low Birthweight and Preterm Birth in Post-Conflict Northern Uganda: A Community-Based Cohort Study. International Journal of Environmental Research and Public Health, 19(19), 12072. https://doi.org/10.3390/ijerph191912072