

Can Global Value Chain Participation Drive Green Upgrade in China’s Manufacturing Industry?


Abstract
:1. Introduction
2. Literature Review
3. Methods
3.1. Calculation Method of GVC Participation
3.2. Calculation Method of Green Upgrade of Manufacturing Sectors
3.3. Econometric Model Setting and Variable Explanations
3.4. Data Resources
4. Calculation Results and Analysis of GVC Participation and Green Upgrade of China’s Manufacturing Sectors
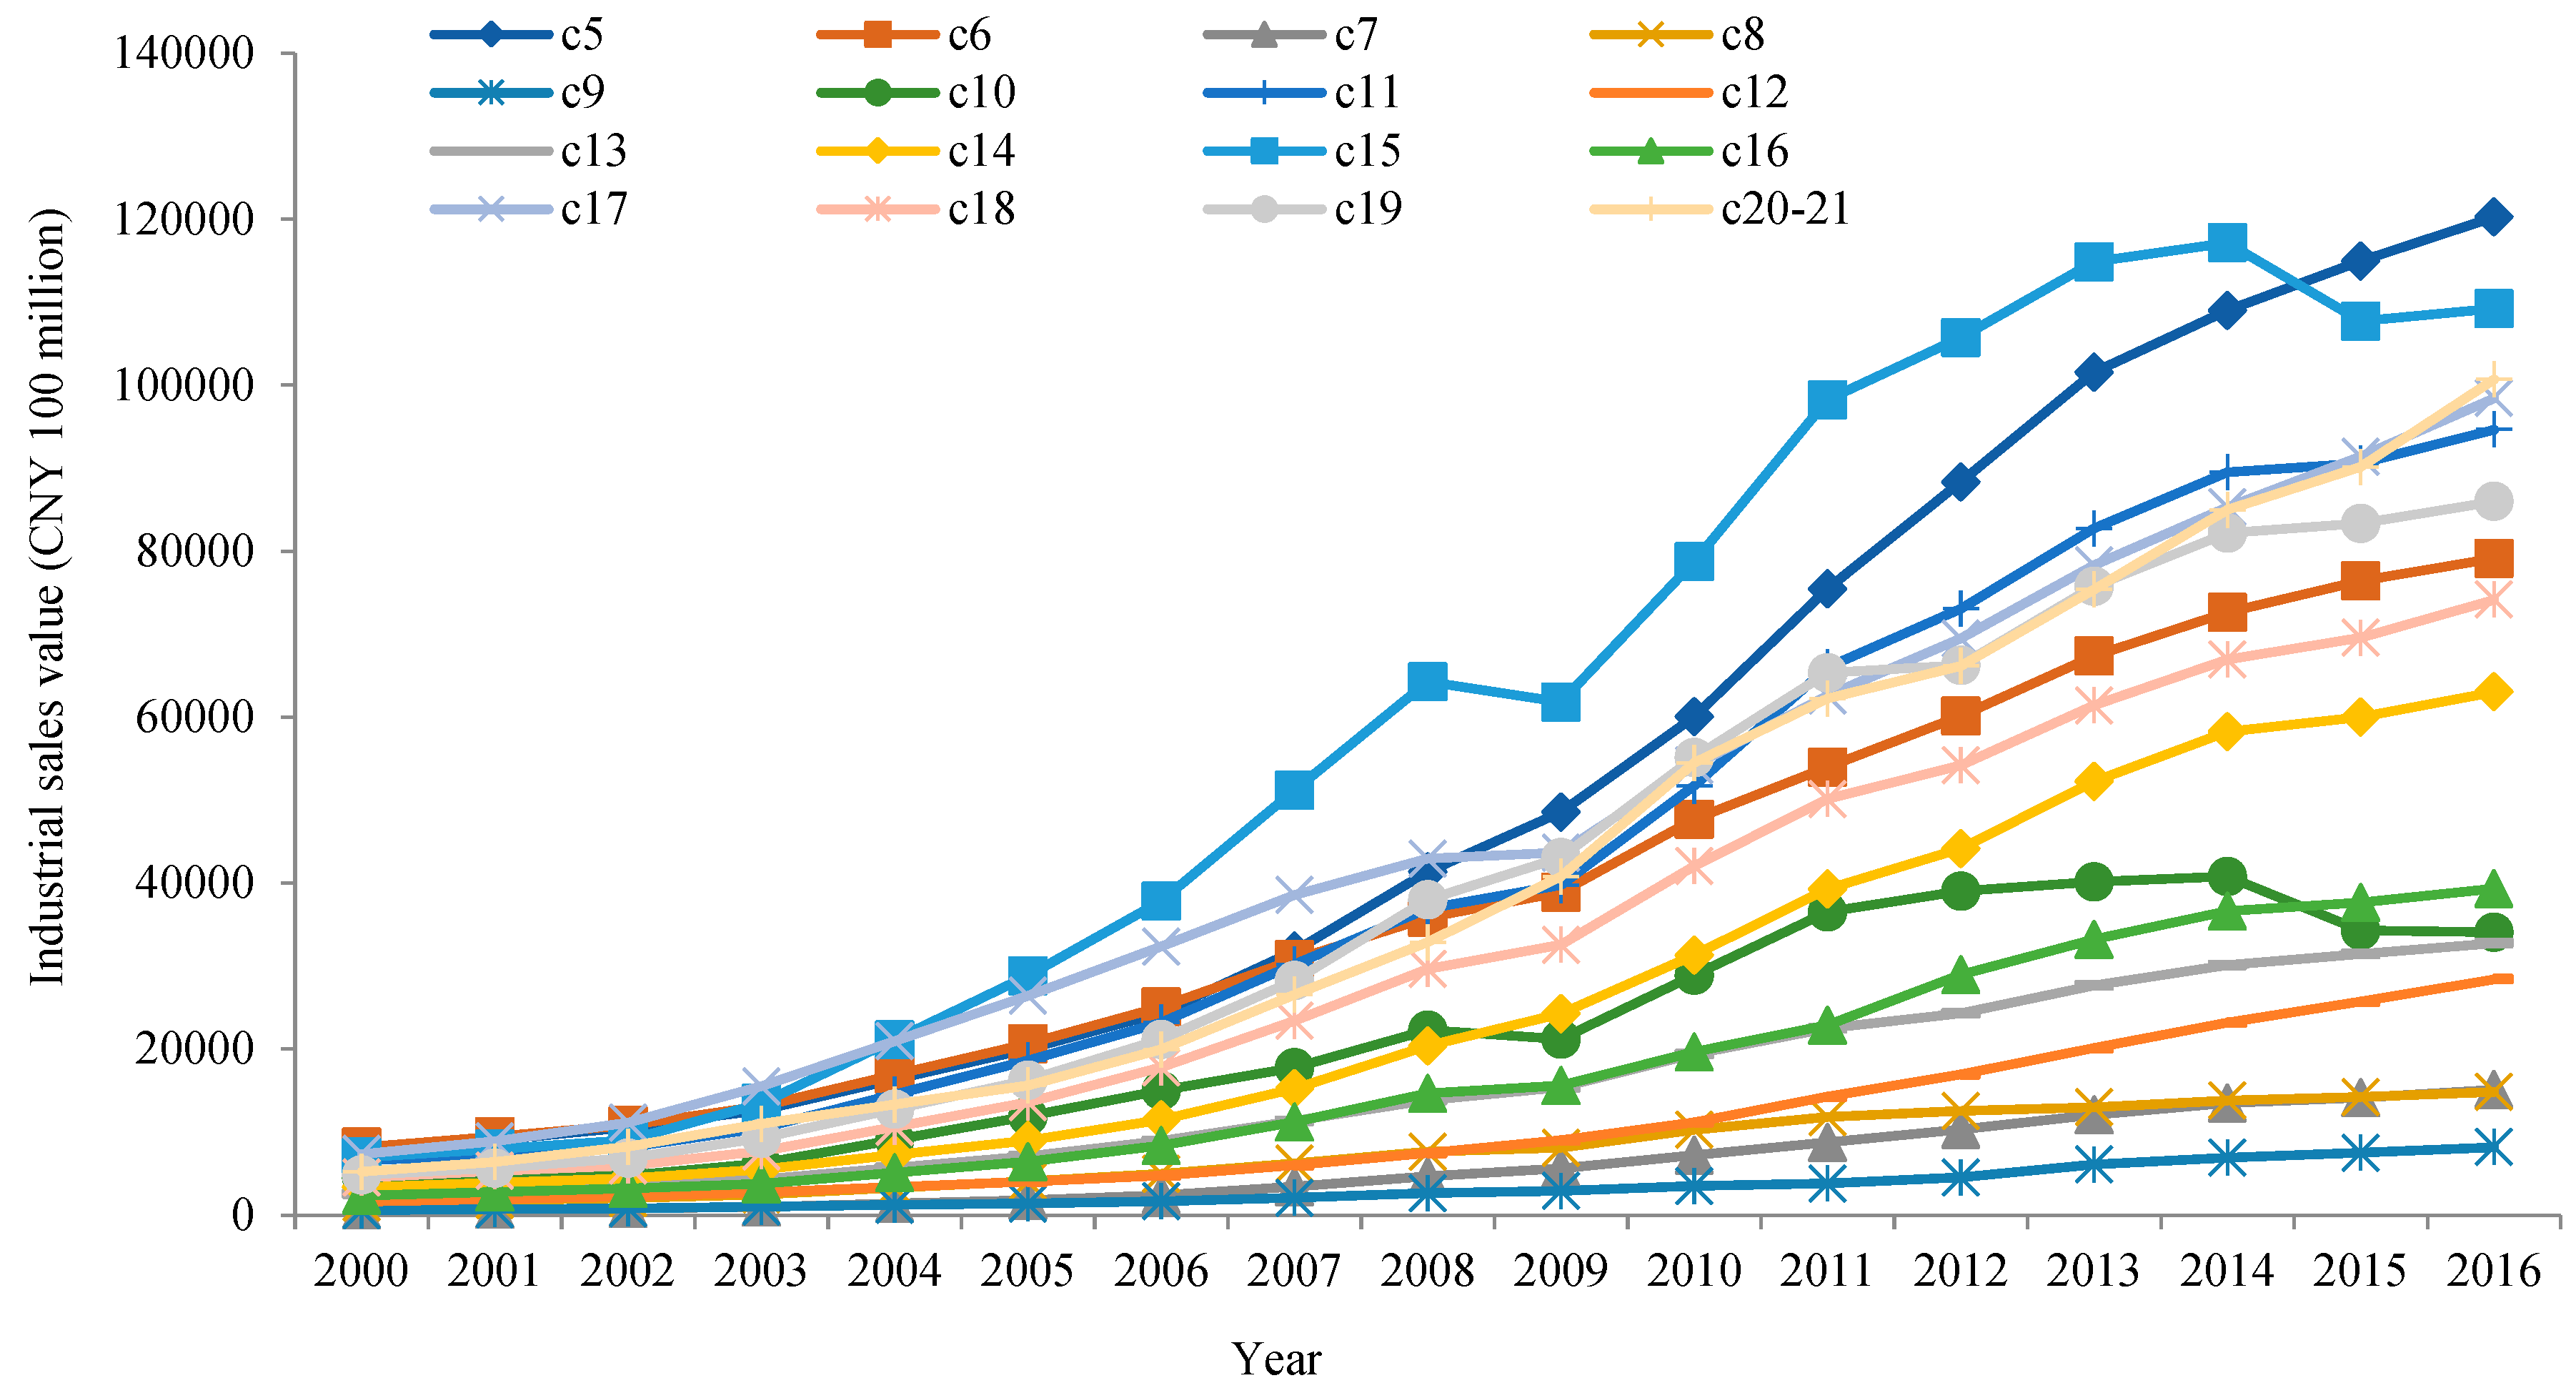
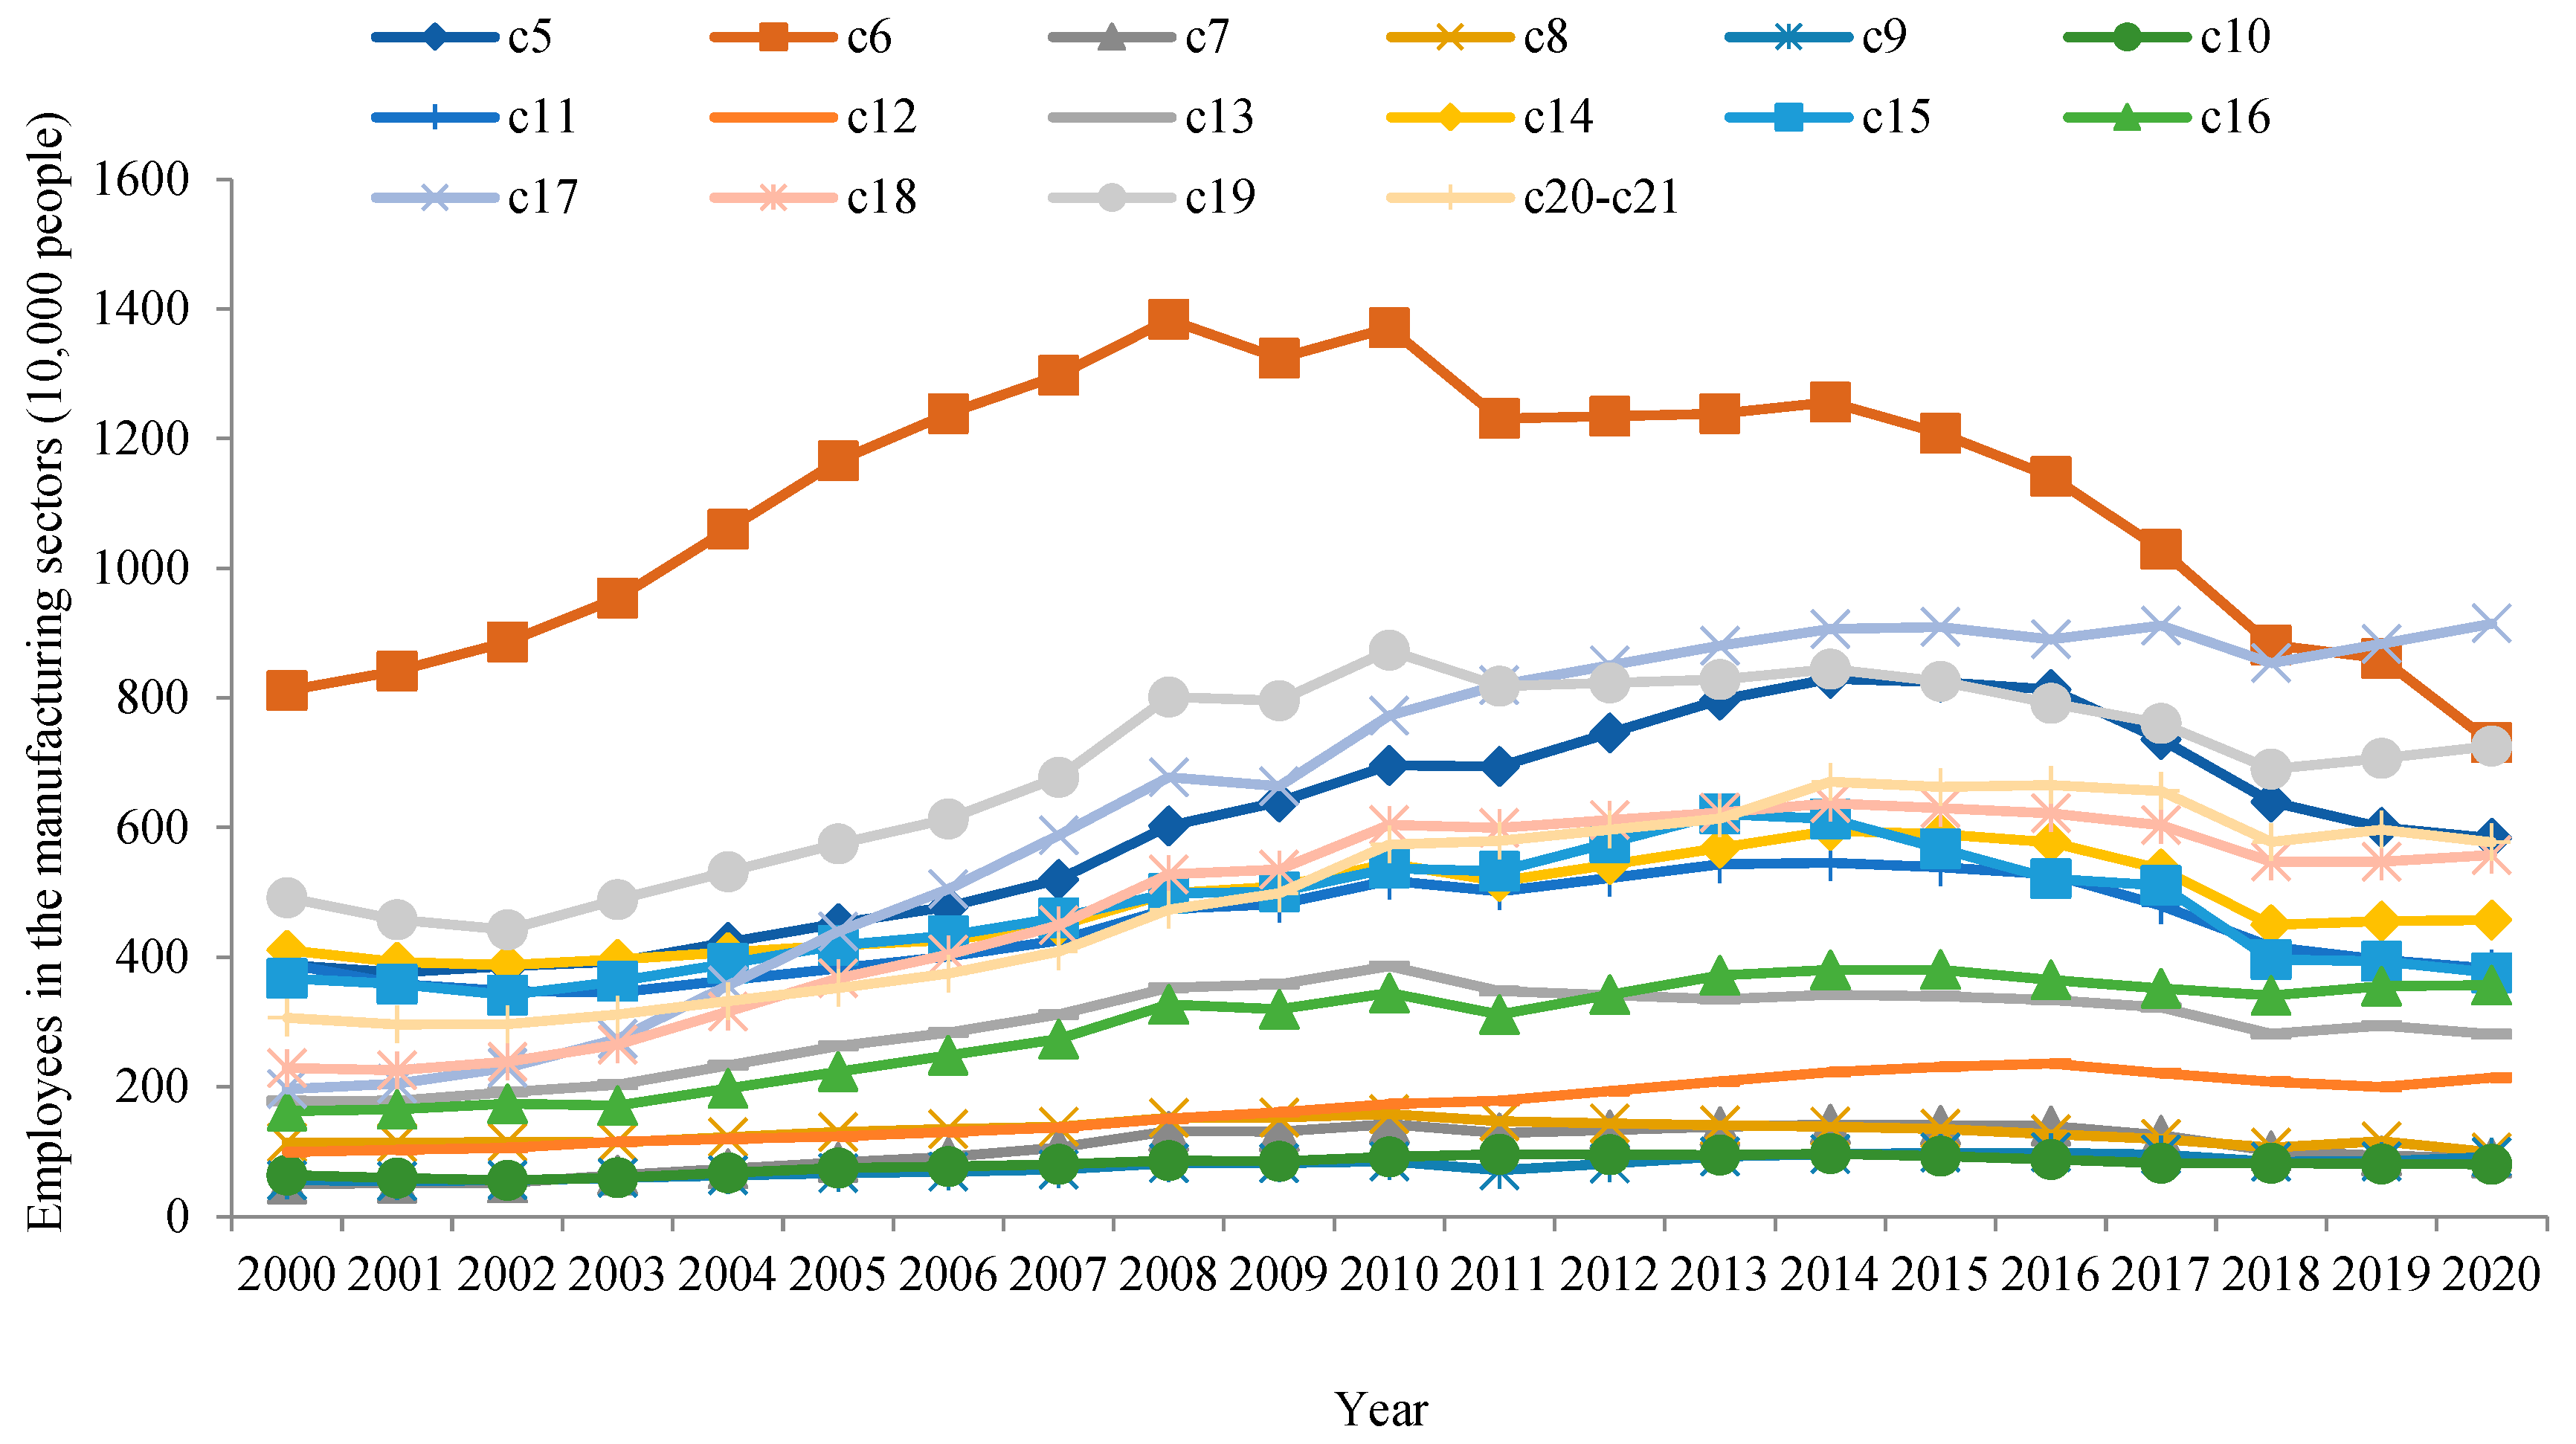
4.1. Overview of China’s Manufacturing Sectors
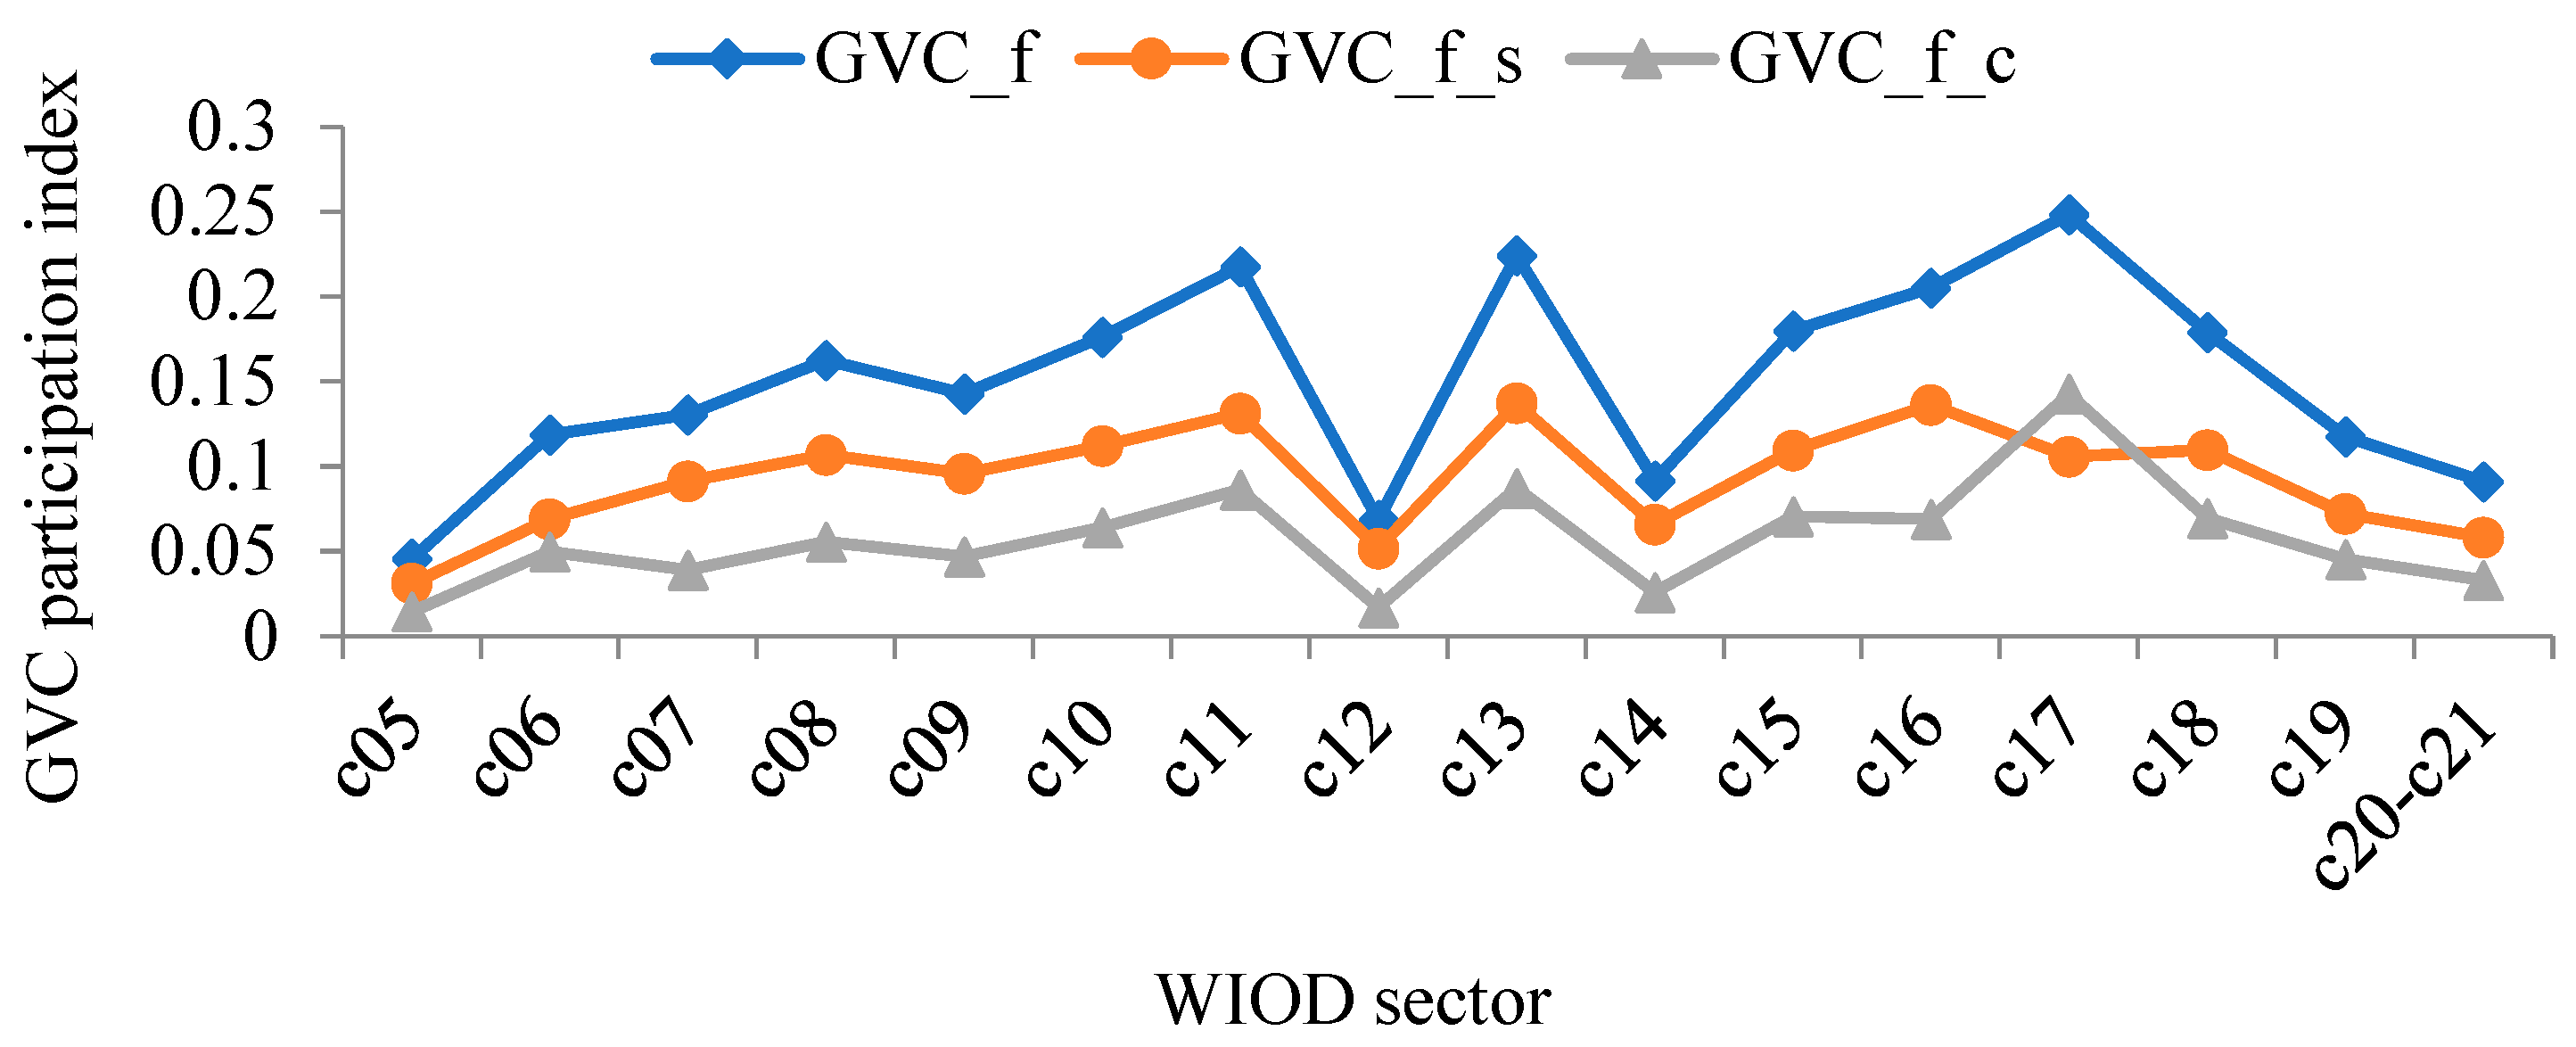
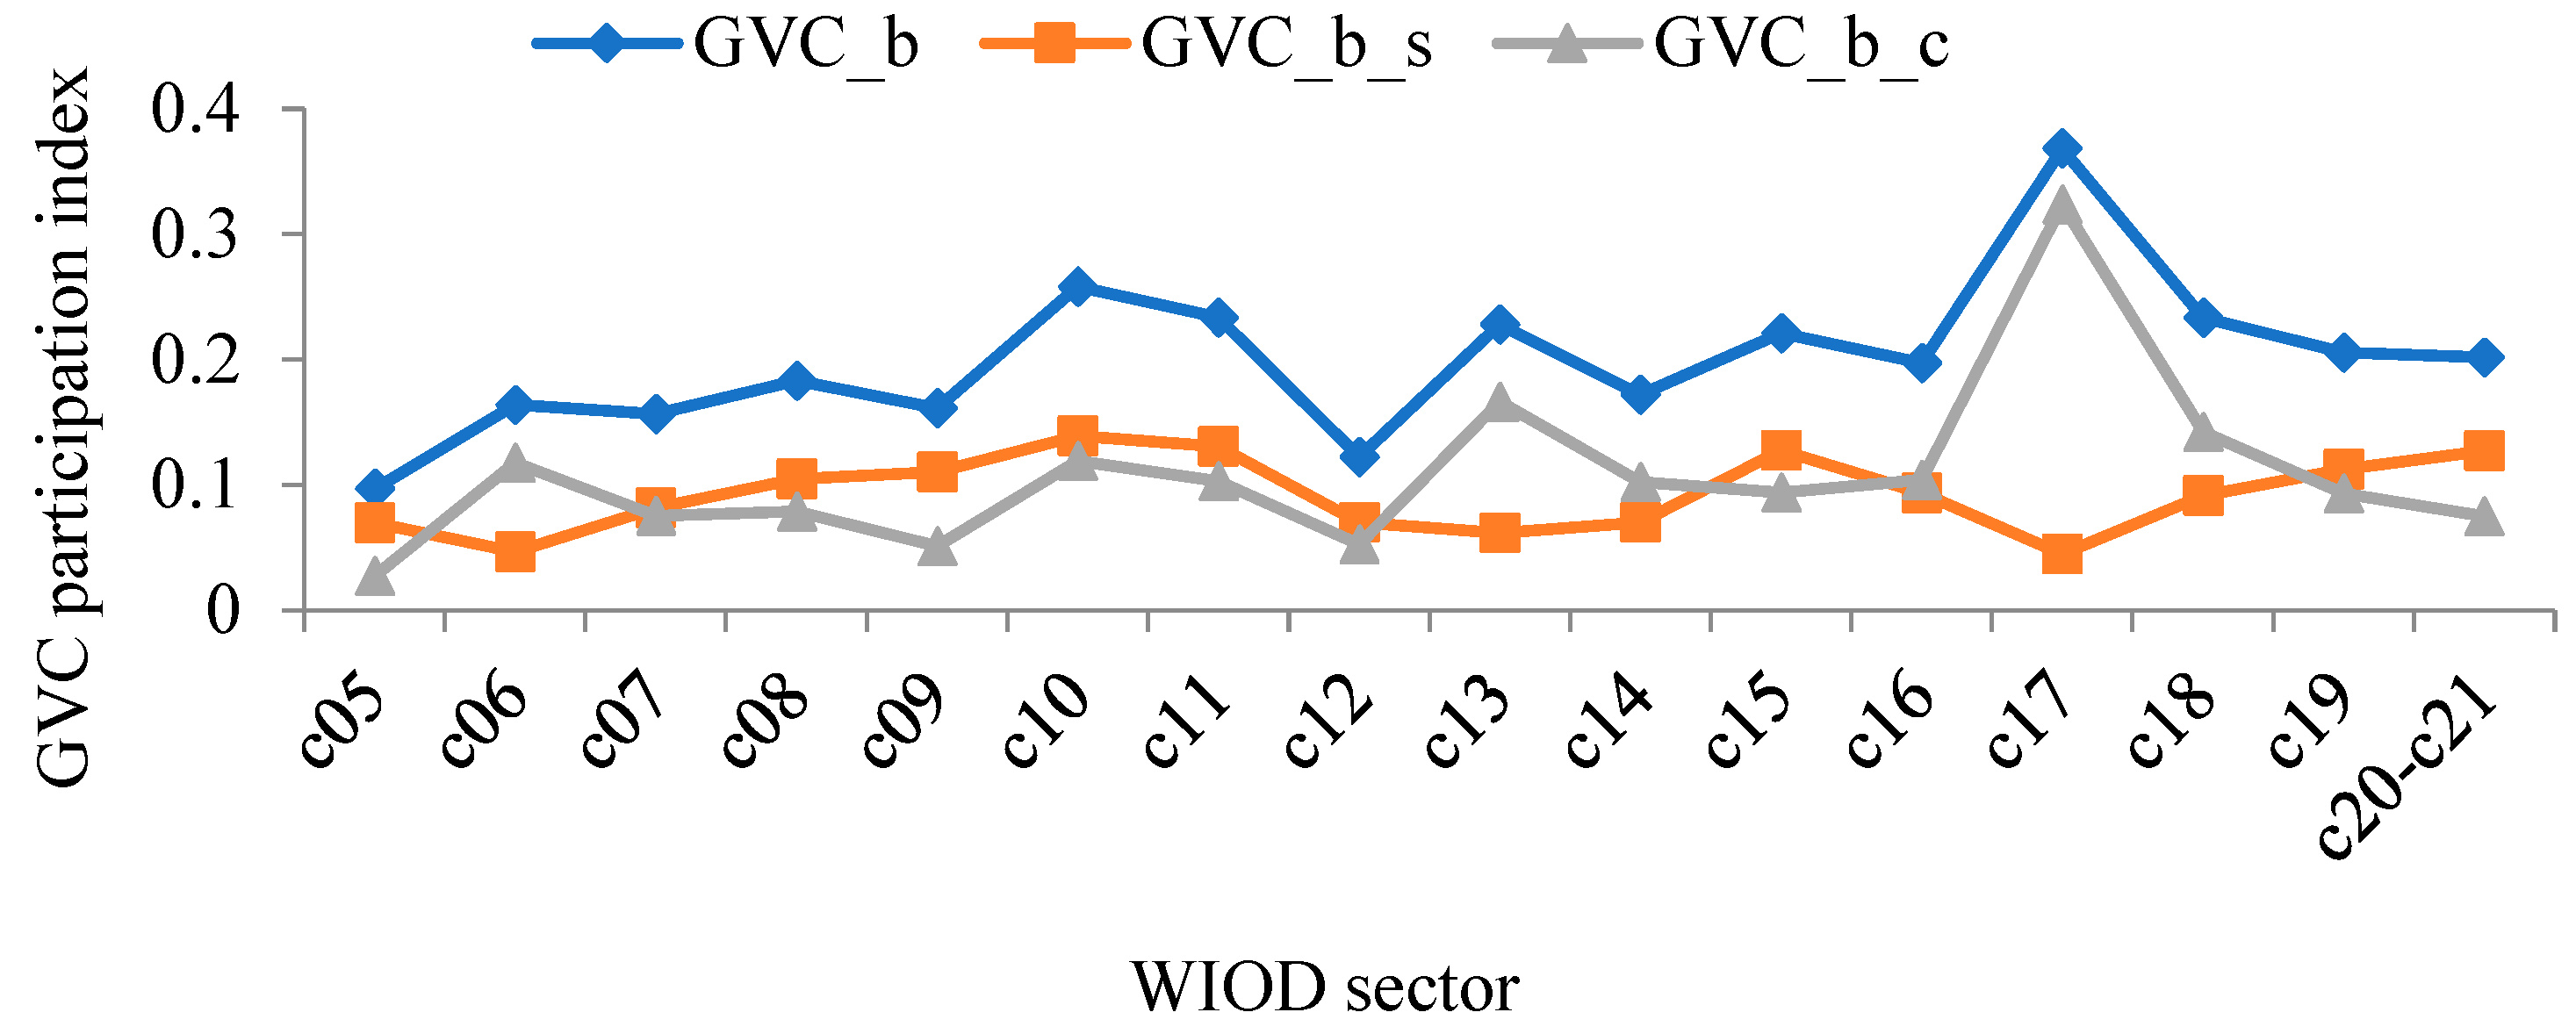
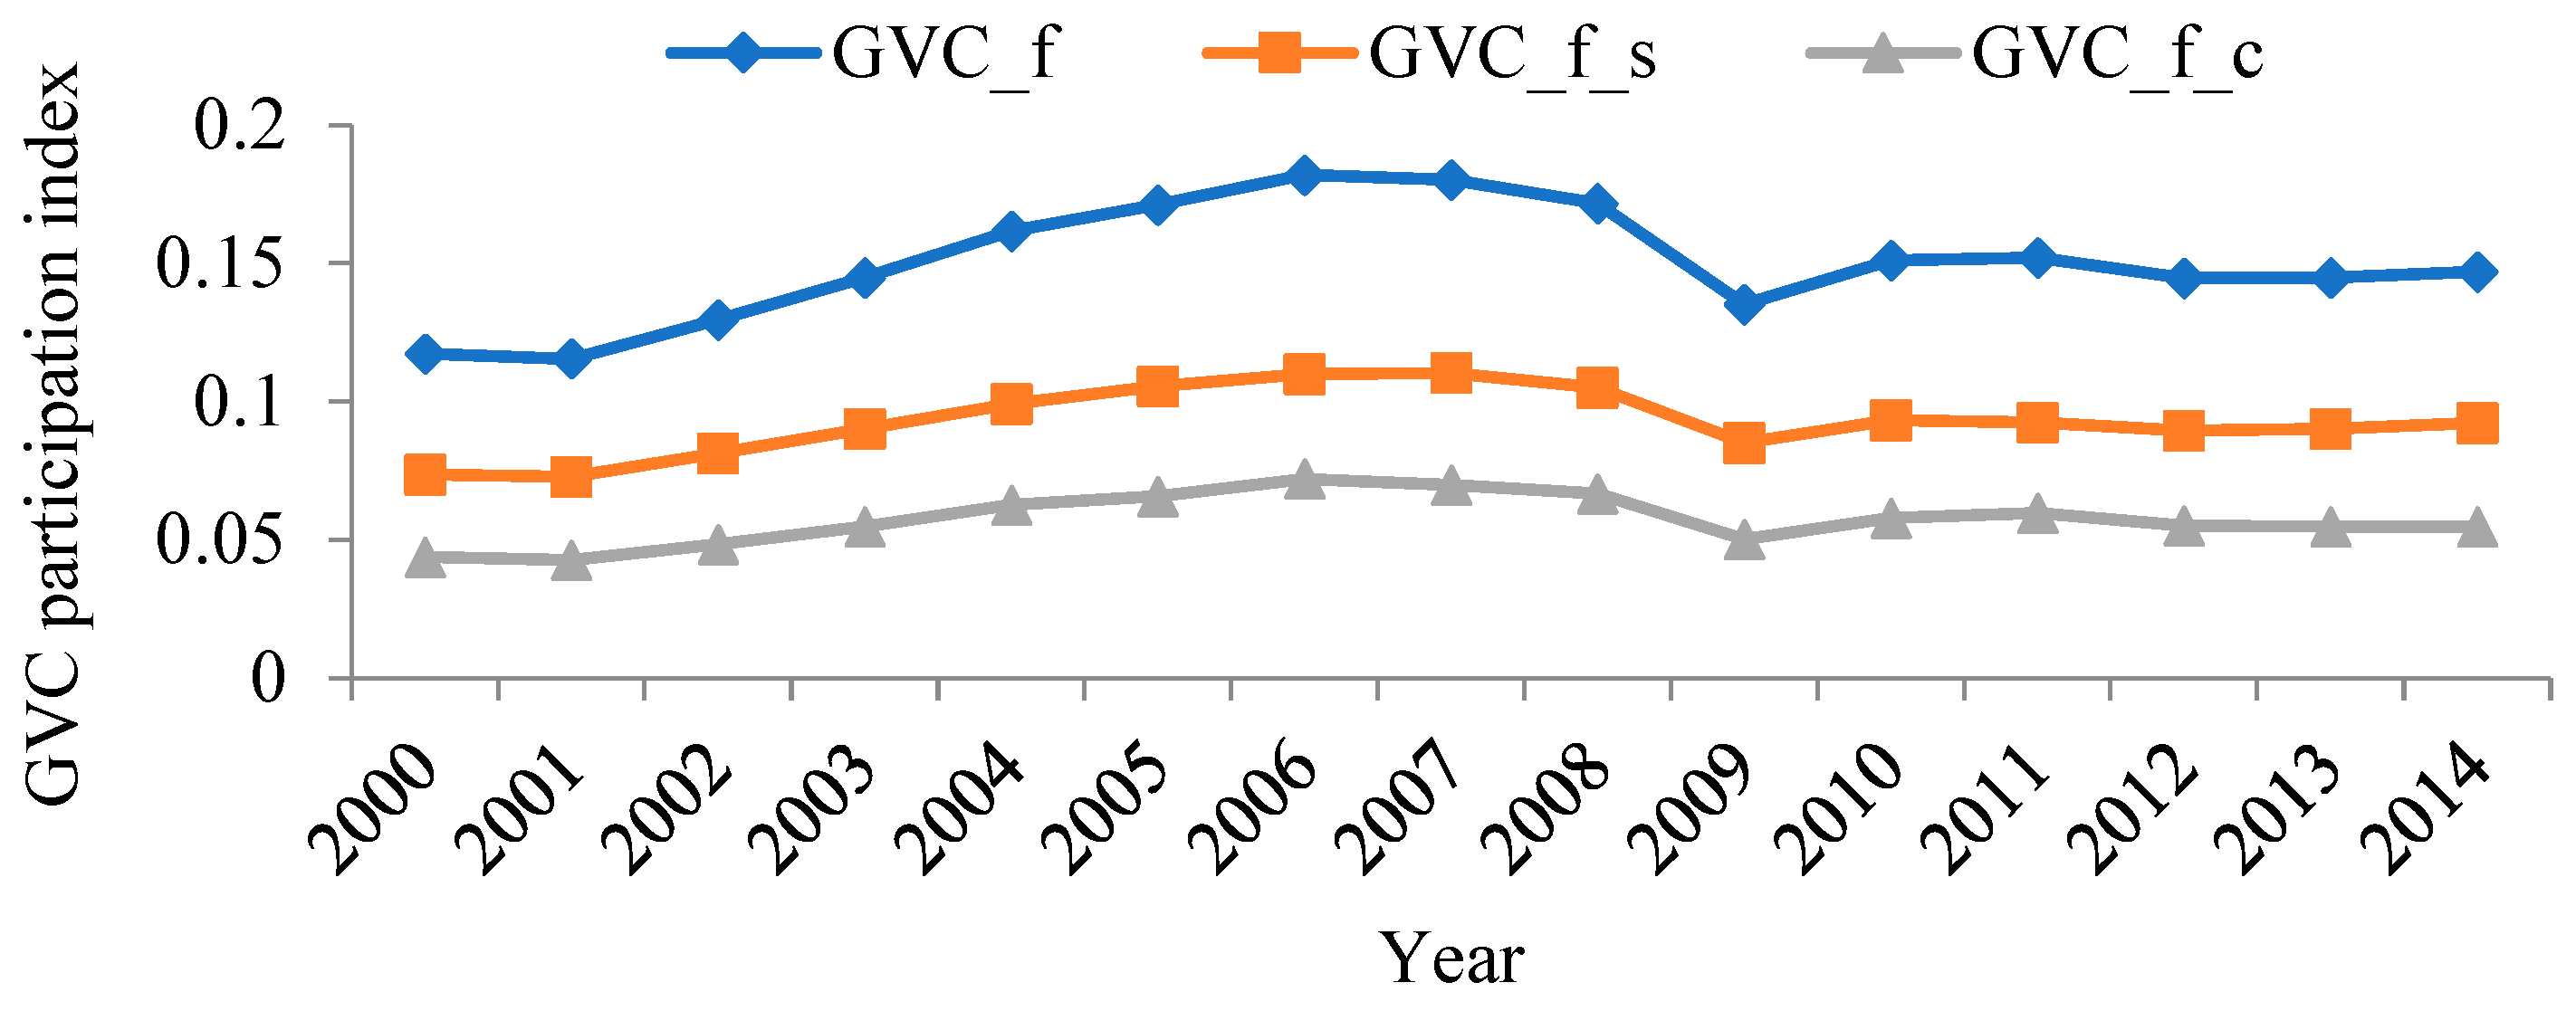
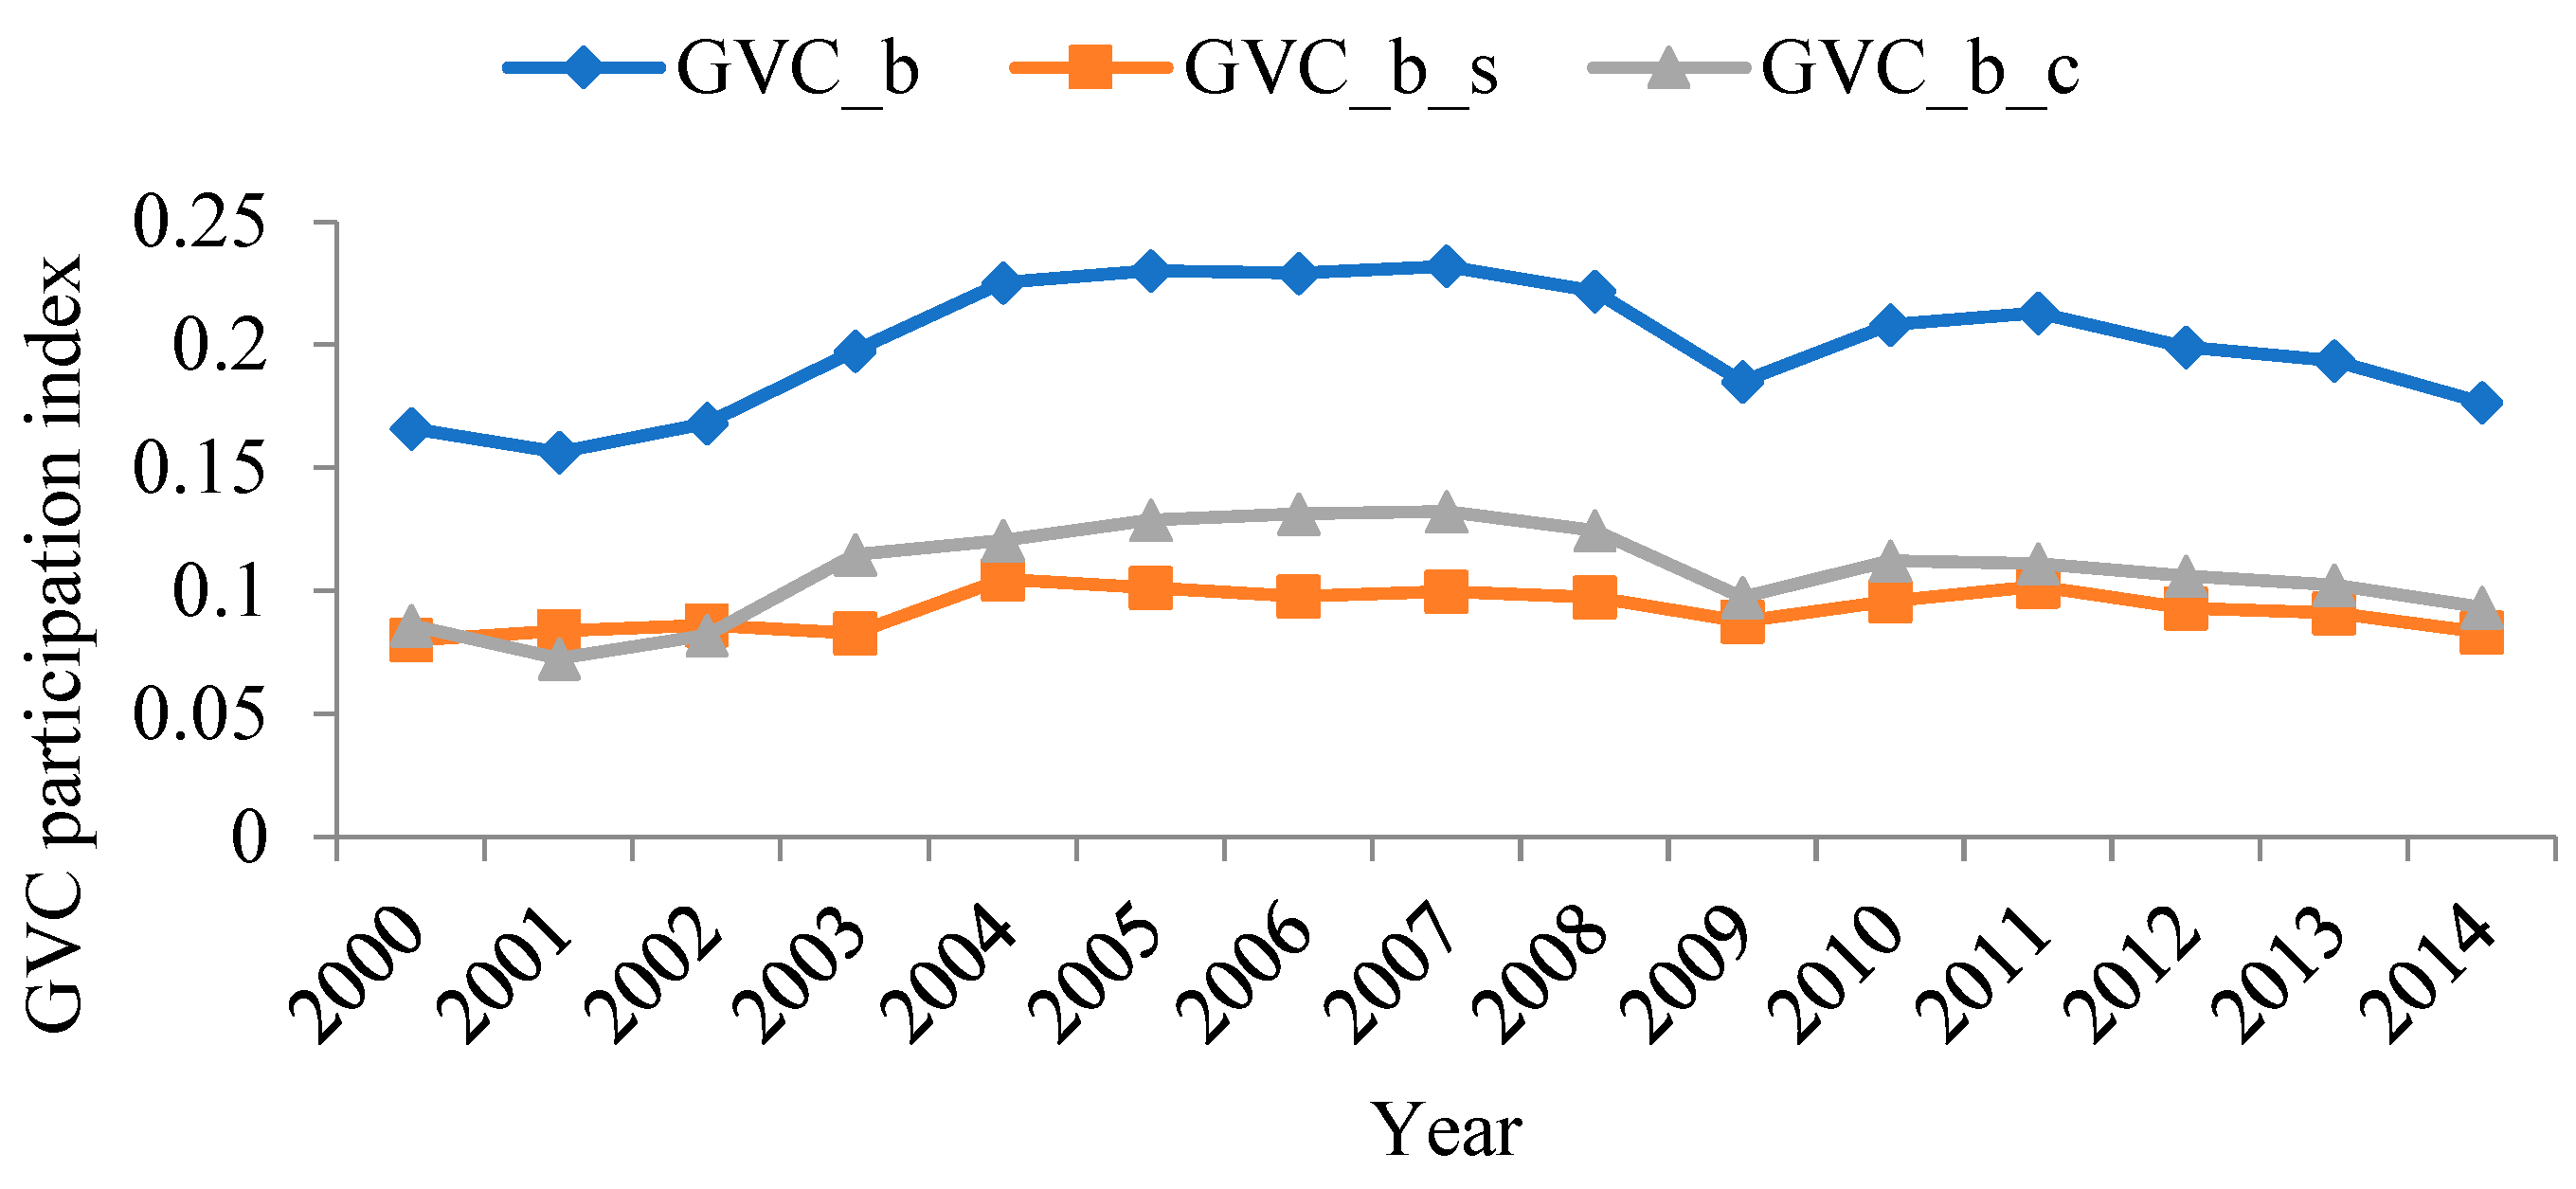
4.2. Calculation Results of GVC Participation of China’s Manufacturing Sectors
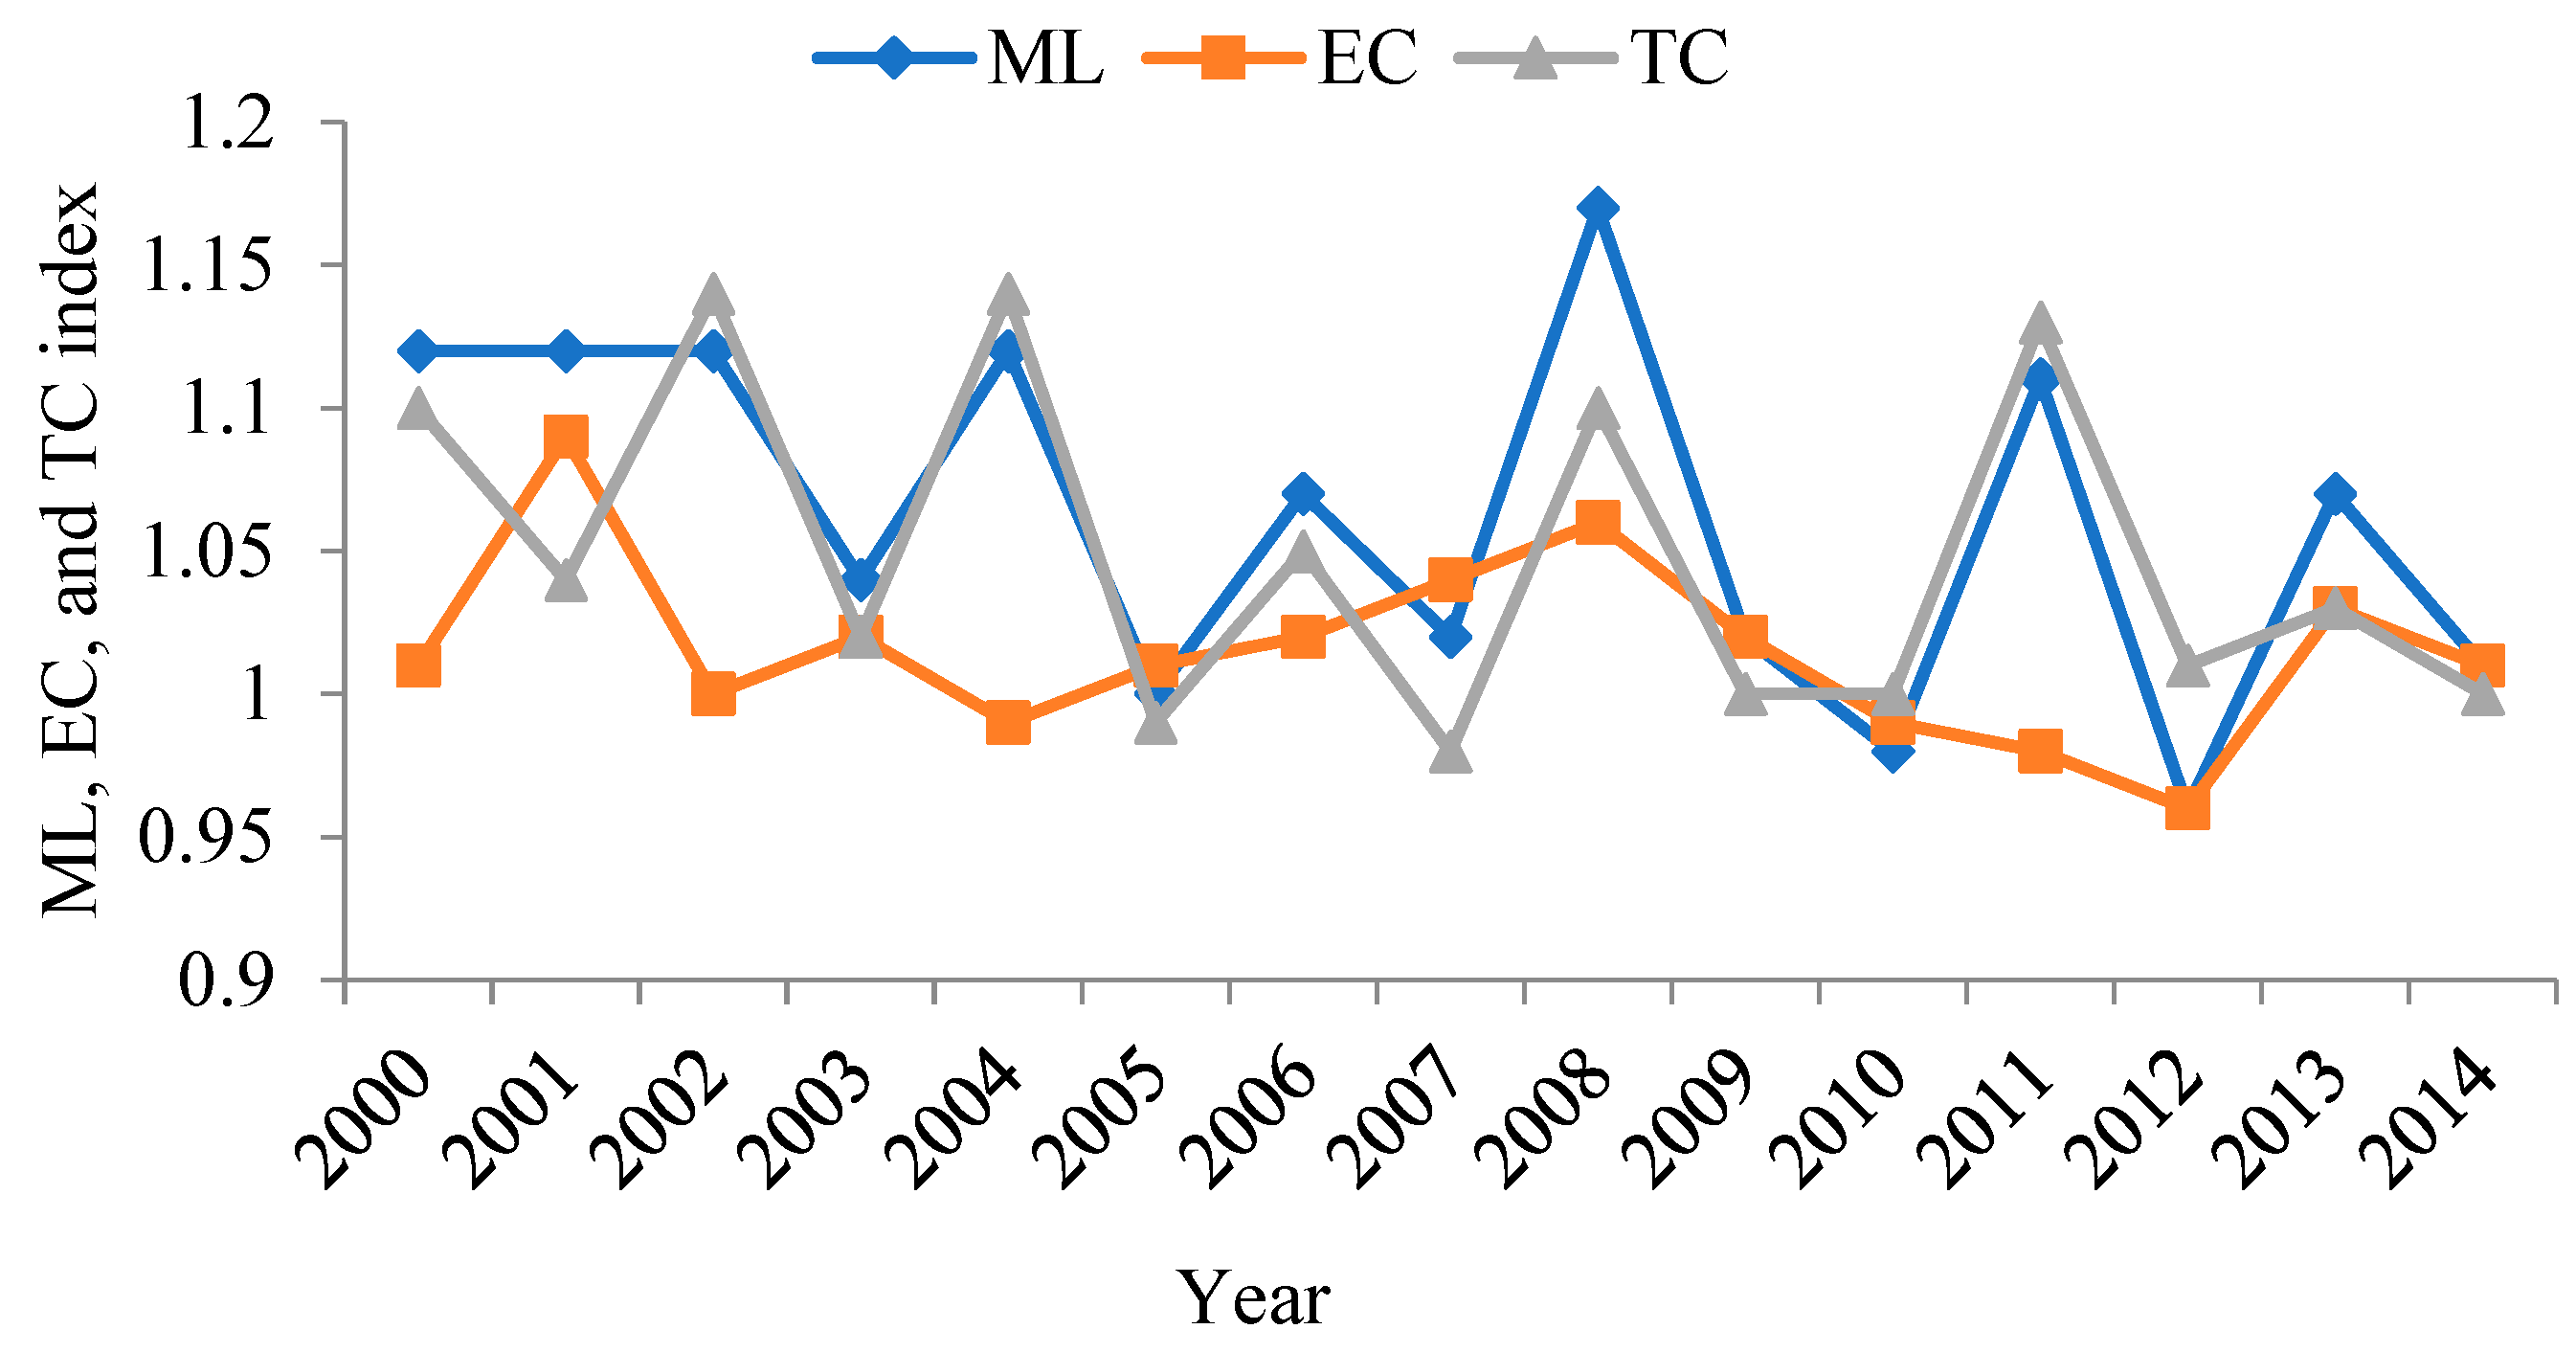
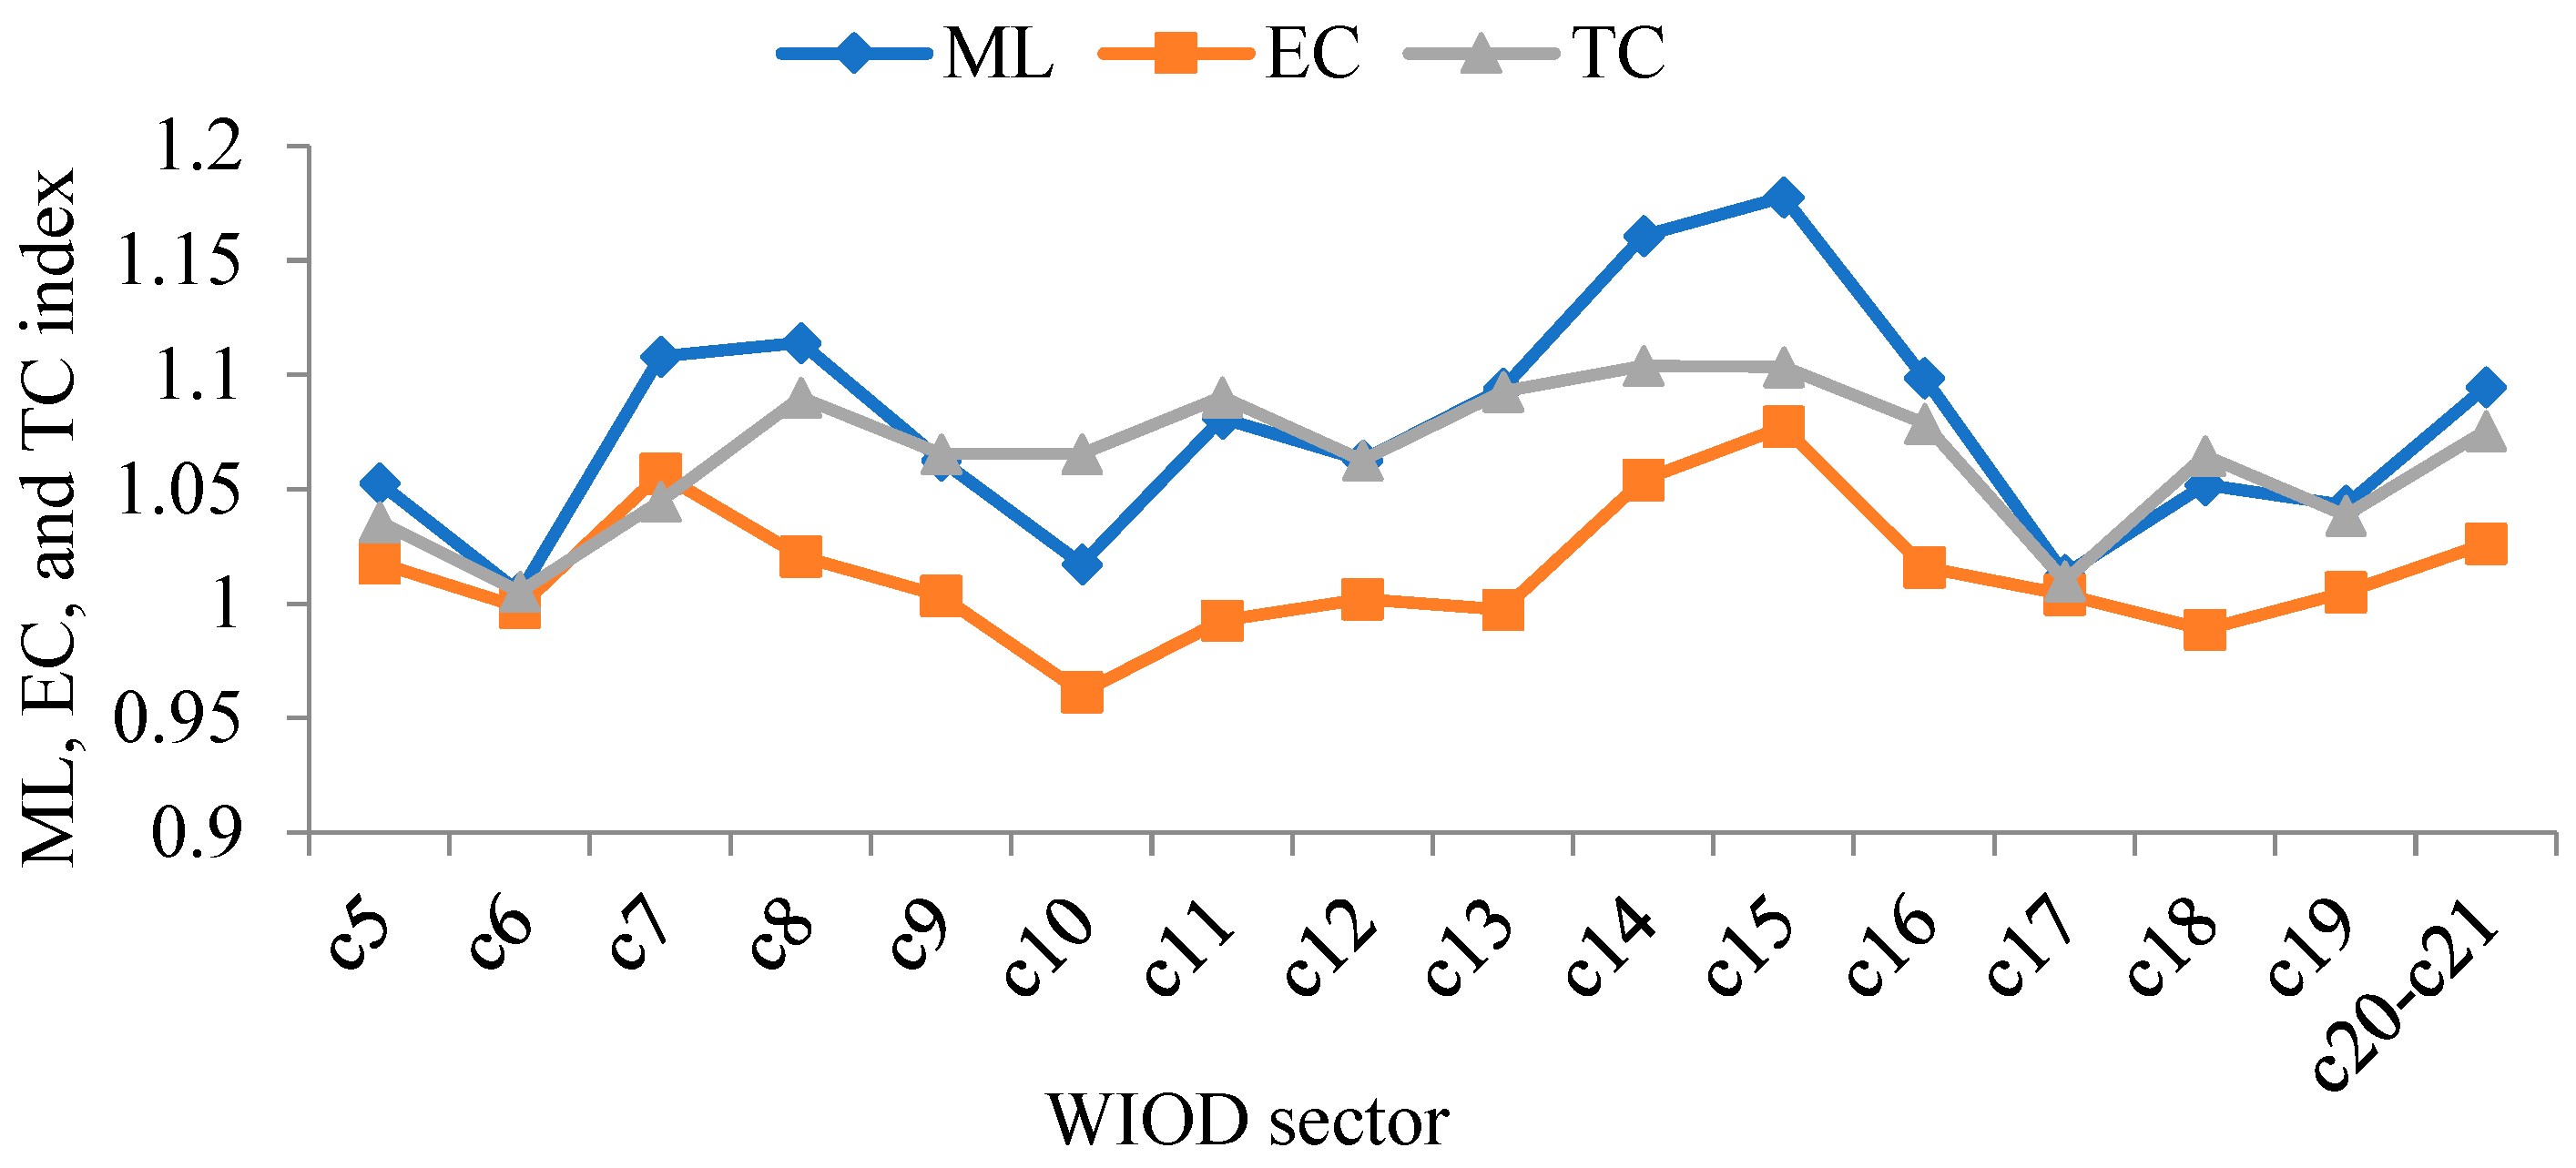
4.3. Calculation Results of Green Upgrade of China’s Manufacturing Sectors
5. Empirical Results
5.1. Baseline Regression Results and Analyses
5.2. Robustness Analysis
5.3. Mechanism Analyses
6. Conclusions
7. Policy Recommendations
Author Contributions
Funding
Institutional Review Board Statement
Informed Consent Statement
Data Availability Statement
Acknowledgments
Conflicts of Interest
References
- Wang, Z.; Wei, S.-J.; Yu, X.; Zhu, K. Measures of Participation in Global Value Chains and Global Business Cycles; National Bureau of Economic Research: Cambridge, CA, USA, 2017. [Google Scholar]
- Hummels, D.; Ishii, J.; Yi, K.-M. The nature and growth of vertical specialization in world trade. J. Int. Econ. 2001, 54, 75–96. [Google Scholar] [CrossRef]
- Johnson, R.C.; Noguera, G. Accounting for intermediates: Production sharing and trade in value added. J. Int. Econ. 2012, 86, 224–236. [Google Scholar] [CrossRef]
- Koopman, R.; Wang, Z.; Wei, S.-J. Tracing value-added and double counting in gross exports. Am. Econ. Rev. 2014, 104, 459–494. [Google Scholar] [CrossRef]
- Kee, H.L.; Tang, H. Domestic value added in exports: Theory and firm evidence from China. Am. Econ. Rev. 2016, 106, 1402–1436. [Google Scholar] [CrossRef]
- Tian, K.; Dietzenbacher, E.; Jong-A-Pin, R. Global value chain participation and its impact on industrial upgrading. World Econ. 2022, 45, 1362–1385. [Google Scholar] [CrossRef]
- Pleticha, P. Who benefits from global value chain participation? Does functional specialization matter? Struct. Chang. Econ. Dyn. 2021, 58, 291–299. [Google Scholar] [CrossRef]
- Chung, Y.H.; Färe, R.; Grosskopf, S. Productivity and undesirable outputs: A directional distance function approach. J. Environ. Manag. 1997, 51, 229–240. [Google Scholar] [CrossRef]
- Zofío, J.L.; Prieto, A.M. Environmental efficiency and regulatory standards: The case of CO2 emissions from OECD industries. Resour. Energy Econ. 2001, 23, 63–83. [Google Scholar] [CrossRef]
- Fan, M.; Shao, S.; Yang, L. Combining global Malmquist–Luenberger index and generalized method of moments to investigate industrial total factor CO2 emission performance: A case of Shanghai (China). Energy Policy 2015, 79, 189–201. [Google Scholar] [CrossRef]
- Jin, G.; Shen, K.; Li, J. Interjurisdiction political competition and green total factor productivity in China: An inverted-U relationship. China Econ. Rev. 2020, 61, 101224. [Google Scholar] [CrossRef]
- Mukherjee, K. Energy use efficiency in US manufacturing: A nonparametric analysis. Energy Economics 2008, 30, 76–96. [Google Scholar] [CrossRef]
- Li, Y.; Wu, Y.; Chen, Y.; Huang, Q. The influence of foreign direct investment and trade opening on green total factor productivity in the equipment manufacturing industry. Appl. Econ. 2021, 53, 6641–6654. [Google Scholar] [CrossRef]
- Qiu, W.; Zhang, J.; Wu, H.; Irfan, M.; Ahmad, M. The role of innovation investment and institutional quality on green total factor productivity: Evidence from 46 countries along the “Belt and Road”. Environ. Sci. Pollut. Res. 2022, 29, 16597–16611. [Google Scholar] [CrossRef] [PubMed]
- Liu, Y.; Yang, Y.; Li, H.; Zhong, K. Digital economy development, industrial structure upgrading and green total factor productivity: Empirical evidence from China’s cities. Int. J. Environ. Res. Public Health 2022, 19, 2414. [Google Scholar] [CrossRef]
- Zhao, M.; Liu, F.; Sun, W.; Tao, X. The relationship between environmental regulation and green total factor productivity in China: An empirical study based on the panel data of 177 cities. Int. J. Environ. Res. Public Health 2020, 17, 5287. [Google Scholar] [CrossRef]
- Song, Y.; Hao, F.; Hao, X.; Gozgor, G. Economic policy uncertainty, outward foreign direct investments, and green total factor productivity: Evidence from firm-level data in China. Sustainability 2021, 13, 2339. [Google Scholar] [CrossRef]
- Huang, Q.; Liu, M. Trade openness and green total factor productivity: Testing the role of environment regulation based on dynamic panel threshold model. Environ. Dev. Sustain. 2022, 24, 9304–9329. [Google Scholar] [CrossRef]
- Cole, M.A. Trade, the pollution haven hypothesis and the environmental Kuznets curve: Examining the linkages. Ecol. Econ. 2004, 48, 71–81. [Google Scholar] [CrossRef]
- López, L.A.; Arce, G.; Kronenberg, T.; Rodrigues, J.F. Trade from resource-rich countries avoids the existence of a global pollution haven hypothesis. J. Clean. Prod. 2018, 175, 599–611. [Google Scholar] [CrossRef]
- Cohen, G.; Jalles, J.T.; Loungani, P.; Marto, R.; Wang, G. Decoupling of emissions and GDP: Evidence from aggregate and provincial Chinese data. Energy Econ. 2019, 77, 105–118. [Google Scholar] [CrossRef] [Green Version]
- Liu, H.; Li, J.; Long, H.; Li, Z.; Le, C. Promoting energy and environmental efficiency within a positive feedback loop: Insights from global value chain. Energy Policy 2018, 121, 175–184. [Google Scholar] [CrossRef]
- Li, J.; Lin, B. Does energy and CO2 emissions performance of China benefit from regional integration? Energy Policy 2017, 101, 366–378. [Google Scholar] [CrossRef] [PubMed]
- Qu, C.; Shao, J.; Cheng, Z. Can embedding in global value chain drive green growth in China’s manufacturing industry? J. Clean. Prod. 2020, 268, 121962. [Google Scholar] [CrossRef]
- Hu, D.; Jiao, J.; Tang, Y.; Han, X.; Sun, H. The effect of global value chain position on green technology innovation efficiency: From the perspective of environmental regulation. Ecol. Indic. 2021, 121, 107195. [Google Scholar] [CrossRef]
- Liu, H.; Zong, Z.; Hynes, K.; De Bruyne, K. Can China reduce the carbon emissions of its manufacturing exports by moving up the global value chain? Res. Int. Bus. Financ. 2020, 51, 101101. [Google Scholar] [CrossRef]
- Meng, F.; Zhao, Y. How does digital economy affect green total factor productivity at the industry level in China: From a perspective of global value chain. Environ. Sci. Pollut. Res. 2022. [Google Scholar] [CrossRef] [PubMed]
- Tone, K.; Tsutsui, M. An epsilon-based measure of efficiency in DEA–a third pole of technical efficiency. Eur. J. Oper. Res. 2010, 207, 1554–1563. [Google Scholar] [CrossRef]
- Christensen, L.R.; Jorgenson, D.W. The measurement of US real capital input, 1929–1967. Rev. Income Wealth 1969, 15, 293–320. [Google Scholar] [CrossRef]
- Liu, Y.; Zhao, G.; Zhao, Y. An analysis of Chinese provincial carbon dioxide emission efficiencies based on energy consumption structure. Energy Policy 2016, 96, 524–533. [Google Scholar] [CrossRef]
- Yu, S.; Zheng, S.; Li, X. The achievement of the carbon emissions peak in China: The role of energy consumption structure optimization. Energy Econ. 2018, 74, 693–707. [Google Scholar] [CrossRef]
- Walter, I.; Ugelow, J.L. Environmental policies in developing countries. Ambio 1979, 8, 102–109. [Google Scholar]
- Swarnali, A.; Maximiliano, A.; Ruta, M. Depreciations without Exports? Global Value Chains and the Exchange Rate Elasticity of Exports; Policy Research Working Paper; World Bank Group: Washington, DC, USA, 2015. [Google Scholar]

| WIOD Code (2016 Version) | WIOD Sector Description |
|---|---|
| c05 | Manufacture of food products, beverages, and tobacco products |
| c06 | Manufacture of textiles, clothing apparel, and leather products |
| c07 | Manufacture of wood and products of wood and cork, except furniture; manufacture of articles of straw and plaiting materials |
| c08 | Manufacture of paper and paper products |
| c09 | Printing and reproduction of recorded media |
| c10 | Manufacture of coke and refined petroleum products |
| c11 | Manufacture of chemicals and chemical products |
| c12 | Manufacture of basic pharmaceutical products and pharmaceutical preparations |
| c13 | Manufacture of rubber and plastic products |
| c14 | Manufacture of other non-metallic mineral products |
| c15 | Manufacture of basic metals |
| c16 | Manufacture of fabricated metal products, except machinery and equipment |
| c17 | Manufacture of computer, electronic, and optical products |
| c18 | Manufacture of electrical equipment |
| c19 | Manufacture of machinery and equipment not elsewhere classified |
| c20-c21 | Manufacture of motor vehicles, trailers, semi-trailers, and other transport equipment |
| Variables | GTFP_ML | |||||
|---|---|---|---|---|---|---|
| (1) | (2) | (3) | (4) | (5) | (6) | |
| GVC_f | 0.32 ** (0.13) | |||||
| GVC_f | 0.36 *** (0.14) | |||||
| GVC_f_s | 0.15 (0.03) | |||||
| GVC_f_s | 0.17 (0.07) | |||||
| GVC_f_c | 0.77 *** (0.13) | |||||
| GVC_f_c | 0.83 *** (0.15) | |||||
| ES | −2.78 ** (0.18) | −2.13 * (0.09) | −2.79 ** (0.18) | |||
| EE | 0.02 * (0.01) | 0.01 * (0.01) | 0.01 * (0.01) | |||
| OS | −0.01 (0.02) | 0.02 (0.03) | 0.01 (0.01) | |||
| FDI | −1.13 *** (0.54) | −1.21 *** (0.62) | −1.17 ** (0.56) | |||
| Constant | 0.95 * (0.07) | 0.91 ** (0.07) | 0.86 * (0.07) | 0.81 * (0.06) | 0.22 ** (0.05) | 0.31 ** (0.06) |
| Industry Fixed Effect | Yes | Yes | Yes | Yes | Yes | Yes |
| Year Fixed Effect | Yes | Yes | Yes | Yes | Yes | Yes |
| Variables | GTFP_ML | |||||
|---|---|---|---|---|---|---|
| (7) | (8) | (9) | (10) | (11) | (12) | |
| GVC_b | 0.27 ** (0.15) | |||||
| GVC_b | 0.30 *** (0.15) | |||||
| GVC_b_s | 0.07 (0.01) | |||||
| GVC_b_s | 0.11 (0.03) | |||||
| GVC_b_c | 0.61 *** (0.09) | |||||
| GVC_b_c | 0.72 *** (0.18) | |||||
| ES | −3.77 ** (0.17) | −4.18 ** (0.16) | −3.62 ** (0.16) | |||
| EE | 0.04 * (0.02) | 0.02 * (0.01) | 0.01 * (0.01) | |||
| OS | 0.03 (0.02) | 0.02 (0.01) | 0.02 (0.01) | |||
| FDI | −1.22 *** (0.68) | −1.19 *** (0.51) | −1.34 *** (0.64) | |||
| Constant | 0.57 ** (0.04) | 0.49 ** (0.01) | 0.66 ** (0.04) | 0.73 ** (0.01) | 0.15 (0.01) | 0.38 (0.01) |
| Industry Fixed Effect | Yes | Yes | Yes | Yes | Yes | Yes |
| Year Fixed Effect | Yes | Yes | Yes | Yes | Yes | Yes |
| Variables | GTFP_ML | |
|---|---|---|
| (13) | (14) | |
| GVC_Koopman_f | 0.23 ** (0.17) | |
| GVC_Koopman _b | 0.25 ** (0.39) | |
| Control Variables | Yes | Yes |
| Industry Fixed Effect | Yes | Yes |
| Year Fixed Effect | Yes | Yes |
| Variables | GTFP_EC | GTFP_TC | ||
|---|---|---|---|---|
| (15) | (16) | (17) | (18) | |
| GVC_f | 0.02 (0.01) | 0.51 *** (0.08) | ||
| GVC_b | 0.11 (0.03) | 0.46 ** (0.05) | ||
| Control Variables | Yes | Yes | Yes | Yes |
| Industry Fixed Effect | Yes | Yes | Yes | Yes |
| Year Fixed Effect | Yes | Yes | Yes | Yes |
Publisher’s Note: MDPI stays neutral with regard to jurisdictional claims in published maps and institutional affiliations. |
© 2022 by the authors. Licensee MDPI, Basel, Switzerland. This article is an open access article distributed under the terms and conditions of the Creative Commons Attribution (CC BY) license (https://creativecommons.org/licenses/by/4.0/).
Share and Cite
Wang, S.; Wang, H. Can Global Value Chain Participation Drive Green Upgrade in China’s Manufacturing Industry? Int. J. Environ. Res. Public Health 2022, 19, 12013. https://doi.org/10.3390/ijerph191912013
Wang S, Wang H. Can Global Value Chain Participation Drive Green Upgrade in China’s Manufacturing Industry? International Journal of Environmental Research and Public Health. 2022; 19(19):12013. https://doi.org/10.3390/ijerph191912013
Chicago/Turabian StyleWang, Shi, and Hua Wang. 2022. "Can Global Value Chain Participation Drive Green Upgrade in China’s Manufacturing Industry?" International Journal of Environmental Research and Public Health 19, no. 19: 12013. https://doi.org/10.3390/ijerph191912013
APA StyleWang, S., & Wang, H. (2022). Can Global Value Chain Participation Drive Green Upgrade in China’s Manufacturing Industry? International Journal of Environmental Research and Public Health, 19(19), 12013. https://doi.org/10.3390/ijerph191912013