

Ankle Joint Dorsiflexion Reference Values in Non-Injured Youth Federated Basketball Players: A Cross-Sectional Study


Abstract
1. Introduction
2. Materials and Methods
2.1. Study Design
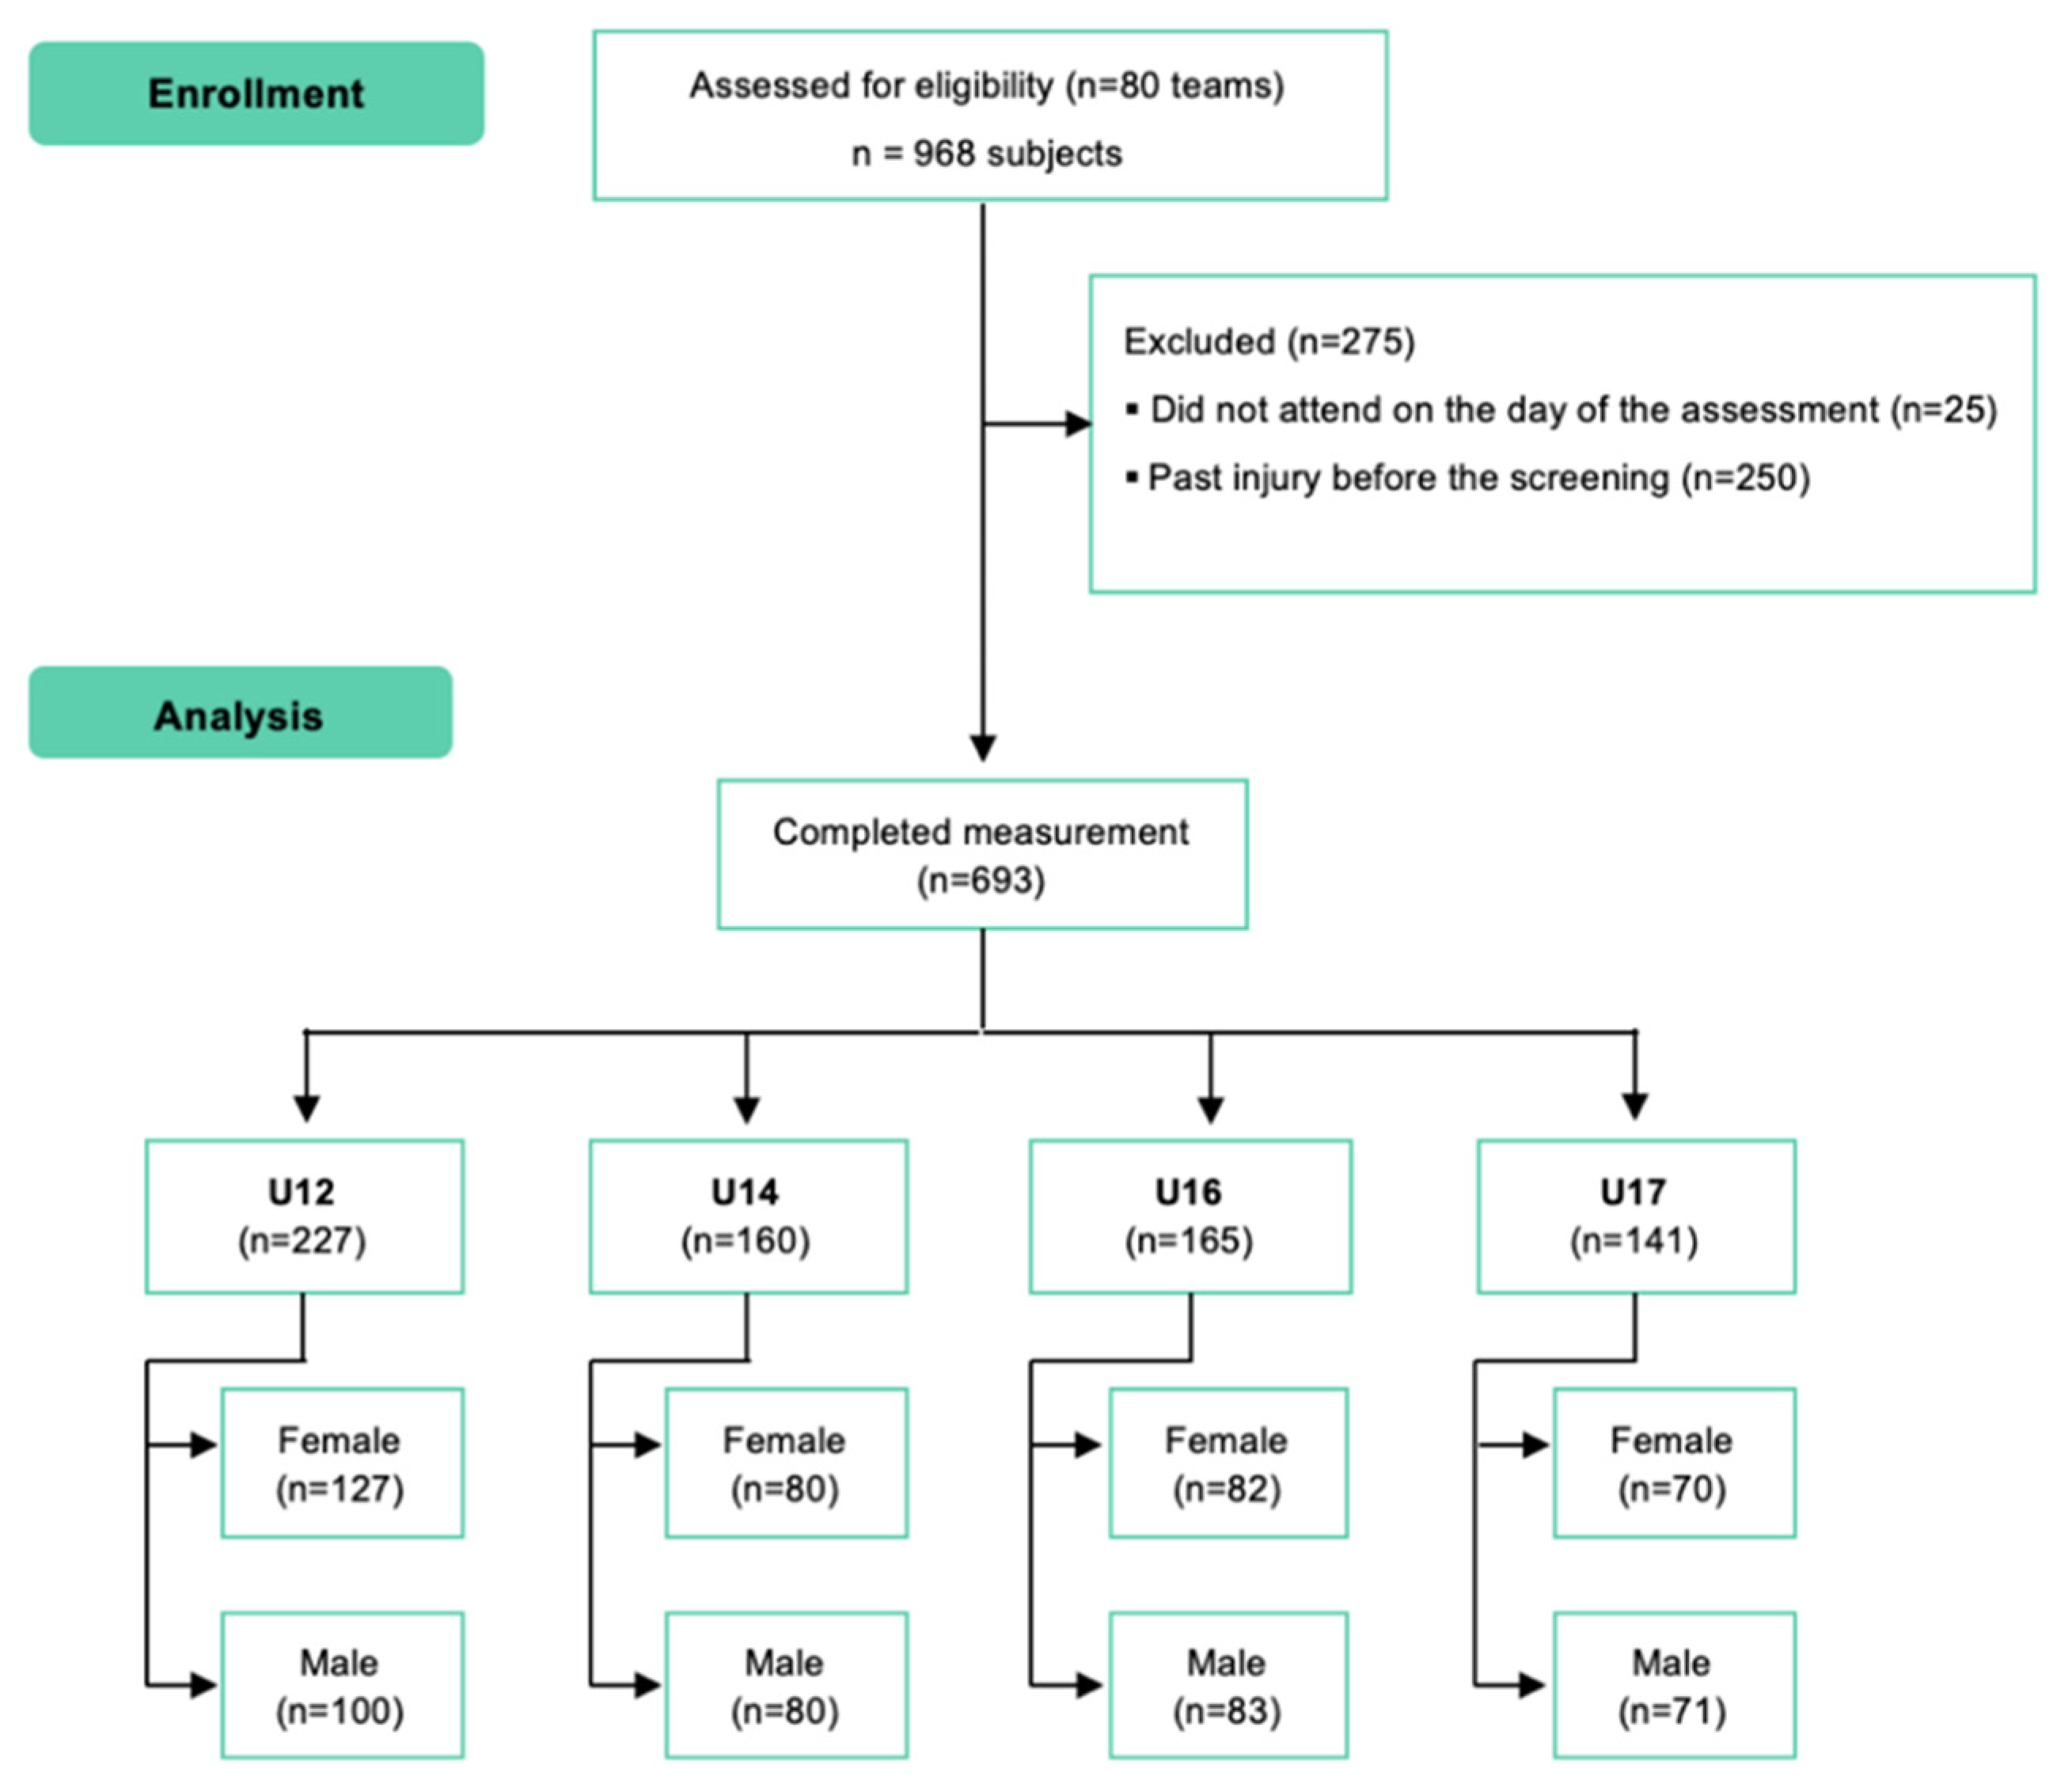
2.2. Participants
2.3. Outcomes
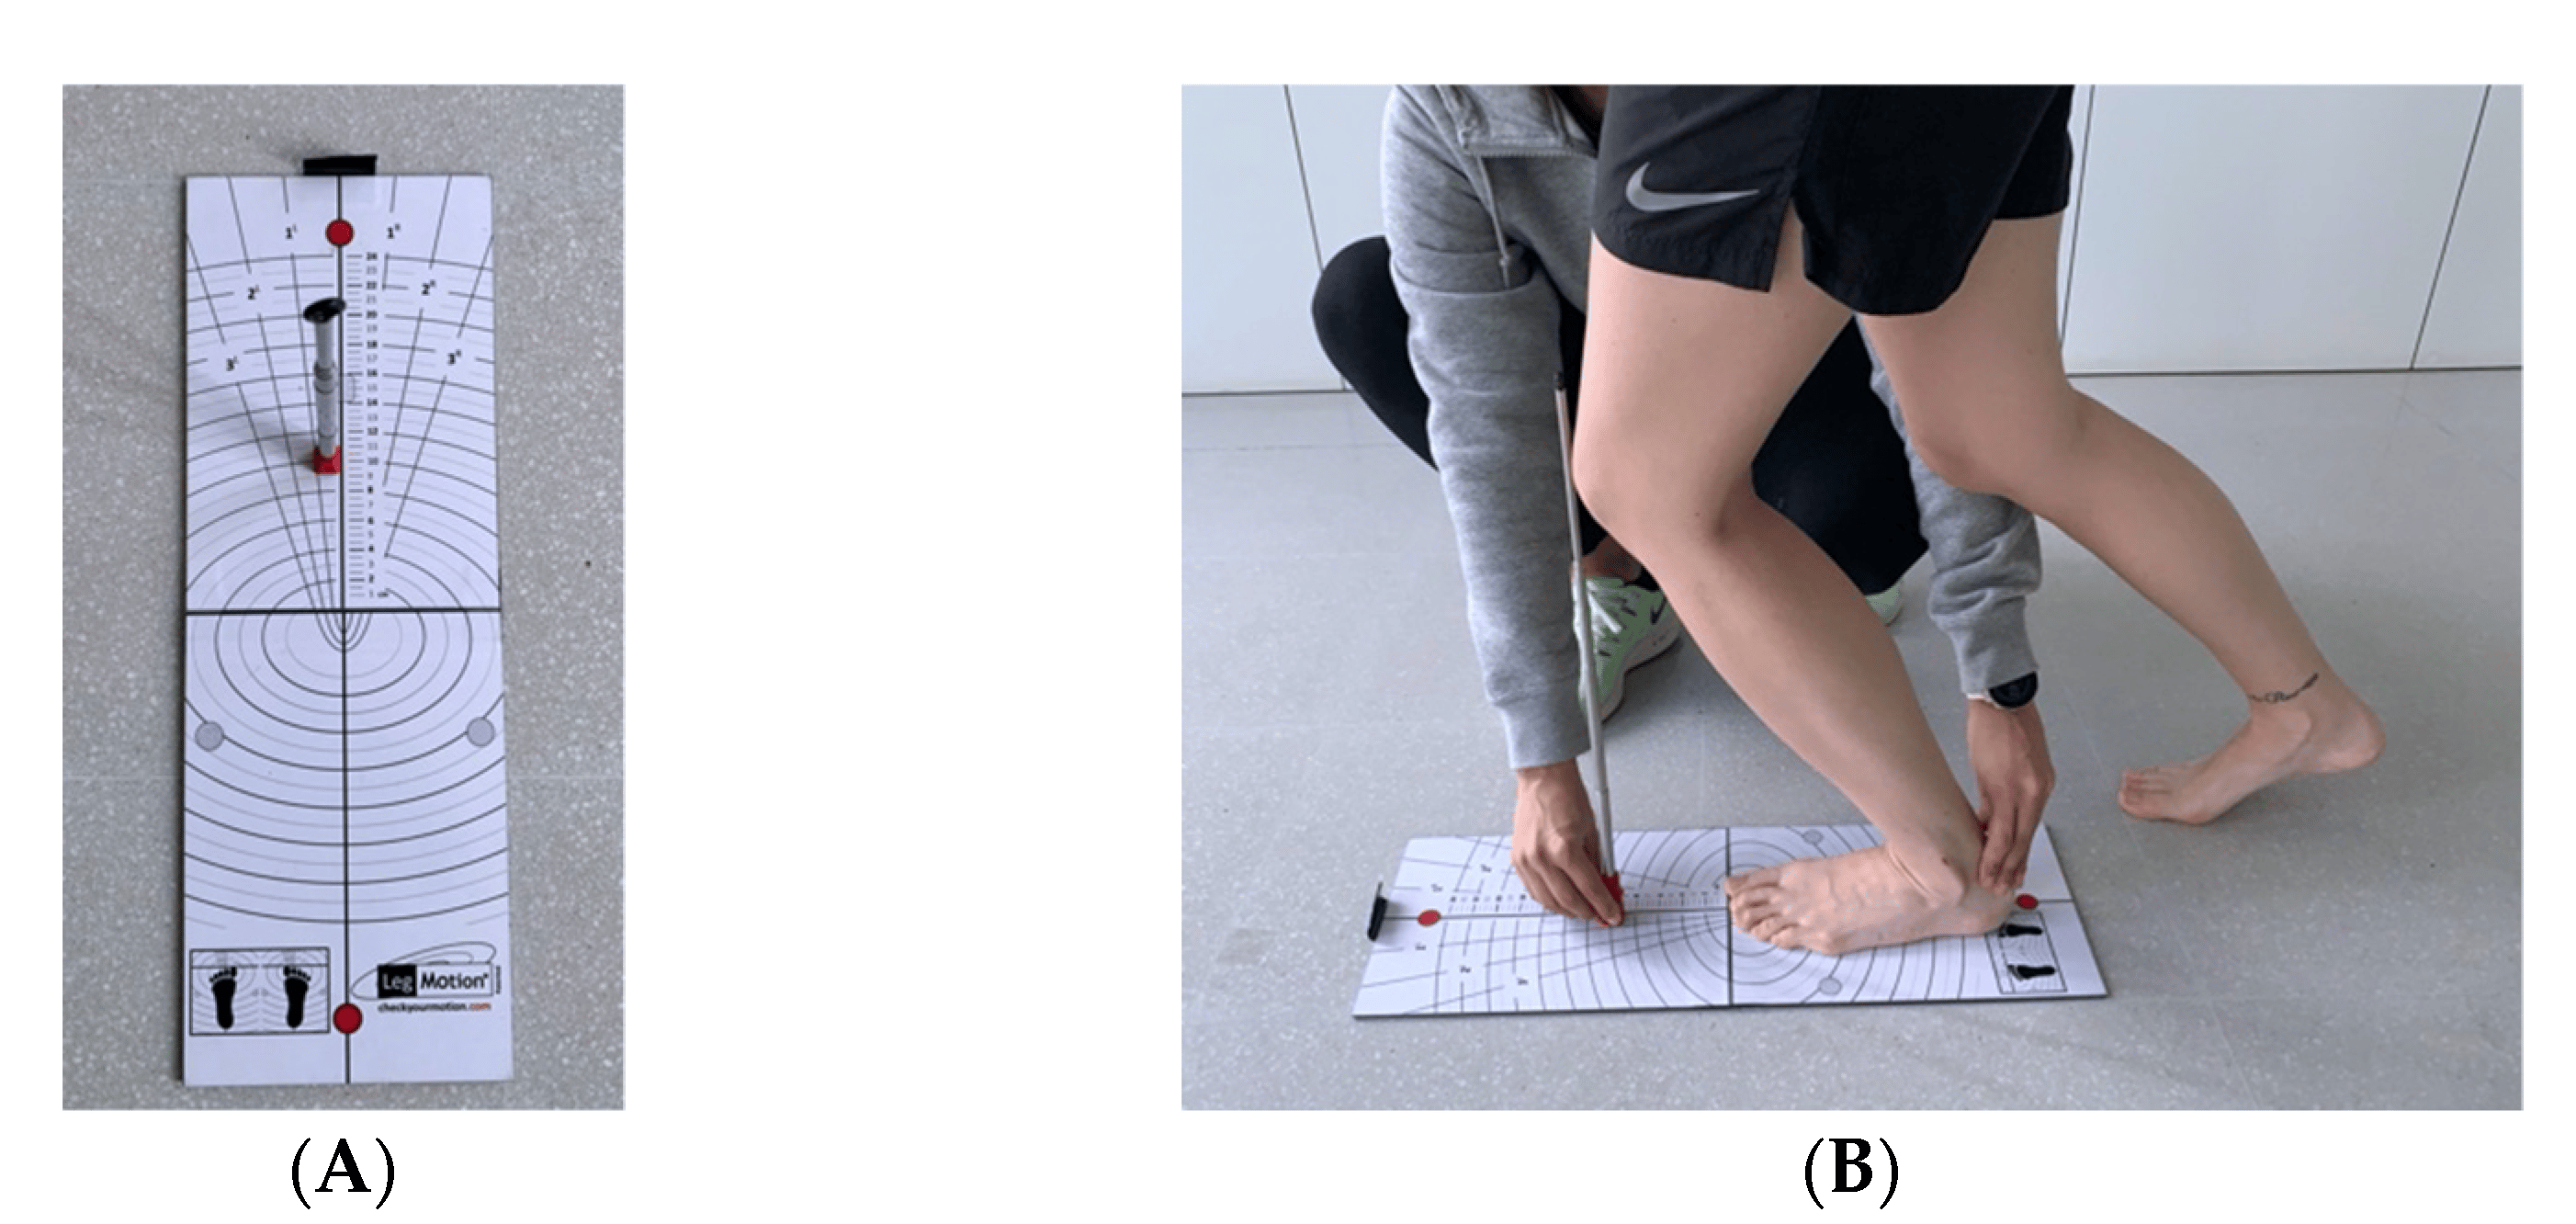
2.4. Data Sources and Procedure
2.5. Bias
2.6. Statistical Analysis
- Excessive Hypomobility: <−2 · SD;
- Hypomobility: −2 · SD < x < −1 · SD;
- Normal: −1 · SD < x < 1 · SD;
- Hypermobility: 1 · SD < x < 2 · SD;
- Excessive Hypermobility: >−2 · SD.
3. Results
3.1. Description of Sample
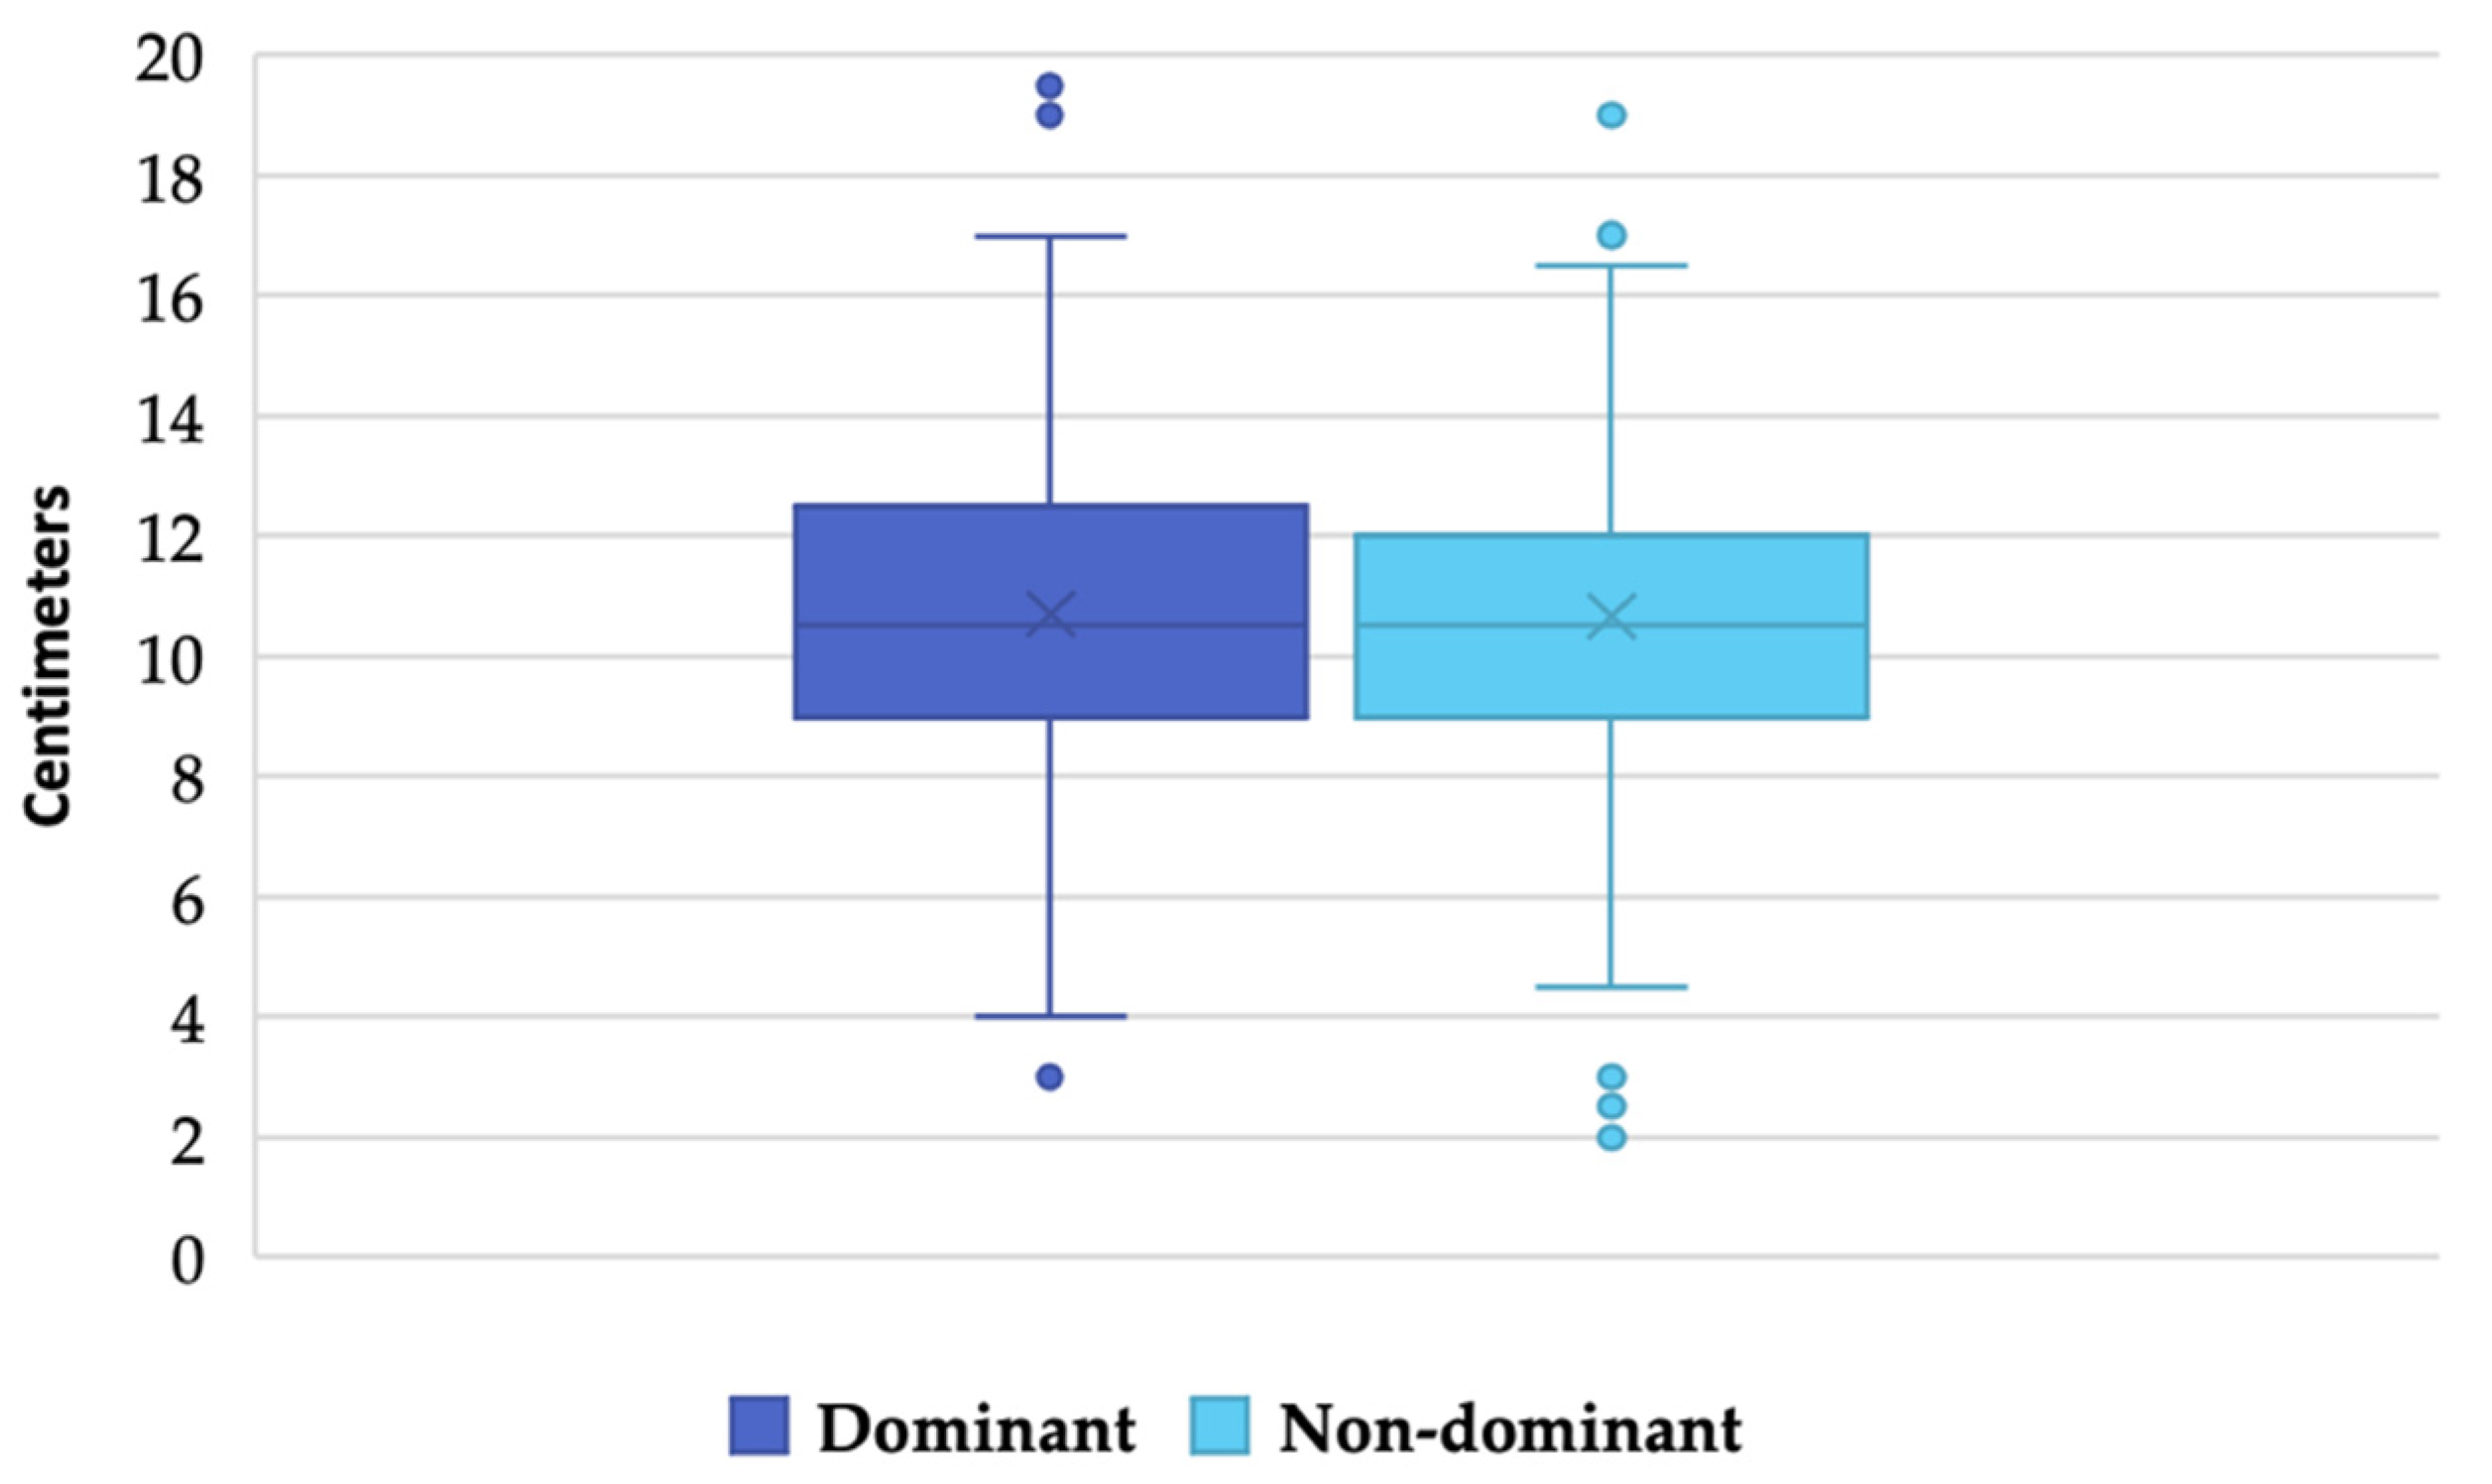
3.2. Ankle Joint Dorsiflexion
3.3. Ankle Joint Dorsiflexion for between-Group Comparisons and Gender of U12 to U17 Basketball
3.4. Reference Interval and Reference Limits
3.5. Classification of the Sample According to Reference Values
4. Discussion
5. Conclusions
Author Contributions
Funding
Institutional Review Board Statement
Informed Consent Statement
Data Availability Statement
Acknowledgments
Conflicts of Interest
References
- Hall, S.J. Basic Biomechanics, 7th ed.; McGraw-Hill Education: New York, NY, USA, 2015. [Google Scholar]
- Powden, C.J.; Hoch, J.M.; Hoch, M.C. Reliability and minimal detectable change of the weight-bearing lunge test: A systematic review. Man. Ther. 2015, 20, 524–532. [Google Scholar] [CrossRef] [PubMed]
- Terada, M.; Pietrosimone, B.G.; Gribble, P.A. Therapeutic Interventions for Increasing Ankle Dorsiflexion After Ankle Sprain: A Systematic Review. J. Athl. Train. 2013, 48, 696–709. [Google Scholar] [CrossRef] [PubMed]
- Vaulerin, J.; Chorin, F.; Emile, M.; D’Arripe-Longue-Ville, F.; Colson, S.S. Ankle Sprains Risk Factors in a Sample of French Firefighters: A Preliminary Prospective Study. J. Sport Rehabil. 2020, 29, 608–615. [Google Scholar] [CrossRef] [PubMed]
- Trojian, T.; Tucker, A.K. Plantar Fasciitis. Am. Fam. Physician 2019, 99, 744–750. [Google Scholar]
- Sullivan, J.; Pappas, E.; Burns, J. Role of mechanical factors in the clinical presentation of plantar heel pain: Implications for management. Foot 2019, 42, 101636. [Google Scholar] [CrossRef]
- Dill, K.E.; Begalle, R.L.; Frank, B.S.; Zinder, S.M.; Padua, D.A. Altered Knee and Ankle Kinematics During Squatting in Those With Limited Weight-Bearing–Lunge Ankle-Dorsiflexion Range of Motion. J. Athl. Train. 2014, 49, 723–732. [Google Scholar] [CrossRef]
- Rabin, A.; Portnoy, S.; Kozol, Z. The Association of Ankle Dorsiflexion Range of Motion With Hip and Knee Kinematics During the Lateral Step-down Test. J. Orthop. Sports Phys. Ther. 2016, 46, 1002–1009. [Google Scholar] [CrossRef]
- Wahlstedt, C.; Rasmussen-Barr, E. Anterior cruciate ligament injury and ankle dorsiflexion. Knee Surg. Sports Traumatol. Arthrosc. 2014, 23, 3202–3207. [Google Scholar] [CrossRef]
- Malliaras, P.; Cook, J.L.; Kent, P. Reduced ankle dorsiflexion range may increase the risk of patellar tendon injury among volleyball players. J. Sci. Med. Sport 2006, 9, 304–309. [Google Scholar] [CrossRef]
- Vuurberg, G.; Hoorntje, A.; Wink, L.M.; Van Der Doelen, B.F.W.; Bekerom, M.P.V.D.; Dekker, R.; Van Dijk, C.N.; Krips, R.; Loogman, M.C.M.; Ridderikhof, M.L.; et al. Diagnosis, treatment and prevention of ankle sprains: Update of an evidence-based clinical guideline. Br. J. Sports Med. 2018, 52, 956. [Google Scholar] [CrossRef]
- Plisky, P.J.; Bullock, G.S.; Garner, M.B.; Ricard, R.; Hayden, J.; Huebner, B.; Schwartzkopf-Phifer, K.; Kiesel, K. The Dorsiflexion Range of Motion Screen: A Validation Study. Int. J. Sports Phys. Ther. 2021, 16, 306–311. [Google Scholar] [CrossRef]
- Lemoyne, J.; Poulin, C.; Richer, N.; Bussières, A. Analyzing injuries among university-level athletes: Prevalence, patterns and risk factors. J. Can. Chiropr. Assoc. 2017, 61, 88–95. [Google Scholar] [PubMed]
- Drewes, L.K.; McKeon, P.O.; Casey Kerrigan, D.; Hertel, J. Dorsiflexion deficit during jogging with chronic ankle instability. J. Sci. Med. Sport 2009, 12, 685–687. [Google Scholar] [CrossRef] [PubMed]
- Lloyd, R.S.; Oliver, J.L. The Youth Physical Development Model: A New Approach to Long-Term Athletic Development. Strength Cond. J. 2012, 34, 61–72. [Google Scholar] [CrossRef]
- Lima, Y.L.; Ferreira, V.M.L.M.; de Paula Lima, P.O.; Bezerra, M.A.; de Oliveira, R.R.; Almeida, G.P.L. The association of ankle dorsiflexion and dynamic knee valgus: A systematic review and meta-analysis. Phys. Ther. Sport 2018, 29, 61–69. [Google Scholar] [CrossRef] [PubMed]
- Steele, J.; Sheppard, J. Landing mechanics in injury prevention and performance rehabilitation. In Sports Injury Prevention and Rehabilitation: Integrating Medicine and Science for Performance Solutions; Joyce, D., Lewindon, D., Eds.; Taylor & Francis Group: London, UK, 2016; Volume 1, pp. 121–138. [Google Scholar]
- Macrum, E.; Bell, D.R.; Boling, M.; Lewek, M.; Padua, D. Effect of Limiting Ankle-Dorsiflexion Range of Motion on Lower Extremity Kinematics and Muscle-Activation Patterns During a Squat. J. Sport Rehabil. 2012, 21, 144–150. [Google Scholar] [CrossRef]
- Gatt, A.; Chockalingam, N. Clinical assessment of ankle joint dorsiflexion: A review of measurement techniques. J. Am. Podiatr. Med Assoc. 2011, 101, 59–69. [Google Scholar] [CrossRef]
- Baumbach, S.F.; Braunstein, M.; Seeliger, F.; Borgmann, L.; Böcker, W.; Polzer, H. Ankle dorsiflexion: What is normal? Development of a decision pathway for diagnosing impaired ankle dorsiflexion and M. gastrocnemius tightness. Arch. Orthop. Trauma. Surg. 2016, 136, 1203–1211. [Google Scholar] [CrossRef]
- Mosteo, A.S.; Spink, M.J.; Chuter, V.H. Validation of a weight bearing ankle equinus value in older adults with diabetes. J. Foot Ankle Res. 2018, 11, 62. [Google Scholar] [CrossRef]
- Pacey, V.; Tofts, L.; Adams, R.D.; Munns, C.F.; Nicholson, L. Quality of life prediction in children with joint hypermobility syndrome. J. Paediatr. Child Health 2015, 51, 689–695. [Google Scholar] [CrossRef]
- Hoch, M.C.; Staton, G.S.; McKeon, P.O. Dorsiflexion range of motion significantly influences dynamic balance. J. Sci. Med. Sport 2011, 14, 90–92. [Google Scholar] [CrossRef] [PubMed]
- Konor, M.M.; Morton, S.; Eckerson, J.M.; Grindstaff, T.L. Reliability of three measures of ankle dorsiflexion range of motion. Int. J. Sports Phys. Ther. 2012, 7, 279–287. [Google Scholar] [PubMed]
- Martin, R.L.; McPoil, T.G. Reliability of Ankle Goniometric Measurements. J. Am. Podiatr. Med Assoc. 2005, 95, 564–572. [Google Scholar] [CrossRef] [PubMed]
- Terada, M.; Harkey, M.S.; Wells, A.M.; Pietrosimone, B.G.; Gribble, P.A. The influence of ankle dorsiflexion and self-reported patient outcomes on dynamic postural control in participants with chronic ankle instability. Gait Posture 2014, 40, 193–197. [Google Scholar] [CrossRef]
- Rabin, A.; Kozol, Z. Weightbearing and nonweightbearing ankle dorsiflexion range of motion: Are we measuring the same thing? J. Am. Podiatr. Med Assoc. 2012, 102, 406–411. [Google Scholar] [CrossRef]
- Benhamú-Benhamú, S.; García-De-La-Peña, R.; Gijon-Nogueron, G.; Cristino, M.D.J.; Gordillo-Fernández, L.M.; Dominguez-Maldonado, G. Range of Ankle Dorsiflexion in a Group of Adults with Ligamentous Laxity. J. Am. Podiatr. Med Assoc. 2018, 108, 245–252. [Google Scholar] [CrossRef]
- Soucie, J.M.; Wang, C.; Forsyth, A.; Funk, S.; Denny, M.; Roach, K.E.; Boone, D.; Network, T.H.T.C. Hemophilia Treatment Center Network. Range of motion measurements: Reference values and a database for comparison studies. Haemophilia 2010, 17, 500–507. [Google Scholar] [CrossRef]
- Hallaceli, H.; Uruc, V.; Uysal, H.H.; Ozden, R.; Hallaceli, C.; Soyuer, F.; Parpucu, T.I.; Yengil, E.; Cavlak, U. Normal hip, knee and ankle range of motion in the Turkish population. Acta Orthop. et Traumatol. Turc. 2014, 48, 37–42. [Google Scholar] [CrossRef]
- Calatayud, J.; Martin, F.; Gargallo, P.; García-Redondo, J.; Colado, J.C.; Marín, P.J. The validity and reliability of a new in-strumented device for measuring ankle dorsiflexion range of motion. Int. J. Sports Phys. Ther. 2015, 10, 197–202. [Google Scholar]
- Bennell, K.; Talbot, R.; Wajswelner, H.; Techovanich, W.; Kelly, D.; Hall, A. Intra-rater and inter-rater reliability of a weight-bearing lunge measure of ankle dorsiflexion. Aust. J. Physiother. 1998, 44, 175–180. [Google Scholar] [CrossRef]
- Smits-Engelsman, B.; Klerks, M.; Kirby, A. Beighton Score: A Valid Measure for Generalized Hypermobility in Children. J. Pediatr. 2011, 158, 119–123.e4. [Google Scholar] [CrossRef] [PubMed]
- Harris, A.J. Manuel D’application des Tests de Latéralité; Éditions du Centre de Psychologie Appliquée: Paris, France, 1958. [Google Scholar]
- Alvarado, H.; Batanero, C. Significado y Enseñanza del Teorema Central del Límite: Didáctica de la Probabilidad y Estadística; Editorial Académica Española: Chisinau, Republic of Moldova, 2011. [Google Scholar]
- Tummala, S.V.; Hartigan, D.E.; Makovicka, J.L.; Patel, K.A.; Chhabra, A. 10-Year Epidemiology of Ankle Injuries in Men’s and Women’s Collegiate Basketball. Orthop. J. Sports Med. 2018, 6, 12325967118805400. [Google Scholar] [CrossRef] [PubMed]
- Morales, C.R.; Lobo, C.C.; Sanz, D.R.; Corbalán, I.S.; Ruiz, B.B.R.; López, D.L. The concurrent validity and reliability of the Leg Motion system for measuring ankle dorsiflexion range of motion in older adults. PeerJ 2017, 5, e2820. [Google Scholar] [CrossRef] [PubMed]
- De Noronha, M.; Refshauge, K.M.; Herbert, R.; Kilbreath, S.; Hertel, J. Do voluntary strength, proprioception, range of motion, or postural sway predict occurrence of lateral ankle sprain? * COMMENTARY. Br. J. Sports Med. 2006, 40, 824–828. [Google Scholar] [CrossRef]
- Gonzalo-Skok, O.; Serna, J.; Rhea, M.R.; Marín, P.J. Age differences in measures of functional movement and performance in highly youth basketball players. Int. J. Sports Phys. Ther. 2017, 12, 812–821. [Google Scholar] [CrossRef]
- Krause, D.A.; Cloud, B.A.; Forster, L.A.; Schrank, J.A.; Hollman, J. Measurement of Ankle Dorsiflexion: A Comparison of Active and Passive Techniques in Multiple Positions. J. Sport Rehabil. 2011, 20, 333–344. [Google Scholar] [CrossRef]
- Munteanu, S.E.; Strawhorn, A.B.; Landorf, K.B.; Bird, A.R.; Murley, G.S. A weightbearing technique for the measurement of ankle joint dorsiflexion with the knee extended is reliable. J. Sci. Med. Sport 2009, 12, 54–59. [Google Scholar] [CrossRef]
- Konrad, A.; Tilp, M. Increased range of motion after static stretching is not due to changes in muscle and tendon structures. Clin. Biomech. 2014, 29, 636–642. [Google Scholar] [CrossRef]
- Rodrigues, K.A.; Soares, R.J.; Tomazini, J.E. The influence of fatigue in evertor muscles during lateral ankle sprain. Foot 2019, 40, 98–104. [Google Scholar] [CrossRef]
- Roos, K.G.; Kerr, Z.Y.; Mauntel, T.C.; Djoko, A.; Dompier, T.P.; Wikstrom, E. The Epidemiology of Lateral Ligament Complex Ankle Sprains in National Collegiate Athletic Association Sports. Am. J. Sports Med. 2016, 45, 201–209. [Google Scholar] [CrossRef]
- Fong, D.T.-P.; Hong, Y.; Chan, L.K.; Yung, P.S.-H.; Chan, K.-M. A Systematic Review on Ankle Injury and Ankle Sprain in Sports. Sports Med. 2007, 37, 73–94. [Google Scholar] [CrossRef] [PubMed]
- Jones, H.; Canata, G.L.; Yonai, Y.; Lukas, C.; Fehske, K. Knee injuries in basketball. In Basketball Sports Medicine and Science; Laver, L., Kocaoglu, B., Cole, B., Arundale, A.J.H., Bytomski, J., Amendola, A., Eds.; Springer: Berlin, Germany, 2020; Volume 1, pp. 333–350. [Google Scholar]
- Emery, C.A. Risk Factors for Injury in Child and Adolescent Sport: A Systematic Review of the Literature. Clin. J. Sport Med. 2003, 13, 256–268. [Google Scholar] [CrossRef] [PubMed]


| Outcomes | U12 (n = 227) | U14 (n = 160) | U16 (n = 165) | U17 (n = 141) |
|---|---|---|---|---|
| Gender a, female | 127 (55.95%) | 80 (50%) | 82 (49.70%) | 70 (49.64%) |
| Weight b, kg | 43.97 (8.14) | 53.96 (10.91) | 65.69 (11.93) | 68.30 (13.57) |
| Height b, cm | 154.69 (7.68) | 164.04 (9.45) | 176.50 (10.32) | 177.63 (11.60) |
| Wingspan b, cm | 152.85 (11.14) | 164.62 (13.43) | 177.16 (11.88) | 178.96 (13.62) |
| BMI b, kg/m2 | 18.27 (2.44) | 19.93 (2.86) | 21.04 (3.11) | 21.60 (3.43) |
| Hypermobility a | 14 (6.17%) | 17 (10.63%) | 7 (4.24%) | 12 (8.51%) |
| Right-handed a | 199 (87.67%) | 146 (91.25%) | 153 (92.73%) | 128 (90.78%) |
| Gender | Age Categories | Dominant Leg | Nondominant Leg | p Value | ||||
|---|---|---|---|---|---|---|---|---|
| Mean (SD) | SE | Interval | Mean (SD) | SE | Interval | |||
| Female | U12 (n = 127) | 10.54 (2.42) | 2.39 | [8.15, 12.93] | 10.26 (2.55) | 2.39 | [8.15, 12.93] | 0.186 |
| U14 (n = 80) | 10.83 (2.36) | 2.37 | [8.48, 13.17] | 11.04 (2.59) | 2.35 | [8.48, 13.17] | 0.294 | |
| U16 (n = 82) | 11.77 (2.90) | 2.08 | [9.69, 13.85] | 11.38 (1.84) | 2.08 | [9.69, 13.85] | 0.103 | |
| U17 (n = 70) | 11.28 (2.21) | 2.20 | [9.07, 13.48] | 11.44 (2.11) | 2.20 | [9.07, 13.48] | 0.327 | |
| Male | U12 (n = 100) | 9.21 (2.16) | 2.14 | [7.07,11.36] | 9.40 (2.04) | 2.13 | [7.07, 11.36] | 0.271 |
| U14 (n = 80) | 10.81 (2.48) | 2.47 | [8.34,13.27] | 10.74 (2.41) | 2.47 | [8.34, 13.27] | 0.436 | |
| U16 (n = 83) | 10.97 (2.87) | 2.85 | [8.12,13.82] | 11.09 (2.79) | 2.85 | [8.12, 13.82] | 0.392 | |
| U17 (n = 71) | 10.70 (2.12) | 2.11 | [8.58,12.81] | 10.71 (2.24) | 2.11 | [8.58, 12.81] | 0.485 | |
| U12 | U14 | U16 | U17 | |||||
|---|---|---|---|---|---|---|---|---|
| Joint ROM | Female | Male | Female | Male | Female | Male | Female | Male |
| No. of subjects | 127 | 100 | 80 | 80 | 82 | 83 | 70 | 71 |
| Mean | 10.54 | 9.22 | 10.83 | 10.81 | 11.77 | 10.97 | 11.28 | 10.70 |
| SD | 2.42 | 2.16 | 2.36 | 2.48 | 2.09 | 2.87 | 2.21 | 2.12 |
| Minimum | 4 | 4 | 6 | 5 | 5 | 3 | 5 | 6.50 |
| 25th percentile | 9.50 | 8 | 9 | 9.50 | 10.50 | 9.50 | 9.50 | 9 |
| 50th percentile | 10.50 | 9 | 10.5 | 10.50 | 11.50 | 11 | 11.50 | 10.50 |
| 75th percentile | 12 | 10.04 | 13 | 12 | 13.50 | 13 | 13 | 12.50 |
| Maximum | 19.50 | 17 | 17 | 16 | 16 | 19 | 16.50 | 15.50 |
| Gender | Age Categories | Excessive Hypomobility | Hypomobility | Normal | Hypermobility | Excessive Hypermobility |
|---|---|---|---|---|---|---|
| Female | U12 | <5.70 | 5.70–8.12 | 8.13–12.95 | 12.96–15.37 | >15.37 |
| U14 | <6.11 | 6.11–8.47 | 8.48–13.18 | 13.19–15.54 | >15.54 | |
| U16 | <7.59 | 7.59–9.68 | 9.69–13.86 | 13.87–15.95 | >15.95 | |
| U17 | <6.86 | 6.86–9.07 | 9.08–13.49 | 13.50–15.70 | >15.70 | |
| Male | U12 | <4.89 | 4.89–7.05 | 7.06–11.38 | 11.39–13.54 | >13.54 |
| U14 | <5.85 | 5.85–8.33 | 8.34–13.29 | 13.30–15.77 | >15.77 | |
| U16 | <5.23 | 5.23–8.10 | 8.11–13.84 | 13.85–16.71 | >16.71 | |
| U17 | <6.46 | 6.46–8.58 | 8.59–12.82 | 12.83–14.93 | >14.93 |
| Gender | Age Categories | Mean | 95% CI | Excessive Hypomobility | Hypomobility | Normal | Hypermobility | Excessive Hypermobility |
|---|---|---|---|---|---|---|---|---|
| Female | U12 (n = 127) | 10.54 | 10.11–10.96 | 5 (3.90%) | 13 (10.20%) | 88 (69.30%) | 19 (15.00%) | 2 (1.60%) |
| U14 (n = 80) | 10.82 | 10.30–11.35 | 1 (1.30%) | 11 (13.80%) | 54 (67.50%) | 12 (15.00%) | 2 (2.50%) | |
| U16 (n = 82) | 11.77 | 11.31–12.23 | 2 (2.40%) | 8 (9.80%) | 57 (69.50%) | 14 (17.10%) | 1 (1.20%) | |
| U17 (n = 70) | 11.28 | 10.75–11.81 | 1 (1.40%) | 13 (18.60%) | 41 (58.60%) | 14 (20.00%) | 1 (1.40%) | |
| Male | U12 (n = 100) | 9.21 | 8.78–9.64 | 2 (2.00%) | 13 (13.00%) | 72 (72.00%) | 9 (9.00%) | 4 (4.00%) |
| U14 (n = 80) | 10.81 | 10.25–11.36 | 1 (1.30%) | 11 (13.80%) | 53 (66.30%) | 11 (13.80%) | 4 (5.00%) | |
| U16 (n = 83) | 10.97 | 10.34–11.60 | 3 (3.60%) | 9 (10.80%) | 55 (66.30%) | 14 (16.90%) | 2 (2.40%) | |
| U17 (n = 71) | 10.70 | 10.20–11.20 | 0 (0%) | 10 (14.10%) | 48 (67.60%) | 11 (15.50%) | 2 (2.80%) |
| Author | No People | Age | Dorsiflexion Mean (SD) | Excessive Hypomobility (<−2 SD) | Hypomobility (−2 to −1 SD) | Normal (−/+ 1 SD) | Hypermobility (+1 to +2 SD) | Excessive Hypermobility (>+2 SD) |
|---|---|---|---|---|---|---|---|---|
| Non-weight-bearing passive | ||||||||
| Hallaçeli et al. [30] 1 | 987 | 19–32 y | 22.44 (7.16) a | <8.12 | 8.12–15.28 | 15.29–29.60 | 29.61–36.77 | >36.77 |
| Souci et al. [29] 1 | 674 | 9–19 y | 16.80 (5.75) a | <5.30 | 5.30–11.05 | 11.06–22.55 | 22.56–28.30 | >28.30 |
| Rabin et al. [27] 1 | 43 | 20–30 y | 49.78 (6.40) | <36.98 | 36.98–43.38 | 43.39–56.18 | 58.19–62.58 | >62.58 |
| Baumbach et al. [20] 1 | 60 | 18–35 y | 28.13 (6.29) | <15.55 | 15.55–21.84 | 21.85–34.42 | 34.43–40–71 | >40.71 |
| Weight-bearing active | ||||||||
| Krause et al. [41] 1 | 39 | 18–35 y | 33.29 (7.07) a | <18.80 | 18.80–25.90 | 25.91–40.40 | 40.41–47.00 | >47.00 |
| Baumbach et al. [20] 1 | 64 | 18–35 y | 37.77(5.82) b | <26.13 | 26.13–31.95 | 31.96–37.77 | 37.78–43.59 | >43.59 |
| Munteanu et al. [42] 1 | 30 | 19–42 y | 39.0 (4.6) | <29.80 | 29.80–34.30 | 34.31–43.60 | 43.61–48.10 | >48.10 |
| Konrad et al. [43] 1 | 38 | 20–26 y | 31.5 (6.6) | <18.20 | 18.20–24.80 | 24.81–38.10 | 38.11–44.60 | >44.60 |
| Gonzalo-Skok et al. [40] 2 | 15 | 14–16 y | 10.94 (3.44) b | <4.06 | 4.06–7.50 | 7.51–14.38 | 14.39–17.82 | >17.82 |
| Adillón et al. 2 | 693 | 10–17 y | 10.68 (2.44) | <6.09 | 6.09–8.43 | 8.44–13.11 | 13.12–15.44 | >15.44 |
Publisher’s Note: MDPI stays neutral with regard to jurisdictional claims in published maps and institutional affiliations. |
© 2022 by the authors. Licensee MDPI, Basel, Switzerland. This article is an open access article distributed under the terms and conditions of the Creative Commons Attribution (CC BY) license (https://creativecommons.org/licenses/by/4.0/).
Share and Cite
Adillón, C.; Gallegos, M.; Treviño, S.; Salvat, I. Ankle Joint Dorsiflexion Reference Values in Non-Injured Youth Federated Basketball Players: A Cross-Sectional Study. Int. J. Environ. Res. Public Health 2022, 19, 11740. https://doi.org/10.3390/ijerph191811740
Adillón C, Gallegos M, Treviño S, Salvat I. Ankle Joint Dorsiflexion Reference Values in Non-Injured Youth Federated Basketball Players: A Cross-Sectional Study. International Journal of Environmental Research and Public Health. 2022; 19(18):11740. https://doi.org/10.3390/ijerph191811740
Chicago/Turabian StyleAdillón, Cristina, Montse Gallegos, Silvia Treviño, and Isabel Salvat. 2022. "Ankle Joint Dorsiflexion Reference Values in Non-Injured Youth Federated Basketball Players: A Cross-Sectional Study" International Journal of Environmental Research and Public Health 19, no. 18: 11740. https://doi.org/10.3390/ijerph191811740
APA StyleAdillón, C., Gallegos, M., Treviño, S., & Salvat, I. (2022). Ankle Joint Dorsiflexion Reference Values in Non-Injured Youth Federated Basketball Players: A Cross-Sectional Study. International Journal of Environmental Research and Public Health, 19(18), 11740. https://doi.org/10.3390/ijerph191811740