

Fatigue and Training Load Factors in Volleyball


Abstract
:1. Introduction
2. Materials and Methods
2.1. Materials
2.2. Methods
2.2.1. Physical Performance
2.2.2. Load Data Collection

| Variable | Monday | Tuesday | Wednesday | Thursday | Friday |
|---|---|---|---|---|---|
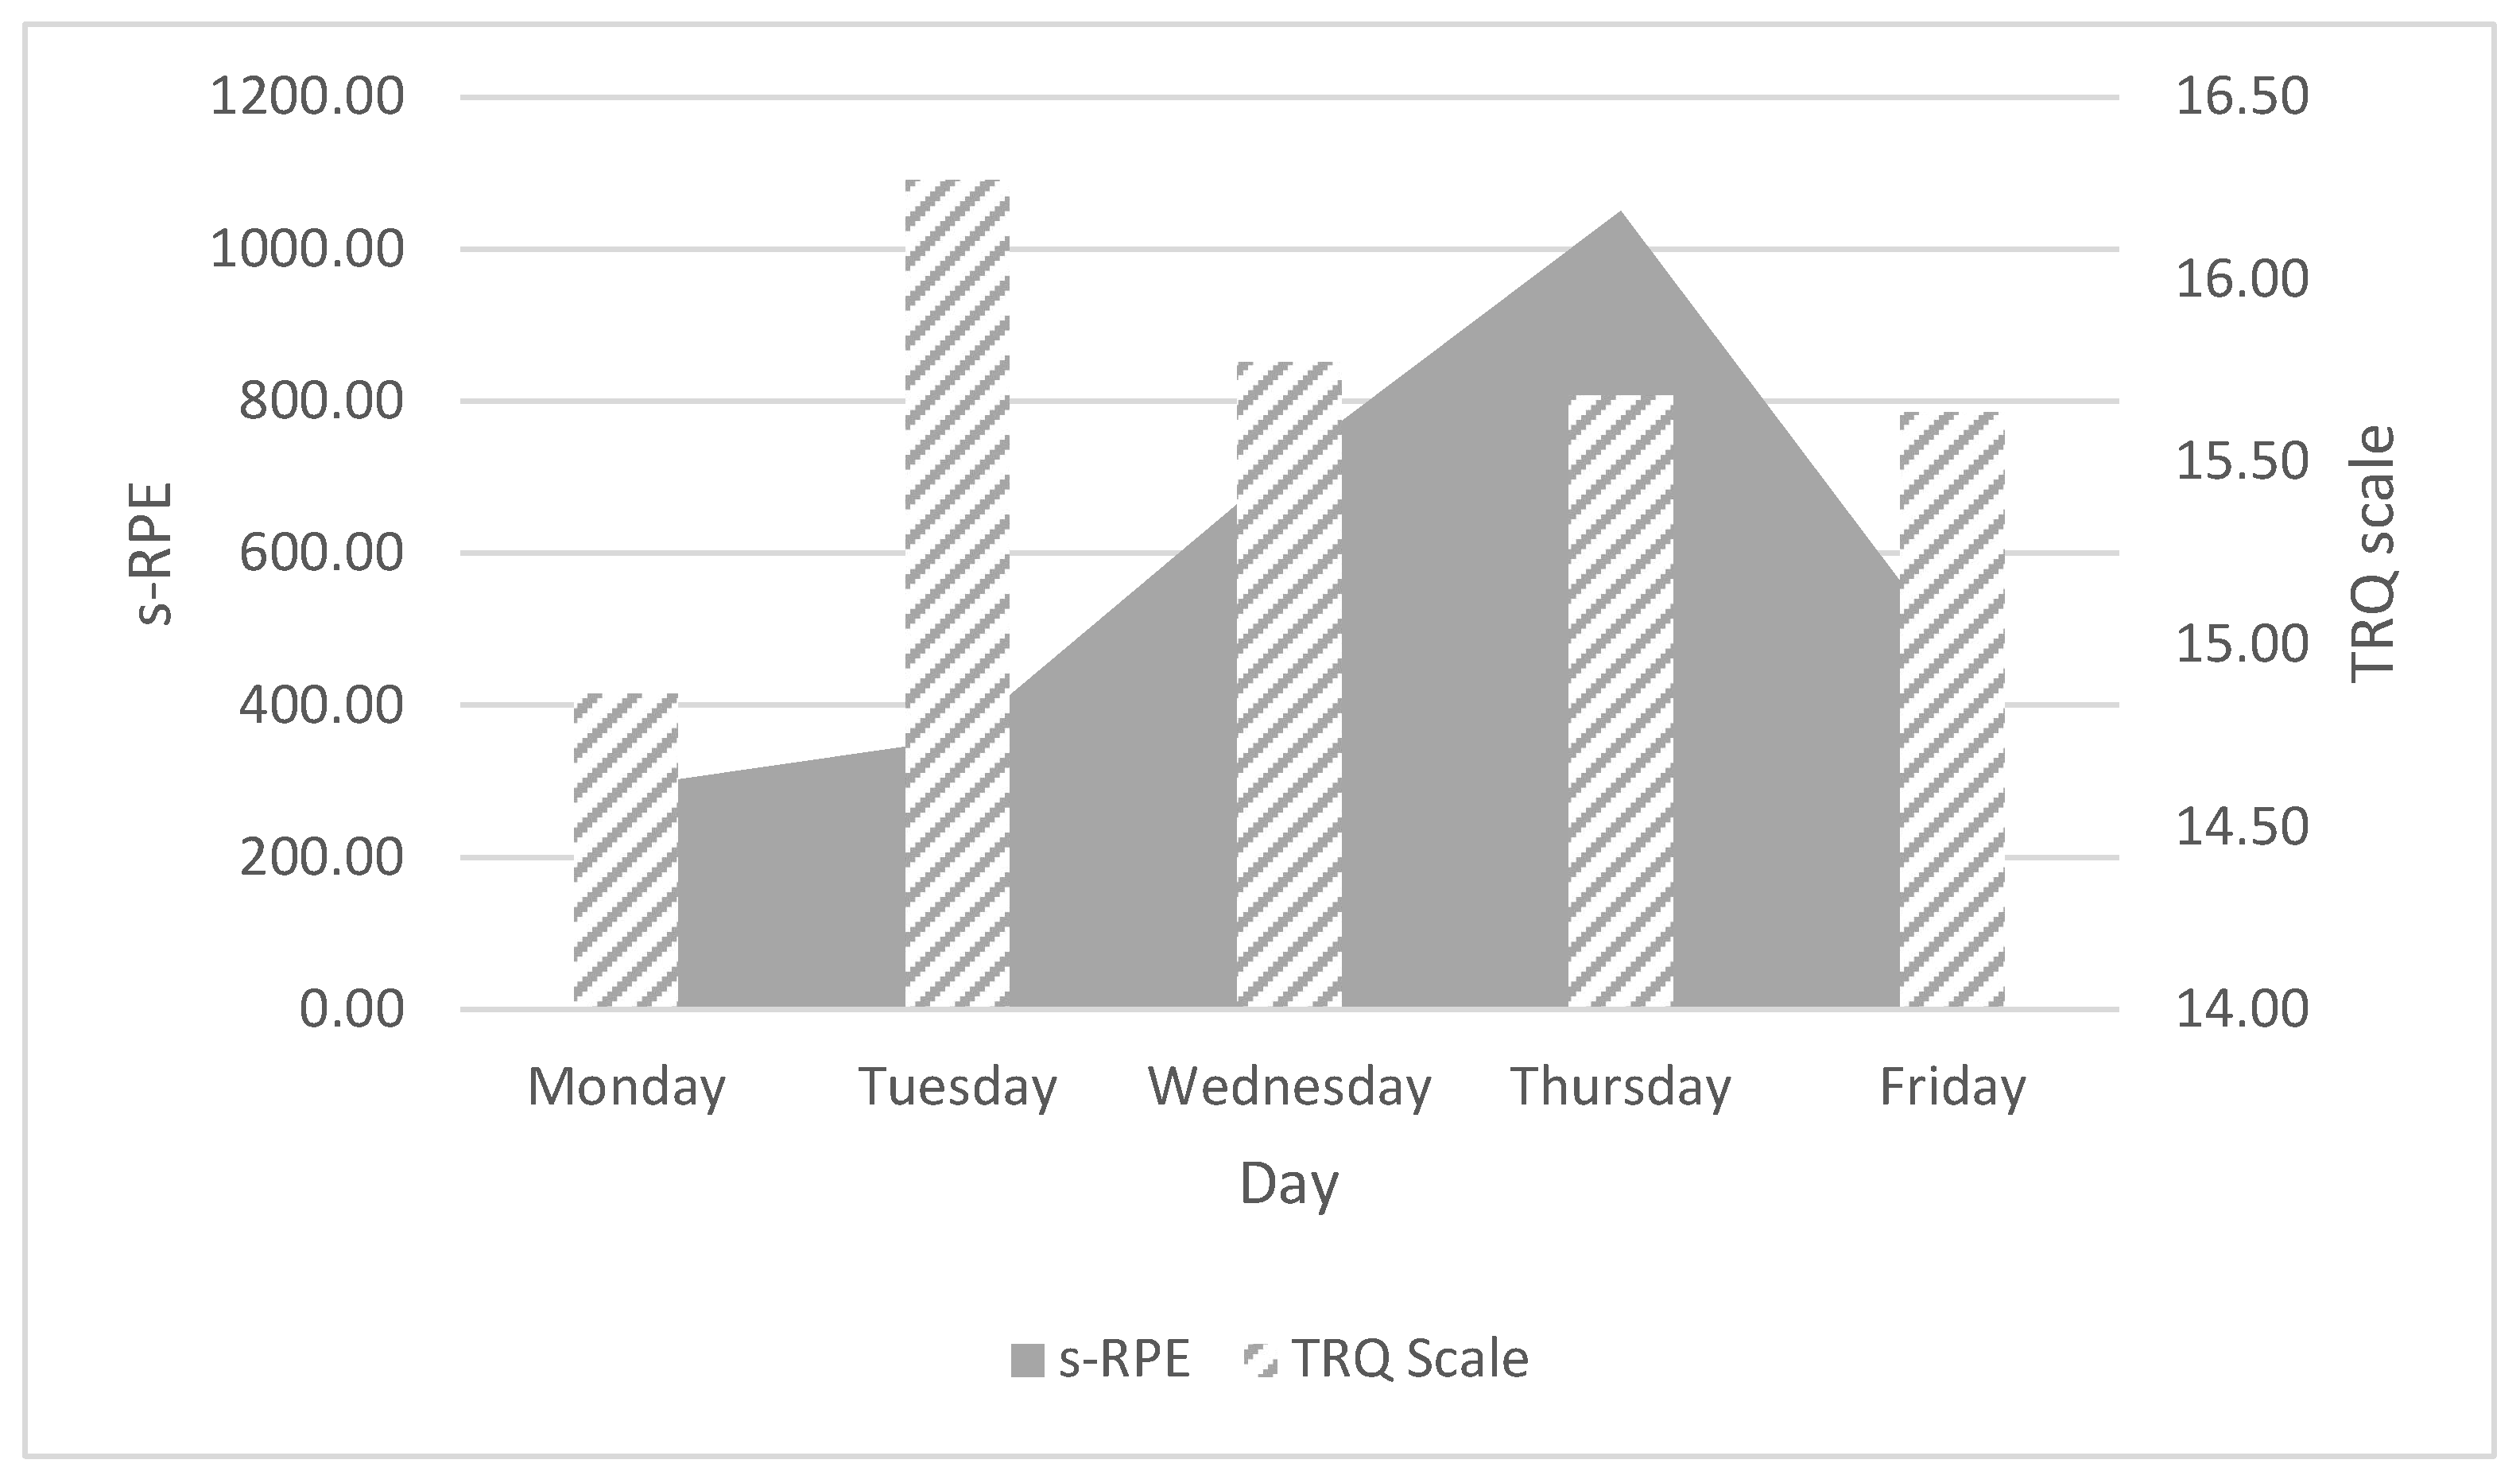
| TRQ Scale (score) | 14.86 ± 1.70 | 16.27 ± 2.01 | 15.77 ± 2.52 | 15.68 ± 1.10 | 15.64 ± 1.43 |
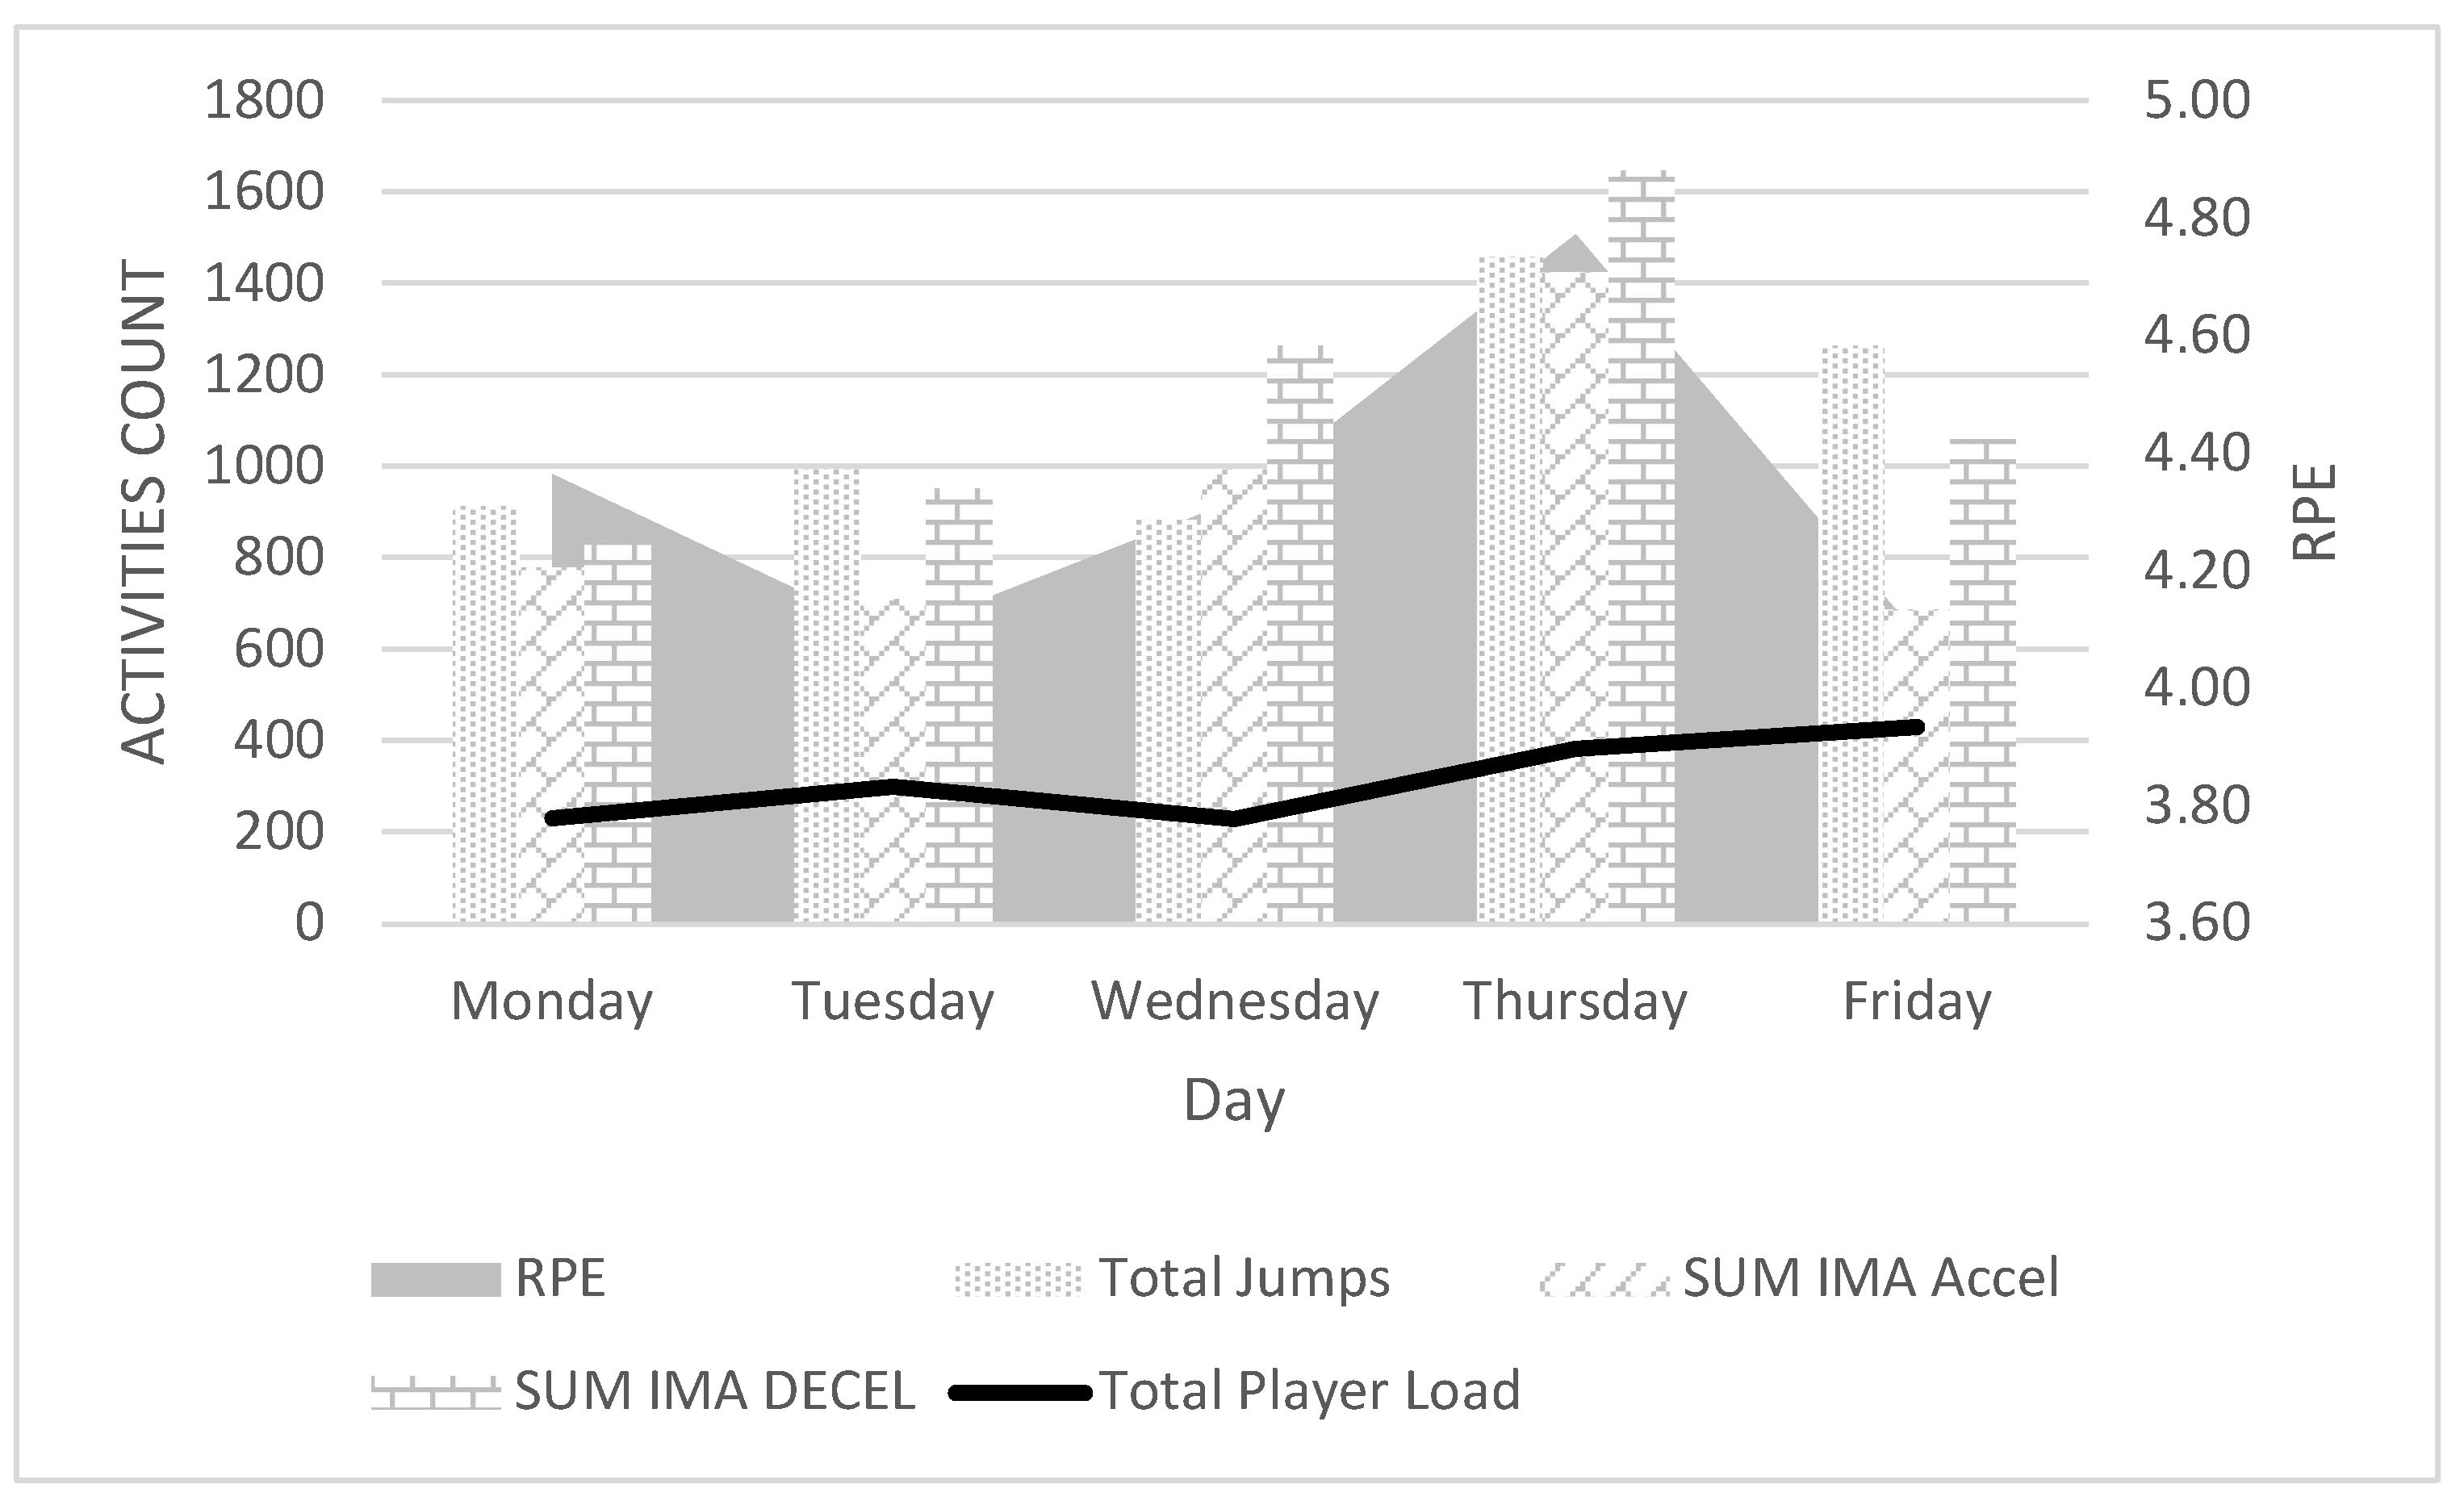
| RPE (Borg Scale) | 4.36 ± 0.92 | 4.09 ± 0.83 | 4.32 ± 1.23 | 4.77 ± 0.61 | 4.09 ± 0.94 |
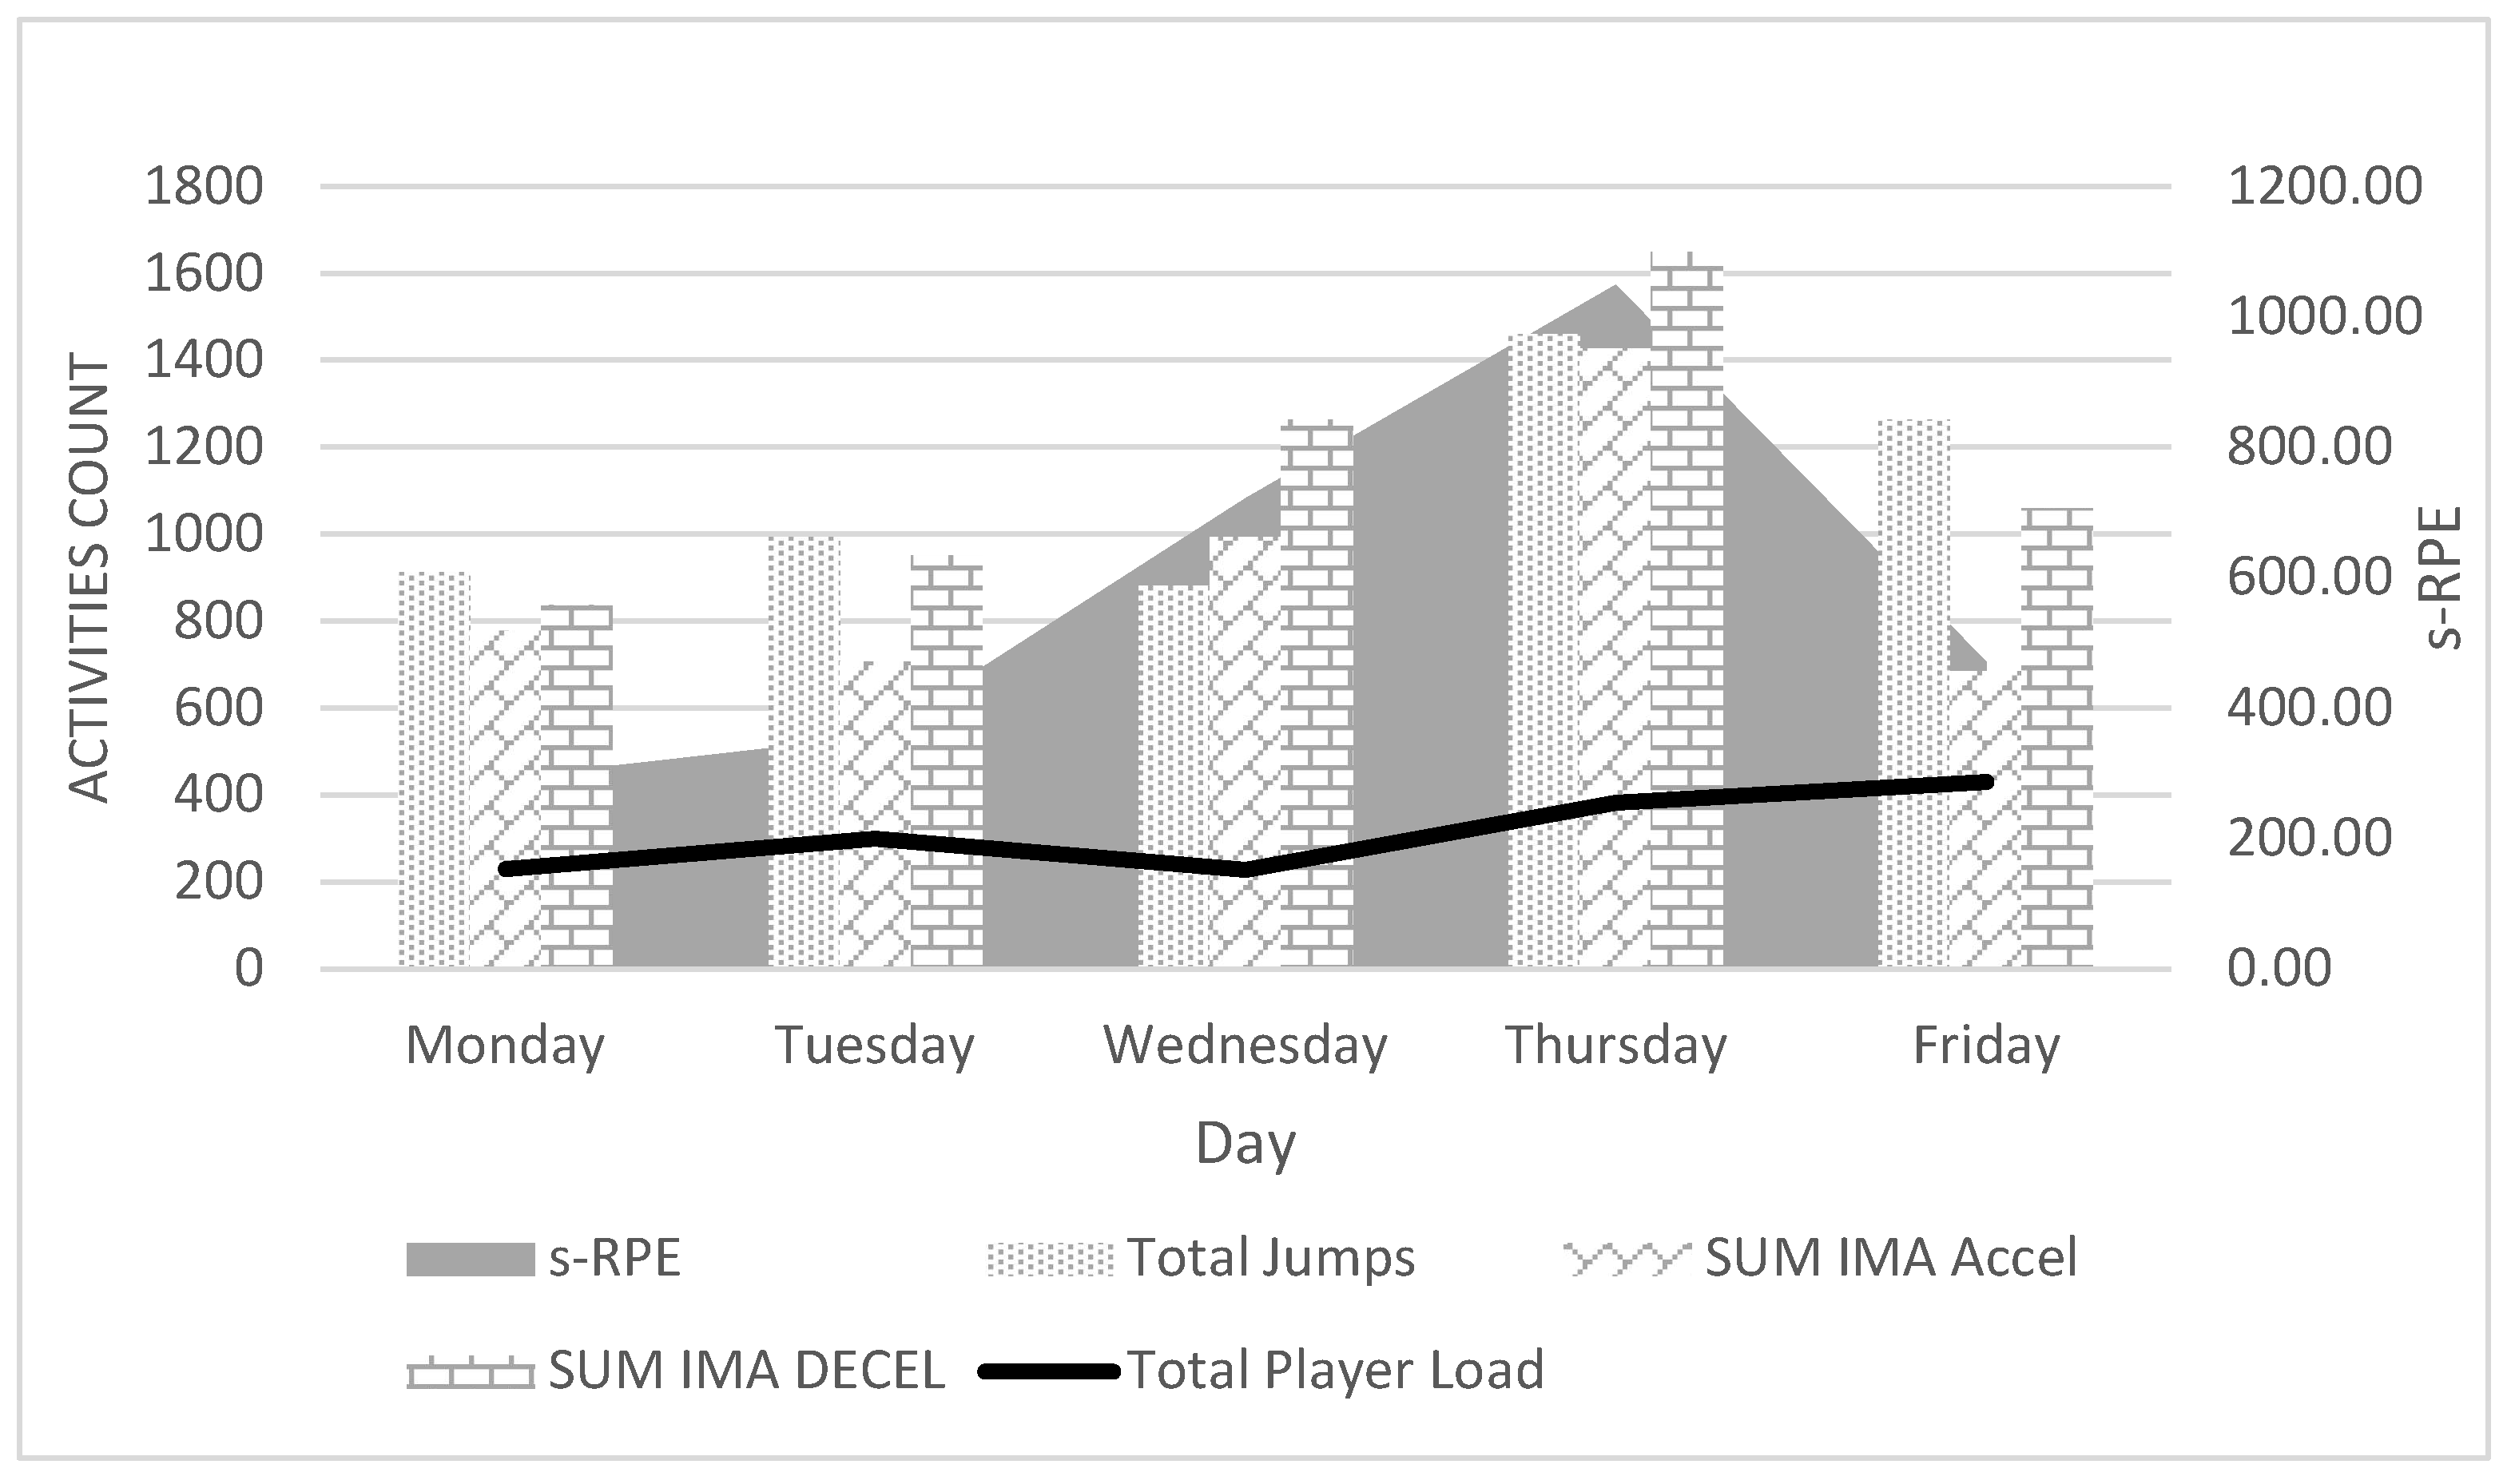
| s-RPE (Au) | 292.36 | 355.91 | 721.14 | 1050.00 | 470.62 |
| Total Player Load | 229.99 ± 25.25 | 298.54 ± 23.49 | 229.12 ± 134.03 | 382.63 ± 62.67 | 430.27 ± 46.73 |
| AVG Heart Rate | 141.18 ± 16.7 | 141.26 ± 20.29 | 129.57 ±21.86 | 132.65 ± 16.09 | 127.75 ± 14.47 |
| Mean IMA Jump Count Low Band | 8.18 ± 5.62 | 9.73 ± 7.42 | 6 ± 8.77 | 10.89 ± 7.87 | 9.6 ± 6.24 |
| Mean IMA Jump Count Med Band | 57.27 ± 15.27 | 59.64 ± 32.77 | 26.85 ± 39.01 | 52.22 ± 31.76 | 87.3 ± 37.23 |
| Mean IMA Jump Count High Band | 17.36 ± 12.66 | 20.82 ± 21.31 | 8.95 ± 12.6 | 17.94 ± 22.57 | 29.4 ± 27.78 |
| Mean Total Jumps | 82.82 ± 20.71 | 90.18 ± 36.92 | 41.8 ± 49.59 | 81.06 ± 45.4 | 126.3 ± 42.84 |
| Total Jumps Count | 911 | 992 | 881 | 1459 | 1263 |
| IMA Jump Count Low Band | 90 | 107 | 120 | 196 | 96 |
| IMA Jump Count Med Band | 630 | 656 | 537 | 940 | 873 |
| IMA Jump Count High Band | 191 | 229 | 179 | 323 | 294 |
| IMA Accel Low | 581 | 494 | 776 | 970 | 488 |
| IMA Accel Medium | 116 | 155 | 146 | 268 | 99 |
| IMA Accel High | 80 | 59 | 70 | 188 | 98 |
| Total IMA Accel | 777 | 708 | 992 | 1426 | 685 |
| IMA Decel Low | 703 | 788 | 1075 | 1394 | 894 |
| IMA Decel Medium | 119 | 148 | 163 | 223 | 144 |
| IMA Decel High | 14 | 15 | 25 | 31 | 21 |
| Total Decel | 836 | 951 | 1263 | 1648 | 1059 |
| ACC/DEC | 0.69 | 0.52 | 0.61 | 0.59 | 0.46 |
2.2.3. Statistical Analysis
3. Results
3.1. Daily Training Load
3.2. Internal Load and Recovery Scale
3.3. Relationships between Internal and External Load/ETL vs. ITL in the Day Comparison
3.4. Kinematic Predictors without Breakdown by Training Days
3.5. Interdispositions Explaining the RPE and s-RPE Variable
3.6. Diagnosed ETL Parameters
4. Discussion
5. Conclusions
Author Contributions
Funding
Institutional Review Board Statement
Informed Consent Statement
Data Availability Statement
Acknowledgments
Conflicts of Interest
References
- Debien, P.B.; Mancini, M.; Coimbra, D.R.; de Freitas, D.G.; Miranda, R.; Bara Filho, M.G. Monitoring training load, recovery, and performance of Brazilian professional volleyball players during a season. Int. J. Sports Physiol. Perform. 2018, 13, 1182–1189. [Google Scholar] [CrossRef] [PubMed]
- Freitas, V.H.; Nakamura, F.Y.; Miloski, B.; Samulski, D.; Bara-Filho, M.G. Sensitivity of physiological and psychological markers to training load intensification in volleyball players. J. Sports Sci. Med. 2014, 13, 571. [Google Scholar] [PubMed]
- Lidor, R.; Ziv, G. Physical and physiological attributes of female volleyball players—A review. J. Strength Cond. Res. 2010, 24, 1963–1973. [Google Scholar] [CrossRef]
- Sheppard, J.M.; Chapman, D.W.; Gough, C.; McGuigan, M.R.; Newton, R.U. Twelve-month training-induced changes in elite international volleyball players. J. Strength Cond. Res. 2009, 23, 2096–2101. [Google Scholar] [CrossRef]
- Sheppard, J.M.; Nolan, E.; Newton, R.U. Changes in strength and power qualities over two years in volleyball players transitioning from junior to senior national team. J. Strength Cond. Res. 2012, 26, 152–157. [Google Scholar] [CrossRef] [PubMed]
- Sheppard, J.; Newton, R.; McGuigan, M. The effect of accentuated eccentric load on jump kinetics in high-performance volleyball players. Int. J. Sports Sci. Coach. 2007, 2, 267–273. [Google Scholar] [CrossRef]
- Aoki, P.H.B.; Schroder, A.P.; Constantino, C.J.L.; Marques, C.M. Bioadhesive giant vesicles for monitoring hydroperoxidation in lipid membranes. Soft Matter 2015, 11, 5995–5998. [Google Scholar] [CrossRef]
- Bompa, T.O.; Carrera, M. Conditioning Young Athletes; Human Kinetics: Champaign, IL, USA, 2015. [Google Scholar]
- Mikolajec, K.; Waskiewicz, Z.; Maszczyk, A.; Bacik, B.; Kurek, P. Effects of stretching and strength exercises on speed and power abilities in male basketball players. Isokinet. Exerc. Sci. 2012, 20, 61–69. [Google Scholar] [CrossRef]
- Lima, R.F.; Palao, J.M.; Clemente, F.M. Jump performance during official matches in elite volleyball players: A pilot study. J. Hum. Kinet. 2019, 67, 259–269. [Google Scholar] [CrossRef]
- Lupo, C.; Ungureanu, A.N.; Brustio, P.R. Session-RPE is a valuable internal load evaluation method in beach volleyball for both genders, elite and amateur players, conditioning and technical sessions, but limited for tactical training and games. Kinesiology 2020, 52, 30–38. [Google Scholar] [CrossRef]
- Clemente, F.M.; Mendes, B.; Palao, J.M.; Silvério, A.; Carriço, S.; Calvete, F.; Nakamura, F.Y. Seasonal player wellness and its longitudinal association with internal training load: Study in elite volleyball. J. Sports Med. Phys. Fit. 2018, 59, 345–351. [Google Scholar] [CrossRef] [PubMed]
- Andrade Nogueira, F.C.d.; Nogueira, R.A.; Coimbra, D.R.; Miloski, B.; Freitas, V.H.d.; Bara, M. Internal training load: Perception of volleyball coaches and athletes. Rev. Bras. De Cineantropometria Desempenho Hum. 2014, 16, 638–647. [Google Scholar]
- Garcia, L.; Planas, A.; Peirau, X. Analysis of the injuries and workload evolution using the RPE and s-RPE method in basketball. Apunt. Sports Med. 2022, 57, 100372. [Google Scholar] [CrossRef]
- Scott, B.R.; Lockie, R.G.; Knight, T.J.; Clark, A.C.; de Jonge, X.A.J. A comparison of methods to quantify the in-season training load of professional soccer players. Int. J. Sports Physiol. Perform. 2013, 8, 195–202. [Google Scholar] [CrossRef]
- Horta, T.A.; Bara Filho, M.G.; Coimbra, D.R.; Miranda, R.; Werneck, F.Z. Training load, physical performance, biochemical markers, and psychological stress during a short preparatory period in brazilian elite male volleyball players. J. Strength Cond. Res. 2019, 33, 3392–3399. [Google Scholar] [CrossRef]
- Gjinovci, B.; Idrizovic, K.; Uljevic, O.; Sekulic, D. Plyometric training improves sprinting, jumping and throwing capacities of high level female volleyball players better than skill-based conditioning. J. Sports Sci. Med. 2017, 16, 527. [Google Scholar]
- Spangler, R.; Rantalainen, T.; Gastin, P.B.; Wundersitz, D. Inertial sensors are a valid tool to detect and consistently quantify jumping. Int. J. Sports Med. 2018, 39, 802–808. [Google Scholar] [CrossRef]
- Hornsby, J.H.; Green, J.M.; O’Neal, E.K.; Killen, L.L.; McIntosh, J.R.; Coates, T.E. Influence of terminal RPE on session RPE. J. Strength Cond. Res. 2013, 27, 2800–2805. [Google Scholar] [CrossRef]
- Monsef Cherif, M.S.; Chaatani, S.; Nejlaoui, O.; Gomri, D.; Abdallah, A. The effect of a combined high-intensity plyometric and speed training program on the running and jumping ability of male handball players. Asian J. Sports Med. 2012, 3, 21. [Google Scholar]
- Nikolaidis, P.T.; Afonso, J.; Busko, K. Differences in anthropometry, somatotype, body composition and physiological characteristics of female volleyball players by competition level. Sport Sci. Health 2015, 11, 29–35. [Google Scholar] [CrossRef]
- Sattler, T.; Sekulic, D.; Esco, M.R.; Mahmutovic, I.; Hadzic, V. Analysis of the association between isokinetic knee strength with offensive and defensive jumping capacity in high-level female volleyball athletes. J. Sci. Med. Sport 2015, 18, 613–618. [Google Scholar] [CrossRef] [PubMed]
- Smith, D.; Roberts, D.; Watson, B. Physical, physiological and performance differences between Canadian national team and universiade volleyball players. J. Sports Sci. 1992, 10, 131–138. [Google Scholar] [CrossRef] [PubMed]
- Borg, G.; Hassmén, P.; Lagerström, M. Perceived exertion related to heart rate and blood lactate during arm and leg exercise. Eur. J. Appl. Physiol. Occup. Physiol. 1987, 56, 679–685. [Google Scholar] [CrossRef] [PubMed]
- Foster, C.; Florhaug, J.A.; Franklin, J.; Gottschall, L.; Hrovatin, L.A.; Parker, S.; Doleshal, P.; Dodge, C. A new approach to monitoring exercise training. J. Strength Cond. Res. 2001, 15, 109–115. [Google Scholar] [PubMed]
- Foster, C.; Hector, L.L.; Welsh, R.; Schrager, M.; Green, M.A.; Snyder, A.C. Effects of specific versus cross-training on running performance. Eur. J. Appl. Physiol. Occup. Physiol. 1995, 70, 367–372. [Google Scholar] [CrossRef]
- Vlantes, T.G.; Readdy, T. Using microsensor technology to quantify match demands in collegiate Women’s volleyball. J. Strength Cond. Res. 2017, 31, 3266–3278. [Google Scholar] [CrossRef] [PubMed]
- Bridgett, L.A.; Linthorne, N.P. Changes in long jump take-off technique with increasingrun-up speed. J. Sports Sci. 2006, 24, 889–897. [Google Scholar] [CrossRef]
- Fuchs, P.X.; Fusco, A.; Bell, J.W.; von Duvillard, S.P.; Cortis, C.; Wagner, H. Movement characteristics of volleyball spike jump performance in females. J. Sci. Med. Sport 2019, 22, 833–837. [Google Scholar] [CrossRef]
- Ikeda, Y.; Sasaki, Y.; Hamano, R. Factors influencing spike jump height in female college volleyball players. J. Strength Cond. Res. 2018, 32, 267–273. [Google Scholar] [CrossRef]
- Wagner, H.; Tilp, M.; Von Duvillard, S.; Müller, E. Kinematic analysis of volleyball spike jump. Int. J. Sports Med. 2009, 30, 760–765. [Google Scholar] [CrossRef]
| Training | Monday | Tuesday | Wednesday | Thursday | Friday |
|---|---|---|---|---|---|
| Warm-up | Coordination with balls | General Development | Individual–general development | Strength aspect | Coordination |
| Technical part | -Defense technique and repetition -Attack-Block | -Pair bounces -Diagonal Attack-Defense | -Setters-Zone IV and II exposition-Defense in function zone -Oblique attack continuity | -Bounces and light attacks over the net in pairs -Reception of the serving -Attack after the reception | -Block -Attack and block -Complex I game |
| Specialist part | Fragments of a 6 × 6 game | -Complex I by function -Fragment of a Game 6 × 6 | -Complex II 6 × 6 | Defense and counter-attack-fragment 1 × 1 -Fragment of a Game 6 × 6 | -Complex I 6 × 6 |
| Other | -Gym 2 × 10/6rep 60–80%RM -Fitness tests | Non | Non | Gym-10 stages 2 × 8 rep–speed accent | 15 min serve technique at the end of the training |
| Duration | 2 h (1 h 07 min volleyball training time) | 2 h 15 min 1 h 27 min volleyball training | 3 h 15 min 2 h 47 min volleyball training | 4 h 3 h 40 min volleyball training | 3 h 2 h 17 min volleyball training |
| Variable | Mean | SD | CI −95% | CI +95% | SEM | ICC | CA | CV | t t-Test | p t-Test | |
|---|---|---|---|---|---|---|---|---|---|---|---|
| SJ | pre | 27.25 | 4.05 | 24.53 | 29.96 | 1.22 | |||||
| post | 27.70 | 3.72 | 25.2 | 30.2 | 1.12 | 0.505 | 0.671 | 0.07272727 | −0.39 | 0.705 | |
| CMJ | pre | 27.59 | 3.01 | 25.57 | 29.61 | 0.91 | |||||
| post | 29.54 | 3.90 | 26.91 | 32.16 | 1.18 | 0.787 | 0.881 | 0.06363636 | −2.841 | 0.018 * | |
| CMJA | pre | 32.38 | 4.59 | 29.3 | 35.47 | 1.38 | |||||
| post | 33.43 | 4.89 | 30.14 | 36.71 | 1.47 | 0.903 | 0.949 | 0.03727273 | −1.657 | 0.128 | |
| Contact time AJ | pre | 0.39 | 0.05 | 0.36 | 0.43 | 0.02 | |||||
| post | 0.37 | 0.04 | 0.35 | 0.4 | 0.01 | 0.579 | 0.733 | 0.05727273 | 1.759 | 0.109 | |
| AJ | pre | 40.41 | 6.66 | 35.94 | 44.88 | 2.01 | |||||
| post | 41.64 | 5.87 | 37.69 | 45.58 | 1.77 | 0.904 | 0.949 | 0.04272727 | −1.477 | 0.17 | |
| BJ | pre | 31.88 | 3.90 | 29.27 | 34.5 | 1.18 | |||||
| post | 32.41 | 4.82 | 29.17 | 35.64 | 1.45 | 0.92 | 0.958 | 0.02727273 | −0.998 | 0.342 | |
| 20 m | pre | 3.43 | 0.41 | 3.16 | 3.71 | 0.12 | |||||
| post | 3.51 | 0.15 | 3.41 | 3.61 | 0.05 | 0.486 | 0.654 | 0.03454545 | −0.861 | 0.409 | |
| Variable | RPE p-Value | Pearson Correlation | s-RPE p-Value | Pearson Correlation |
|---|---|---|---|---|
| Total Player Load | 0.004 | 0.387 ** | 0.004 | 0.388 ** |
| AVG Heart Rate | 0.081 | −0.242 | 0.267 | −0.155 |
| IMA Jump Count Low Band | 0.002 | 0.421 ** | 0.000 | 0.497 ** |
| IMA Jump Count Med Band | 0.078 | 0.244 | 0.043 | 0.279 * |
| IMA Jump Count High Band | 0.256 | 0.159 | 0.872 | 0.023 |
| Mean Total Jumps | 0.019 | 0.320 * | 0.030 | 0.298 * |
| Total Jumps Count | 0.019 | 0.320 * | 0.030 | 0.298 * |
| IMA Accel Low | 0.001 | 0.448 ** | 0.001 | 0.456 ** |
| IMA Accel Medium | 0.003 | 0.397 ** | 0.001 | 0.453 ** |
| IMA Accel High | 0.060 | 0.258 | 0.024 | 0.307 * |
| Total IMA Accel | 0.00 | 0.480 ** | 0.000 | 0.515 ** |
| IMA Decel Low | 0.001 | 0.448 ** | 0.006 | 0.370 ** |
| IMA Decel Medium | 0.049 | 0.270 * | 0.058 | 0.259 |
| IMA Decel High | 0.49 | 0.270 * | 0.053 | 0.265 |
| Total Decel | 0.001 | 0.436 ** | 0.006 | 0.369 ** |
| ACC/DEC | 0.768 | 0.041 | 0.238 | 0.163 |
| AVG Heart Rate | 0.081 | −0.242 | 0.267 | −0.155 |
| SUM Total Accel; Decel | 0.000 | 0.514 ** | 0.000 | 0.486 ** |
| SUM TOTAL JUMP; Accel; Decel | 0.001 | 0.444 ** | 0.002 | 0.421 ** |
| Variable | IMA Jump Count Low Band | IMA Jump Count Med Band | IMA Jump Count High Band | Mean Total Jumps | Total Jumps Count |
|---|---|---|---|---|---|
| IMA Accel Low | 0.495 ** | 0.253 | 0.384 ** | 0.498 ** | 0.498 ** |
| IMA Accel Medium | 0.547 ** | 0.371 ** | 0.278 | 0.487 ** | 0.487 ** |
| IMA Accel High | 0.522 ** | 0.069 | 0.266 | 0.242 | 0.242 |
| TOTAL IMA ACCEL | 0.576 ** | 0.274 | 0.355 * | 0.492 ** | 0.492 ** |
| IMA Decel Low | 0.421 ** | 0.548 ** | 0.601 ** | 0.752 * | 0.752 * |
| IMA Decel Medium | 0.509 ** | 0.490 ** | 0.539 ** | 0.696 ** | 0.696 ** |
| IMA Decel High | 0.342 * | 0.396 ** | 0.331 * | 0.578 ** | 0.578 ** |
| Total IMA Decel | 0.454 ** | 0.548 ** | 0.617 ** | 0.773 ** | 0.773 ** |
| Accel/Decel | −0.020 | −0.359 ** | −0.403 ** | −0.410 ** | −0.410 ** |
| RPE | ||||||
|---|---|---|---|---|---|---|
| N = 53 | b* | Std. Error | b | Std. Error | t(50) | p |
| of b* | of b | |||||
| 20 m Free run-up | 3.954 | 0.283 | 13.980 | 0.000 | ||
| IMA Jump Count High Band | −0.383 | 0.140 | −0.015 | 0.006 | −2.741 | 0.009 |
| TOTAL IMA ACCEL | 0.367 | 0.140 | 0.009 | 0.004 | 2.627 | 0.011 |
| 20 m Free run-up | 3.068 | 0.519 | 5.915 | 0 | ||
| Accel/Decel | 0.339 | 0.143 | 0.914 | 0.385 | 2.376 | 0.021 |
| IMA Jump Count High Band | −0.393 | 0.156 | −0.016 | 0.006 | −2.513 | 0.015 |
| Mean Total Jumps | 0.456 | 0.166 | 0.024 | 0.009 | 2.756 | 0.008 |
| s-RPE | ||||||
| N = 53 | b* | Std. Error | b | Std. Error | t(50) | p |
| of b* | of b | |||||
| Free run-up | −85.958 | 158.896 | −0.541 | 0.591 | ||
| TOTAL IMA ACCEL | 0.359 | 0.124 | 2.880 | 0.995 | 2.896 | 0.006 |
| IMA Jump Count Low Band | 0.357 | 0.124 | 12.741 | 4.435 | 2.873 | 0.006 |
| Player Load Per Minute | 0.249 | 0.111 | 79.429 | 35.239 | 2.254 | 0.029 |
Publisher’s Note: MDPI stays neutral with regard to jurisdictional claims in published maps and institutional affiliations. |
© 2022 by the authors. Licensee MDPI, Basel, Switzerland. This article is an open access article distributed under the terms and conditions of the Creative Commons Attribution (CC BY) license (https://creativecommons.org/licenses/by/4.0/).
Share and Cite
Pawlik, D.; Mroczek, D. Fatigue and Training Load Factors in Volleyball. Int. J. Environ. Res. Public Health 2022, 19, 11149. https://doi.org/10.3390/ijerph191811149
Pawlik D, Mroczek D. Fatigue and Training Load Factors in Volleyball. International Journal of Environmental Research and Public Health. 2022; 19(18):11149. https://doi.org/10.3390/ijerph191811149
Chicago/Turabian StylePawlik, Damian, and Dariusz Mroczek. 2022. "Fatigue and Training Load Factors in Volleyball" International Journal of Environmental Research and Public Health 19, no. 18: 11149. https://doi.org/10.3390/ijerph191811149
APA StylePawlik, D., & Mroczek, D. (2022). Fatigue and Training Load Factors in Volleyball. International Journal of Environmental Research and Public Health, 19(18), 11149. https://doi.org/10.3390/ijerph191811149