
Is the Combination of Aerobic Exercise with Mat Pilates Better than Mat Pilates Training Alone on Autonomic Modulation Related to Functional Outcomes in Hypertensive Women? Secondary Analysis of a Randomized Controlled Trial

 , , , ,
Abstract
:1. Introduction
2. Materials and Methods
2.1. Subjects
2.2. Training Protocol
2.3. Outcomes
2.3.1. Cardiac Autonomic Modulation
2.3.2. Cardiorespiratory Fitness
2.3.3. Strength, Flexibility, and Functional Tasks
2.3.4. Quality of Life
2.3.5. Anthropometry
2.3.6. Clinical Blood Pressure and Heart Rate
2.4. Statistical Analyses and Sample Size
3. Results
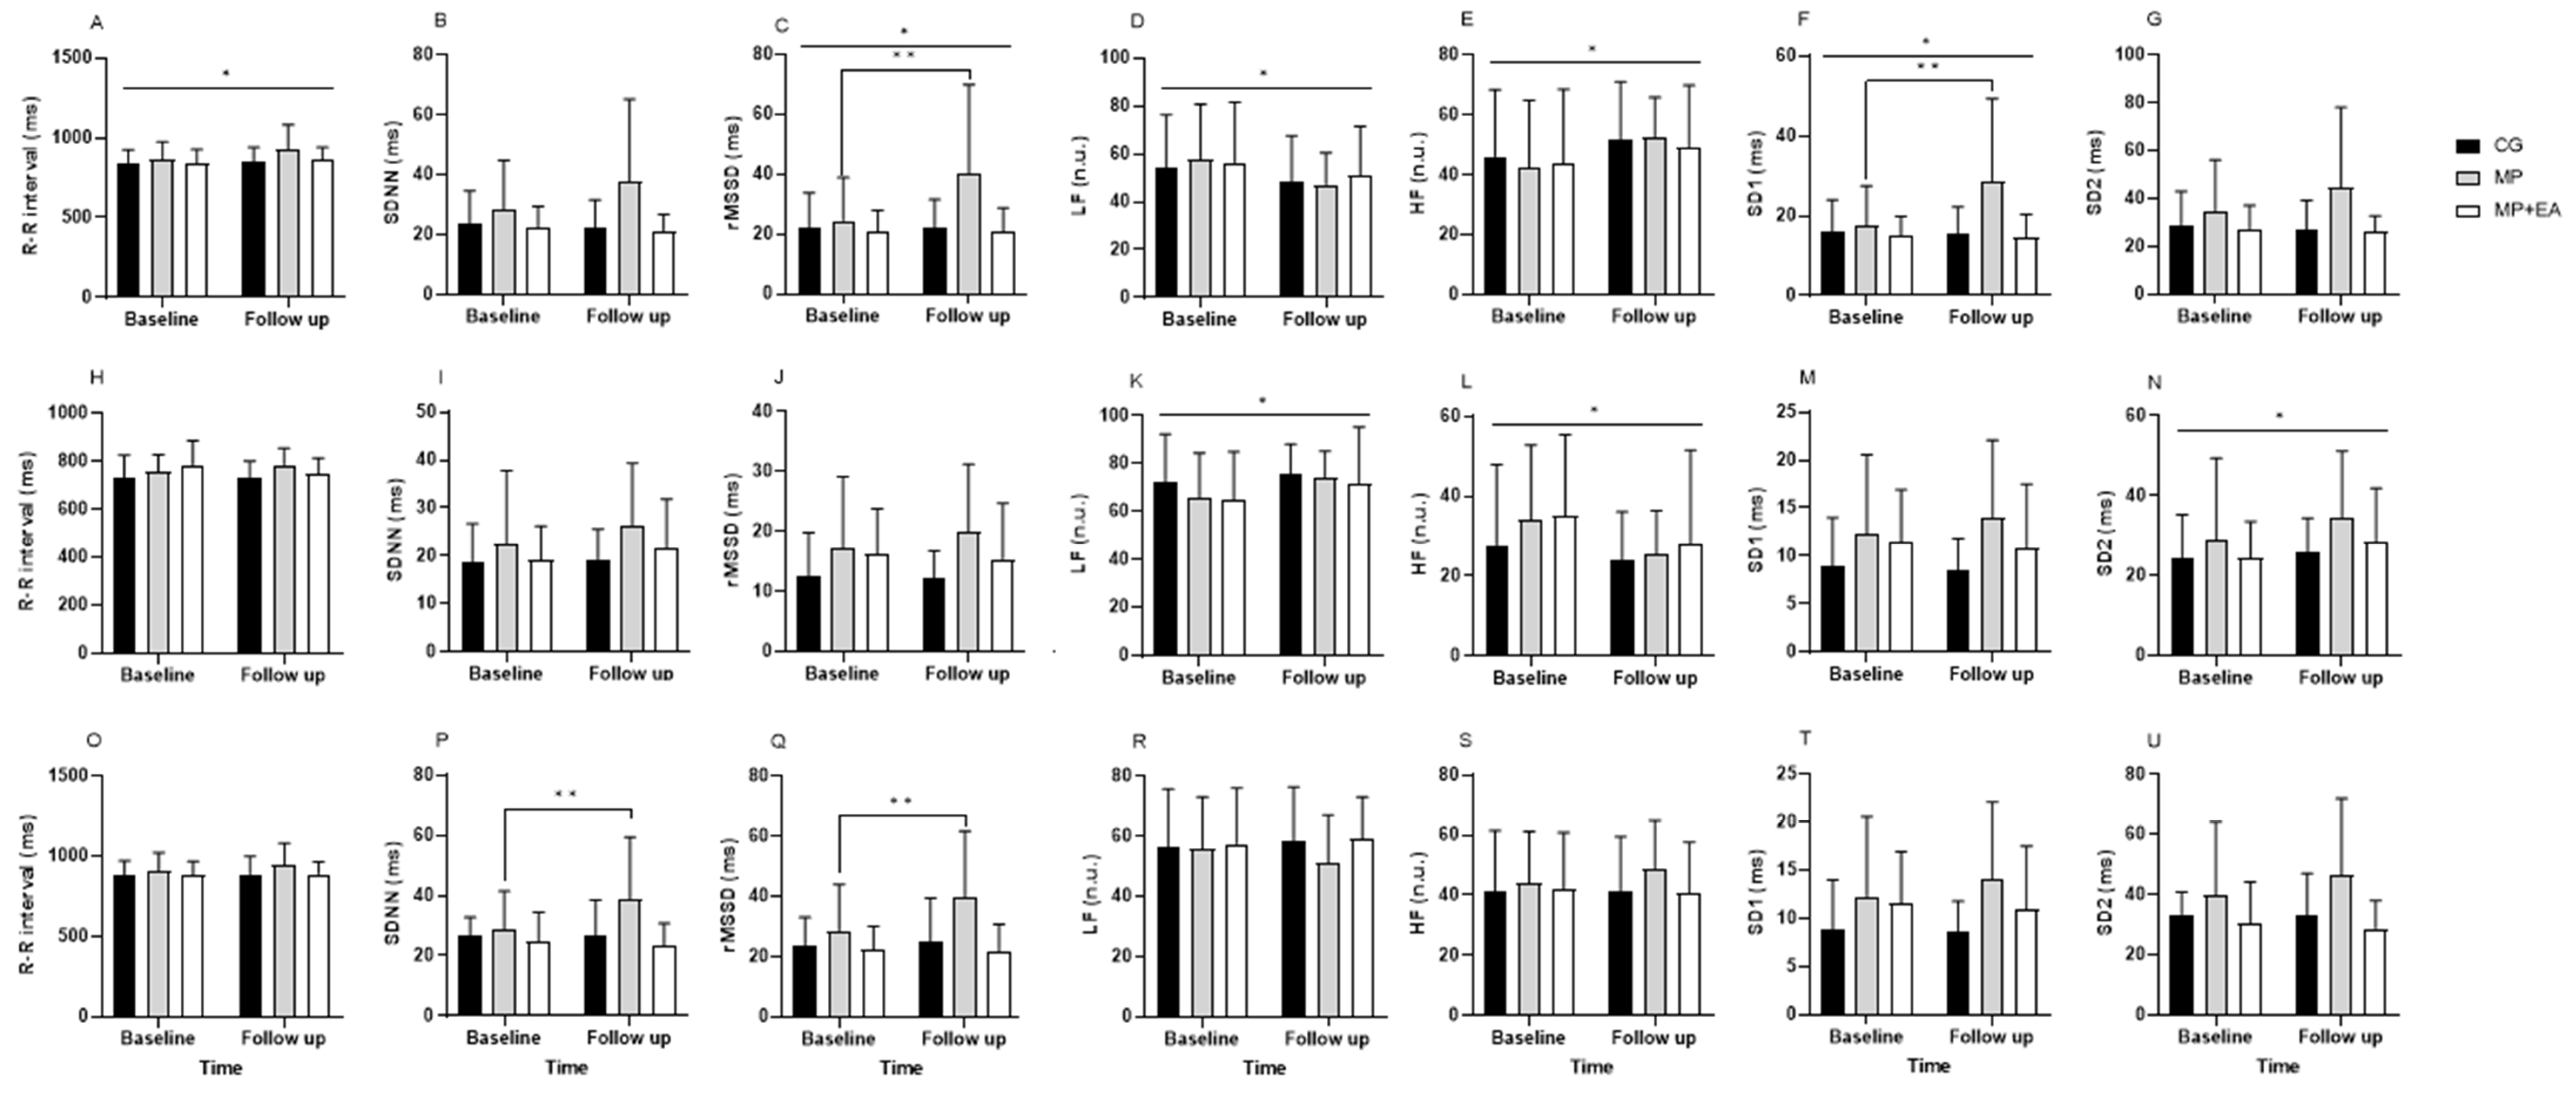
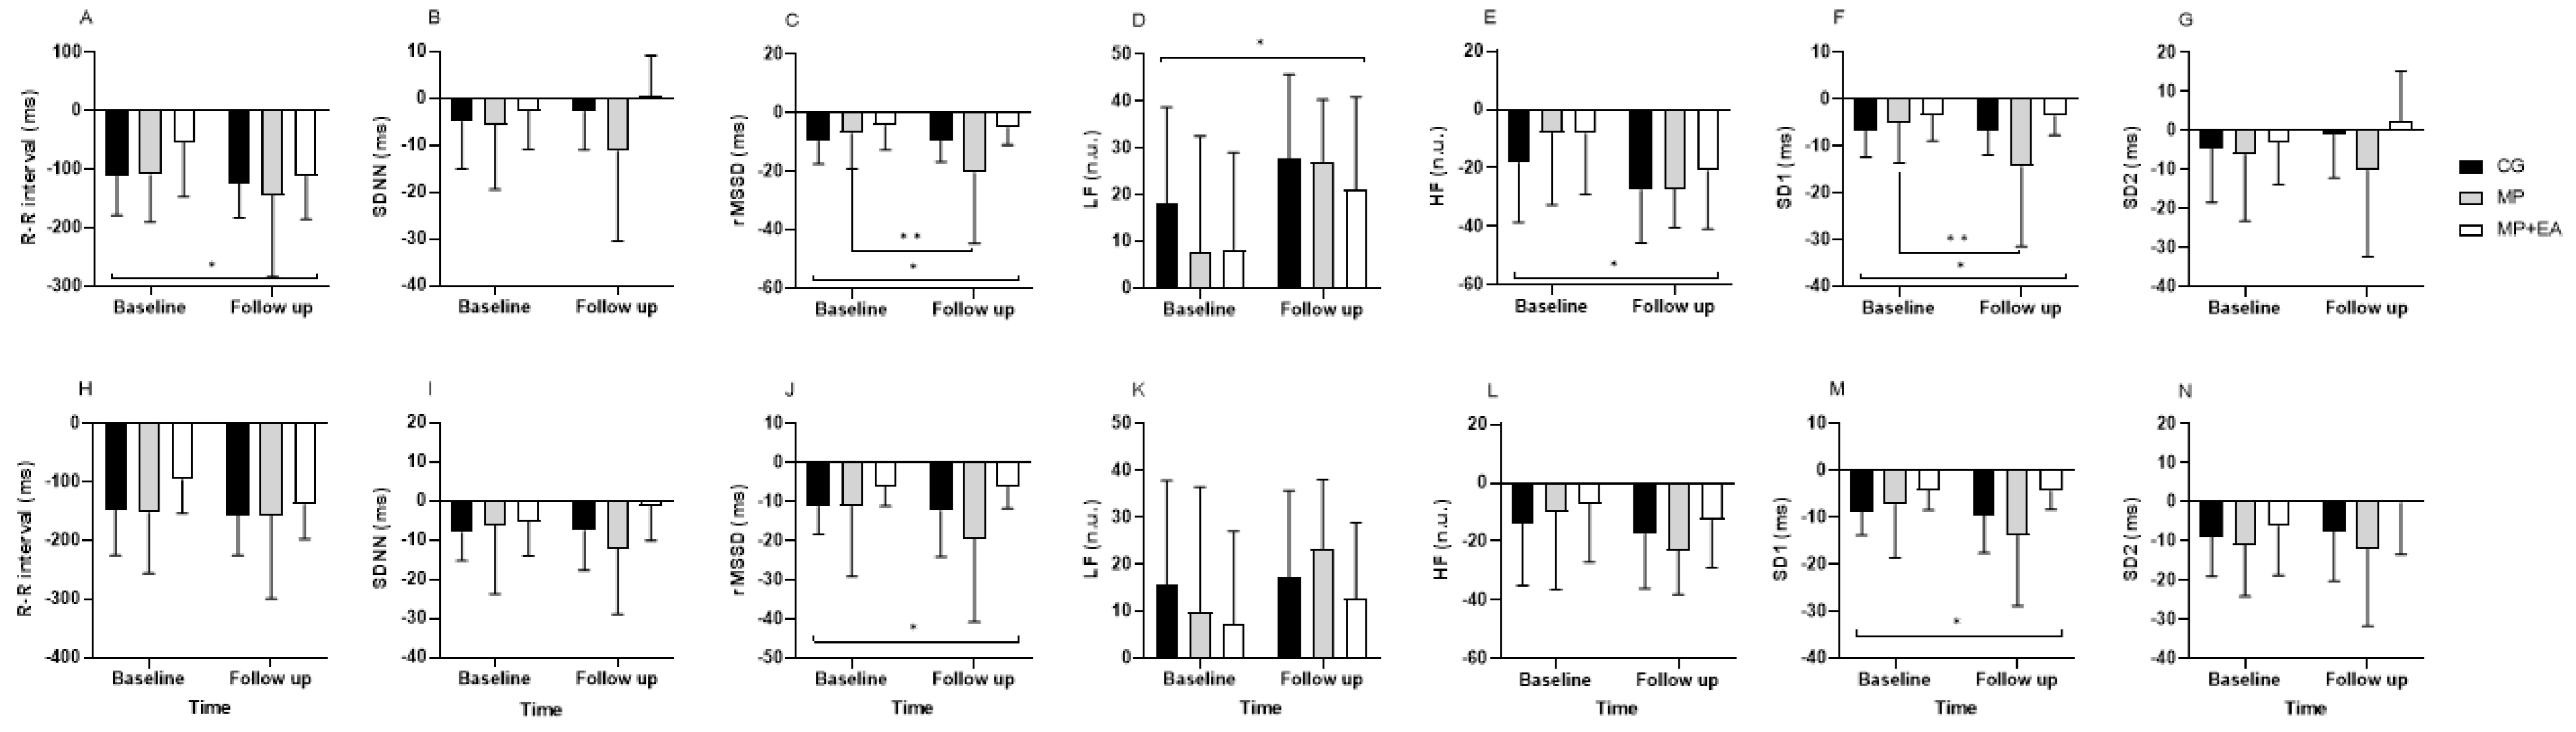
3.1. Cardiac Autonomic Modulation
3.2. Cardiorespiratory Fitness
3.3. Strength, Flexibility, and Functional Tasks
3.4. Quality of life
3.5. Anthropometric Analysis
3.6. Clinical Hemodynamic Analyses
4. Discussion
5. Conclusions
Author Contributions
Funding
Institutional Review Board Statement
Informed Consent Statement
Data Availability Statement
Acknowledgments
Conflicts of Interest
References
- Whelton, P.K.; Carey, R.M.; Aronow, W.S.; Casey, D.E.; Collins, K.J.; Dennison Himmelfarb, C.; DePalma, S.M.; Gidding, S.; Jamerson, K.A.; Jones, D.W.; et al. 2017 ACC/AHA/AAPA/ABC/ACPM/AGS/APhA/ASH/ASPC/NMA/PCNA Guideline for the Prevention, Detection, Evaluation, and Management of High Blood Pressure in Adults: Executive Summary: A Report of the American College of Cardiology/American Heart Association Task F. Hypertension 2018, 71, 1269–1324. [Google Scholar] [CrossRef] [PubMed]
- WHO. Noncommunicable Diseases Country Profiles 2018; WHO: Geneva, Switzerland, 2018; ISBN 9789241514620.
- Malachias, M.; Souza, W.; Plavnik, F.; Rodrigues, C.; Brandão, A.; Neves, M.; Bortolotto, L.; Franco, R.; Figueiredo, C.; Jardim, P.; et al. 7th Diretriz Brasileira de Hipertensão Arterial. Arq. Bras. Cardiol. 2016, 107, 1–76. [Google Scholar] [CrossRef] [PubMed]
- Fagard, R.H. Exercise Therapy in Hypertensive Cardiovascular Disease. Prog. Cardiovasc. Dis. 2011, 53, 404–411. [Google Scholar] [CrossRef] [PubMed]
- Gonzáles, A.I.; Nery, T.; Fragnani, S.G.; Pereira, F.; Lemos, R.R.; Bezerra, P.P.; Haas, P. Pilates Exercise for Hypertensive Patients: A Review of the Literature. Altern. Ther. Health Med. 2016, 22, 38–43. [Google Scholar]
- Pescatello, L.S.; MacDonald, H.V.; Lamberti, L.; Johnson, B.T. Exercise for Hypertension: A Prescription Update Integrating Existing Recommendations with Emerging Research. Curr. Hypertens. Rep. 2015, 17, 87. [Google Scholar] [CrossRef]
- Riebe, D.; Ehrman, J.K.; Liguori, G.; Magal, M. ACSM’s Guidelines for Exercise Testing and Prescription, 10th ed.; Riebe, D., Ehrman, J.K., Liguori, G., Magal, M., Eds.; Wolters Klumer Health: Philadelphia, PA, USA, 2018; ISBN 9781496339065. [Google Scholar]
- Hackam, D.G.; Quinn, R.R.; Ravani, P.; Rabi, D.M.; Dasgupta, K.; Daskalopoulou, S.S.; Khan, N.A.; Herman, R.J.; Bacon, S.L.; Cloutier, L.; et al. The 2013 Canadian Hypertension Education Program Recommendations for Blood Pressure Measurement, Diagnosis, Assessment of Risk, Prevention, and Treatment of Hypertension. Can. J. Cardiol. 2013, 29, 528–542. [Google Scholar] [CrossRef]
- Bullo, V.; Bergamin, M.; Gobbo, S.; Sieverdes, J.C.; Zaccaria, M.; Neunhaeuserer, D.; Ermolao, A. The Effects of Pilates Exercise Training on Physical Fitness and Wellbeing in the Elderly: A Systematic Review for Future Exercise Prescription. Prev. Med. 2015, 75, 1–11. [Google Scholar] [CrossRef]
- Bueno De Souza, R.O.; Marcon, L.D.F.; De Arruda, A.S.F.; Pontes Junior, F.L.; De Melo, R.C. Effects of Mat Pilates on Physical Functional Performance of Older Adults: A Meta-Analysis of Randomized Controlled Trials. Am. J. Phys. Med. Rehabil. 2018, 97, 414–425. [Google Scholar] [CrossRef]
- Cruz-Ferreira, A.; Fernandes, J.; Laranjo, L.; Bernardo, L.M.; Silva, A. A Systematic Review of the Effects of Pilates Method of Exercise in Healthy People. Arch. Phys. Med. Rehabil. 2011, 92, 2071–2081. [Google Scholar] [CrossRef]
- Fernández-Rodríguez, R.; Álvarez-Bueno, C.; Ferri-Morales, A.; Torres-Costoso, A.I.; Cavero-Redondo, I.; Martínez-Vizcaíno, V. Pilates Method Improves Cardiorespiratory Fitness: A Systematic Review and Meta-Analysis. J. Clin. Med. 2019, 8, 1761. [Google Scholar] [CrossRef]
- Von Sperling de Souza, M.; Brum Vieira, C. Who Are the People Looking for the Pilates Method? J. Bodyw. Mov. Ther. 2006, 10, 328–334. [Google Scholar] [CrossRef]
- da Silva Almeida, I.; de Souza Andrade, L.; Sousa, A.M.M.; Junior, G.C.; Turri-Silva, N.; Cunha Nascimento, D.; Mota, Y.L.; Durigan, J.L.Q. The Effect of Mat Pilates Training Combined with Aerobic Exercise Versus Mat Pilates Training Alone on Blood Pressure in Women with Hypertension: A Randomized Controlled Trial. Phys. Ther. 2022, 102, pzab258. [Google Scholar] [CrossRef] [PubMed]
- Martins-Meneses, D.T.; Antunes, H.K.M.; de Oliveira, N.R.C.; Medeiros, A. Mat Pilates Training Reduced Clinical and Ambulatory Blood Pressure in Hypertensive Women Using Antihypertensive Medications. Int. J. Cardiol. 2015, 179, 262–268. [Google Scholar] [CrossRef] [PubMed]
- Marinda, F.; Magda, G.; Ina, S.; Brandon, S.; Abel, T.; Goon, D. Ter Effects of a Mat Pilates Programme on Body Composition in Elderly Women. West Indian Med. J. 2013, 62, 524–528. [Google Scholar] [CrossRef]
- Rocha, J.; Cunha, F.A.; Cordeiro, R.; Monteiro, W.; Pescatello, L.S.; Farinatti, P. Acute Effect of a Single Session of Pilates on Blood Pressure and Cardiac Autonomic Control in Middle-Aged Adults with Hypertension. J. Strength Cond. Res. 2019, 34, 114–123. [Google Scholar] [CrossRef]
- Xhyheri, B.; Manfrini, O.; Mazzolini, M.; Pizzi, C.; Bugiardini, R. Heart Rate Variability Today. Prog. Cardiovasc. Dis. 2012, 55, 321–331. [Google Scholar] [CrossRef]
- Boutron, I.; Altman, D.G.; Moher, D.; Schulz, K.F.; Ravaud, P. CONSORT Statement for Randomized Trials of Nonpharmacologic Treatments: A 2017 Update and a CONSORT Extension for Nonpharmacologic Trial Abstracts. Ann. Intern. Med. 2017, 167, 40–47. [Google Scholar] [CrossRef]
- Hoffmann, T.C.; Glasziou, P.P.; Boutron, I.; Milne, R.; Perera, R.; Moher, D.; Altman, D.G.; Barbour, V.; Macdonald, H.; Johnston, M.; et al. Better Reporting of Interventions: Template for Intervention Description and Replication (TIDieR) Checklist and Guide. BMJ 2014, 348, g1687. [Google Scholar] [CrossRef]
- Matsudo, S.; Araújo, T.; Matsudo, V.; Andrade, D.; Andrade, E.; Oliveira, L.C.; Braggion, G. Questionário Internacional de Atividade Física (Ipaq): Estudo de Validade e Reprodutibilidade No Brasil. Rev. Bras. Atividade Física Saúde 2001, 6, 5–18. [Google Scholar] [CrossRef]
- Heyward, V.H. Avaliação Física e Prescrição de Exercício: Técnicas Avançadas; Artmed: Porto Alegre, Brasil, 2013; ISBN 978-85-363-2623-8. [Google Scholar]
- Stott, M. Comprehensive Matwork Manual; Merrithew Corporation: Toronto, ON, Canada, 2001. [Google Scholar]
- Niskanen, J.P.; Tarvainen, M.P.; Ranta-Aho, P.O.; Karjalainen, P.A. Software for Advanced HRV Analysis. Comput. Methods Programs Biomed. 2004, 76, 73–81. [Google Scholar] [CrossRef]
- Catai, A.M.; Pastre, C.M.; de Godoy, M.F.; da Silva, E.; de Medeiros Takahashi, A.C.; Vanderlei, L.C.M. Heart Rate Variability: Are You Using It Properly? Standardisation Checklist of Procedures. Braz. J. Phys. Ther. 2020, 24, 91–102. [Google Scholar] [CrossRef] [PubMed]
- Task Force of the European Society of Cardiology and The North American Society of Pacing and Electrophysiology. Heart Rate Variability: Standards of Measurement, Physiological Interpretation, and Clinical Use; Jelinek, H.F., Cornforth, D.J., Khandoker, A.H., Eds.; CRC Press: Boca Raton, FL, USA, 1996; Volume 93, ISBN 9781315372921. [Google Scholar]
- Balady, G.J.; Arena, R.; Sietsema, K.; Myers, J.; Coke, L.; Fletcher, G.F.; Forman, D.; Franklin, B.; Guazzi, M.; Gulati, M.; et al. Clinician’s Guide to Cardiopulmonary Exercise Testing in Adults. Circulation 2010, 122, 191–225. [Google Scholar] [CrossRef] [PubMed]
- Barbosa e SIlva, O.; Sobral Filho, D.C. Uma Nova Proposta Para Orientar a Velocidade e Inclinação No Protocolo Em Rampa Na Esteira Ergométrica. Arq. Bras. Cardiol. 2003, 81, 42–47. [Google Scholar]
- Wells, K.F.; Dillon, E.K. The Sit and Reach—A Test of Back and Leg Flexibility. Res. Q. 1952, 23, 115–118. [Google Scholar] [CrossRef]
- Raso, V. A Adiposidade Corporal e a Idade Prejudicam a Capacidade Funcional Para Realizar as Atividades Da Vida Diária de Mulheres Acima de 47 Anos. Rev. Bras. Med. Esporte 2002, 8, 225–234. [Google Scholar] [CrossRef]
- Fleck, M.P.; Louzada, S.; Xavier, M.; Chachamovich, E.; Vieira, G.; Santos, L.; Pinzon, V. Application of the Portuguese Version of the Abbreviated Instrument of Quality Life WHOQOL-Bref. Rev. Saude Publica 2000, 34, 178–183. [Google Scholar] [CrossRef]
- Armstrong, R.A. When to Use the Bonferroni Correction. Ophthalmic Physiol. Opt. 2014, 34, 502–508. [Google Scholar] [CrossRef]
- Lakens, D. Calculating and Reporting Effect Sizes to Facilitate Cumulative Science: A Practical Primer for t-Tests and ANOVAs. Front. Psychol. 2013, 4, 1–12. [Google Scholar] [CrossRef]
- Cohen, J. Statistical Power Analysis for the Behavioral Sciences, 2nd ed.; Lawrence Erlbaum Associates Publishers: Hillsdale, NY, USA, 1988; ISBN 0805802835. [Google Scholar]
- Caruso, F.R.; Arena, R.; Phillips, S.A.; Bonjorno, J.C.; Mendes, R.G.; Arakelian, V.M.; Bassi, D.; Nogi, C.; Borghi-Silva, A. Resistance Exercise Training Improves Heart Rate Variability and Muscle Performance: A Randomized Controlled Trial in Coronary Artery Disease Patients. Eur. J. Phys. Rehabil. Med. 2015, 51, 281–289. [Google Scholar]
- Jandackova, V.K.; Scholes, S.; Britton, A.; Steptoe, A. Are Changes in Heart Rate Variability in Middle-Aged and Older People Normative or Caused by Pathological Conditions? Findings from a Large Population-Based Longitudinal Cohort Study. J. Am. Heart Assoc. 2016, 5, e002365. [Google Scholar] [CrossRef]
- Da Costa de Rezende Barbosa, M.P.; da Silva, N.T.; de Azevedo, F.M.; Pastre, C.M.; Vanderlei, L.C.M. Comparison of Polar® RS800G3TM Heart Rate Monitor with Polar® S810iTM and Electrocardiogram to Obtain the Series of RR Intervals and Analysis of Heart Rate Variability at Rest. Clin. Physiol. Funct. Imaging 2016, 36, 112–117. [Google Scholar] [CrossRef] [PubMed]
- Neves, V.; Perpétuo, N.; Sakabe, D.; Catai, A.; Gallo, L., Jr.; Silva de Sá, M.; Martins, L.; Silva, E. Análise Dos Índices Espectrais Da Variabilidade da Freqüência Cardíaca Em Homens de Meia Idade e Mulheres Na Pós-Menopausa. Rev. Bras. Fisioter. 2006, 10, 401–406. [Google Scholar] [CrossRef]
- Ribeiro, T.F.; Azevedo, G.D.; Crescêncio, J.C.; Marães, V.R.F.S.; Papa, V.; Catai, A.M.; Verzola, R.M.M.; Oliveira, L.; Silva de Sá, M.F.; Gallo, L.; et al. Heart Rate Variability under Resting Conditions in Postmenopausal and Young Women. Braz. J. Med. Biol. Res. 2001, 34, 871–877. [Google Scholar] [CrossRef] [PubMed] [Green Version]
- Zou, L.; Sasaki, J.; Wei, G.-X.; Huang, T.; Yeung, A.; Neto, O.; Chen, K.; Hui, S. Effects of Mind–Body Exercises (Tai Chi/Yoga) on Heart Rate Variability Parameters and Perceived Stress: A Systematic Review with Meta-Analysis of Randomized Controlled Trials. J. Clin. Med. 2018, 7, 404. [Google Scholar] [CrossRef] [PubMed]
- Guimarães, G.V.; Carvalho, V.O.; Bocchi, E.A.; D’Avila, V.M. Pilates in Heart Failure Patients: A Randomized Controlled Pilot Trial. Cardiovasc. Ther. 2012, 30, 351–356. [Google Scholar] [CrossRef]
- Rayes, A.B.R.; de Lira, C.A.B.; Viana, R.B.; Benedito-Silva, A.A.; Vancini, R.L.; Mascarin, N.; Andrade, M.S. The Effects of Pilates vs. Aerobic Training on Cardiorespiratory Fitness, Isokinetic Muscular Strength, Body Composition, and Functional Tasks Outcomes for Individuals Who Are Overweight/Obese: A Clinical Trial. PeerJ 2019, 7, 1–26. [Google Scholar] [CrossRef]
- Finatto, P.; Da Silva, E.S.; Okamura, A.B.; Almada, B.P.; Oliveira, H.B.; Peyré-Tartaruga, L.A. Pilates Training Improves 5-Km Run Performance by Changing Metabolic Cost and Muscle Activity in Trained Runners. PLoS ONE 2018, 13, e0196509. [Google Scholar] [CrossRef]
- Tinoco-Fernández, M.; Jiménez-Martín, M.; Sánchez-Caravaca, M.A.; Fernández-Pérez, A.M.; Ramírez-Rodrigo, J.; Villaverde-Gutiérrez, C. The Pilates Method and Cardiorespiratory Adaptation to Training. Res. Sport. Med. 2016, 24, 281–286. [Google Scholar] [CrossRef]
- Irez, G.B.; Ozdemir, R.A.; Evin, R.; Irez, S.G.; Korkusuz, F. Integrating Pilates Exercise into an Exercise Program for 65+ Year-Old Women to Reduce Falls. J. Sport. Sci. Med. 2011, 10, 105–111. [Google Scholar]
- Kloubec, J.A. Pilates for Improvement of Muscle Endurance, Flexibility, Balance, and Posture. J. Strength Cond. Res. 2010, 24, 661–667. [Google Scholar] [CrossRef]
- Sekendiz, B.; Altun, Ö.; Korkusuz, F.; Akin, S. Effects of Pilates Exercise on Trunk Strength, Endurance and Flexibility in Sedentary Adult Females. J. Bodyw. Mov. Ther. 2007, 11, 318–326. [Google Scholar] [CrossRef]
- De Oliveira Francisco, C.; de Almeida Fagundes, A.; Gorges, B. Effects of Pilates Method in Elderly People: Systematic Review of Randomized Controlled Trials. J. Bodyw. Mov. Ther. 2015, 19, 500–508. [Google Scholar] [CrossRef] [PubMed]
- Vancini, R.L.; Rayes, A.B.R.; de Lira, C.A.B.; Sarro, K.J.; Andrade, M.S. Pilates and Aerobic Training Improve Levels of Depression, Anxiety and Quality of Life in Overweight and Obese Individuals. Arq. Neuropsiquiatr. 2017, 75, 850–857. [Google Scholar] [CrossRef]
- Pescatello, L.S.; Franklin, B.A.; Robert Fagard, M.D.; Farquhar, W.B.; Kelley, G.A.; Ray, C.A. Exercise and Hypertension. Med. Sci. Sports Exerc. 2004, 36, 533–553. [Google Scholar] [CrossRef]
- Jago, R.; Jonker, M.L.; Missaghian, M.; Baranowski, T. Effect of 4 Weeks of Pilates on the Body Composition of Young Girls. Prev. Med. 2006, 42, 177–180. [Google Scholar] [CrossRef]
- Rhéaume, C.; Leblanc, M.V.; Poirier, P. Adiposity Assessment: Explaining the Association between Obesity, Hypertension and Stroke. Expert Rev. Cardiovasc. Ther. 2011, 9, 1557–1564. [Google Scholar] [CrossRef]
- Zhu, S.K.; Wang, Z.M.; Heshka, S.; Heo, M.; Faith, M.S.; Heymsfield, S.B. Waist Circumference and Obesity-Associated Risk Factors among Whites in the Third National Health and Nutrition Examination Survey: Clinical Action Thresholds. Am. J. Clin. Nutr. 2002, 76, 743–749. [Google Scholar] [CrossRef] [PubMed] [Green Version]

| Within-Group | Between-Group | |||||||
|---|---|---|---|---|---|---|---|---|
| F | Power | Effect Size | p-Value | F | Power | Effect Size | p-Value | |
| Data of heart rate variability indices | ||||||||
| Supine | ||||||||
| R-R interval (ms) | 6.61 | 0.70 | 0.02 | 0.01 * | 1.40 | 0.28 | 0.01 | 0.25 |
| SDNN (ms) | 1.77 | 0.25 | 0.007 | 0.19 | 3.65 | 0.63 | 0.03 | 0.03 * |
| rMSSD (ms) | 4.54 | 0.54 | 0.03 | 0.03 * | 4.79 | 0.76 | 0.06 | 0.01 *† |
| LF (n.u.) | 4.80 | 0.57 | 0.03 | 0.03 * | 0.23 | 0.08 | 0.003 | 0.78 |
| HF (n.u.) | 4.68 | 0.55 | 0.03 | 0.03 * | 0.22 | 0.08 | 0.002 | 0.80 |
| SD1 (ms) | 4.40 | 0.53 | 0.02 | 0.04 * | 4.86 | 0.76 | 0.06 | 0.01 *† |
| SD2 (ms) | 0.95 | 0.15 | 0.003 | 0.33 | 2.96 | 0.54 | 0.02 | 0.06 |
| Standing | ||||||||
| R-R interval (ms) | 0.03 | 0.05 | 0.0002 | 0.86 | 1.50 | 0.30 | 0.02 | 0.23 |
| SDNN (ms) | 3.45 | 0.44 | 0.01 | 0.07 | 0.55 | 0.13 | 0.004 | 0.57 |
| rMSSD (ms) | 0.12 | 0.06 | 0.0006 | 0.72 | 0.66 | 0.15 | 0.006 | 0.52 |
| LF (n.u.) | 4.46 | 0.53 | 0.03 | 0.04 * | 0.23 | 0.08 | 0.003 | 0.79 |
| HF (n.u.) | 4.48 | 0.54 | 0.03 | 0.04 * | 0.23 | 0.08 | 0.003 | 0.79 |
| SD1 (ms) | 0.12 | 0.06 | 0.0006 | 0.73 | 0.65 | 0.15 | 0.006 | 0.52 |
| SD2 (ms) | 4.82 | 0.57 | 0.01 | 0.03 * | 0.63 | 0.14 | 0.005 | 0.53 |
| Recovery | ||||||||
| R-R interval (ms) | 1.19 | 0.18 | 0.006 | 0.28 | 0.30 | 0.09 | 0.003 | 0.74 |
| SDNN (ms) | 2.96 | 0.38 | 0.01 | 0.09 | 4.04 | 0.68 | 0.04 | 0.02 *† |
| rMSSD (ms) | 3.96 | 0.49 | 0.01 | 0.053 | 3.54 | 0.62 | 0.03 | 0.03 *† |
| LF (n.u.) | 0.01 | 0.05 | 0.0002 | 0.88 | 0.35 | 0.10 | 0.007 | 0.70 |
| HF (n.u.) | 0.08 | 0.05 | 0.0009 | 0.76 | 0.25 | 0.08 | 0.005 | 0.77 |
| SD1 (ms) | 0.12 | 0.06 | 0.0006 | 0.73 | 0.65 | 0.15 | 0.006 | 0.52 |
| SD2 (ms) | 0.51 | 0.10 | 0.002 | 0.47 | 1.25 | 0.25 | 0.01 | 0.29 |
| Within-Group | Between-Group | |||||||
|---|---|---|---|---|---|---|---|---|
| F | Power | Effect Size | p-Value | F | Power | Effect Size | p-Value | |
| Data of heart rate variability indices | ||||||||
| Delta Stand—Supine (Standing minus Supine) | ||||||||
| R-R interval (ms) | 5.28 | 0.61 | 0.04 | 0.02 * | 0.83 | 0.18 | 0.01 | 0.44 |
| SDNN (ms) | 0.00003 | 0.05 | 0.00003 | 0.99 | 2.22 | 0.42 | 0.01 | 0.12 |
| rMSSD (ms) | 4.86 | 0.57 | 0.03 | 0.03 * | 4.04 | 0.68 | 0.06 | 0.02 *† |
| LF (n.u.) | 12.2 | 0.92 | 0.11 | 0.001 * | 0.53 | 0.13 | 0.01 | 0.58 |
| HF (n.u.) | 12.06 | 0.92 | 0.11 | 0.001 * | 0.52 | 0.12 | 0.01 | 0.59 |
| SD1 (ms) | 4.78 | 0.56 | 0.03 | 0.03 * | 4.17 | 0.70 | 0.06 | 0.02 *† |
| SD2 (ms) | 0.44 | 0.09 | 0.003 | 0.50 | 1.36 | 0.27 | 0.01 | 0.26 |
| Delta Stand—Recovery (Standing minus Recovery) | ||||||||
| R-R interval (ms) | 1.62 | 0.23 | 0.01 | 0.21 | 0.67 | 0.15 | 0.009 | 0.51 |
| SDNN (ms) | 0.11 | 0.06 | 0.0005 | 0.73 | 3.15 | 0.57 | 0.02 | 0.054 |
| rMSSD (ms) | 4.14 | 0.50 | 0.01 | 0.04 * | 2.43 | 0.46 | 0.02 | 0.10 |
| LF (n.u.) | 2.43 | 0.33 | 0.03 | 0.12 | 0.57 | 0.13 | 0.01 | 0.56 |
| HF (n.u.) | 2.92 | 0.38 | 0.03 | 0.09 | 0.44 | 0.11 | 0.01 | 0.64 |
| SD1 (ms) | 4.55 | 0.54 | 0.02 | 0.03 * | 2.61 | 0.48 | 0.02 | 0.08 |
| SD2 (ms) | 1.06 | 0.17 | 0.006 | 0.30 | 0.99 | 0.21 | 0.01 | 0.37 |
| Within-Group Difference (Follow-Up Minus Baseline) | Between-Group Difference at Follow-Up | |||||||||||
|---|---|---|---|---|---|---|---|---|---|---|---|---|
| CG (n = 20) | MP (n = 20) | MP+AE (n = 20) | CG (n = 20) | MP (n = 20) | MP+AE (n = 20) | CG vs. MP | MP vs. MP+AE | CG vs. MP+AE | ||||
| Baseline Mean (SD) | Follow-Up Mean (SD) | Baseline Mean (SD) | Follow-Up Mean (SD) | Baseline Mean (SD) | Follow-Up Mean (SD) | Mean Difference (95% CI) | Mean Difference (95% CI) | Mean Difference (95% CI) | Mean Difference (95% CI) | Mean Difference (95% CI) | Mean Difference (95% CI) | |
| Data of cardiorespiratory fitness parameters | ||||||||||||
| HR at VT1 (bpm) | 131.1 (13.9) | 121.2 (12.0) | 128.1 (21.2) | 128.5 (17.1) | 128.6 (16.2) | 126 (13.9) | −9.9 (−17.6 to −2.0) | 0.4 (−9.1 to 10.0) | −2.6 (−8.3 to 3.2) | −7.2 (−20.8 to 6.2) | 2.4 (−11.4 to 16.4) | −4.8 (−12.9 to 3.3) |
| Relative VO2 at VT1 (mL/kg·min) | 16.6 (2.3) | 14.4 (2.3) | 14.8 (2.9) | 15.0 (2.9) | 17.1 (3.8) | 16.4 (3.1) | −2.1 (−3.3 to −1.0) | 0.2 (−1.5 to 2.0) | −0.6 (−2.2 to 1.0) | −0.6 (−2.8 to 1.6) | −1.3 (−3.7 to 0.9) | −2.0 (−4.3 to 0.3) |
| HR at VT2 (bpm) | 147.3 (14.8) | 137.3 (14.2) | 137.3 (23.0) | 139.1 (17.2) | 138 (16.7) | 139.2 (12.5) | −10 (−17.5 to −2.4) | 1.8 (−5.9 to 9.6) | 1.2 (−5.1 to 7.5) | −1.7 (−11.8 to 8.2) | −0.1 (−13.3 to 13.2) | −1.8 (−12.6 to 8.9) |
| Relative VO2 at VT2 (mL/kg·min) * | 19.5 (3.7) | 17.2 (3.1) | 18.3 (3.2) | 17.7 (3.0) | 19.2 (3.5) | 19.0 (3.8) | −2.3 (−3.8 to −0.7) | −0.5 (−2.3 to 1.1) | −0.2 (−1.3 to 0.9) | −0.5 (−3.3 to 2.2) | −1.2 (−4.1 to 1.6) | −1.7 (−4.8 to 1.2) |
| Test time in max effort (ss) * | 559.9 (123.8) | 589.3 (120.6) | 541.6 (117.7) | 578.7 (126.2) | 556.2 (112.6) | 667.7 (131.4) † | 29.4 (−9.9 to 68.7) | 37.1 (−15.6 to 89.8) | 111.4 (64.2 to 15.7) | 10.5 (−100.3 to 121.4) | −88.9 (−201.9 to 23.9) | −78.4 (−213.6 to 56.8) |
| HR in max effort (bpm) | 164.6 (10.6) | 158.5 (16.0) | 158.6 (15.2) | 154.9 (15.9) | 156.0 (14.8) | 157.1 (7.7) | −9.6 (−16.9 to −2.2) | −2.5 (−13.4 to 8.4) | −1.4 (−8.4 to 5.4) | −1.0 (−13.9 to 11.8) | −1.1 (−9.7 to 7.5) | −2.1 (−13.4 to 9.0) |
| Absolute power in max effort (W) * | 265.3 (48.7) | 274.7 (45.7) | 247.4 (62.9) | 262.1 (73.7) | 237.4 (59.2) | 275.1 (50.3) | 9.4 (−7.9 to 26.8) | 14.7 (−11.5 to 41.0) | 37.6 (19.3 to 55.9) | 12.5 (−35.9 to 61.1) | −12.9 (−43.2 to 17.3) | −0.3 (−37.8 to 37.2) |
| Relative power in max effort (W/kg) * | 3.4 (0.7) | 3.5 (0.7) | 3.2 (0.7) | 3.4 (0.9) | 3.3 (0.6) | 3.9 (0.7) | 0.1 (−0.1 to 0.3) | 0.1 (−0.1 to 0.5) | 0.6 (0.3 to 0.9) | 0.09 (−0.6 to 0.8) | −0.5 (−1.2 to 0.2) | −0.4 (−1.2 to 0.3) |
| Absolute VO2 in max effort (L/min) * | 1.7 (0.3) | 1.6 (0.3) | 1.6 (0.2) | 1.6 (0.2) | 1.5 (0.3) | 1.5 (0.2) | −0.1 (−0.2 to −0.02) | −0.01 (−0.1 to 0.9) | −0.02 (−1.1 to 0.05) | 0.008 (−0.2 to 0.2) | 0.07 (−0.08 to 0.2) | 0.08 (−0.1 to 0.2) |
| Relative VO2 in max effort (mL/kg·min) | 22.5 (3.9) | 20.5 (3.8) | 21.6 (3.4) | 21.3 (3.4) | 22.4 (3.7) | 22.3 (4.1) | −1.9 (−3.3 to −0.5) | −0.3 (−2.0 to 1.3) | −0.1 (−1.3 to 1.1) | −0.7 (−3.5 to 2.0) | −1.0 (−4.0 to 2.0) | −1.7 (−5.3 to 1.8) |
| Strength, flexibility, and functional tasks | ||||||||||||
| Flexibility (cm) * | 226.8 (82.3) | 219.8 (82.8) | 229.9 (75.5) | 263.9 (66.1) | 227.4 (103.4) | 293.7 (51.3) † | −7 (−20.4 to 6.2) | 34 (11.2 to 56.8) | 66.3 (22.2 to 110.4) | −44.1 (−99.1 to 10.8) | −29.8 (−73.7 to 14.1) | −73.9 (−135.3 to −12.5) |
| dominant hand strength (kgf) | 28.6 (8.7) | 27.3 (7.5) | 29.1 (6.1) | 29.7 (4.7) | 27.6 (9.1) | 27.8 (7.3) | 1.1 (−4.1 to 6.3) | 0.2 (−5.5 to 6.0) | −1.2 (−5.9 to 3.4) | 2.1 (−4.3 to 8.5) | −0.2 (−2.4 to 1.9) | 1.8 (−3.7 to 7.4) |
| VST (ss) | 3.9 (1.2) | 4.1 (1.9) | 3.6 (1.0) | 3.4 (1.0) | 4.2 (1.3) | 4.0 (2.6) | 0.2 (−0.4 to 0.7) | −0.2 (−0.5 to 0.2) | −0.2 (−1 to 0.5) | 0.6 (−0.7 to 2) | −0.6 (−2 to 0.9) | 0.1 (−2 to 2.2) |
| VSP (ss) | 4.8 (1.3) | 5.3 (1.8) | 4.3 (1.2) | 4.3 (1.2) | 5.5 (2.9) | 5.5 (3.7) | 0.5 (−0.2 to 1.3) | 0 (−0.3 to 0.3) | 0 (−1 to 0.9) | 1 (−0.4 to 2.4) | −1.2 (−3.2 to 0.9) | −0.2 (−2.8 to 2.5) |
| VPS (ss) | 29.1 (5.2) | 30.9 (8.1) | 28.2 (6.6) | 28.8 (5.6) | 31.2 (7.1) | 29.3 (7.2) | 1.8 (−2.1 to 5.9) | 0.6 (−2.6 to 3.9) | −1.9 (−5 to 1.1) | 2.1 (−3.9 to 8.2) | −0.4 (−4.4 to 3.5) | 1.6 (−5.1 to 8.4) |
| Data of quality of life scores | ||||||||||||
| Physical * | 12.2 (2.9) | 12.3 (2.2) | 12.8 (1.9) | 14 (2.7) | 12.3 (1.5) | 14.2 (2.4) | 0.1 (−0.9 to 1.1) | 1.2 (−0.0 to 2.4) | 1.9 (0.7 to 3.0) | −1.6 (−3.7 to 0.4) | −0.2 (−2.4 to 1.9) | −1.8 (−3.7 to 0.0) |
| Psychological * | 13.4 (2.7) | 13.6 (2.0) | 13.3 (2.6) | 14.6 (2.2) † | 12.3 (1.7) | 14.2 (1.9) † | 0.2 (−0.5 to 0.9) | 1.3 (0.4 to 2.2) | 1.9 (1.2 to 2.5) | −1 (−2.6 to 0.5) | 0.3 (−1.4 to 2.1) | −0.6 (−2.1 to 0.8) |
| Social relationships * | 13.2 (3.2) | 13.1 (2.7) | 13.5 (2.8) | 14.7 (2.0) | 13.4 (2.2) | 14.3 (1.7) | −0.1 (−1.1 to 1.0) | 1.2 (−0.1 to 2.5) | 0.9 (0.1 to 1.7) | −1.6 (−3.6 to 0.4) | 0.4 (−1.3 to 2.1) | −1.2 (−2.9 to 0.5) |
| Environment * | 12.4 (2.1) | 12.3 (2.0) | 11.6 (2.4) | 12.4 (2.3) | 11.1 (2.2) | 12.3 (2.1) † | −0.1 (−0.7 to 0.6) | 0.8 (−0.0 to 1.7) | 1.2 (0.7 to 1.7) | −0.1 (−1.3 to 1.1) | 0.1 (−1.7 to 2.0) | 0 (−1.9 to 2.0) |
| Overall QOL * | 12.5 (3.4) | 12.4 (2.3) | 12 (2.1) | 13.1 (2.5) | 12.1 (2.3) | 14.2 (2.5) | −0.1 (−1.6 to 1.4) | 1.1 (−0.0 to 2.2) | 2.1 (1.0 to 3.1) | −0.7 (−2.9 to 1.5) | −1.1 (−3.2 to 1.0) | −1.8 (−3.9 to 0.3) |
| Anthropometric data | ||||||||||||
| Body mass (kg) | 79.9 (16.7) | 78.7 (12.6) | 78.1 (20.3) | 75.8 (17.1) | 74.3 (16.6) | 70.3 (12.7) | −1.2 (−5.9 to 3.5) | −2.3 (−7.9 to 3.2) | −4 (−9.6 to 1.4) | 2.9 (−10.5 to 16.4) | 5.5 (−5.6 to 16.7) | 8.4 (−3.4 to 20.3) |
| Height (cm) | 158.6 (7.3) | 158.4 (7.2) | 160.9 (4.7) | 161.1 (4.9) | 157.4 (6.4) | 157.9 (6.1) | −0.2 (−0.5 to 0.9) | 0.2 (−0.3 to 0.7) | 0.5 (0.0 to 0.8) | −2.7 (−7.6 to 2.2) | 3.2 (−1.4 to 7.8) | 0.5 (−4.9 to 5.9) |
| BMI (kg/m2) | 31.6 (5.7) | 31.2 (3.8) | 30.0 (7.3) | 29.1 (5.9) | 29.9 (5.6) | 28.2 (5.0) | −0.4 (−2.2 to 1.5) | −0.9 (−3.1 to 1.2) | −1.7 (−3.5 to 0.2) | 2.1 (−2.4 to 6.8) | 0.8 (−3.1 to 4.8) | 3.0 (−1.3 to 7.4) |
| WC (cm) * | 97.1 (7.0) | 94.2 (8.1) | 90.3 (12.2) | 90.5 (11.9) | 93.4 (12.8) | 90.5 (11.2) | −2.9 (−4.9 to −0.7) | 0.2 (−2.5 to 2.9) | −2.9 (−4.8 to −0.8) | 3.7 (−5.3 to 12.7) | 0 (−8.3 to 8.2) | 3.6 (−5.5 to 12.8) |
| HC (cm) | 111.0 (11.3) | 110.7 (10.9) | 109.6 (15.3) | 108.3 (16.6) | 103.9 (13.7) | 105.3 (13.2) | −0.3 (−2.0 to 1.6) | −1.3 (−3.9 to 1.3) | 1.4 (−0.9 to 3.7) | 2.4 (−7.2 to 12.0) | 3.0 (−9.8 to 15.9) | 5.4 (−5.9 to 16.8) |
| Waist-to-hip ratio (cm) * | 0.88 (0.07) | 0.85 (0.08) | 0.82 (0.07) | 0.83 (0.07) | 0.90 (0.07) | 0.86 (0.07) † | −0.03 (−0.04 to −0.001) | 0.01 (−0.01 to 0.03) | −0.04 (−0.06 to −0.01) | 0.02 (−0.04 to 0.07) | −0.03 (−0.08 to 0.03) | −0.01 (−0.07 to 0.05) |
| Waist-to-height ratio (cm) * | 0.61 (0.05) | 0.59 (0.05) | 0.56 (0.07) | 0.56 (0.07) | 0.59 (0.07) | 0.57 (0.06) | −0.02 (−0.03 to −0.004) | 0 (−0.01 to 0.01) | −0.02 (−0.03 to −0.008) | 0.03 (−0.02 to 0.09) | −0.01 (−0.06 to 0.03) | 0.02 (−0.02 to 0.07) |
| Data of cardiorespiratory fitness parameters | ||||||||||||
| SBP (mmHg) * | 118.5 (7.4) | 118.4 (8.7) | 117.7 (8.4) | 115.6 (9.1) | 122.2 (10.5) | 114.7 (10.6) | −0.1 (−3.6 to 3.4) | −2.1 (−7.9 to 3.7) | −7.5 (−13.7 to −1) | 2.8 (−5.7 to 11.3) | 0.8 (−6.8 to 8.4) | 3.6 (−3 to 10.2) |
| DBP (mmHg) | 76.3 (10.5) | 78.5 (9.2) | 76.4 (6.9) | 76.1 (7.7) | 76.9 (9.1) | 76.3 (7.4) | 2.2 (−2.6 to 7) | −0.3 (−5.1 to 4.4) | −0.6 (−4.7 to 3.6) | 2.4 (−5 to 9.8) | −0.2 (−7.1 to 6.6) | 2.1 (−5.9 to 10.2) |
| MBP (mmHg) * | 90.4 (7.6) | 90.3 (7.0) | 90.2 (6.6) | 89.5 (5.4) | 92.0 (8.4) | 89.5 (7.8) | −0.1 (−1.2 to 1.1) | −0.7 (−2.6 to 1.2) | −2.5 (−4.5 to −0.3) | 0.8 (−4.7 to 6.4) | 0 (−6.0 to 5.8) | 0.8 (−4.8 to 6.4) |
| HR (bpm) | 70.9 (8.1) | 70.6 (6.5) | 71.2 (12.6) | 67.1 (12.3) | 68.7 (8.6) | 67.1 (7.6) | −0.3 (−3.8 to 3.3) | −4.1 (−8.7 to 0.5) | −1.6 (−4.4 to 1.3) | 3.5 (−5.1 to 12.2) | −0 (−8.7 to 8.6) | 3.5 (−1.2 to 8.2) |
| DP (bpm X mmHg) * | 8386.5 (893.1) | 8358.6 (892.3) | 8356.6 (1353.9) | 7794.1 (1722.2) | 8403.2 (1353.0) | 7700.3 (1059.0) | −27.9 (−528.7 to 472.8) | −562.5 (−1274.5 to 149.5) | −702.9 (−1368.1 to −37.6) | 564.5 (−645.9 to 1774.9) | 93.7 (−1149.1 to 1336.7) | 658.3 (−57.4 to 1374) |
| Within-Group | Between-Group | |||||||
|---|---|---|---|---|---|---|---|---|
| F | Power | Effect Size | p-Value | F | Power | Effect Size | p-Value | |
| Data of cardiorespiratory fitness parameters | ||||||||
| HR in VT1 (bpm) | 3.366 | 0.43 | 0.01 | 0.07 | 1.993 | 0.39 | 0.01 | 0.14 |
| Relative VO2 in VT1 (mL/kg·min) | 3.773 | 0.47 | 0.02 | 0.057 | 2.700 | 0.51 | 0.02 | 0.07 |
| HR in VT2 (bpm) | 1.324 | 0.20 | 0.004 | 0.25 | 3.693 | 0.65 | 0.02 | 0.03 * |
| Relative VO2 in VT2 (mL/kg·min) | 6.026 | 0.67 | 0.02 | 0.01 * | 2.391 | 0.46 | 0.01 | 0.10 |
| Test time in max effort (ss) | 21.152 | 0.99 | 0.05 | 0.00002 * | 4.116 | 0.70 | 0.02 | 0.02 *,** |
| HR in max effort (bpm) | 1.45 | 0.21 | 0.01 | 0.23 | 0.79 | 0.17 | 0.01 | 0.46 |
| Absolute power in max effort (W) | 12.585 | 0.93 | 0.03 | 0.0007 * | 2.217 | 0.43 | 0.01 | 0.11 |
| Relative power in max effort (W/kg) | 12.809 | 0.94 | 0.03 | 0.0007 * | 3.150 | 0.58 | 0.02 | 0.05 |
| Absolute VO2 in max effort (L/min) | 4.810 | 0.57 | 0.01 | 0.03 * | 2.068 | 0.40 | 0.008 | 0.13 |
| Relative VO2 in max effort (mL/kg·min) | 3.833 | 0.48 | 0.01 | 0.05 | 2.016 | 0.39 | 0.01 | 0.14 |
| Strength, flexibility, and functional tasks | ||||||||
| Flexibility (cm) | 14.4297 | 0.96 | 0.03 | 0.0003 * | 6.7313 | 0.90 | 0.03 | 0.002 *,** |
| dominant hand strength (kgf) | 0.0590 | 0.05 | 0.00008 | 0.80 | 1.0989 | 0.23 | 0.003 | 0.34 |
| VST (ss) | 0.1696 | 0.06 | 0.0004 | 0.68 | 0.4911 | 0.12 | 0.002 | 0.61 |
| VSP (ss) | 0.7023 | 0.13 | 0.001 | 0.40 | 0.7823 | 0.17 | 0.003 | 0.46 |
| VPS (ss) | 0.040 | 0.05 | 0.0002 | 0.84 | 1.350 | 0.27 | 0.01 | 0.26 |
| Data of quality of life scores | ||||||||
| Physical | 11.515 | 0.91 | 0.05 | 0.001 * | 2.865 | 0.53 | 0.02 | 0.06 |
| Psychological | 28.863 | 0.99 | 0.06 | <0.0001 * | 5.583 | 0.83 | 0.02 | 0.006 *,†,** |
| Social relationships | 5.102 | 0.60 | 0.01 | 0.02 * | 1.598 | 0.32 | 0.01 | 0.21 |
| Environment | 11.612 | 0.91 | 0.02 | 0.001 * | 3.411 | 0.61 | 0.01 | 0.03 *,** |
| Overall QOL | 10.682 | 0.89 | 0.04 | 0.001 * | 2.943 | 0.55 | 0.02 | 0.06 |
| Anthropometric data | ||||||||
| Body mass (kg) | 2.999 | 0.39 | 0.02 | 0.08 | 0.328 | 0.09 | 0.006 | 0.72 |
| Height (cm) | 1.08 | 0.17 | 0.0001 | 0.30 | 2.68 | 0.51 | 0.0005 | 0.07 |
| BMI (kg/m2) | 3.251 | 0.42 | 0.008 | 0.07 | 0.448 | 0.11 | 0.002 | 0.64 |
| WC (cm) | 8.510 | 0.81 | 0.007 | 0.005 * | 2.554 | 0.49 | 0.004 | 0.08 |
| HC (cm) | 0.003 | 0.05 | 0.0 | 0.95 | 1.591 | 0.32 | 0.001 | 0.21 |
| Waist-to-hip ratio (cm) | 5.633 | 0.64 | 0.01 | 0.02 * | 4.792 | 0.77 | 0.02 | 0.01 *,** |
| Waist-to-height ratio (cm) | 9.203 | 0.84 | 0.008 | 0.003 * | 2.480 | 0.47 | 0.004 | 0.09 |
| Clinical blood pressure and heart rate | ||||||||
| SBP (mmHg) | 4.61 | 0.56 | 0.03 | 0.03 * | 2.14 | 0.42 | 0.02 | 0.12 |
| DBP (mmHg) | 0.106 | 0.06 | 0.0006 | 0.74 | 0.475 | 0.12 | 0.005 | 0.62 |
| MBP (mmHg) | 4.61 | 0.56 | 0.005 | 0.03 * | 2.14 | 0.42 | 0.005 | 0.12 |
| HR (bpm) | 3.562 | 0.45 | 0.01 | 0.06 | 1.190 | 0.25 | 0.007 | 0.31 |
| DP (bpm X mmHg) | 6.104 | 0.68 | 0.03 | 0.01 * | 1.389 | 0.28 | 0.01 | 0.25 |
Publisher’s Note: MDPI stays neutral with regard to jurisdictional claims in published maps and institutional affiliations. |
© 2022 by the authors. Licensee MDPI, Basel, Switzerland. This article is an open access article distributed under the terms and conditions of the Creative Commons Attribution (CC BY) license (https://creativecommons.org/licenses/by/4.0/).
Share and Cite
Almeida, I.d.S.; Andrade, L.d.S.; Sousa, A.M.M.d.; Junior, G.C.; Catai, A.M.; Mota, Y.L.; Durigan, J.L.Q. Is the Combination of Aerobic Exercise with Mat Pilates Better than Mat Pilates Training Alone on Autonomic Modulation Related to Functional Outcomes in Hypertensive Women? Secondary Analysis of a Randomized Controlled Trial. Int. J. Environ. Res. Public Health 2022, 19, 10577. https://doi.org/10.3390/ijerph191710577
Almeida IdS, Andrade LdS, Sousa AMMd, Junior GC, Catai AM, Mota YL, Durigan JLQ. Is the Combination of Aerobic Exercise with Mat Pilates Better than Mat Pilates Training Alone on Autonomic Modulation Related to Functional Outcomes in Hypertensive Women? Secondary Analysis of a Randomized Controlled Trial. International Journal of Environmental Research and Public Health. 2022; 19(17):10577. https://doi.org/10.3390/ijerph191710577
Chicago/Turabian StyleAlmeida, Isabella da Silva, Letícia de Souza Andrade, Alessandra Martins Melo de Sousa, Gerson Cipriano Junior, Aparecida Maria Catai, Yomara Lima Mota, and João Luiz Quagliotti Durigan. 2022. "Is the Combination of Aerobic Exercise with Mat Pilates Better than Mat Pilates Training Alone on Autonomic Modulation Related to Functional Outcomes in Hypertensive Women? Secondary Analysis of a Randomized Controlled Trial" International Journal of Environmental Research and Public Health 19, no. 17: 10577. https://doi.org/10.3390/ijerph191710577
APA StyleAlmeida, I. d. S., Andrade, L. d. S., Sousa, A. M. M. d., Junior, G. C., Catai, A. M., Mota, Y. L., & Durigan, J. L. Q. (2022). Is the Combination of Aerobic Exercise with Mat Pilates Better than Mat Pilates Training Alone on Autonomic Modulation Related to Functional Outcomes in Hypertensive Women? Secondary Analysis of a Randomized Controlled Trial. International Journal of Environmental Research and Public Health, 19(17), 10577. https://doi.org/10.3390/ijerph191710577