
Landscape Ecological Risk Assessment Based on Land Use Change in the Yellow River Basin of Shaanxi, China


Abstract
:1. Introduction
2. Materials and Methods
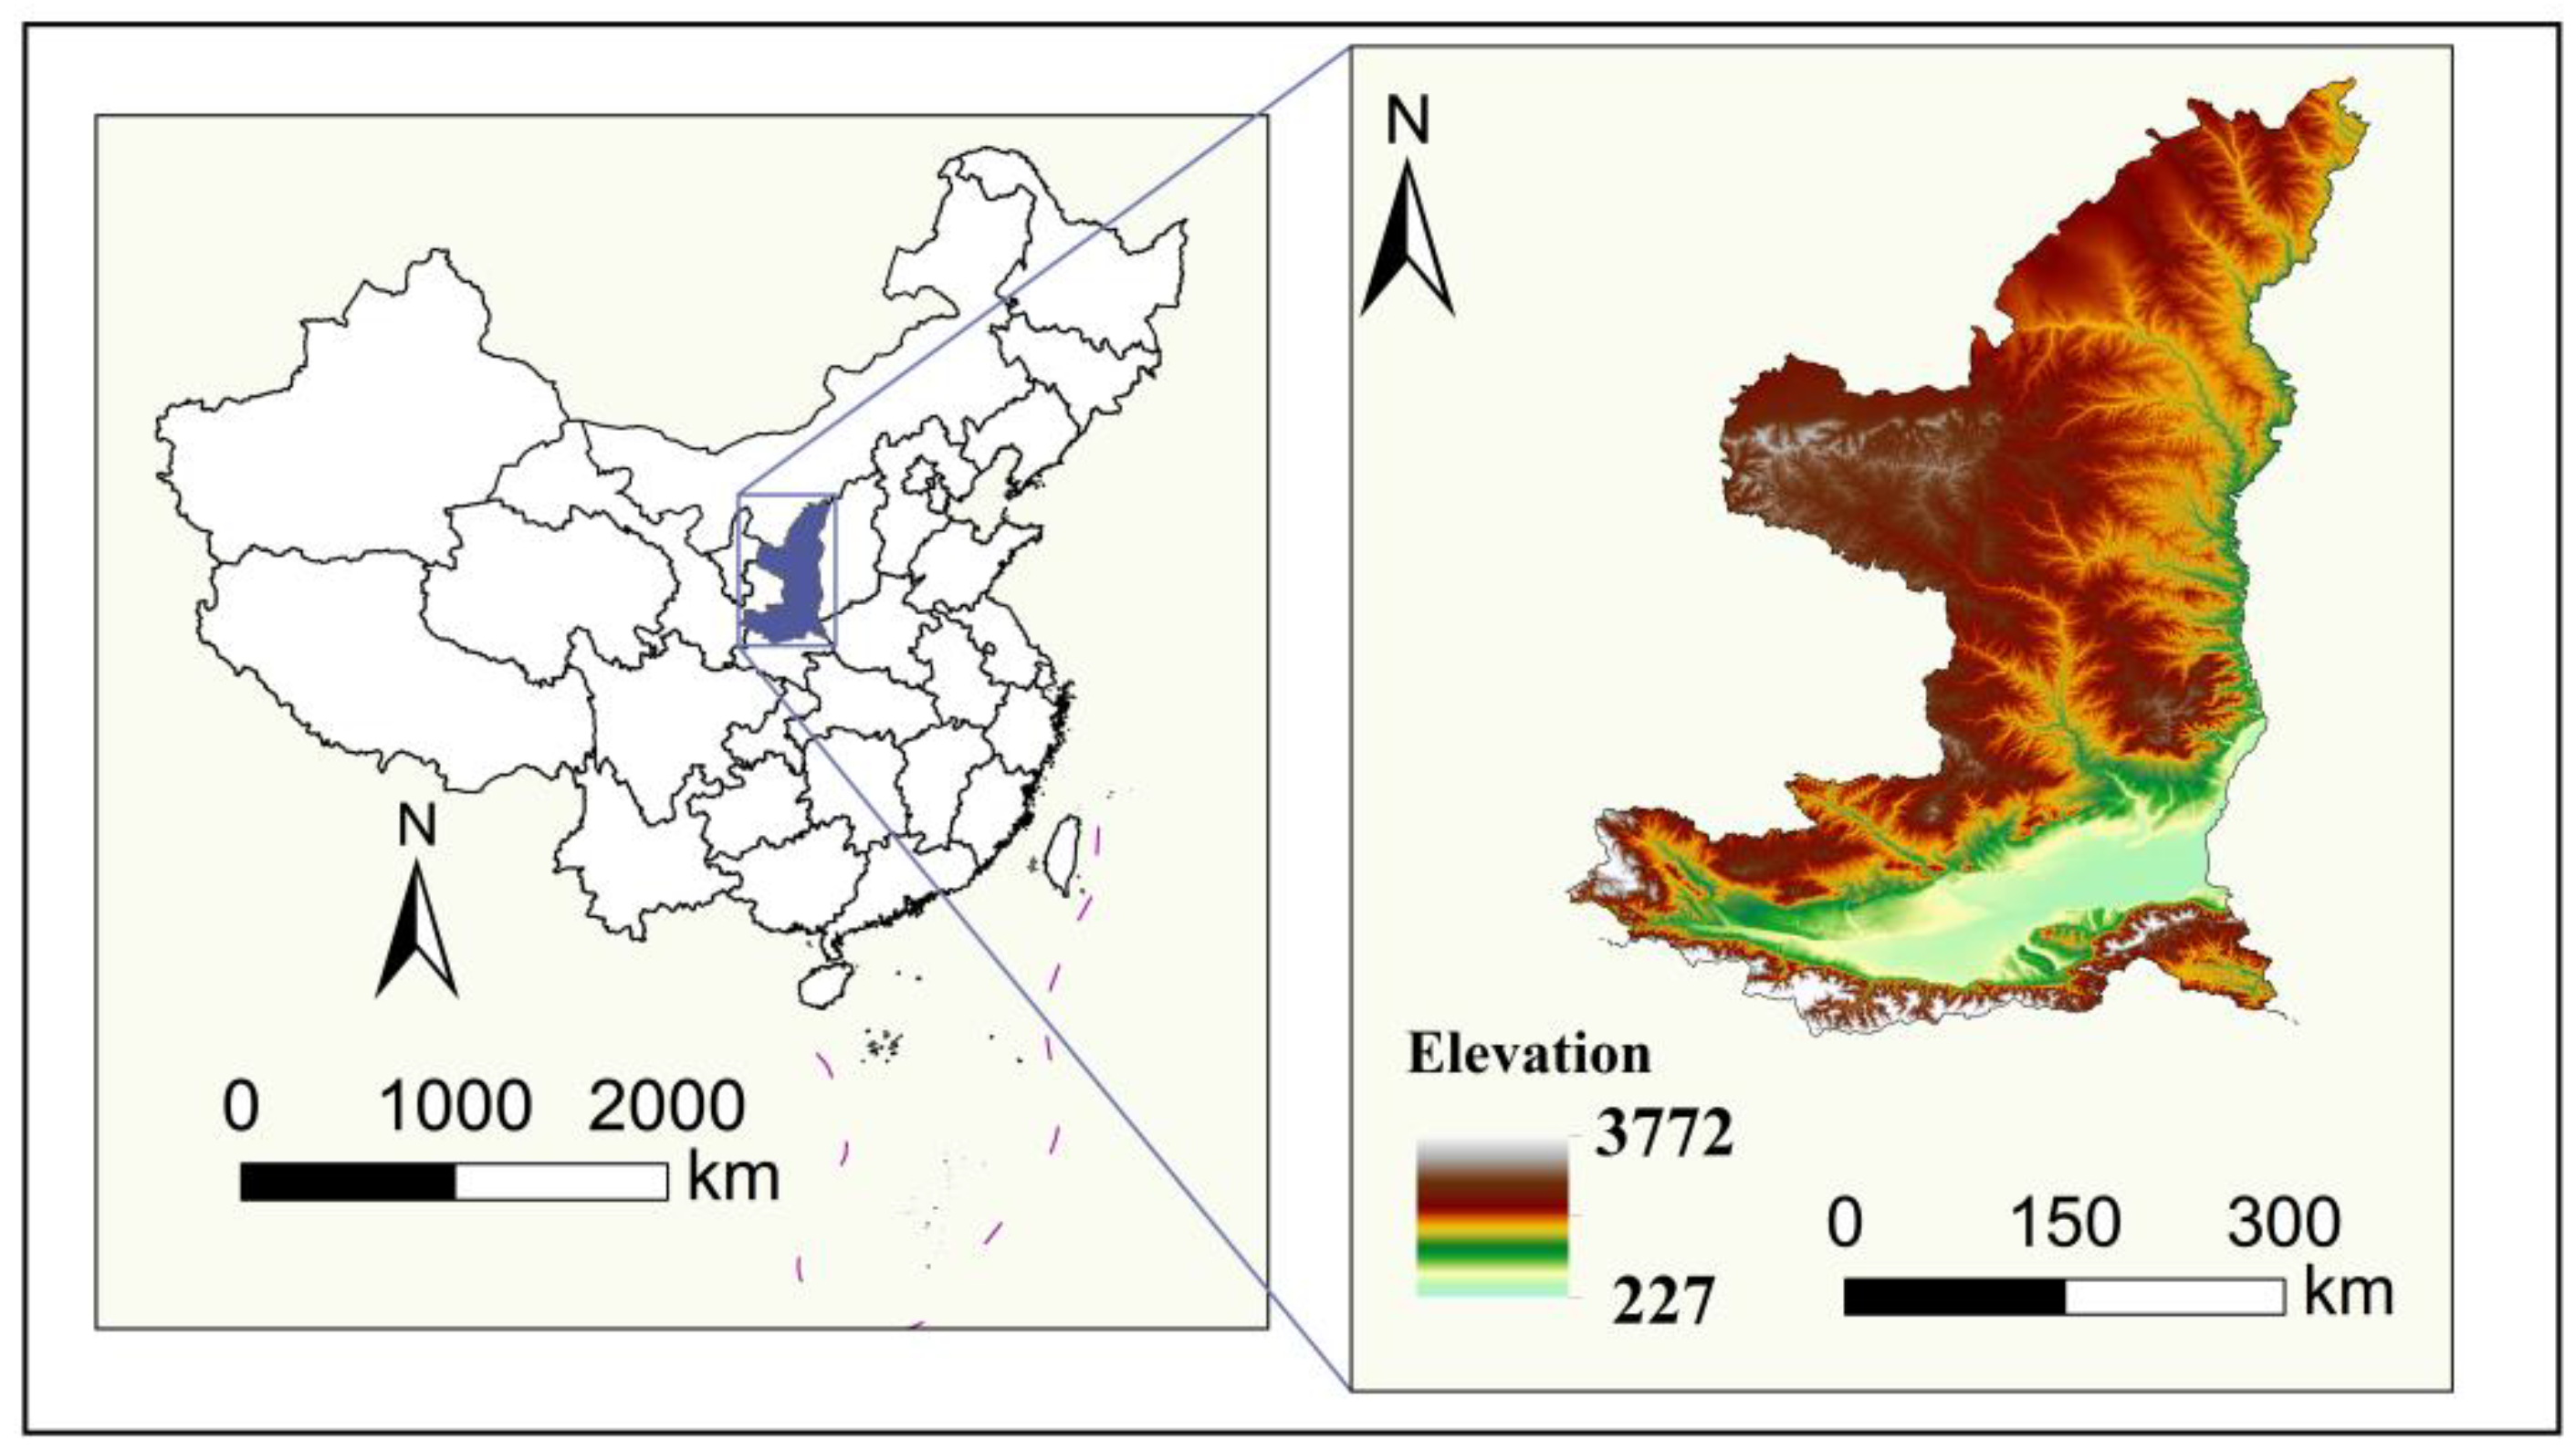
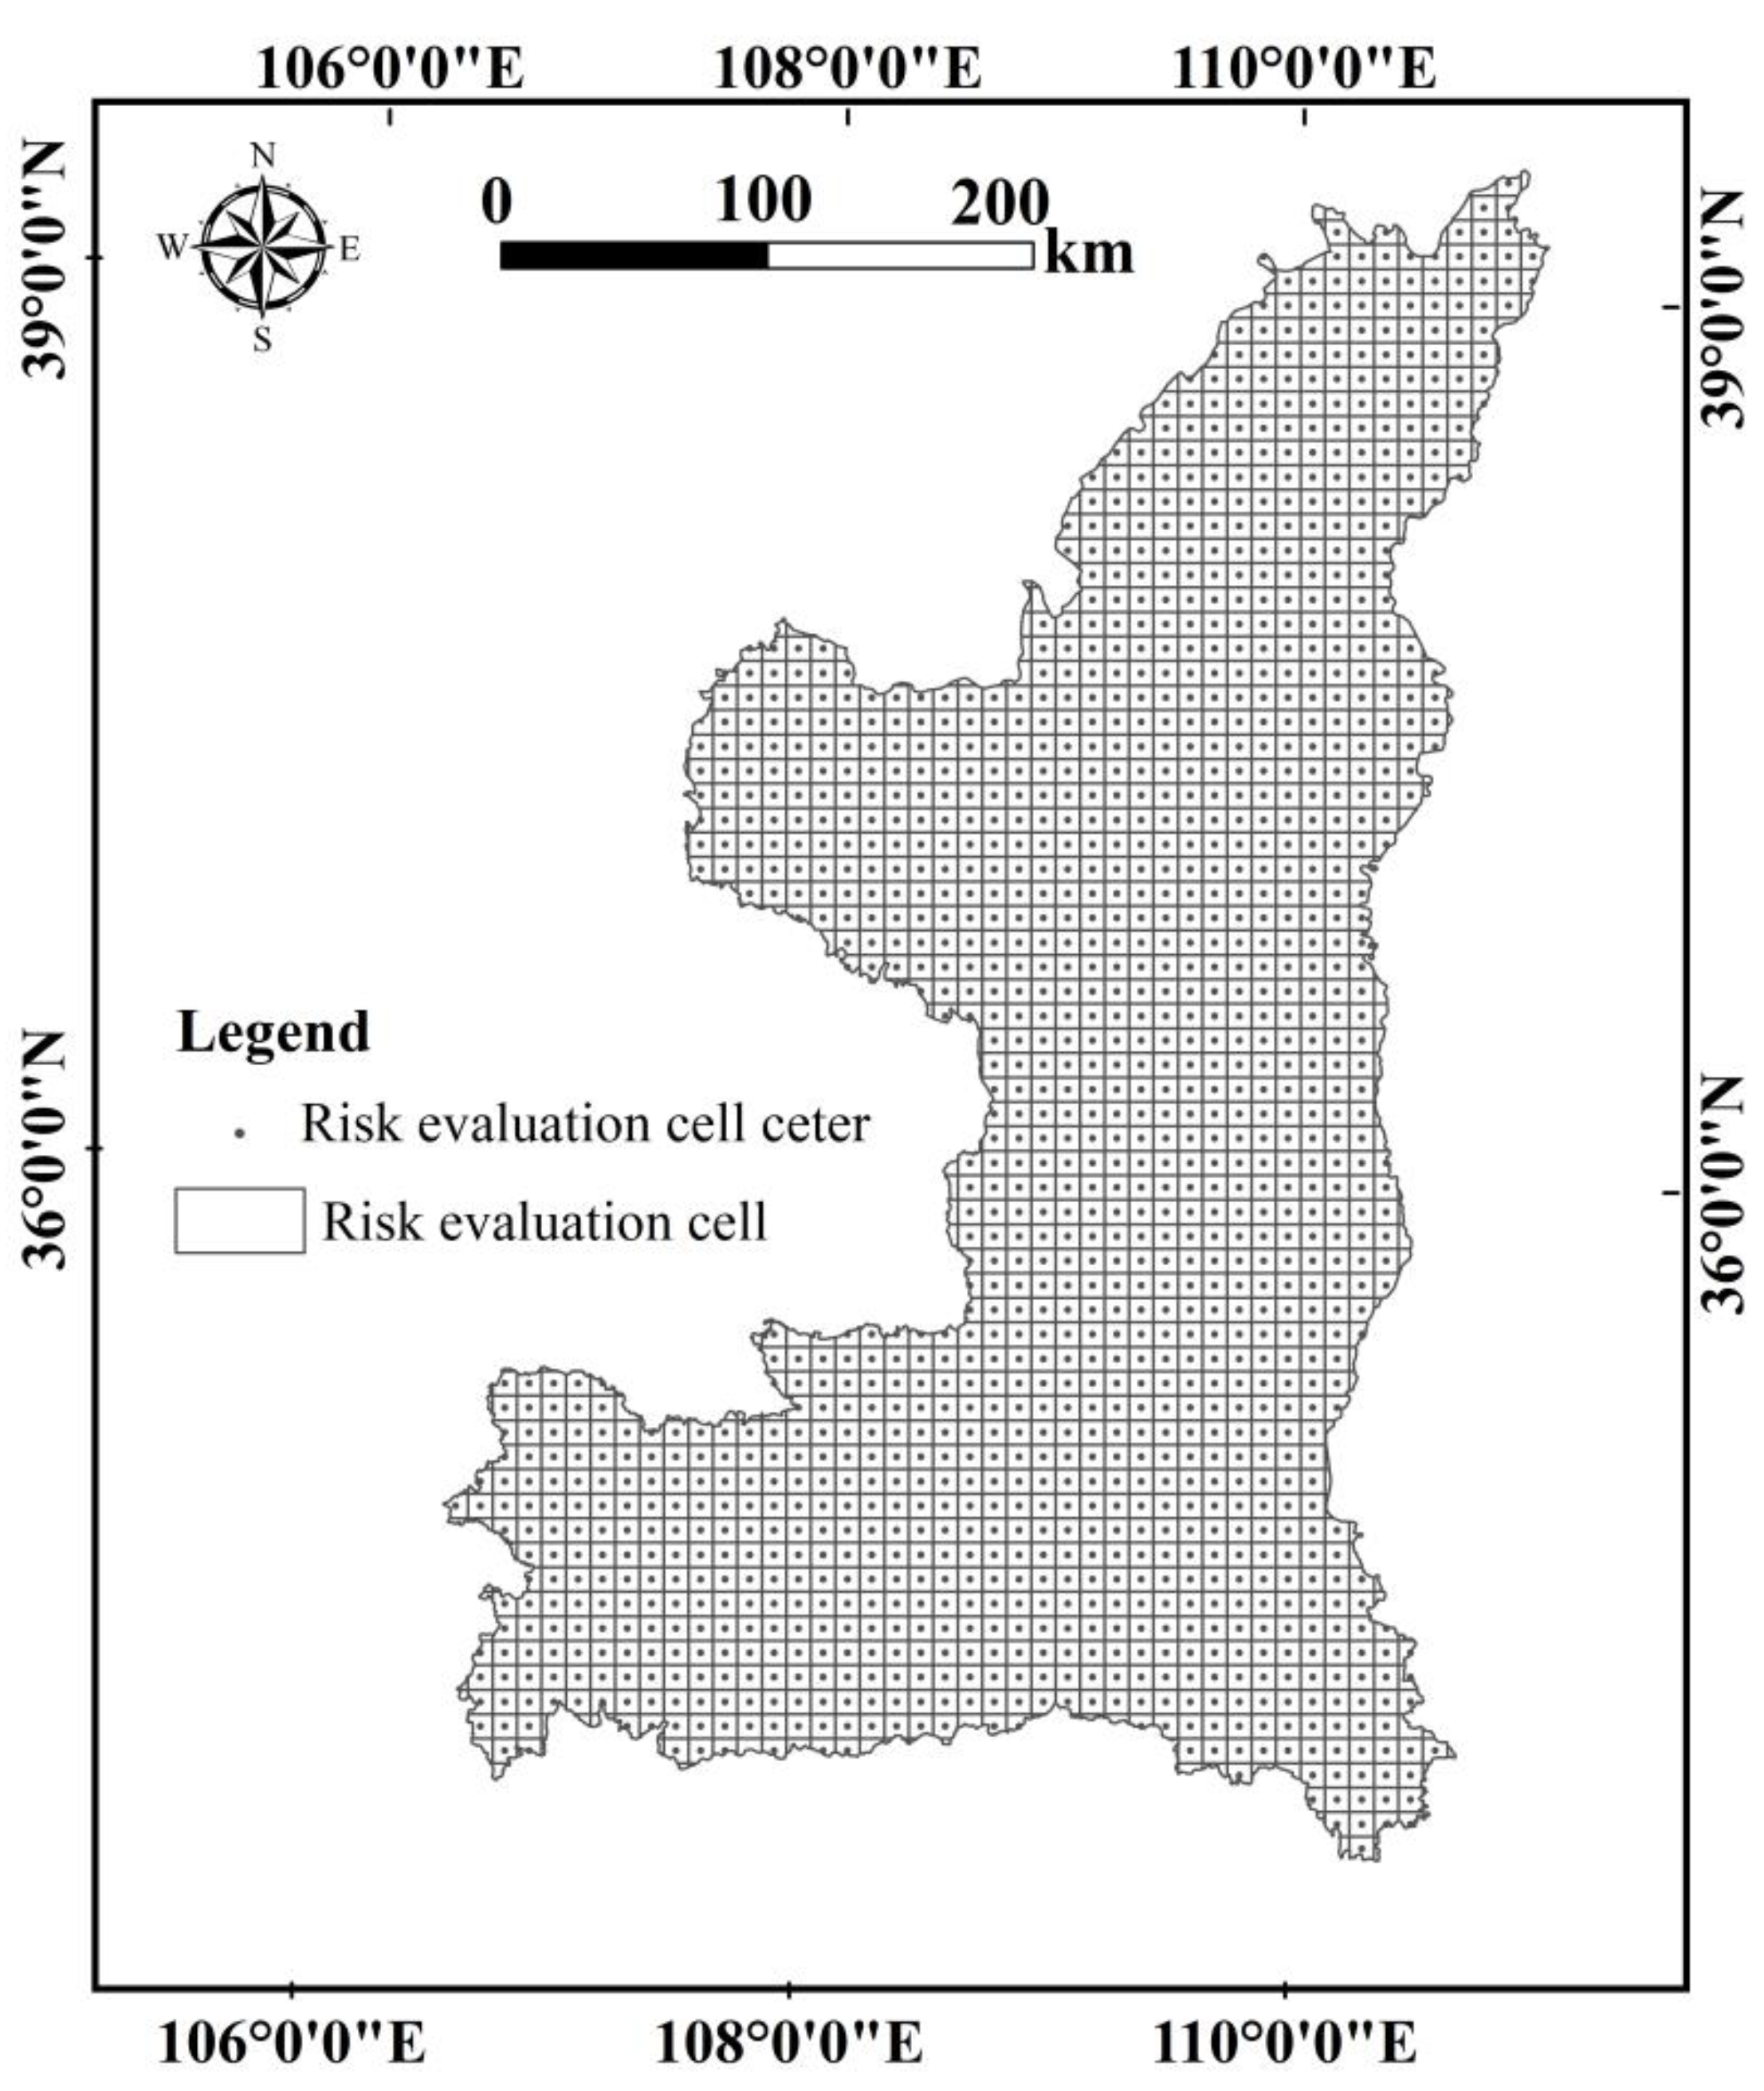
2.1. Study Area
2.2. Data Collection and Processing
2.3. Methods
2.3.1. Land Use Dynamics
2.3.2. Land Use Transfer Matrix
2.3.3. Landscape Ecological Risk Assessment
2.3.4. Spatial Autocorrelation Analysis
- (1)
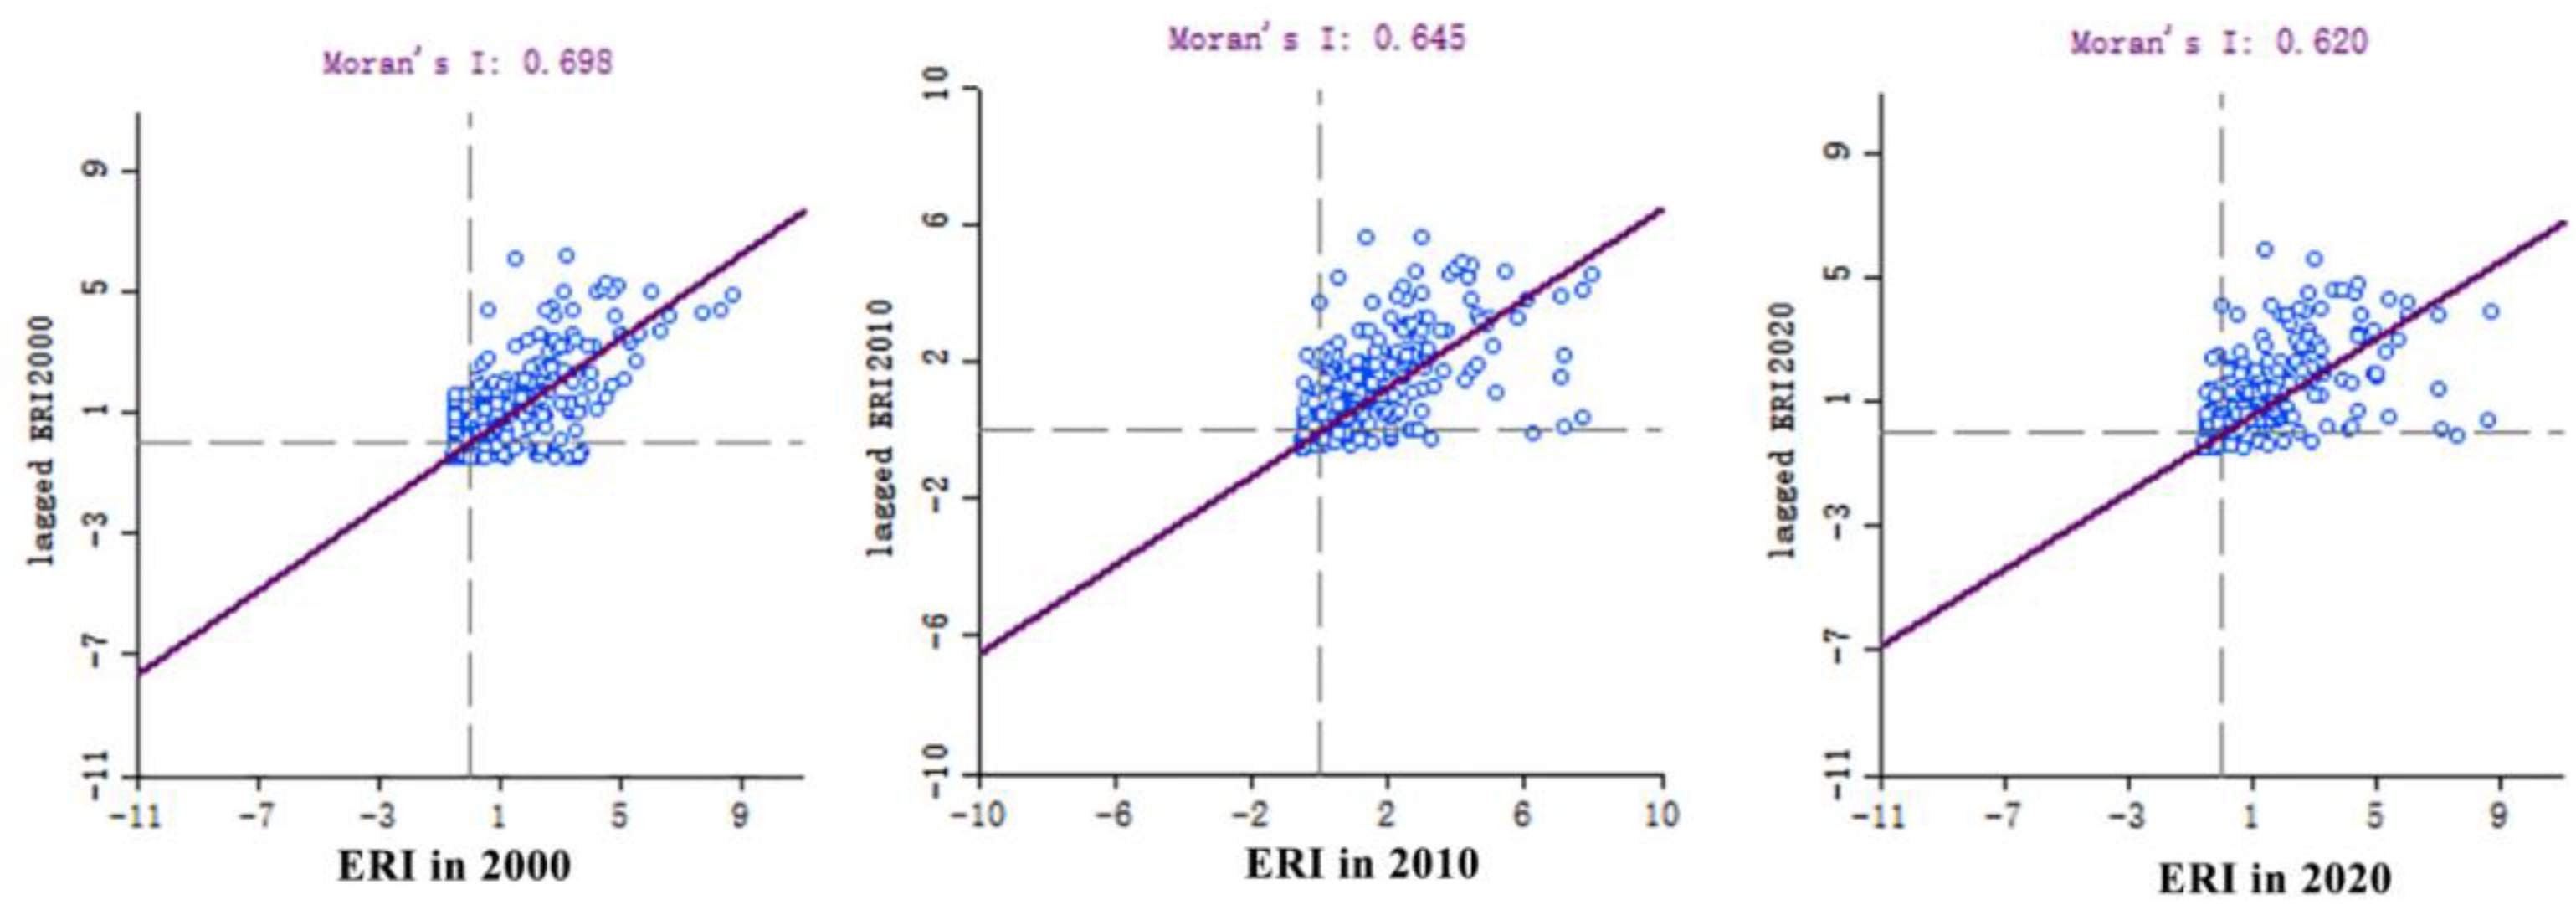
- Global spatial autocorrelation
- (2)
- Local spatial autocorrelation
3. Results
3.1. Land Use Change Processes from 2000 to 2020
3.1.1. Analysis of Land Use Dynamics Change
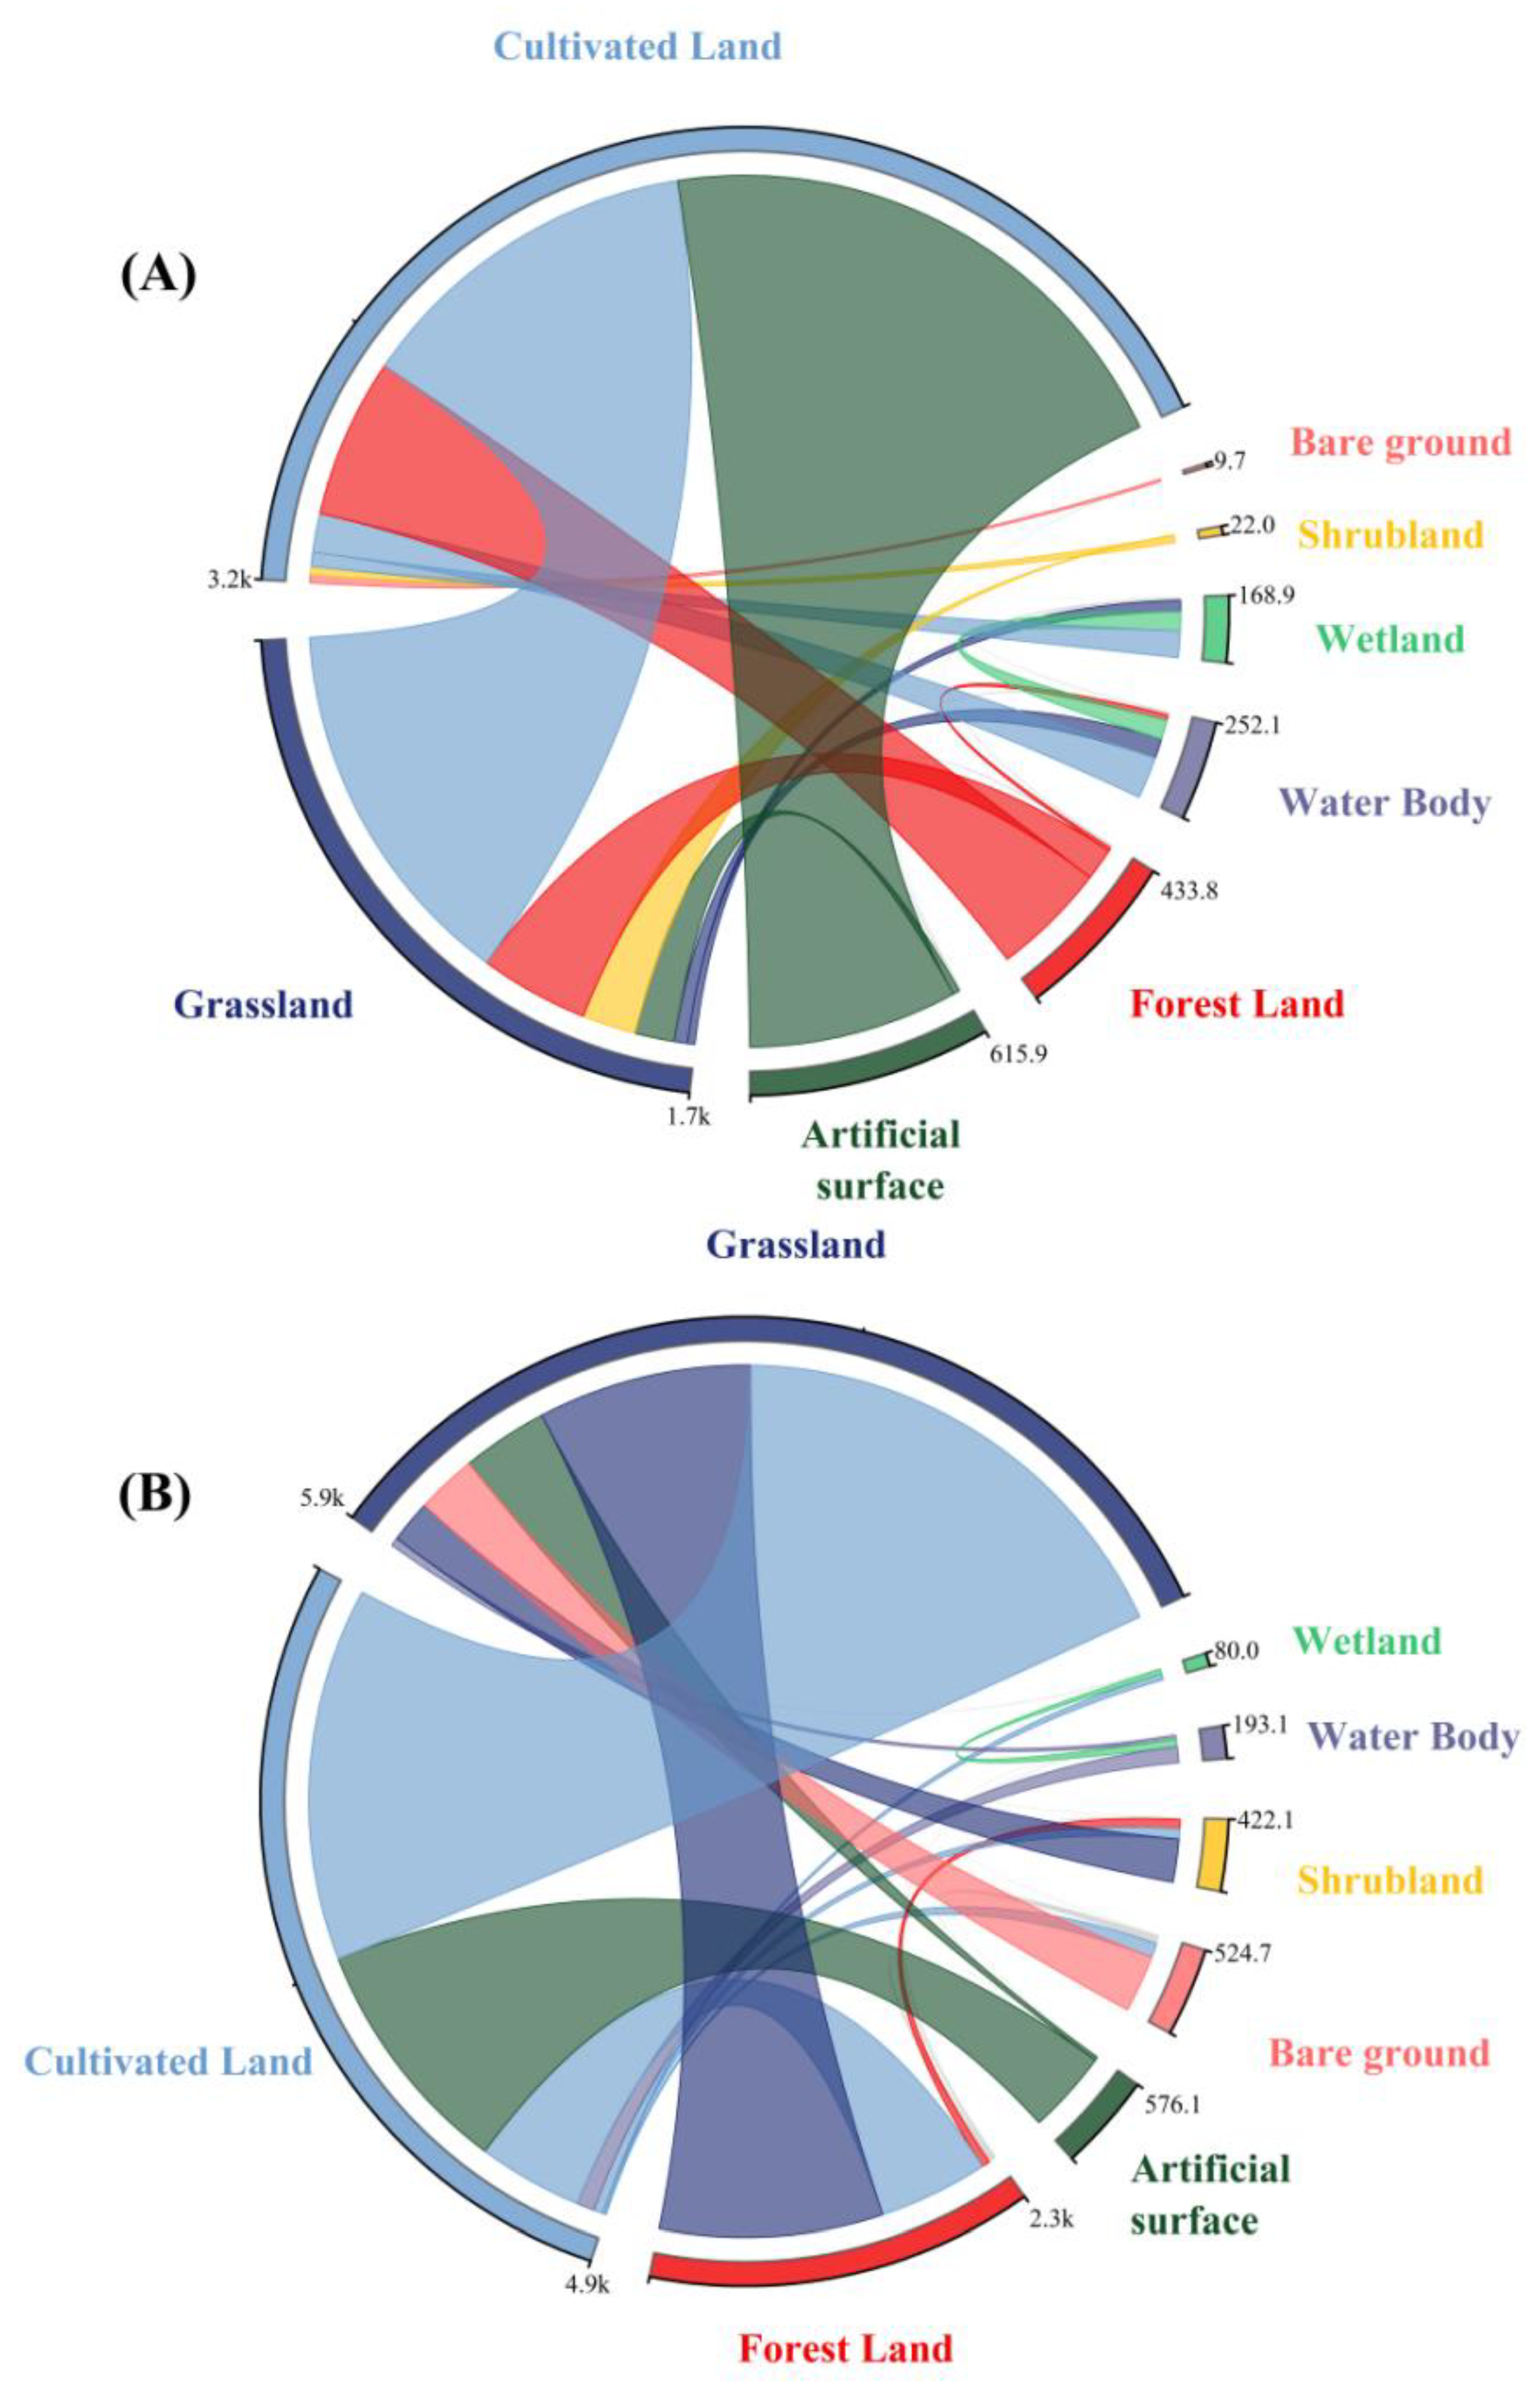
3.1.2. Analysis of Land Use Transfer Change
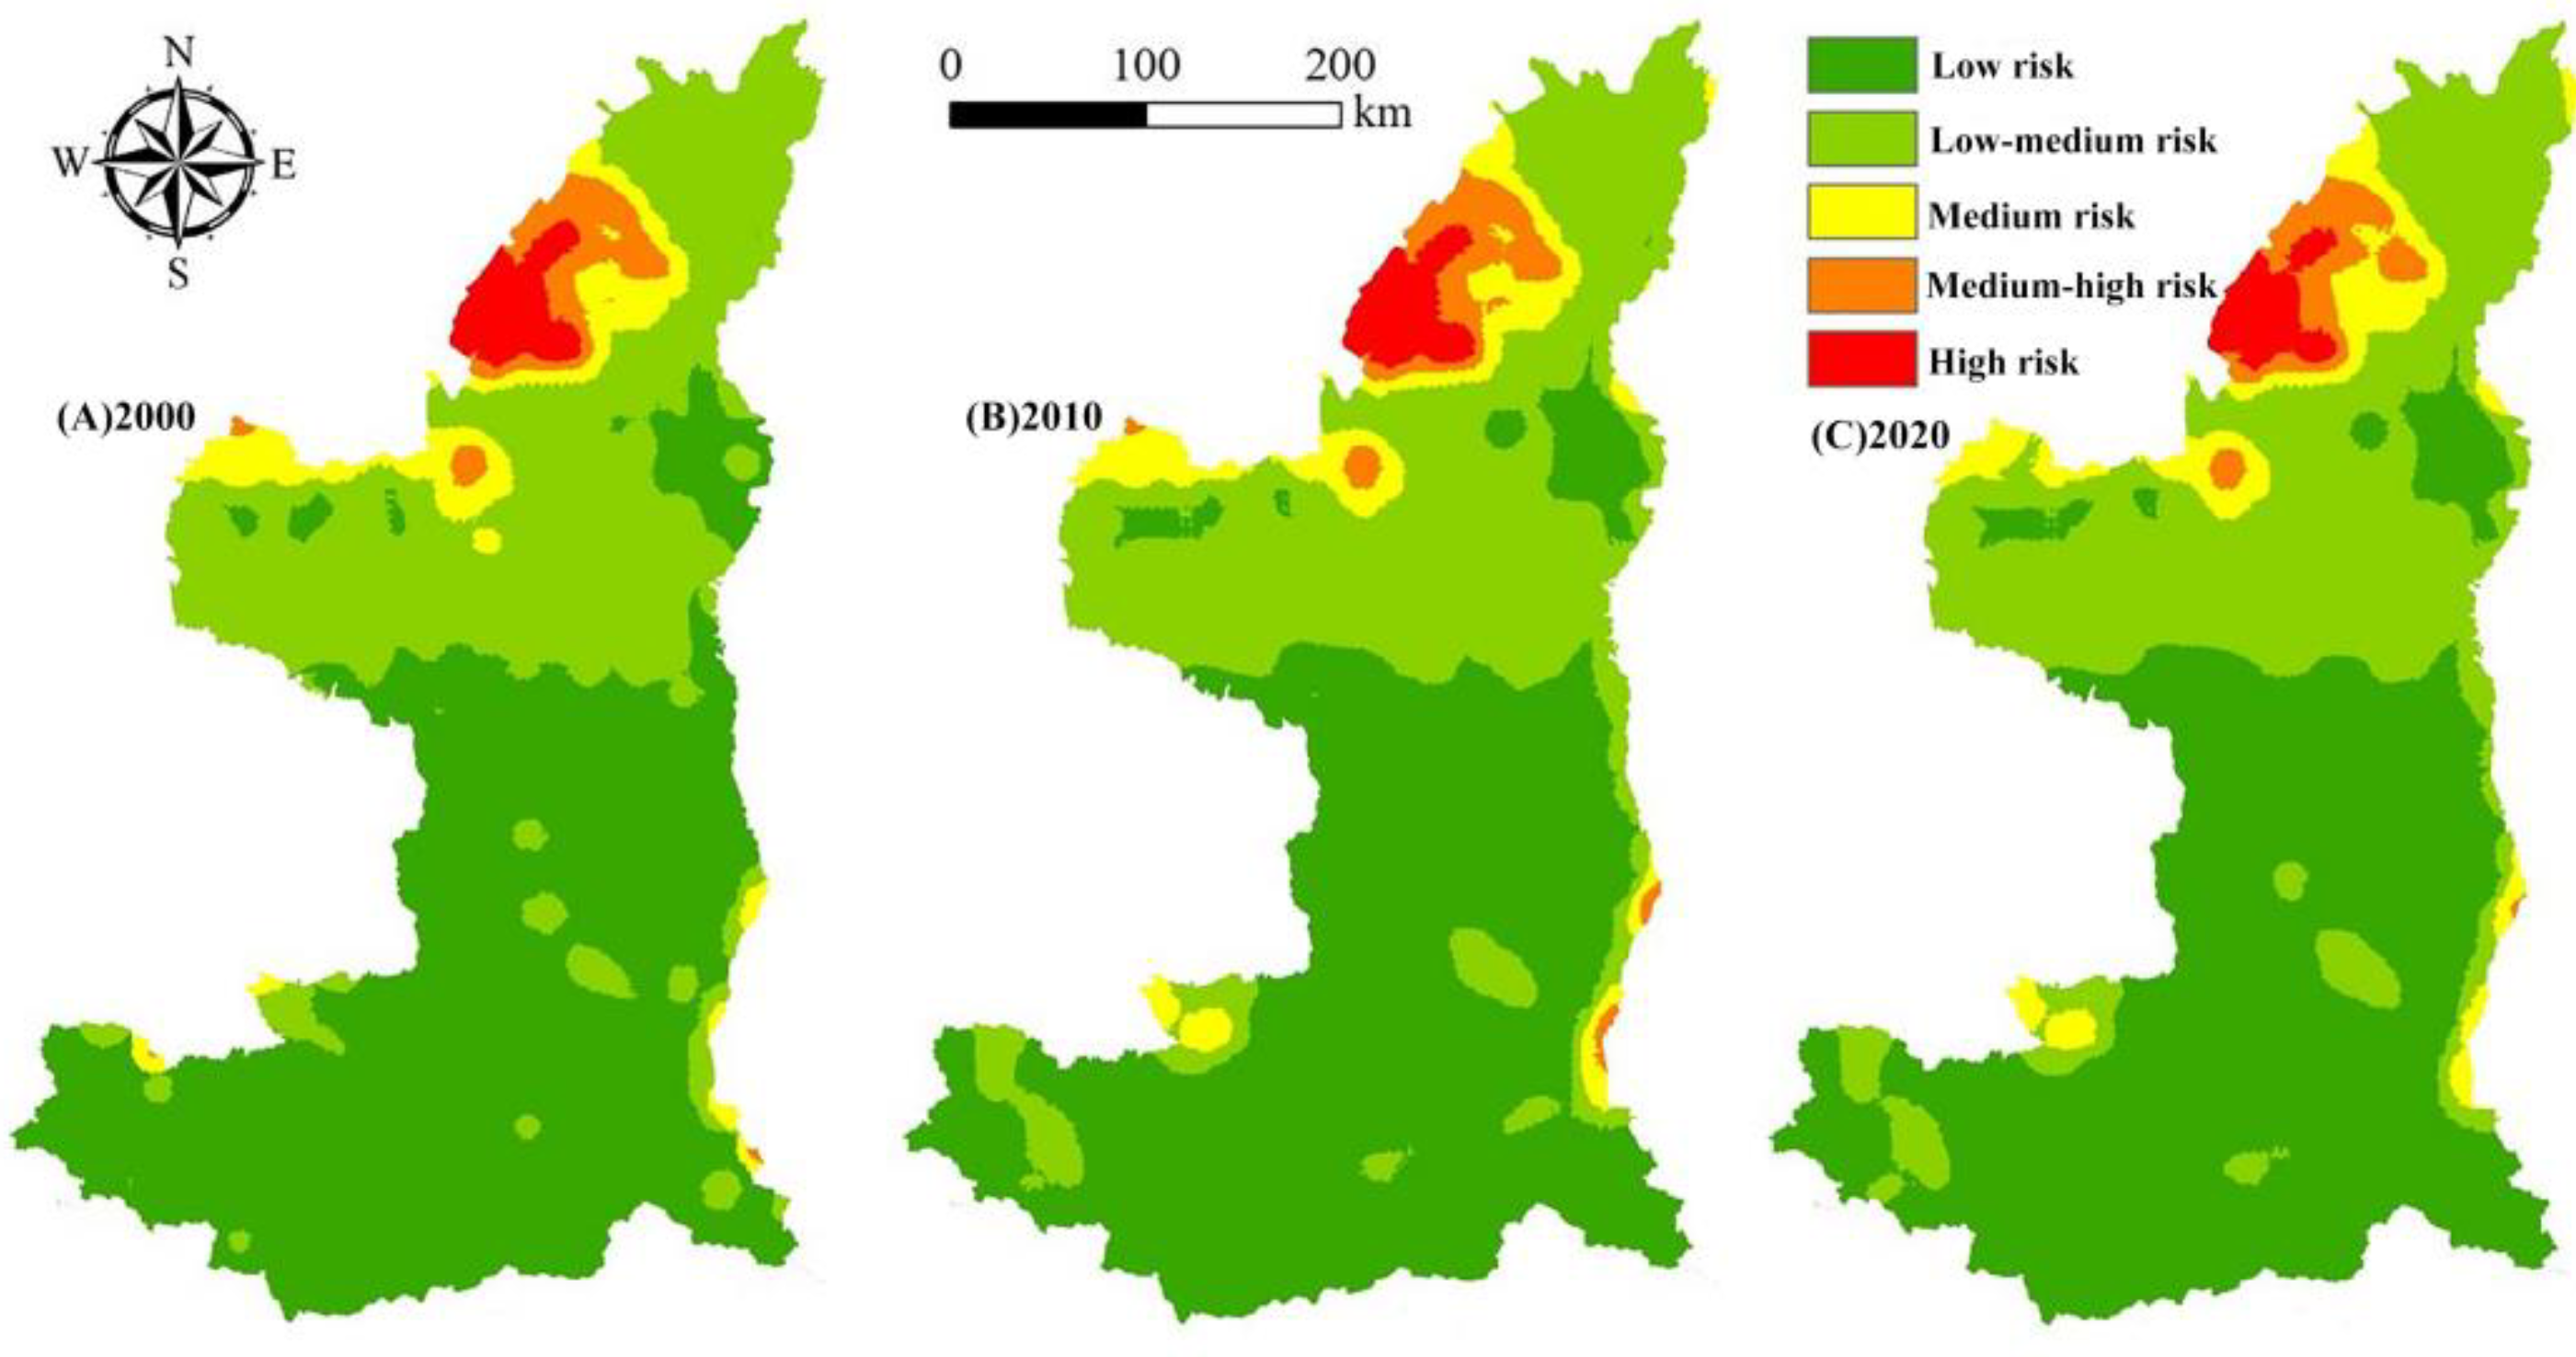
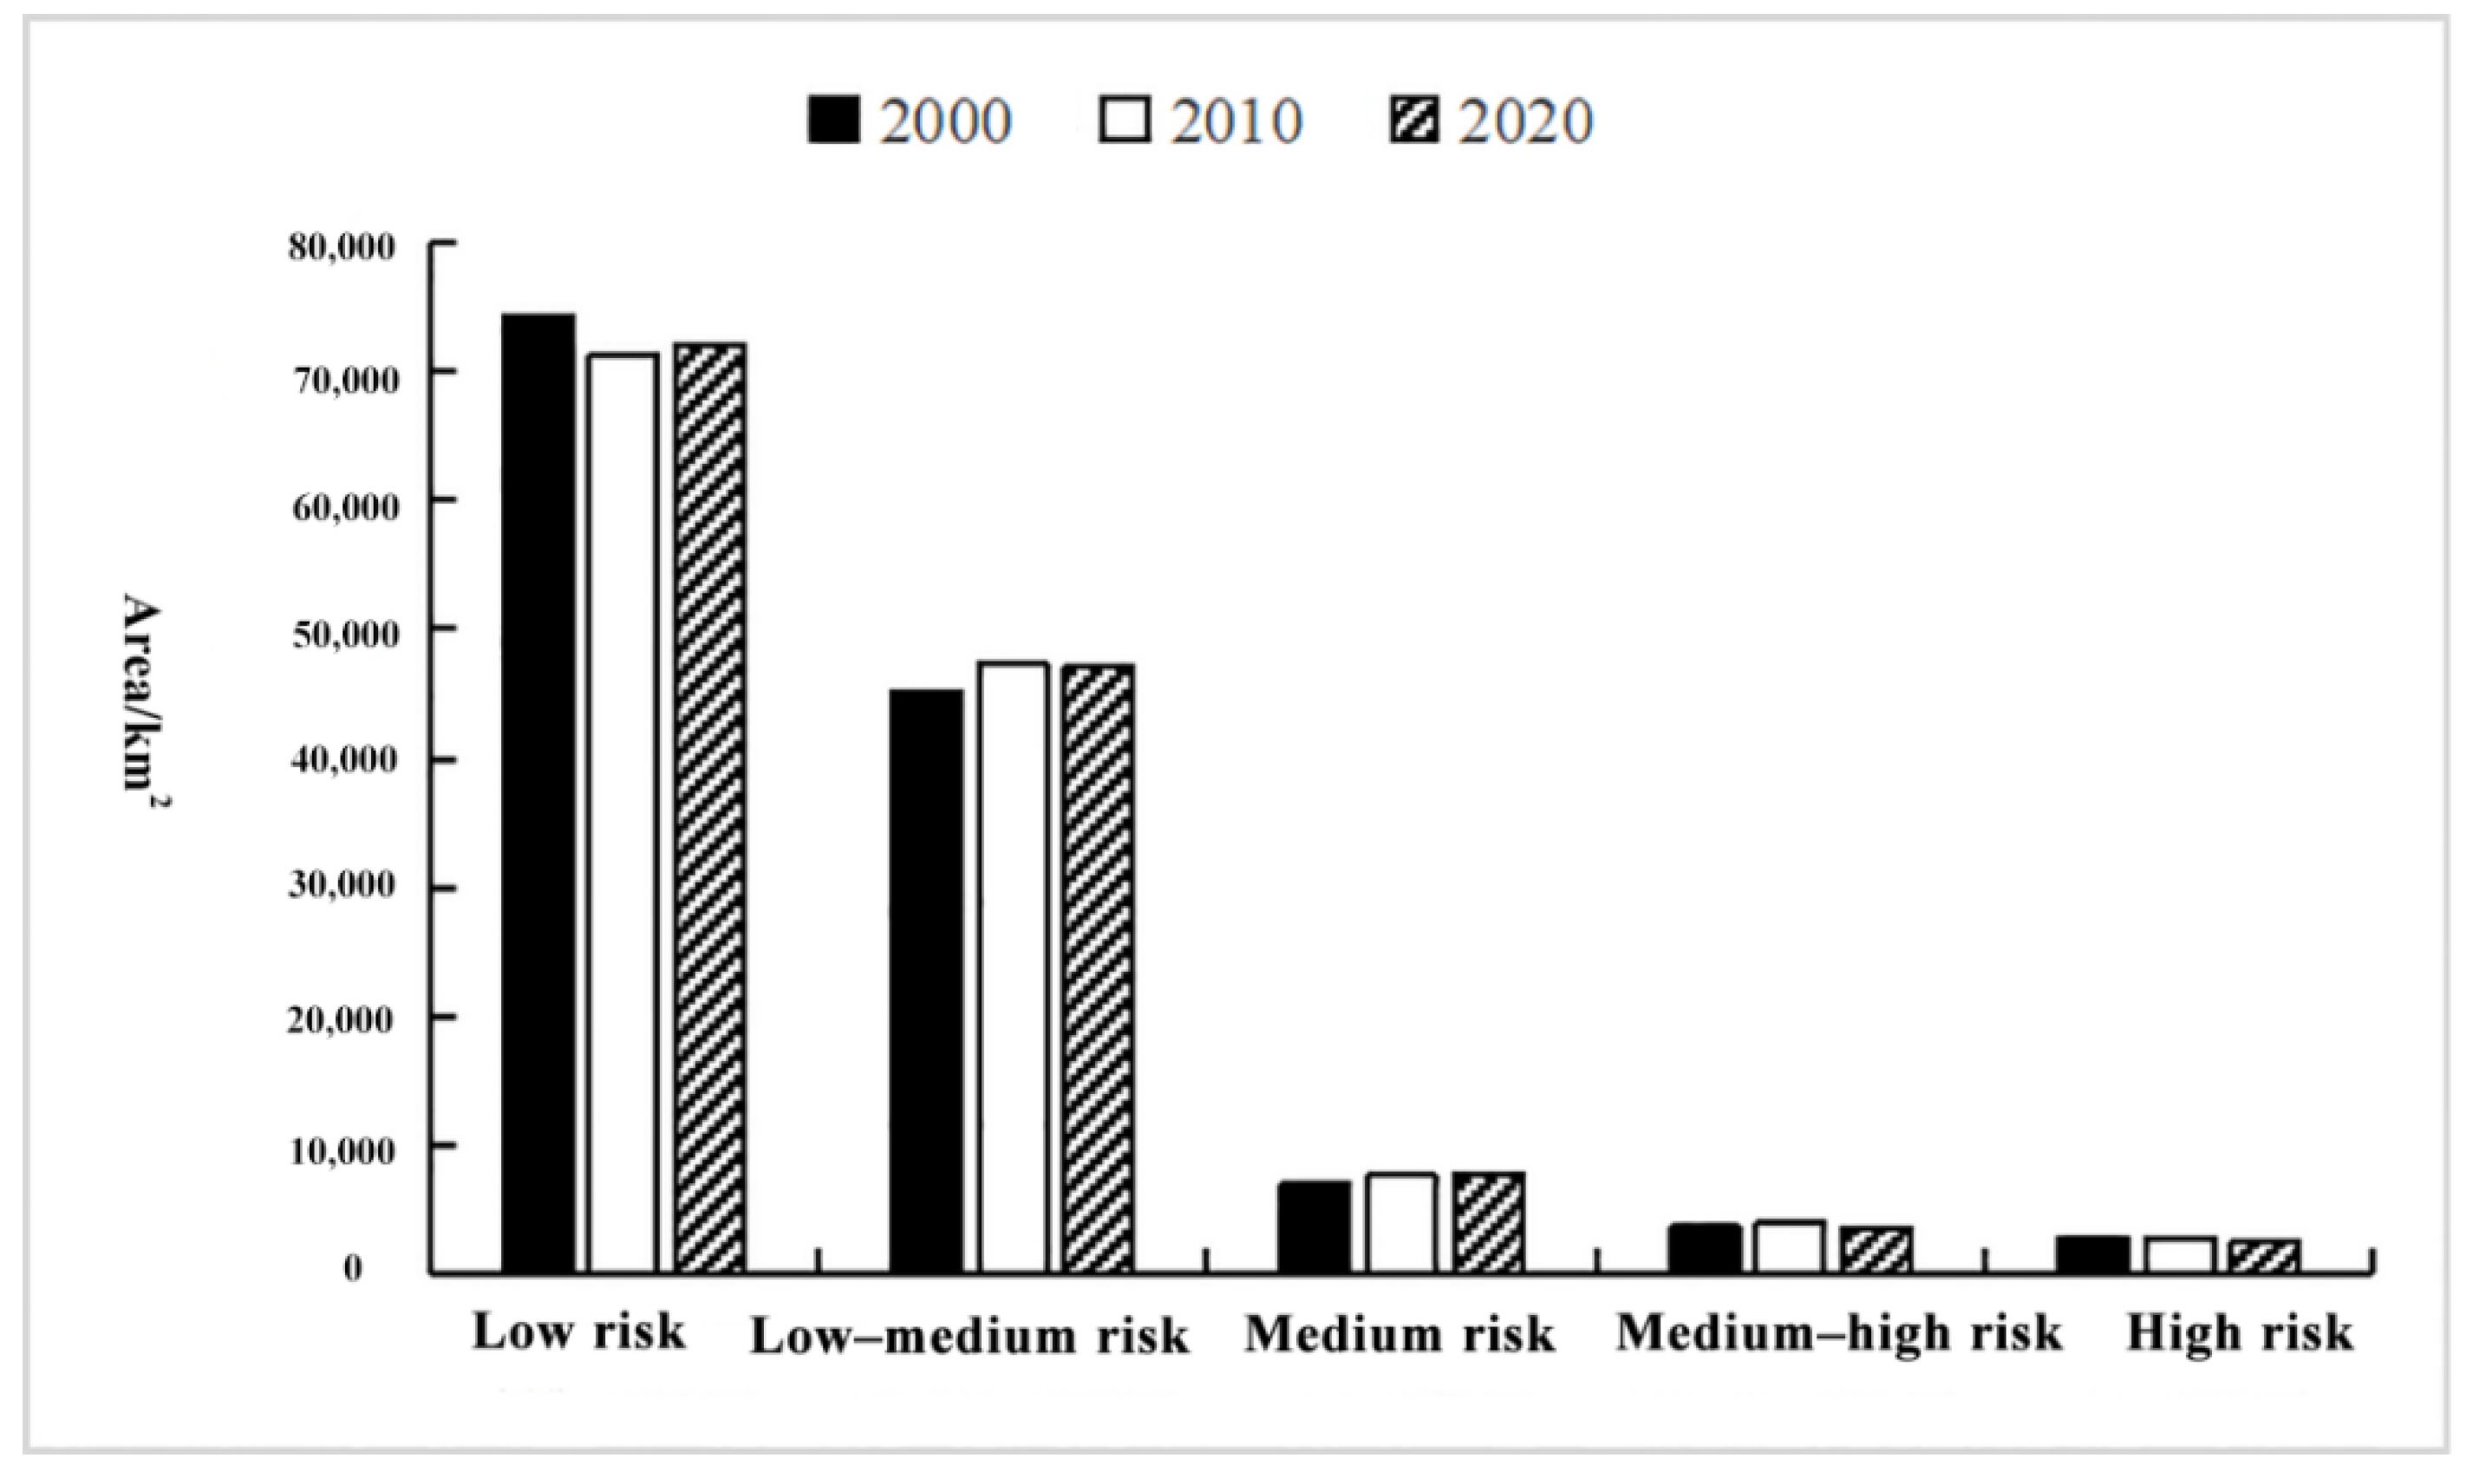
3.2. Analysis of Spatial and Temporal Changes in Ecological Risks
3.3. Analysis of the Spatial Pattern of Ecological Risks
3.3.1. Global Spatial Autocorrelation Analysis
3.3.2. Local Spatial Autocorrelation Analysis
4. Discussion
4.1. Tempo-Spatial Changes of the Land Use and Landscape Ecological Risk in YRBS
4.2. Ecological Protection and High-Quality Development of the YRBS
4.3. Limitation
5. Conclusions
Author Contributions
Funding
Institutional Review Board Statement
Informed Consent Statement
Data Availability Statement
Conflicts of Interest
References
- Gao, J.J.; Liu, X.R.; Hao, H.; Yuan, H.; Zhou, H.D. Survey on typical organic pollutants and health risks of main water sources in yellow river basin. Environ. Eng. Manag. J. 2013, 12, 1751–1755. [Google Scholar]
- Gao, P.; Wang, Y.M.; Li, P.F.; Zhao, G.J.; Sun, W.Y.; Mu, X.M. Land degradation changes in the Yellow River Delta and its response to the streamflow-sediment fluxes since 1976. Land Degrad. Dev. 2018, 29, 3212–3220. [Google Scholar] [CrossRef]
- He, J.X.; Wang, Y.X. Study on shaanxi’s leading role in the metropolitan area on ecological protection and high-quality development of the yellow river “ji” bay. J. Environ. Prot. Ecol. 2021, 22, 656–664. [Google Scholar]
- Ma, L.J.; Liu, Z.; Zhao, B.F.; Lyu, J.W.; Zheng, F.M.; Xu, W.; Gan, X.B. Variations of runoff and sediment and their response to human activities in the source region of the Yellow River, China. Environ. Earth Sci. 2021, 80, 551. [Google Scholar] [CrossRef]
- Mao, W.B.; Kang, S.Z.; Wan, Y.S.; Sun, Y.X.; Li, X.H.; Wang, Y.F. Yellow River Sediment as a Soil Amendment for Amelioration of Saline Land in the Yellow River Delta. Land Degrad. Dev. 2016, 27, 1595–1602. [Google Scholar] [CrossRef]
- Wang, M.J.; Qi, S.Z.; Zhang, X.X. Wetland loss and degradation in the Yellow River Delta, Shandong Province of China. Environ. Earth Sci. 2012, 67, 185–188. [Google Scholar] [CrossRef]
- Wohlfart, C.; Kuenzer, C.; Chen, C.; Liu, G.H. Social-ecological challenges in the Yellow River basin (China): A review. Environ. Earth Sci. 2016, 75, 1066. [Google Scholar] [CrossRef]
- Xia, H.J.; Liu, L.S.; Bai, J.H.; Kong, W.J.; Lin, K.X.; Guo, F. Wetland Ecosystem Service Dynamics in the Yellow River Estuary under Natural and Anthropogenic Stress in the Past 35 Years. Wetlands 2020, 40, 2741–2754. [Google Scholar] [CrossRef]
- Yang, X.; Zhang, H.Y.; Yang, J.; Li, H.W.; Zhu, X.B. Research on ecological compensation of water resources in the yellow river basin. Fresenius Environ. Bull. 2020, 29, 4426–4429. [Google Scholar]
- Yin, J.; Lu, Y.; Ou, Z. Regional agricultural water footprint and crop water consumption study in yellow river basin, China. Appl. Ecol. Environ. Res. 2019, 17, 5539–5559. [Google Scholar] [CrossRef]
- Bai, Y.; Chen, Y.Y.; Alatalod, J.M.; Yang, Z.Q.; Jiang, B. Scale effects on the relationships between land characteristics and ecosystem services—A case study in Taihu Lake Basin, China. Sci. Total Environ. 2020, 716, 137083. [Google Scholar] [CrossRef] [PubMed]
- Cheng, G.D.; Li, X.; Zhao, W.Z.; Xu, Z.M.; Feng, Q.; Xiao, S.C.; Xiao, H.L. Integrated study of the water-ecosystem-economy in the Heihe River Basin. Natl. Sci. Rev. 2014, 1, 413–428. [Google Scholar] [CrossRef] [Green Version]
- Flint, N.; Rolfe, J.; Jones, C.E.; Sellens, C.; Johnston, N.D.; Ukkola, L. An Ecosystem Health Index for a large and variable river basin: Methodology, challenges and continuous improvement in Queensland’s Fitzroy Basin. Ecol. Indic. 2017, 73, 626–636. [Google Scholar] [CrossRef]
- Ge, Q.Q.; Xu, W.J.; Fu, M.C.; Han, Y.X.; An, G.Q.; Xu, Y.T. Ecosystem service values of gardens in the Yellow River Basin, China. J. Arid. Land 2022, 14, 284–296. [Google Scholar] [CrossRef]
- Huang, L.Y.; Wang, J.; Chen, X.J. Ecological infrastructure planning of large river basin to promote nature conservation and ecosystem functions. J. Environ. Manag. 2022, 306, 114482. [Google Scholar] [CrossRef] [PubMed]
- Huang, X.; Ma, J.X. Changes in the ecosystem service values of typical river basins in arid regions of Northwest China. Ecohydrology 2013, 6, 1048–1056. [Google Scholar] [CrossRef]
- Liu, H.; Zheng, L.; Wu, J.; Liao, Y.H. Past and future ecosystem service trade-offs in Poyang Lake Basin under different land use policy scenarios. Arab. J. Geosci. 2020, 13, 46. [Google Scholar] [CrossRef] [Green Version]
- Liu, R.R.; Dong, X.B.; Zhang, P.; Zhang, Y.; Wang, X.W.; Gao, Y. Study on the Sustainable Development of an Arid Basin Based on the Coupling Process of Ecosystem Health and Human Wellbeing under Land Use Change—A Case Study in the Manas River Basin, Xinjiang, China. Sustainability 2020, 12, 1201. [Google Scholar] [CrossRef] [Green Version]
- Sun, R.; Yao, P.P.; Wang, W.; Yue, B.; Liu, G. Assessment of Wetland Ecosystem Health in the Yangtze and Amazon River Basins. Isprs Int. J. Geo Inf. 2017, 6, 81. [Google Scholar] [CrossRef] [Green Version]
- Sun, Y.J.; Li, J.; Liu, X.F.; Ren, Z.Y.; Zhou, Z.X.; Duan, Y.F. Spatially Explicit Analysis of Trade-Offs and Synergies among Multiple Ecosystem Services in Shaanxi Valley Basins. Forests 2020, 11, 209. [Google Scholar] [CrossRef] [Green Version]
- Woldeyohannes, A.; Cotter, M.; Biru, W.D.; Kelboro, G. Assessing Changes in Ecosystem Service Values over 1985-2050 in Response to Land Use and Land Cover Dynamics in Abaya-Chamo Basin, Southern Ethiopia. Land 2020, 9, 37. [Google Scholar] [CrossRef] [Green Version]
- Wu, C.S.; Ma, G.X.; Yang, W.S.; Zhou, Y.; Peng, F.; Wang, J.N.; Yu, F. Assessment of Ecosystem Service Value and Its Differences in the Yellow River Basin and Yangtze River Basin. Sustainability 2021, 13, 3822. [Google Scholar] [CrossRef]
- Xu, Z.H.; Fan, W.G.; Wei, H.J.; Zhang, P.; Ren, J.H.; Gao, Z.C.; Ulgiati, S.; Kong, W.D.; Dong, X.B. Evaluation and simulation of the impact of land use change on ecosystem services based on a carbon flow model: A case study of the Manas River Basin of Xinjiang, China. Sci. Total Environ. 2019, 652, 117–133. [Google Scholar] [CrossRef]
- Yang, J.; Xie, B.P.; Tao, W.Q.; Zhang, D.G. Ecosystem Services Assessment, Trade-Off, and Bundles in the Yellow River Basin, China. Diversity 2021, 13, 308. [Google Scholar] [CrossRef]
- Abdullah, A.M.; Masrur, A.; Adnan, M.S.G.; Al Baky, M.A.; Hassan, Q.K.; Dewan, A. Spatio-Temporal Patterns of Land Use/Land Cover Change in the Heterogeneous Coastal Region of Bangladesh between 1990 and 2017. Remote Sens. 2019, 11, 790. [Google Scholar] [CrossRef] [Green Version]
- Bai, Y.; Jiang, B.; Wang, M.; Li, H.; Alatalo, J.M.; Huang, S.F. New ecological redline policy (ERP) to secure ecosystem services in China. Land Use Policy 2016, 55, 348–351. [Google Scholar] [CrossRef] [Green Version]
- Burkhard, B.; Kroll, F.; Nedkov, S.; Muller, F. Mapping ecosystem service supply, demand and budgets. Ecol. Indic. 2012, 21, 17–29. [Google Scholar] [CrossRef]
- Connors, J.P.; Galletti, C.S.; Chow, W.T.L. Landscape configuration and urban heat island effects: Assessing the relationship between landscape characteristics and land surface temperature in Phoenix, Arizona. Landsc. Ecol. 2013, 28, 271–283. [Google Scholar] [CrossRef]
- Cote, I.M.; Darling, E.S.; Brown, C.J. Interactions among ecosystem stressors and their importance in conservation. Proc. R. Soc. B Biol. Sci. 2016, 283, 20152592. [Google Scholar] [CrossRef] [PubMed]
- Dadashpoor, H.; Azizi, P.; Moghadasi, M. Land use change, urbanization, and change in landscape pattern in a metropolitan area. Sci. Total Environ. 2019, 655, 707–719. [Google Scholar] [CrossRef]
- Dai, L.; Liu, Y.B.; Luo, X.Y. Integrating the MCR and DOI models to construct an ecological security network for the urban agglomeration around Poyang Lake, China. Sci. Total Environ. 2021, 754, 141868. [Google Scholar] [CrossRef] [PubMed]
- Fan, C.; Myint, S. A comparison of spatial autocorrelation indices and landscape metrics in measuring urban landscape fragmentation. Landsc. Urban Plan. 2014, 121, 117–128. [Google Scholar] [CrossRef]
- Gibb, R.; Redding, D.W.; Chin, K.Q.; Donnelly, C.A.; Blackburn, T.M.; Newbold, T.; Jones, K.E. Zoonotic host diversity increases in human-dominated ecosystems. Nature 2020, 584, 398–402. [Google Scholar] [CrossRef]
- Hale, R.; Swearer, S.E. Ecological traps: Current evidence and future directions. Proc. R. Soc. B Biol. Sci. 2016, 283, 20152647. [Google Scholar] [CrossRef] [PubMed] [Green Version]
- He, L.; Shen, J.; Zhang, Y. Ecological vulnerability assessment for ecological conservation and environmental management. J. Environ. Manag. 2018, 206, 1115–1125. [Google Scholar] [CrossRef] [PubMed]
- Hu, X.J.; Ma, C.M.; Huang, P.; Guo, X. Ecological vulnerability assessment based on AHP-PSR method and analysis of its single parameter sensitivity and spatial autocorrelation for ecological protection ? A case of Weifang City, China. Ecol. Indic. 2021, 125, 107464. [Google Scholar] [CrossRef]
- Islam, A.M.T.; Talukdar, S.; Mahato, S.; Ziaul, S.; Eibek, K.U.; Akhter, S.; Pham, Q.B.; Mohammadi, B.; Karimi, F.; Linh, N.T.T. Machine learning algorithm-based risk assessment of riparian wetlands in Padma River Basin of Northwest Bangladesh. Environ. Sci. Pollut. Res. 2021, 28, 34450–34471. [Google Scholar] [CrossRef]
- Jiang, B.; Bai, Y.; Wong, C.P.; Xu, X.B.; Alatalo, J.M. China’s ecological civilization program-Implementing ecological redline policy. Land Use Policy 2019, 81, 111–114. [Google Scholar] [CrossRef]
- Jones, N.A.; Shaw, S.; Ross, H.; Witt, K.; Pinner, B. The study of human values in understanding and managing social-ecological systems. Ecol. Soc. 2016, 21, 15. [Google Scholar] [CrossRef] [Green Version]
- Jung, J.W.; Park, J.W.; Eo, S.; Choi, J.; Song, Y.K.; Cho, Y.; Hong, S.H.; Shim, W.J. Ecological risk assessment of microplastics in coastal, shelf, and deep sea waters with a consideration of environmentally relevant size and shape. Environ. Pollut. 2021, 270, 116217. [Google Scholar] [CrossRef]
- Kroll, F.; Muller, F.; Haase, D.; Fohrer, N. Rural-urban gradient analysis of ecosystem services supply and demand dynamics. Land Use Policy 2012, 29, 521–535. [Google Scholar] [CrossRef]
- Lasanta, T.; Arnaez, J.; Pascual, N.; Ruiz-Flano, P.; Errea, M.P.; Lana-Renault, N. Space-time process and drivers of land abandonment in Europe. Catena 2017, 149, 810–823. [Google Scholar] [CrossRef]
- Lawler, J.J.; Lewis, D.J.; Nelson, E.; Plantinga, A.J.; Polasky, S.; Withey, J.C.; Helmers, D.P.; Martinuzzi, S.; Pennington, D.; Radeloff, V.C. Projected land-use change impacts on ecosystem services in the United States. Proc. Natl. Acad. Sci. USA 2014, 111, 7492–7497. [Google Scholar] [CrossRef] [Green Version]
- Levers, C.; Muller, D.; Erb, K.; Haberl, H.; Jepsen, M.R.; Metzger, M.J.; Meyfroidt, P.; Plieninger, T.; Plutzar, C.; Sturck, J.; et al. Archetypical patterns and trajectories of land systems in Europe. Reg. Environ. Chang. 2018, 18, 715–732. [Google Scholar] [CrossRef]
- Maanan, M.; Saddik, M.; Maanan, M.; Chaibi, M.; Assobhei, O.; Zourarah, B. Environmental and ecological risk assessment of heavy metals in sediments of Nador lagoon, Morocco. Ecol. Indic. 2015, 48, 616–626. [Google Scholar] [CrossRef]
- More, S.J.; Hardy, A.; Bampidis, V.; Benford, D.; Bennekou, S.H.; Bragard, C.; Boesten, J.; Halldorsson, T.I.; Hernandez-Jerez, A.F.; Jeger, M.J.; et al. Guidance on harmonised methodologies for human health, animal health and ecological risk assessment of combined exposure to multiple chemicals. Efsa J. 2019, 17, e05634. [Google Scholar] [CrossRef] [Green Version]
- Li, C.X.; Wu, J.Y. Land use transformation and eco-environmental effects based on production-living-ecological spatial synergy: Evidence from Shaanxi Province, China. Environ. Sci. Pollut. Res. 2022, 29, 41492–41504. [Google Scholar] [CrossRef]
- Sayles, J.S.; Baggio, J.A. Social-ecological network analysis of scale mismatches in estuary watershed restoration. Proc. Natl. Acad. Sci. USA 2017, 114, E1776–E1785. [Google Scholar] [CrossRef] [Green Version]
- Su, S.L.; Xiao, R.; Jiang, Z.L.; Zhang, Y. Characterizing landscape pattern and ecosystem service value changes for urbanization impacts at an eco-regional scale. Appl. Geogr. 2012, 34, 295–305. [Google Scholar] [CrossRef]
- Tscharntke, T.; Tylianakis, J.M.; Rand, T.A.; Didham, R.K.; Fahrig, L.; Batary, P.; Bengtsson, J.; Clough, Y.; Crist, T.O.; Dormann, C.F.; et al. Landscape moderation of biodiversity patterns and processes—Eight hypotheses. Biol. Rev. 2012, 87, 661–685. [Google Scholar] [CrossRef]
- Shaanxi Provincial Bureau of Statistics. Shaanxi Statistical Yearbook; China Statistics Press: Beijing, China, 2021. [Google Scholar]
- Munteanu, C.; Kuemmerle, T.; Boltiziar, M.; Butsic, V.; Gimmi, U.; Halada, L.; Kaim, D.; Kiraly, G.; Konkoly-Gyuro, E.; Kozak, J.; et al. Forest and agricultural land change in the Carpathian region-A meta-analysis of long-term patterns and drivers of change. Land Use Policy 2014, 38, 685–697. [Google Scholar] [CrossRef]
- Olsson, P.; Galaz, V.; Boonstra, W.J. Sustainability transformations: A resilience perspective. Ecol. Soc. 2014, 19, 4. [Google Scholar] [CrossRef] [Green Version]
- Peng, J.; Zhao, M.Y.; Guo, X.N.; Pan, Y.J.; Liu, Y.X. Spatial-temporal dynamics and associated driving forces of urban ecological land: A case study in Shenzhen City, China. Habitat Int. 2017, 60, 81–90. [Google Scholar] [CrossRef]
- Sarkodie, S.A. Environmental performance, biocapacity, carbon & ecological footprint of nations: Drivers, trends and mitigation options. Sci. Total Environ. 2021, 751, 141912. [Google Scholar] [CrossRef] [PubMed]
- Shaanxi Provincial Bureau of Statistics. Statistical Bulletin of Shaanxi Province; China Statistics Press: Beijing, China, 2021. [Google Scholar]
- Coops, N.C.; Wulder, M.A.; Iwanicka, D. Large area monitoring with a MODIS-based Disturbance Index (DI) sensitive to annual and seasonal variations. Remote Sens. Environ. 2009, 113, 1250–1261. [Google Scholar] [CrossRef]
- Yao, Y.; Cheng, T.; Sun, Z.; Li, L.; Chen, D.; Chen, Z.; Wei, J.; Guan, Q. VecLI: A framework for calculating vector landscape indices considering landscape fragmentation. Environ. Model. Softw. 2022, 149, 105325. [Google Scholar] [CrossRef]
- Cong, R.-G.; Ekroos, J.; Smith, H.G.; Brady, M.V. Optimizing intermediate ecosystem services in agriculture using rules based on landscape composition and configuration indices. Ecol. Econ. 2016, 128, 214–223. [Google Scholar] [CrossRef] [Green Version]
- Wang, H.; Liu, X.; Zhao, C.; Chang, Y.; Liu, Y.; Zang, F. Spatial-temporal pattern analysis of landscape ecological risk assessment based on land use/land cover change in Baishuijiang National nature reserve in Gansu Province, China. Ecol. Indic. 2021, 124, 107454. [Google Scholar] [CrossRef]
- Reddy, C.S.; Manaswini, G.; Satish, K.V.; Singh, S.; Jha, C.S.; Dadhwal, V.K. Conservation priorities of forest ecosystems: Evaluation of deforestation and degradation hotspots using geospatial techniques. Ecol. Eng. 2016, 91, 333–342. [Google Scholar] [CrossRef]
- Mo, W.; Wang, Y.; Zhang, Y.; Zhuang, D. Impacts of road network expansion on landscape ecological risk in a megacity, China: A case study of Beijing. Sci. Total Environ. 2017, 574, 1000–1011. [Google Scholar] [CrossRef] [PubMed] [Green Version]
- Yang, Y.Y.; Liu, Y.S.; Li, Y.R.; Du, G.M. Quantifying spatio-temporal patterns of urban expansion in Beijing during 1985–2013 with rural-urban development transformation. Land Use Policy 2018, 74, 220–230. [Google Scholar] [CrossRef]
- Zhao, M.W.; Wei, G.W.; Wei, C.; Wu, J.; Wei, Y. Extended CPT-TODIM method for interval-valued intuitionistic fuzzy MAGDM and its application to urban ecological risk assessment. J. Intell. Fuzzy Syst. 2021, 40, 4091–4106. [Google Scholar] [CrossRef]
- Wortley, L.; Hero, J.M.; Howes, M. Evaluating Ecological Restoration Success: A Review of the Literature. Restor. Ecol. 2013, 21, 537–543. [Google Scholar] [CrossRef]
- Wu, J.G. Urban ecology and sustainability: The state-of-the-science and future directions. Landsc. Urban Plan. 2014, 125, 209–221. [Google Scholar] [CrossRef]
- Ni, Q.; Zhao, M.J.; Li, C.Q.; Shi, Y.X.; Xu, T.; Khan, I. Multidimensional trust and its impact on the willingness to pay for ecological compensation in China’s transboundary watersheds-taking the largest tributary of the Yellow River as an example. J. Environ. Plan. Manag. 2021, 64, 2257–2275. [Google Scholar] [CrossRef]
- Li, C.; Yang, X.; Liu, H.; Zhu, H.; Wei, H.; Na, J.; Cui, X. Spatial distribution characteristics of discontinuous hillslope gullies on the Loess Plateau of China: A special focus on spoon gullies. Catena 2022, 215, 106327. [Google Scholar] [CrossRef]
- Sun, J.; Li, G.; Zhang, Y.; Qin, W.; Wang, M. Identification of priority areas for afforestation in the Loess Plateau region of China. Ecol. Indic. 2022, 140, 108998. [Google Scholar] [CrossRef]
- Sun, W.; Ding, X.; Su, J.; Mu, X.; Zhang, Y.; Gao, P.; Zhao, G. Land use and cover changes on the Loess Plateau: A comparison of six global or national land use and cover datasets. Land Use Policy 2022, 119, 106165. [Google Scholar] [CrossRef]
- Xu, X.; Zhang, D.; Zhang, Y.; Yao, S.; Zhang, J. Evaluating the vegetation restoration potential achievement of ecological projects: A case study of Yan’an, China. Land Use Policy 2020, 90, 104293. [Google Scholar] [CrossRef]
- Zhang, D.; Ge, W.; Zhang, Y. Evaluating the vegetation restoration sustainability of ecological projects: A case study of Wuqi County in China. J. Clean. Prod. 2020, 264, 121751. [Google Scholar] [CrossRef]
- Wen, X.; Théau, J. Spatiotemporal analysis of water-related ecosystem services under ecological restoration scenarios: A case study in northern Shaanxi, China. Sci. Total Environ. 2020, 720, 137477. [Google Scholar] [CrossRef] [PubMed]
- Zou, C.; Zhu, J.; Lou, K.; Yang, L. Coupling coordination and spatiotemporal heterogeneity between urbanization and ecological environment in Shaanxi Province, China. Ecol. Indic. 2022, 141, 109152. [Google Scholar] [CrossRef]
- Du, H.; Liu, X.; Jia, X.; Li, S.; Fan, Y. Assessment of the effects of ecological restoration projects on soil wind erosion in northern China in the past two decades. Catena 2022, 215, 106360. [Google Scholar] [CrossRef]
- Jiang, L.; Liu, Y.; Wu, S.; Yang, C. Analyzing ecological environment change and associated driving factors in China based on NDVI time series data. Ecol. Indic. 2021, 129, 107933. [Google Scholar] [CrossRef]
- Wei, X.; Ye, Y.; Li, B.; Chen, T. Reconstructing cropland change since 1650 AD in Shaanxi province, central China. Quat. Int. 2022, 130, 105132. [Google Scholar] [CrossRef]
- Sun, Y.; Wang, N. Development and correlations of the industrial ecology in China’s Loess Plateau: A study based on the coupling coordination model and spatial network effect. Ecol. Indic. 2021, 132, 108332. [Google Scholar] [CrossRef]
- Zhang, Q.; Li, F. Correlation between land use spatial and functional transition: A case study of Shaanxi Province, China. Land Use Policy 2022, 119, 106194. [Google Scholar] [CrossRef]
- Zhang, Y.; Yuan, J.; You, C.; Cao, R.; Tan, B.; Li, H.; Yang, W. Contributions of National Key Forestry Ecology Projects to the forest vegetation carbon storage in China. For. Ecol. Manag. 2020, 462, 117981. [Google Scholar] [CrossRef]
- Chen, Y.; Xu, F. The optimization of ecological service function and planning control of territorial space planning for ecological protection and restoration. Sustain. Comput. Inform. Syst. 2022, 35, 100748. [Google Scholar] [CrossRef]
- Li, X.; Xiao, L.; Tian, C.; Zhu, B.; Chevallier, J. Impacts of the ecological footprint on sustainable development: Evidence from China. J. Clean. Prod. 2022, 352, 131472. [Google Scholar] [CrossRef]
- Meng, Y.; Wang, M.; Xu, W.; Guan, X.; Yan, D. Structure construction, evolution analysis and sustainability evaluation of Water-Ecological-Economic system. Sustain. Cities Soc. 2022, 83, 103966. [Google Scholar] [CrossRef]
- Sun, Y.; Wang, N. Sustainable urban development of the π-shaped Curve Area in the Yellow River basin under ecological constraints: A study based on the improved ecological footprint model. J. Clean. Prod. 2022, 337, 130452. [Google Scholar] [CrossRef]


| Index | Calculation Formula | Ecological Significance |
|---|---|---|
| Landscape loss degree index (Ri) | Ri indicates the degree of loss of natural properties of ecosystems represented by different landscape types when they are subjected to natural and anthropogenic disturbances [54]. | |
| Landscape disturbance index (Ei) | Ei describes the extent to which ecosystems located in different landscape types are disturbed by human activities and characterizes differences related to maintenance of ecological stability of different landscape types [57]; a, b, and c represent weights of the corresponding landscape indices; according to results of previous studies, values of a = 0.5, b = 0.3, and c = 0.2 are assigned. | |
| Landscape fragmentation index (Ci) | Describes the degree of fragmentation of a landscape type in the region at a given time; such that, the higher its value, the lower the stability within the landscape unit and the greater the heterogeneity and discontinuity among patches [58]; ni denotes the number of patches of landscape type i and Ai denotes the total area of landscape type i. | |
| Landscape dominance index (Di) | The higher the value, the greater the influence of the landscape type on the overall landscape pattern [59]. Qi = number of samples in which patch i occurs/total number of samples; Mi = number of patch i/total number of patches; and Li = area of patch i/total area of samples. | |
| landscape separateness index (Ni) | The greater the degree of separation between different patches in a landscape type, the more discrete the distribution of the landscape type in the region for a correspondingly higher degree of fragmentation [60]; A is the total area of the landscape; Ni is the distance index of landscape type i. | |
| Landscape vulnerability index (Fi) | Based on the previous studies | The higher the value, the more vulnerable and unstable the landscape type is and the more likely it will suffer ecological losses and physical changes due to external disturbances [61]. Based on the previous studies, in this study [62], vulnerability indices of six landscape types were assigned as follows: unused land 6, water 5, cultivated land 4, grassland 3, woodland 2, and residential land 1, with the landscape vulnerability index Fi obtained after normalization. |
| Ecological Risk | Risk Level | ||||
|---|---|---|---|---|---|
| Low | Low-Medium | Medium | Medium-High | High | |
| rank | I | II | III | IV | V |
| value | 0.0135 < ERI | 0.0135 ≤ ERI < 0.030 | 0.030 ≤ ERI < 0.060 | 0.060 ≤ ERI < 0.099 | ERI ≥ 0.099 |
| Land Type | 2000–2010 | 2010–2020 | 2000–2020 | |||
|---|---|---|---|---|---|---|
| Area Change (km2) | Single Dynamics (%) | Area Change (km2) | Single Dynamics (%) | Area Change (km2) | Single Dynamics (%) | |
| Cultivated Land | −1000.56 | −0.17 | −197.86 | −0.03 | −1198.41 | −0.11 |
| Forest Land | 351.25 | 0.09 | −118.57 | −0.03 | 232.68 | 0.03 |
| Grassland | −502.24 | −0.11 | −1232.16 | −0.28 | −1734.4 | −0.2 |
| Shrubland | 159.93 | 3.14 | −28.45 | −0.41 | 131.48 | 1.36 |
| Wetland | −54.8 | −2.03 | −10.77 | −0.51 | −65.56 | −1.28 |
| Water Body | −40.31 | −0.69 | 30.08 | 0.56 | −10.23 | −0.09 |
| Artificial Surface | 1072.16 | 3.11 | 1665.78 | 3.59 | 2737.94 | 4.21 |
| Bare Ground | 14.47 | 0.09 | −103.61 | −0.64 | −89.13 | −0.29 |
| Comprehensive Dynamics (%) | 0.108 | 0.114 | 0.111 | |||
Publisher’s Note: MDPI stays neutral with regard to jurisdictional claims in published maps and institutional affiliations. |
© 2022 by the authors. Licensee MDPI, Basel, Switzerland. This article is an open access article distributed under the terms and conditions of the Creative Commons Attribution (CC BY) license (https://creativecommons.org/licenses/by/4.0/).
Share and Cite
Zhu, Z.; Mei, Z.; Xu, X.; Feng, Y.; Ren, G. Landscape Ecological Risk Assessment Based on Land Use Change in the Yellow River Basin of Shaanxi, China. Int. J. Environ. Res. Public Health 2022, 19, 9547. https://doi.org/10.3390/ijerph19159547
Zhu Z, Mei Z, Xu X, Feng Y, Ren G. Landscape Ecological Risk Assessment Based on Land Use Change in the Yellow River Basin of Shaanxi, China. International Journal of Environmental Research and Public Health. 2022; 19(15):9547. https://doi.org/10.3390/ijerph19159547
Chicago/Turabian StyleZhu, Zhiyuan, Zhikun Mei, Xiyang Xu, Yongzhong Feng, and Guangxin Ren. 2022. "Landscape Ecological Risk Assessment Based on Land Use Change in the Yellow River Basin of Shaanxi, China" International Journal of Environmental Research and Public Health 19, no. 15: 9547. https://doi.org/10.3390/ijerph19159547
APA StyleZhu, Z., Mei, Z., Xu, X., Feng, Y., & Ren, G. (2022). Landscape Ecological Risk Assessment Based on Land Use Change in the Yellow River Basin of Shaanxi, China. International Journal of Environmental Research and Public Health, 19(15), 9547. https://doi.org/10.3390/ijerph19159547