Abstract
Food security is the foundation of development. We comprehensively characterized the spatiotemporal patterns of non-grain production (NGP) areas in China and elucidated the underlying factors driving NGP. Our objectives were to map NGP on cultivated land (NGPCL) in China, and to quantify its spatiotemporal patterns, to investigate the factors underlying NGP spatial differentiation, and to provide a scientific basis for developing NGP management policies and reference points for protecting cultivated land in other countries. We mapped NGPCL in China from 2000 to 2018 using remote sensing and geographic information system data. The spatiotemporal evolution of the NGP rate (NGPR) was also investigated. The dominant factors driving NGP progression and associated interactions were identified using geographic detectors. From 2000 to 2018, the NGPR gradually decreased from 63.02% to 52.82%. NGPR was high in the west and low in the east, and its spatial differentiation and clustering patterns were statistically significant. Precipitation, temperature, altitude, and soil carbon content were the dominant factors affecting the spatial differentiation in NGPR. The interaction between these factors enhanced the spatial differentiation.
1. Introduction
As the world′s most populous country, China has always emphasized food production and the protection of cultivated land. In recent decades, China has experienced rapid economic growth and urbanization, which has been accompanied by patterns that appear contradictory (e.g., in terms of the use of cultivated land) to the emphasis China has traditionally placed on food security [1]. For example, extensive research has been conducted on the conversion of agricultural land into construction land, which has resulted in reduced agricultural output [2,3,4,5]. However, the changes in agricultural land use that have attracted the most interest have been qualitative, not quantitative (i.e., associated with the reduction in agricultural land). Specifically, the “non-grain phenomenon,” which refers to a change in planting structure within cultivated land, has attracted substantial attention from the Chinese government and researchers.
The non-grain phenomenon is widespread in China [6]. A Chinese government document titled “Opinions on preventing non-grain production of cultivated land and stabilizing grain production” emphasizes that high-quality cultivated land should be used for grain production, with an emphasis on the three major grains: rice, wheat, and corn. Farming activities that deviate from this governmental requirement are categorized as non-grain production (NGP) areas. NGP includes the cultivation of cash crops, floriculture, planting trees, and excavating ponds. These activities lead to a major shift away from grain production, resulting in labeling land as non-grain cultivating land. According to the latest statistics from China, cultivated land has reduced by 7.53 × 10⁶ ha over the past 20 years, and the average annual reduction in area is expanding. Clearly, a significant area of cultivated land is being removed from food production, which is attracting the attention of the central Chinese government. Some researchers have concluded that NGP is gradually expanding in China. Currently, the non-grain production rate (NGPR) in China is approximately 27%.
Although NGP enables farmers to diversify their output, thereby potentially increasing their financial gain and promoting China′s rural economic development, NGP has significant drawbacks. The most important aspect of NGP is that it directly reduces the land area used for grain cultivation, which poses a threat to the country′s food security. NGP also threatens local biodiversity, exacerbates non-point source pollution, and increases carbon dioxide emissions.
Previous studies on NGP have been conducted from multiple perspectives. Some have examined the qualitative drivers of NGP, whereas others have focused on environmental and socioeconomic factors. Some studies have even investigated the causes of NGP from the perspective of farmers. However, most of these studies suffer from common limitations. For example, these studies typically examine small study areas, which limits the macroscopic insights that can be gleaned from the present state of NGP in China.
Remote sensing and geographic information systems (GIS) are potent research tools for the large-scale monitoring of cultivated land [7]. With the increasing spatial resolution of remote sensing imagery and continuous technological advancement, remote sensing and GIS can effectively monitor and determine the NGP of cultivated land (NGPCL). However, only a few studies have used remote sensing data to study NGPCL.
To address the lack of national-scale spatial research on NGP, and to provide macro- and large-scale insights for understanding NGP, we comprehensively characterized the spatiotemporal patterns of NGP in China and elucidated the underlying factors that drive these patterns. The specific research objectives were: (1) to map NGPCL in China and quantify associated spatiotemporal patterns; (2) to study the factors underlying the spatial differentiation of NGPR; (3) to provide a scientific basis for developing NGP management policies; and (4) to establish a reference point for cultivated land protection in other countries.
2. Materials and Methods
2.1. Study Area and Data Acquisition
We investigated 2323 county-level units. These units spanned 31 provinces (limited by the availability of data, not including Taiwan Province, Hong Kong, and the Macau administrative area). Apart from driving factor data, land use data were obtained from the Resource and Environmental Science Data Center of the Chinese Academy of Sciences (https://www.resdc.cn/Default.aspx, accessed on 16 April 2022). In addition, spatial data for wheat, rice, and corn in China during 2000–2018 were obtained from a study by Luo et al. [8]. These data are available at https://data.mendeley.com/datasets/jbs44b2hrk/2, accessed on 16 April 2022. This dataset describes the annual spatial distribution of China′s three most important ration crops at a 1 km resolution. Multiple cropping index data were obtained from a study by Liu et al. [9]. This dataset is a 250 m spatial resolution distribution map of the annual multi-cropping index. Complete data for each county were extracted for geographic detection analysis.
2.2. Methodology
2.2.1. Exploratory Spatial Data Analysis
Exploratory spatial data analysis (ESDA) is a collection of methods and techniques for spatial data analysis using spatial correlation measurements. ESDA is crucial for describing and visualizing spatial distribution patterns. In particular, ESDA can reveal spatial agglomeration and elucidate the mechanisms behind spatial interactions between objects [10]. We used ESDA to analyze the spatial distribution pattern of non-grain cultivated land in China from three aspects: global spatial autocorrelation, local spatial autocorrelation, and standard deviation ellipse.
Global spatial autocorrelation was used to determine whether spatial correlations were present between the attribute values of spatially adjacent or disparate area units. The commonly used statistical measures of correlation in spatial statistics are Geary′s C, Moran′s I, and Getis′ G, with Moran′s I being the most common. Moran′s I is represented as a value between −1 and 1. The closer the absolute index value is to 1, the more significant the observed spatial correlation. A negative index indicates a negative spatial correlation, whereas a positive value indicates a positive spatial correlation. When Moran′s I is equal to 0, spatial correlation is absent and only randomness exists [11]. According to Moran′s I, spatially correlated phenomena are likely to be similar. The following equation was used to calculate the global autocorrelation index:
where n is the number of spatial grid data points; xi and xj are the attribute values of spatial objects at points i and j, respectively; is the mean of xi and xj; and the spatial weight matrix Wij indicates the strength of the relationship between the ith and jth points of a spatial object. Wij can be represented by various parameters, such as area, distance, and reachability.
Global Moran′s I indicates the overall correlation between spatial objects, and can identify clustering in the spatial distribution of the object. However, it cannot pinpoint the clustering distribution in space. To pinpoint the clustering distribution, we used the local Moran′s I statistic. Unlike the global statistic, local Moran′s I measures the spatial correlation between objects in local space. Local Moran′s I facilitates the visualization of the spatial clustering of data with a cluster map that delineates and categorizes spatially correlated locations [12]. Local Moran′s I is calculated as follows:
where is the mean; Wij is the spatial weight matrix; and s2 represents the discrete variance of yi.
The standard deviation ellipse is a spatial statistical method that measures the global characteristics of the spatial distribution of geographical elements from multiple perspectives, including concentration, discrete trends, and directional distribution. This method also discerns statistical insights, such as centrality, directionality, and expansion direction deviation. We used the standard deviation ellipse method to explore the spatial evolution of China′s NGP by determining the direction of change of the center of gravity and the dispersion trend. The core parameters of a standard deviation ellipse mainly include the center, azimuth, and major and minor semi-axes.
2.2.2. Geographic Detector (GeoDetector) Model
The GeoDetector model is a statistical method used to investigate the spatial heterogeneity of geographical phenomena for identifying the factors that drive heterogeneity [13,14]. GeoDetector assumes that a study can distinguish multiple subregions. When the sum of the subregion variances is less than the total regional variance, spatial heterogeneity is present. A consistent spatial distribution between two variables indicates a statistical correlation between the variables. The core idea is that if an independent variable strongly influences the dependent variable, the spatial distribution of the independent and dependent variables should be similar. This model includes four sub-detectors: factor, risk, interaction, and ecological detections. This study mainly used factor detection and interaction detection.
The q value of each factor is calculated by the factor detector, which quantitatively analyzes the spatial differentiation of each factor, and detects to what extent a certain factor explains spatial differentiation. The following formula was used to calculate factor detection:
where n = 1, 2, …, m, represents the stratification or partitioning of the independent variable X and the dependent variable Y; and N represent the number of units in layer n and in the whole area, respectively; and and are the dependent variables Y in layer n and in the whole area, respectively. The variance of the q value indicates the explanatory power, and ranges from 0 to 1. The larger the q value, the stronger the explanatory power of the independent variable X for the dependent variable Y and vice versa.
Interactive detection was used to determine whether the interaction of the independent variables Xm and Xn strengthened or weakened the explanation of the dependent variable Y, or whether the effects of the independent variables on the dependent variable Y are independent. The specific measurement method is to take the driving factors X1 and X2 as examples and to calculate the explanatory power q(X1) and q(X2) of the two independent variables to the dependent variable Y. Then, the interaction between the two independent variables and the explanatory power q(X1∩X2) of the dependent variable Y are calculated. Finally, the magnitudes of the three calculation results are compared to judge whether the influence of the interaction of two factors on the dependent variable is enhanced or weakened relative to a single factor. The judgment basis is shown in Table 1.

Table 1.
Factor interaction type.
2.3. Variable Description
2.3.1. NGPR Measurement
According to the Chinese government document titled “Opinions on preventing the non-grain production of cultivated land and stabilizing grain production,” only rice, wheat, and corn were included in this study. All land cultivation practices other than those for these three crops were defined as NGP. We used NGPR to measure NGP according to the following formula:
where L is the sum of the area of wheat, corn, and rice; C is the cultivated land area; and I is the multiple cropping index.
2.3.2. Driving Factor Determination
This study refers to previous research findings [5,15,16,17]. Considering the availability and classicality of factor data, we identified the principal selection drivers of NGPR (Table 2). In addition to weather, topography, soil, and socioeconomic variables, 11 representative indicators were selected as driving factors. These factors explain the driving forces at various levels of NGP. Moreover, we used night light indicators to measure the level of urban development [18,19].
Table 2.
Driving forces.
3. Results
3.1. NGPR Measurement and Regional Characteristics
3.1.1. Overall and Regional Characteristics
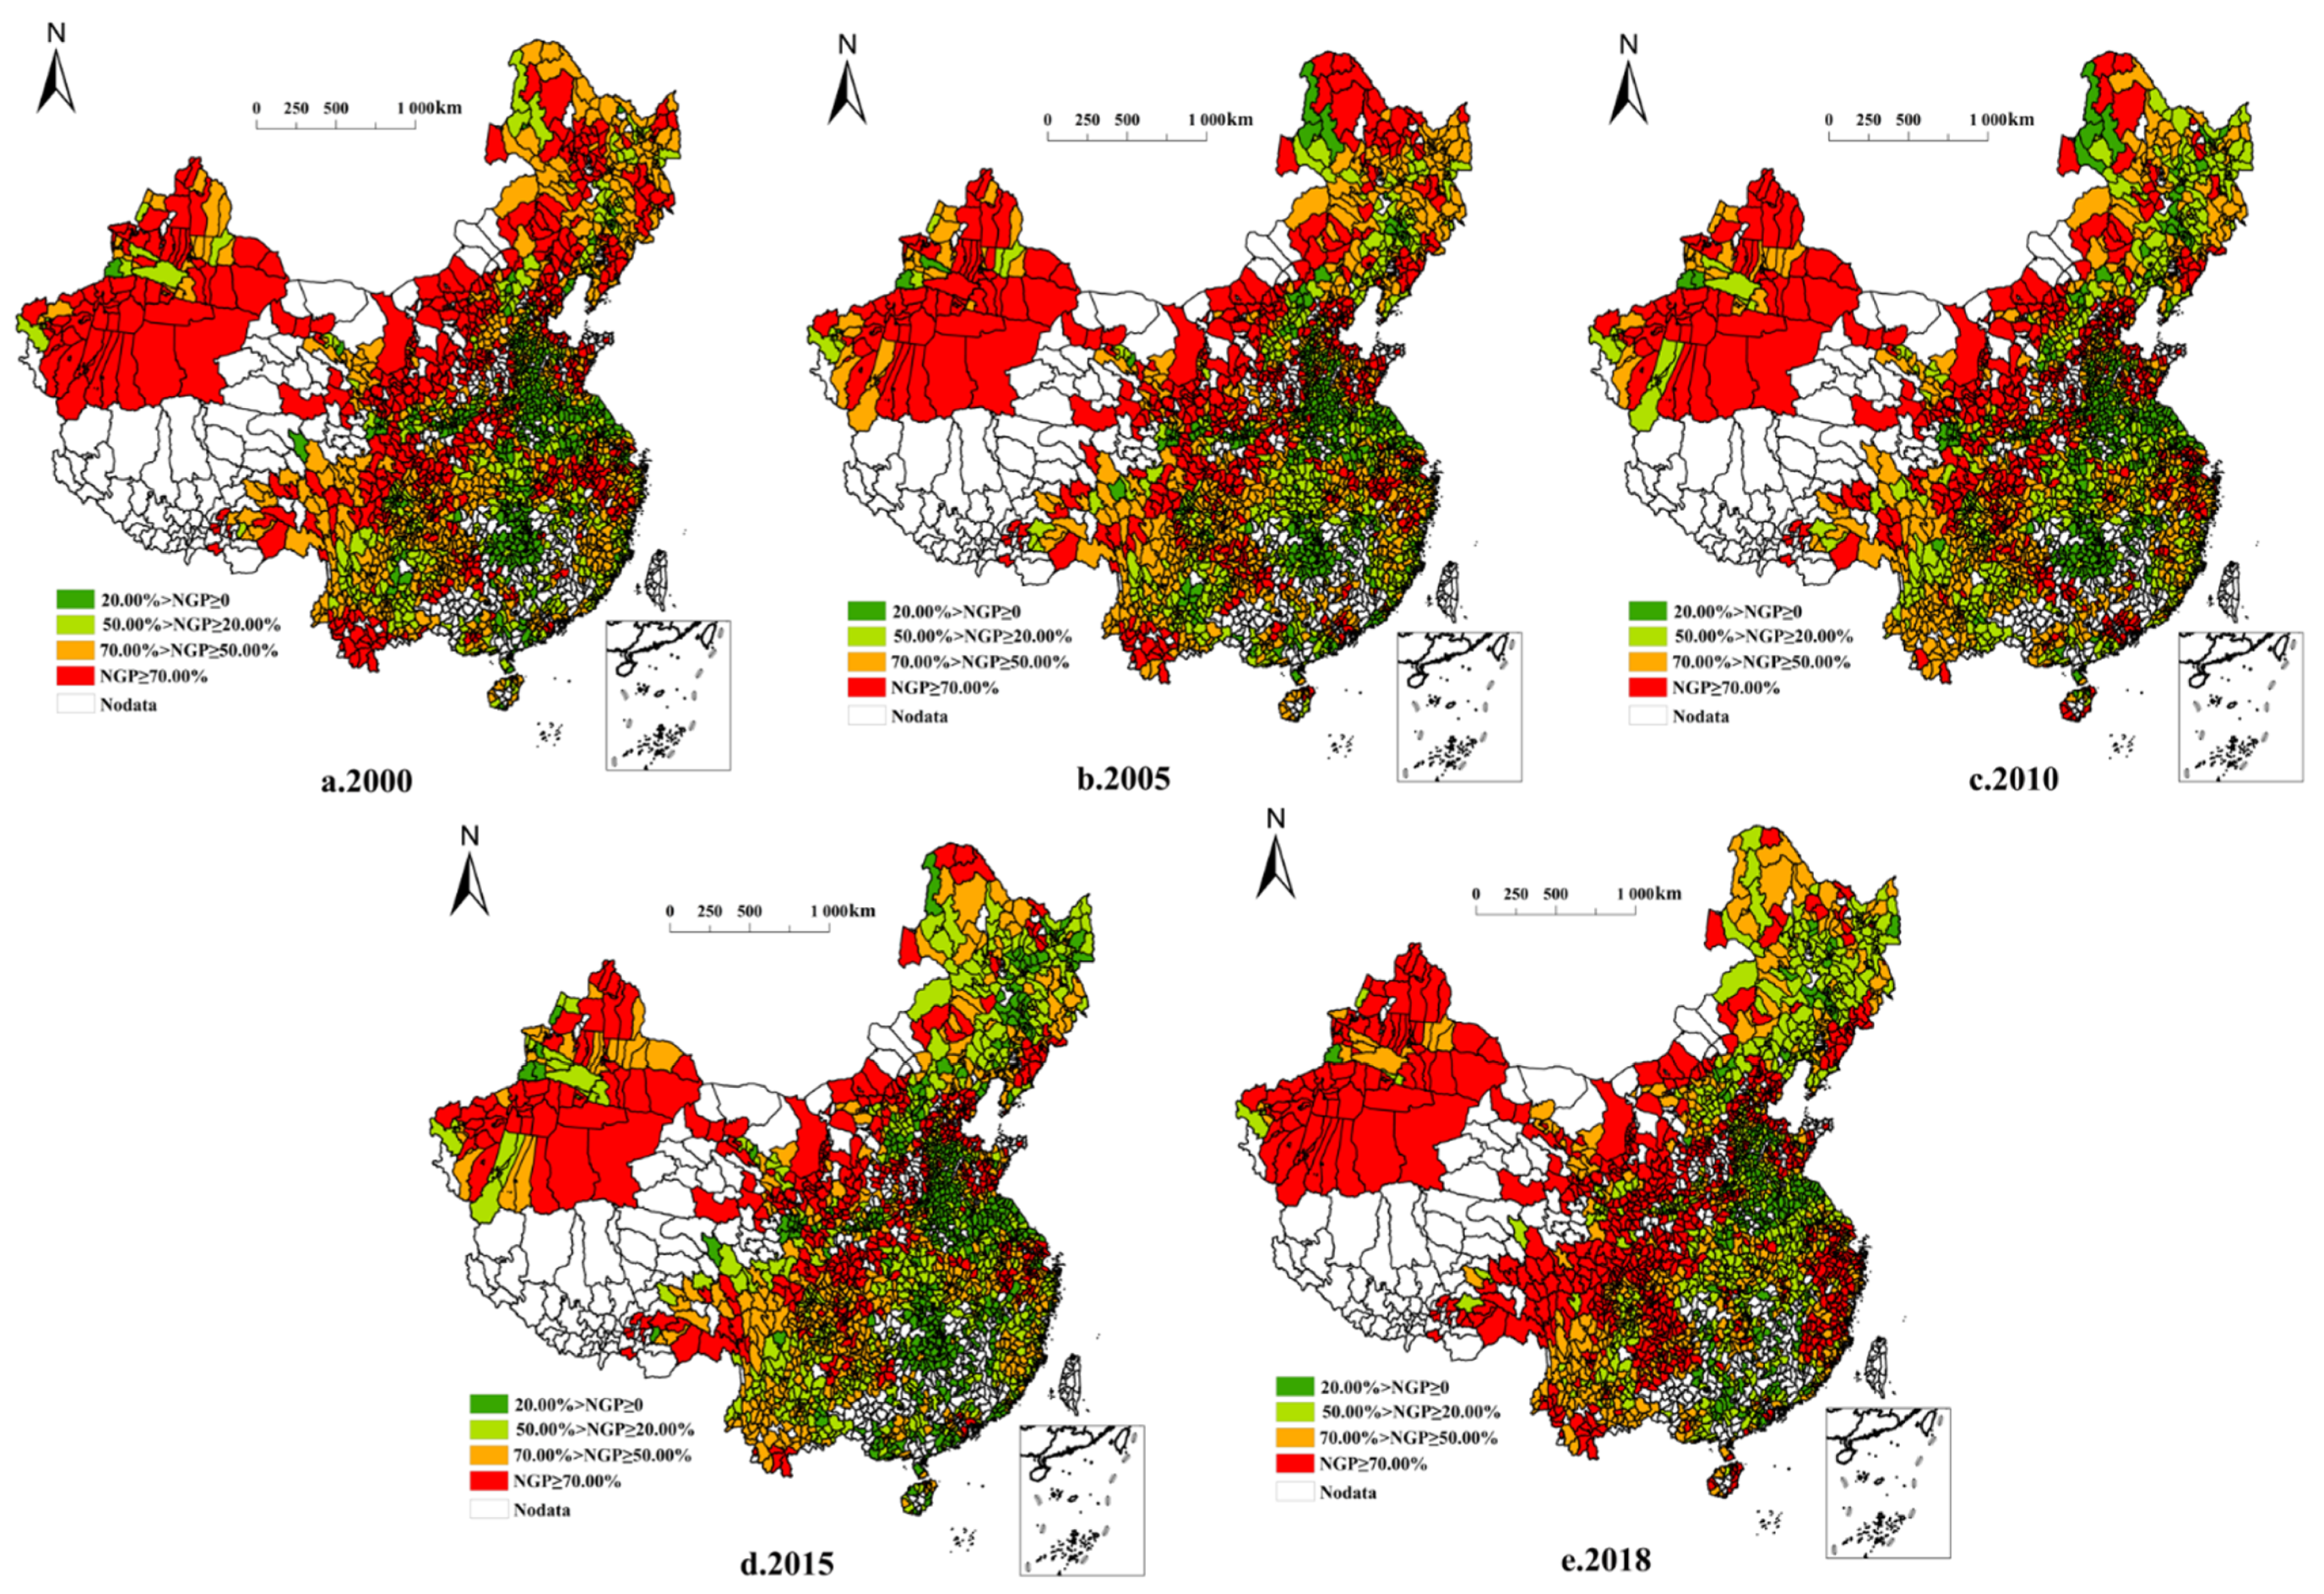
The national NGPR decreased from 63.02% in 2000 to 52.82% in 2018. However, the NGPR varied across different regions, owing to factors such as natural resource endowment and socioeconomic development. From the perspective of county-level units, the spatial distribution pattern of NGPR characteristics and regional units is relatively consistent. The following points can be observed in Figure 1: (1) NGPR is distributed in a pattern of “high in the west and low in the east.” Among the 2323 county-level units, 1078 have NGPR > 50%, representing 46.4% of the national NGPR. Some hilly and mountainous fields are small, with small per capita areas, which are not conducive to large-scale mechanized farming. Thus, farmers prefer planting crops with high economic benefits in these areas. (2) The spatial NGPR pattern showed a multicenter distribution. A total of 629 county-level units exhibited a non-grain area larger than 5.0 × 10⁴ ha. The spatial patterns of NGPR and non-grain areas were not mirrored across counties. For example, the non-grain area of units with high NGPR was smaller along the southeast coast. In contrast, in the northwest and northeast regions, the NGPR was high, and the non-grain area was widespread.

Figure 1.
Non-grain production rate of 2323 county-level units in China from 2000 to 2018.
3.1.2. NGPR Spatial Variability Patterns
Standard deviation ellipse analysis (Figure 2) revealed that the angle of the standard deviation ellipse changed from 56.40° in 2000 to 76.06° in 2018, thus revealing a pattern related to the spatial concentration and evolution of NGPR. This result indicates that NGPR is directed from “northeast to southwest.” The spatial NGPR pattern is also decentralized. Specifically, the long axis of the standard deviation ellipse gradually shortened from 2000 to 2018, whereas the short axis remained largely unchanged. Under the combined action of the long and short axes, the eccentricity gradually decreased. Further, the area of the standard deviation ellipse gradually decreased from 4.33 × 10⁸ ha in 2000 to 4.18 × 10⁸ ha in 2018, thus exhibiting a clear decentralization trend.
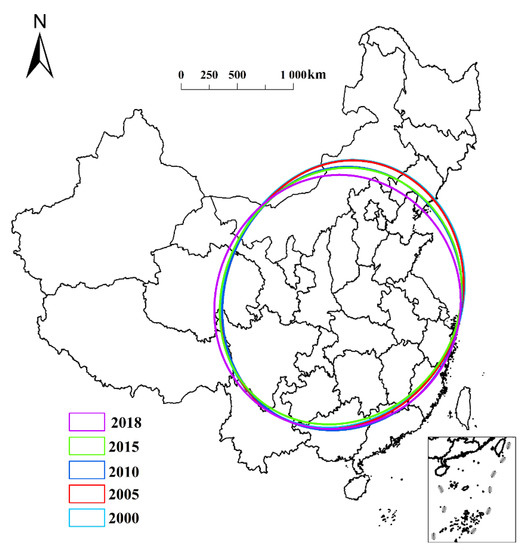
Figure 2.
Trend of non-grain production rate in China from 2000 to 2018.
3.2. Spatial Correlation and Differentiation Patterns of the NGPR
3.2.1. Global Spatial Correlation Characteristics
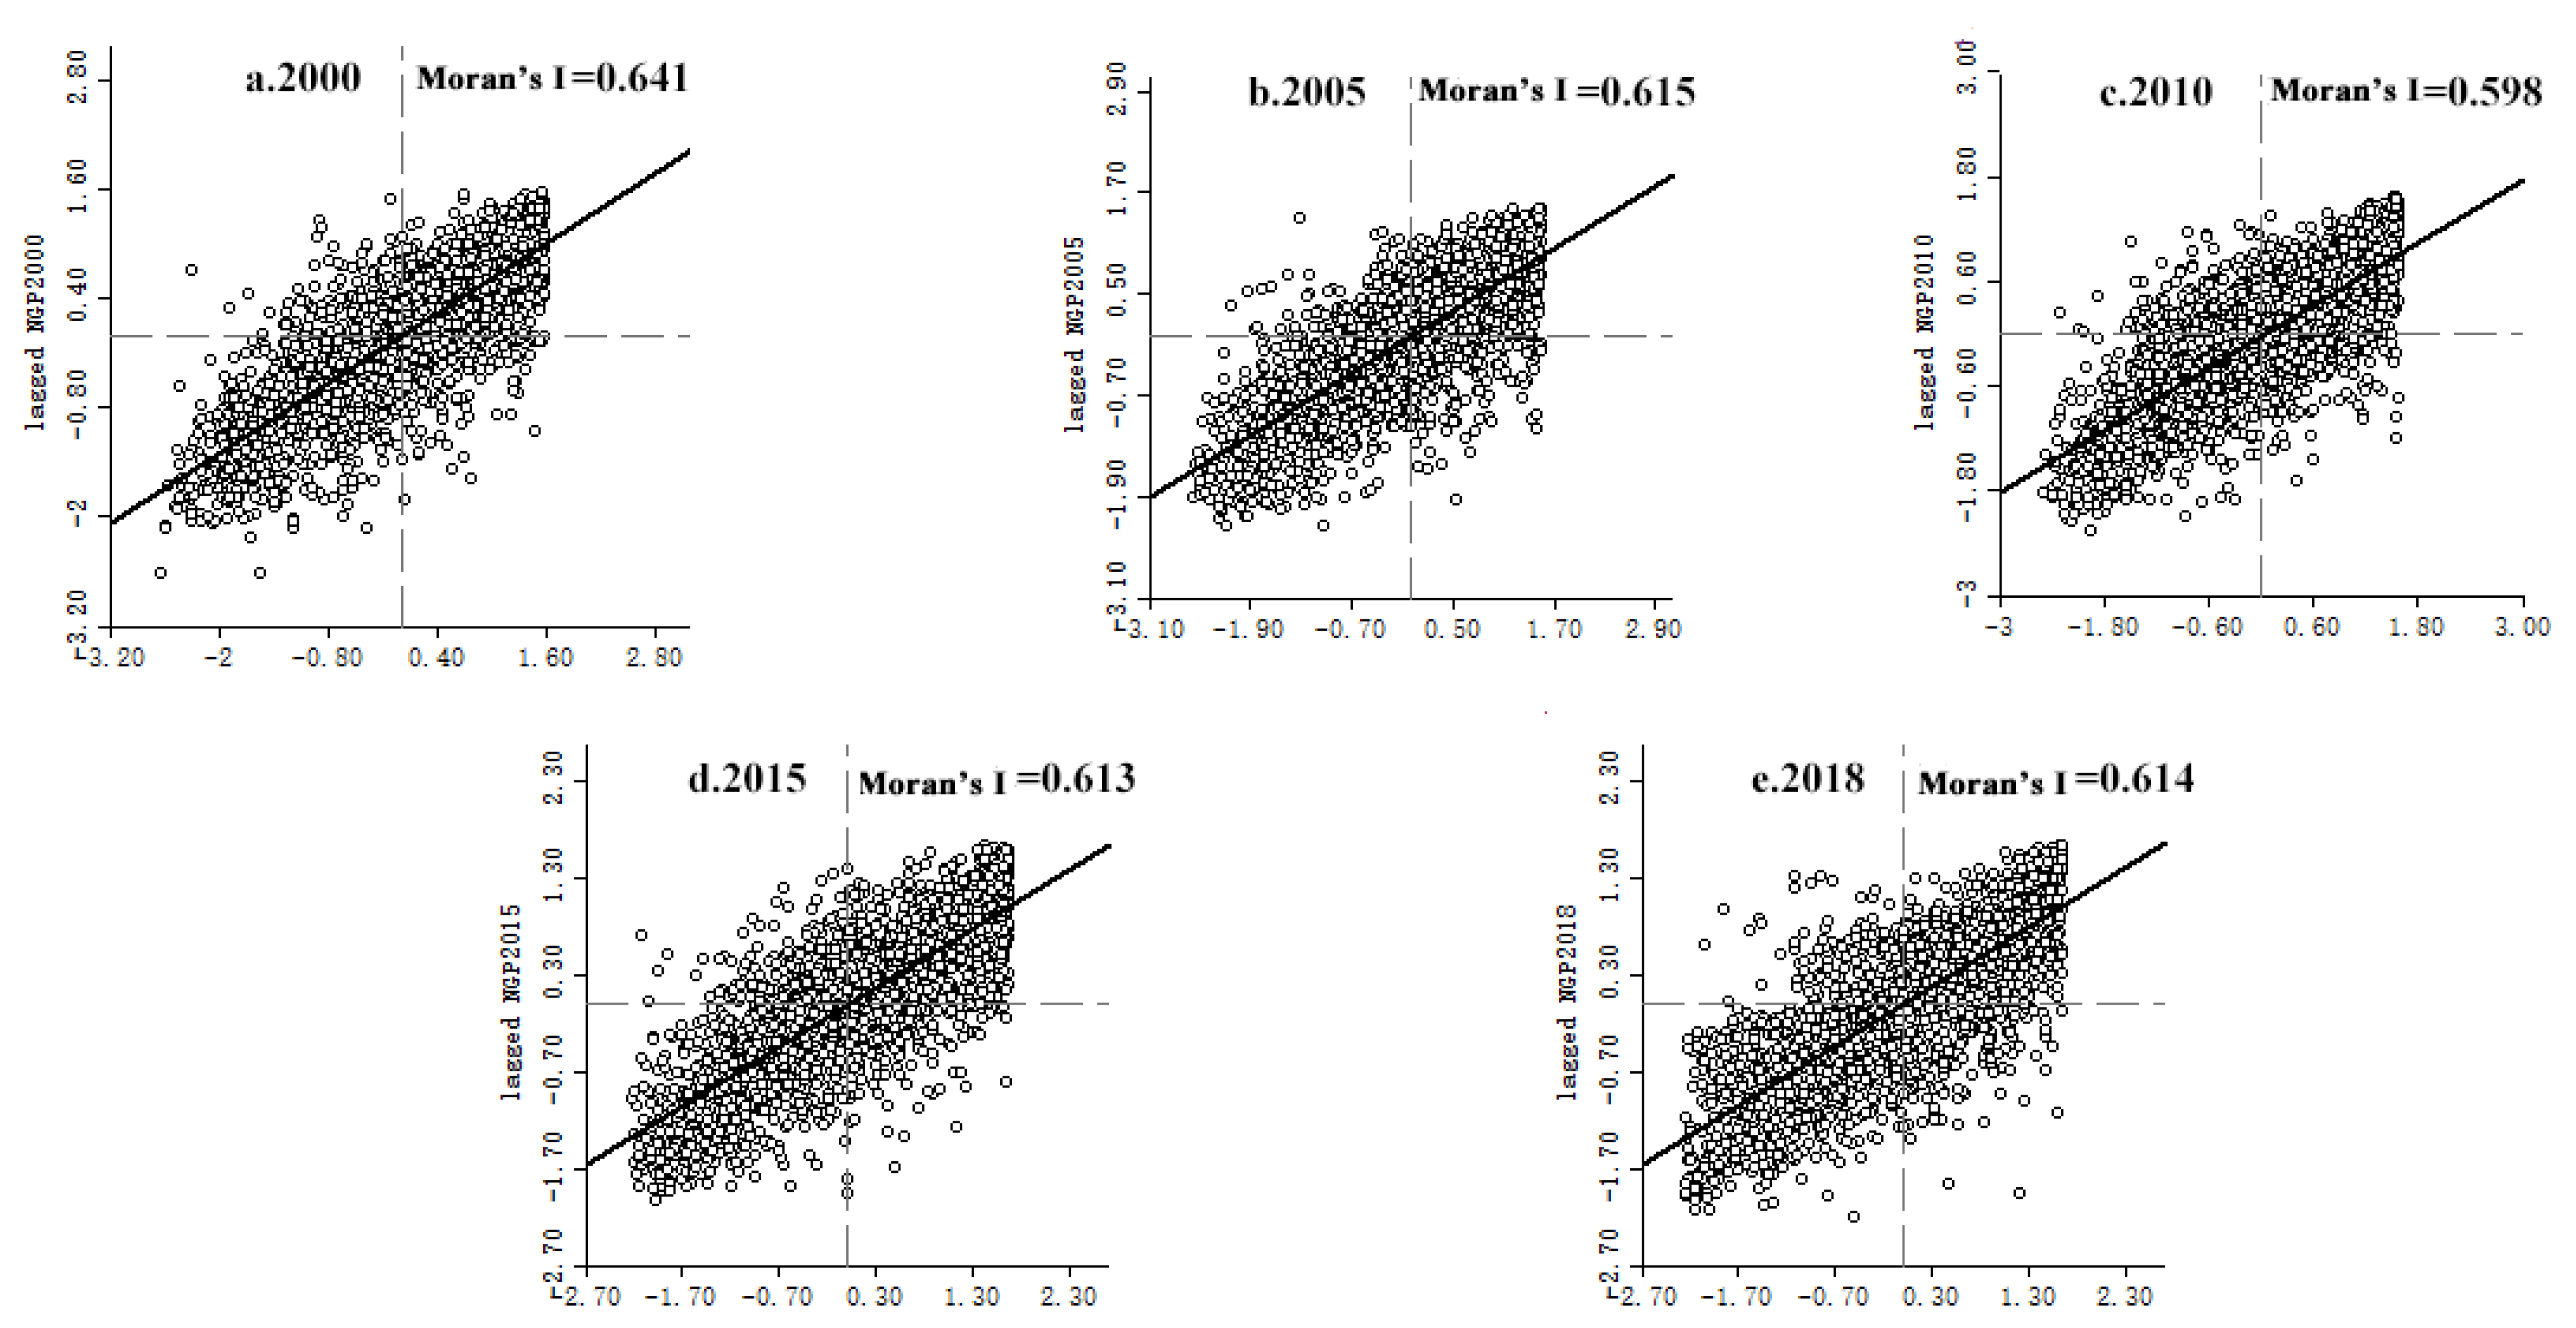
Significance tests were performed on the global spatial autocorrelation of NGPR. From 2000 to 2018, the global spatial NGPR autocorrelation passed significance tests at the 1% level, indicating that NGPR has a strong spatial correlation. The global Moran′s I values for NGPR in 2000, 2005, 2010, 2015, and 2018 were 0.310, 0.274, 0.271, 0.254, and 0.325, respectively. These values indicate a positive spatial autocorrelation. The NGPR distribution was thus spatially clustered, and the degree of spatial clustering increased over time (Table 3).
Table 3.
Global Moran′s I from 2000 to 2018.
3.2.2. Local Spatial Differentiation Patterns
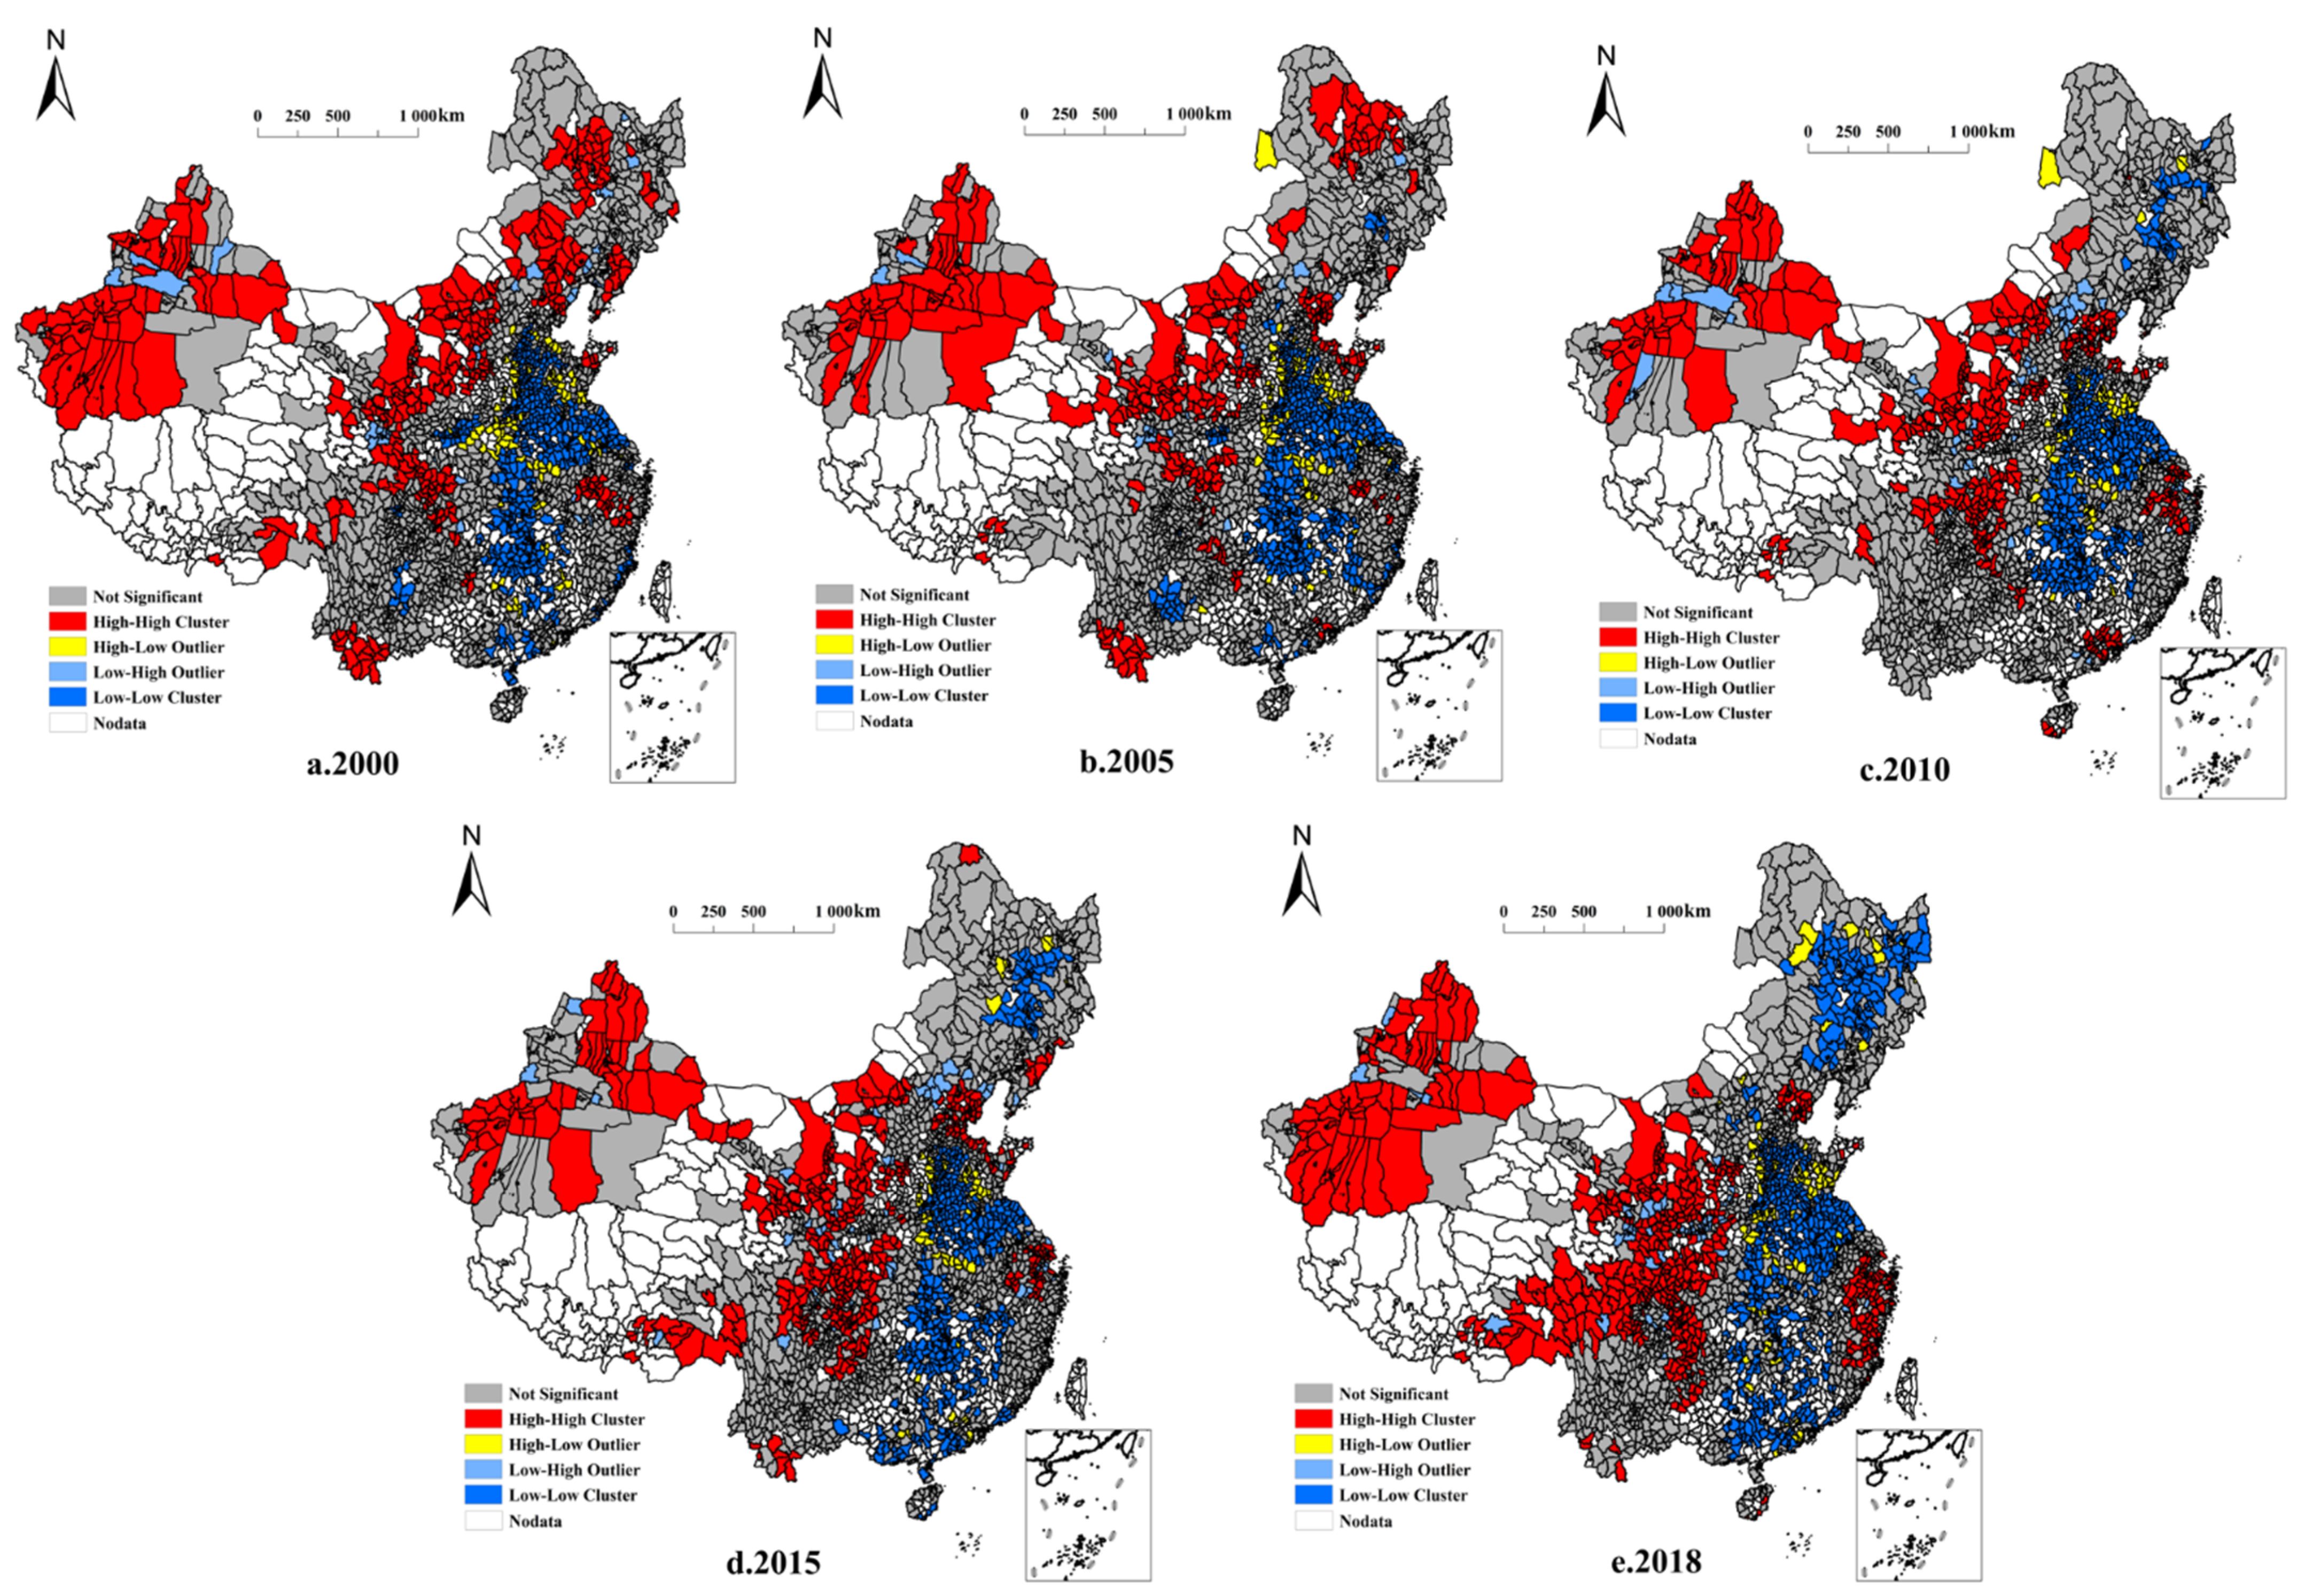
A local indicator of spatial association (LISA) cluster distribution map and a Moran scatter plot of NGPR in China′s county areas were calculated for each county. Figure 3 shows 2323 county-level geographic units distributed across four zones: H-H (high-high clustering), L-H (low-high clustering), L-L (low-low clustering), and H-L (high-low clustering). Even at a local scale, the NGPR spatial cluster pattern maintained the same “low in the east and high in the west” distribution as that at the country-wide level. H-H clustering was most strongly associated with arid regions of northern China, the Sichuan Basin, and surrounding areas. The Huanghuaihai Plain, the middle and lower reaches of the Yangtze River, and the Northeast Plain showed L-L clustering, whereas H-L and L-H clustering exhibited sporadic distributions and local fluctuations. Most clustering fell within the first and third quadrants of the Moran scatter plot (Figure 4), indicating the probable dominance of H-H and L-L clustering.

Figure 3.
Local indicator of spatial association (LISA) cluster distribution map.

Figure 4.
Moran′s I scatter plot of non-grain production rate.
The stable distribution of NGPR with H-H clustering was primarily observed in Xinjiang, the Sichuan Basin, and in parts of the Loess Plateau. From 2000 to 2018, the overall change in NGPR coverage was characterized as “stabilizing in the northwest and expanding to the southwest”. Most of the stable distribution of NGPR with L-L clustering appeared in the Huanghuaihai Plain and parts of the middle and lower reaches of the Yangtze River. The overall coverage from 2000 to 2018 showed that coverage was “stable in the southeast and expanding to the northeast.” The NGPR areas with H-L and L-H clustering were small and sporadic, mainly occurring in peripheral regions adjacent to H-H and L-L clusters. In addition, hot spot analysis indicated the presence of NGPR hot spots in the west, and cold spots in the east. These results corresponded to the LISA cluster distribution map, further supporting the significance of the observed high- and low-value clusters (Figure 5).
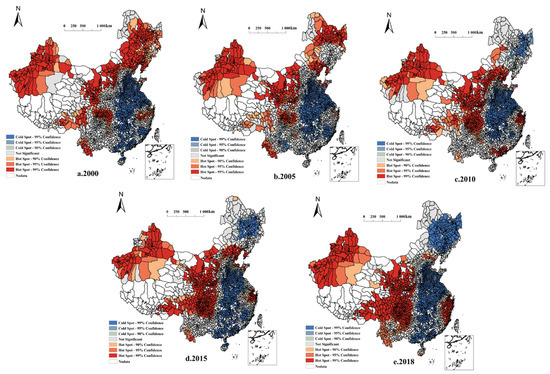
Figure 5.
Hot spot analysis of the non-grain production rate.
3.3. Factor Identification of NGPR Spatial Differentiation
3.3.1. Identifying Dominant Factors
In this study, the factor detector method was used to obtain q-values for five typical time points in 2000, 2005, 2010, 2015, and 2018. These q-values were then ranked (Table 4). The explanatory power of each factor passed the 1% significance level test.
Table 4.
Factor detection results for the spatial differentiation of the non-grain production rate in China.
Overall, the factors with the greatest impact on the spatial differentiation of NGPR were annual average precipitation, annual average temperature, elevation, and soil carbon content. Each factor had a q-value greater than 0.1.
When examining the dominant factors, interesting patterns emerged. First, the explanatory power of the annual average precipitation, annual average temperature, and elevation decreased over time. Specifically, the q value of the annual average precipitation, annual average temperature, and elevation decreased from 0.128, 0.172, and 0.137 in 2000 to 0.062, 0.108, and 0.087 in 2018, respectively. These results reflect a decrease in the influence of natural constraints in shaping NGPR progression. The explanatory power of nighttime lights, distance from highway, distance from railway, and soil carbon content increased between 2000 and 2018. Their q-values increased from 0.047, 0.046, 0.023, and 0.105 in 2000 to 0.068, 0.053, 0.035, and 0.132 in 2018, respectively. This result indicates that the influence of socioeconomic development and soil quality factors on the spatial differentiation of NGPR is increasing.
In addition, a stable pattern emerged on ranking the explanatory powers of the most dominant factors. Ranked from highest to lowest, the average annual temperature, elevation, average annual precipitation, soil carbon content, and nighttime lights were the top five factors in 2000. This trend remained mostly unchanged in 2018, with soil carbon content, annual average temperature, elevation, nighttime lights, and average annual precipitation topping the list.
3.3.2. Interaction between Factors
The dominant factors were selected from factor detection, and used to analyze the interaction mechanisms affecting NGPR spatial differentiation to further investigate the changes in the explanatory power of NGPR upon the interaction of different driving factors. Data from the years 2000, 2005, 2010, 2015, and 2018 were analyzed. The results (Table 5) revealed that the factors had a relatively close relationship during the research period, rather than being independent of each other. The q-values obtained from the interaction between the driving factors showed different degrees of improvement. The combined effect of two factors typically improved the explanatory power of the NGPR spatial differentiation.
Table 5.
Spatial differentiation interactive detection results for non-grain production rate in China.
In terms of the types of interaction, 72% of the interactions among the dominant factors showed bivariate enhancement (BE), whereas the rest showed nonlinear enhancement (NE). From the year 2000 to 2018, the explanatory power of each two-factor interaction was different, indicating volatility over time.
Specifically, the explanatory power of the interaction between precipitation and temperature on NGPR decreased from 0.221 in 2000 to 0.143 in 2018. This interaction remained BE, mainly owing to the explanatory power of the decreasing temperature and precipitation during this period. The explanatory power of the interaction between precipitation and elevation initially decreased and then increased. The type of action changed from BE to NE. This change was mainly related to the change in a single factor (elevation). The explanatory power of the interaction between precipitation and soil carbon content decreased and then increased, and the effect type was BE, likely because of the increasing influence of soil carbon content on NGPR spatial differentiation. The explanatory power and action type of the interaction between elevation and nighttime lights showed an unstable change. The explanatory power first decreased and then increased, whereas the action type underwent the following changes: NE → BE → NE → BE. These sporadic changes were mainly caused because the explanatory power of elevation and nighttime light fluctuated over time.
4. Discussion
The central government, local governments, and farmers have different goals for cultivated land use [20]. The central government aims to maintain the basic welfare of the populace, local governments aim to pursue local economic growth and improve official performance, and farmers try to maximize their personal economic gains. Thus, the impact of NGP on each group is different. Because planting non-food crops can achieve higher economic benefits and can significantly promote local economic development, some local governments can ignore or even allow NGP behaviors to a certain extent. Farmers are largely driven by economic interests, so they tend to plant cash crops with higher economic returns instead of growing food crops. For the central government, NGP threatens the security of national food supply, and if left unchecked for a long time, NGP may cause substantial costs to manage the resulting economic fluctuations and social unrest. Therefore, NGP caters to the short-term development needs of local governments and farmers, but is not conducive to safeguarding the common interests of the central government and society in the long run [21,22,23,24,25,26].
4.1. Impact of NGP on Food Security
NGP first impacts the quality of cultivated land. There are obvious differences in the impact of different types of NGP on the quality of cultivated land. Previous studies have showed that economic crops, such as vegetables and oil crops, have little effect on the ploughing layer. Additionally, if a reasonable crop rotation and effective nutrition practices can be adopted, the quality of cultivated land can be improved. Some fruits can destroy the original soil structure of cultivated land and reduce the quality of cultivated land, but it is relatively easy to restore cultivated land fertility. However, if the cultivated land is used for the production of fast-growing trees, such as poplar, or other types of economic trees with developed root systems, soil degradation, e.g., soil compaction and acidification, often arises because the trees absorb water and fertilizers during long-term planting [27,28,29,30,31,32]. Digging ponds and breeding fish in many areas completely removes the cultivated layer of arable land. In these cases, a large amount of foreign soil is required to rebuild the cultivated layer and gradually restore the land quality. Thus, different NGP types have different effects on the quality of cultivated land, so their role in food security should also be analyzed differently. Moderately supporting NGP behaviors that are beneficial to the quality of cultivated land is beneficial to national food security, whereas long-term laissez-faire NGP behaviors that damage the cultivated layer can seriously threaten national food security.
The second factor is the impact on grain yields in different regions. The main grain-producing areas play an important role in stabilizing national food security. Most studies propose that grain production practices should focus on the main grain-producing areas. Additionally, these studies propose the adoption of strict measures to increase agricultural investment, adjust the structure of grain varieties in a timely manner, and establish a system of preferential interests. It is thus important to prevent NGP behaviors in major grain-producing areas to ensure China′s food security as a whole. In fact, it is unfair to pin the heavy responsibility of ensuring food security on the main grain-producing areas alone. As some major grain-producing areas are economically underdeveloped traditional agricultural areas, these areas bear a heavy responsibility for grain production and pay relatively high costs for arable land protection. The low profit margin of grain crops further affects the economy of the main grain-producing areas. A complete regional compensation system has not been established, which exacerbates the inequitable distribution of grain production responsibilities among different functional areas, thereby threatening the stability of China′s grain production and supply [33,34,35,36,37,38,39,40,41,42,43,44].
4.2. Drivers of NGP
The land economic theory states that the essence of land use is the interaction between people and land. Similarly, NGP is the result of interactions between people and land. NGP is affected by nature, economy, society, and institutions. Owing to the comprehensive effect of various factors, the driving factors of NGP are distinct at different scales, but they mainly include subjective factors from farmers themselves, the objective natural environment of cultivated land, and socioeconomic factors [45,46,47,48,49].
Farmers are the most important actors during the utilization of cultivated land. Their behavioral habits, action logic, and psychological expectations directly or indirectly determine the choice of planting behavior, which, in turn, affects the agricultural planting structure. Since China is a large agricultural country with a long history, the effect of the historical and cultural background of farmers cannot be ignored in their planting decisions. With the rapid advancement of urbanization, Chinese farmers are also accelerating their differentiation. Research on the grain-growing logic of new agricultural management entities is conducive to comprehensively and systematically characterize the heterogeneity of Chinese farmers. The natural environment of cultivated land is another important prerequisite for agricultural management choices. Previous studies have found that the natural environment of cultivated land is inseparable from NGP. Scholars typically examine cultivated land quality, geographical location, village type, and topography. A good natural environment for cultivated land is the primary prerequisite for crop cultivation. At the same time, the environment provides the possibility to develop adaptable crops. Strategies to control NGP should be adapted to the land conditions, and differentiated control plans should be proposed according to the natural factors that cause NGP. Socioeconomic development is an important driving force for the transformation of the agricultural structure, and is an important driving factor for NGP. Previous research mainly studied NGP formation from the perspective of economic benefits, farmland transfers, industrial and commercial capital going to the countryside, and grain subsidy policies. With the comprehensive promotion of rural revitalization, a large amount of industrial and commercial capital has been moved to the countryside. However, owing to the profit-seeking nature of industrial and commercial entities, under the guidance of economic interests, the tendency of new agricultural business entities toward NGP is particularly strong. Therefore, driven by rapid urbanization, industrial and commercial capital cannot achieve the original intention of revitalizing the countryside, but instead exacerbate the NGP situation of the planting structure [5,50,51,52,53,54,55].
4.3. NGP Control Measures
NGP is affected by the background of rapid urbanization, and is the result of multiple factors, including the farmers interests, the natural cultivated land environment, and socioeconomic factors. Distinct regions exhibit different manifestations. Therefore, identifying and analyzing different NGP types is an important prerequisite for the rational recognition and management of NGP. Future research should clearly distinguish how different non-grain types impact NGP and affect the quality of cultivated land. Further, future studies should propose targeted management and control strategies [56,57,58,59,60].
From the perspective of food security, NGP prevention and control is an important and difficult research topic in China. In general, the foremost problem of NGP control is to solve the problem of the relatively low returns from growing grain. To this end, many studies advocate that grain subsidies should be increased to make grain growing truly profitable for farmers. Fundamentally, the essence of NGP from the perspective of food security is the need to coordinate the competition between short-term economic benefits and long-term food security. Therefore, it is necessary to develop policies at the national level for constructing a “benefit sharing” mechanism for grain-producing areas. The main grain sales, production, and sales balance areas could thus trade grain production indicators for main grain production areas with better arable land resource endowments. This approach can ensure the stability of national grain output and provide moderate support for NGP to help farmers increase their income [61,62,63,64,65,66].
5. Conclusions
This study systematically examined the evolution of NGP in China from 2000 to 2018. We specifically investigated the spatial pattern of NGPCL in China and elucidated the key factors driving NGPR. Our results support the following conclusions: (1) From 2000 to 2018, the national NGPR gradually decreased from 63.02% to 52.82%. However, owing to factors such as natural resource endowment and socioeconomic development, NGPR varies greatly in different regions. (2) A significantly positive spatial correlation of NGPR exists in Chinese counties, with the distribution having a geographical clustering effect. The degree of spatial clustering is also increasing. From 2000 to 2018, the overall coverage showed a trend of stable northwest coverage and expansion to the southwest. (3) The dominant factors controlling the spatial differentiation of NGPR are annual average precipitation, annual average temperature, elevation, and soil carbon content. Interactions between these factors improve the explanatory power of NGPR spatial differentiation. The interaction type between the dominant factors is mainly two-factor enhancement, supplemented by nonlinear enhancement.
Overall, this study is a large-scale study on a national scale. On the basis of this study, detailed future studies could be conducted at the plot scale. At the same time, the impact of NGP on the ecosystem and farmers′ grain-growing behavior at the household scale could be investigated.
Author Contributions
Conceptualization, Z.Z. and Y.F.; methodology, Z.Z.; software, Z.Z.; validation, Z.D., S.L., and Z.Z.; formal analysis, Z.Z.; investigation, Z.D.; writing—original draft preparation, Z.Z.; writing—review and editing, Y.F.; funding acquisition, Y.F. All authors have read and agreed to the published version of the manuscript.
Funding
This research was funded by the Shaanxi Provincial Forestry Science and Technology Innovation Program Special Project (grant number SXLK20200102) and the China Association for Science and Technology 2020 Postgraduate Science Popularization Ability Improvement Project (grant number kxyjs202034).
Institutional Review Board Statement
Not applicable.
Informed Consent Statement
Not applicable.
Data Availability Statement
The land use data were obtained from https://www.resdc.cn/Default.aspx, accessed on 20 April 2022. Furthermore, the China 2000–2018 spatial data for wheat, rice, and corn were obtained from https://data.mendeley.com/datasets/jbs44b2hrk/2, accessed on 17 April 2022. The data that support the findings of this study are available from the corresponding author upon reasonable request.
Conflicts of Interest
The authors declare no conflict of interest.
References
- Newbold, T.; Hudson, L.N.; Hill, S.L.; Contu, S.; Lysenko, I.; Senior, R.A.; Borger, L.; Bennett, D.J.; Choimes, A.; Collen, B.; et al. Global effects of land use on local terrestrial biodiversity. Nature 2015, 520, 45–50. [Google Scholar] [CrossRef] [PubMed] [Green Version]
- Li, C.; Wu, J. Land use transformation and eco-environmental effects based on production-living-ecological spatial synergy: Evidence from Shaanxi Province, China. Environ. Sci. Pollut. Res. 2022, 29, 41492–41504. [Google Scholar] [CrossRef]
- Li, Y.; Li, Y.; Westlund, H.; Liu, Y. Urban-rural transformation in relation to cultivated land conversion in China: Implications for optimizing land use and balanced regional development. Land Use Policy 2015, 47, 218–224. [Google Scholar] [CrossRef]
- Liang, X.; Guan, Q.; Clarke, K.C.; Liu, S.; Wang, B.; Yao, Y. Understanding the drivers of sustainable land expansion using a patch-generating land use simulation (PLUS) model: A case study in Wuhan, China. Comput. Environ. Urban Syst. 2020, 85, 101569. [Google Scholar] [CrossRef]
- Liang, X.; Jin, X.; Yang, X.; Xu, W.; Lin, J.; Zhou, Y. Exploring cultivated land evolution in mountainous areas of Southwest China, an empirical study of developments since the 1980s. Land Degrad. Dev. 2021, 32, 546–558. [Google Scholar] [CrossRef]
- Su, Y.; Li, C.L.; Wang, K.; Deng, J.S.; Shahtahmassebi, A.R.; Zhang, L.P.; Ao, W.J.; Guan, T.; Pan, Y.; Gan, M.Y. Quantifying the spatiotemporal dynamics and multi-aspect performance of non-grain production during 2000–2015 at a fine scale. Ecol. Indic. 2019, 101, 410–419. [Google Scholar] [CrossRef]
- Su, Y.; Qian, K.; Lin, L.; Wang, K.; Guan, T.; Gan, M. Identifying the driving forces of non-grain production expansion in rural China and its implications for policies on cultivated land protection. Land Use Policy 2020, 92, 104435. [Google Scholar] [CrossRef]
- Luo, Y.; Zhang, Z.; Li, Z.; Chen, Y.; Zhang, L.; Cao, J.; Tao, F. Identifying the spatiotemporal changes of annual harvesting areas for three staple crops in China by integrating multi-data sources. Environ. Res. Lett. 2020, 15, 074003. [Google Scholar] [CrossRef]
- Liu, X.; Zheng, J.; Yu, L.; Hao, P.; Chen, B.; Xin, Q.; Fu, H.; Gong, P. Annual dynamic dataset of global cropping intensity from 2001 to 2019. Sci. Data 2021, 8, 283. [Google Scholar] [CrossRef]
- Ye, X.Y.; Rey, S. A framework for exploratory space-time analysis of economic data. Ann. Reg. Sci. 2013, 50, 315–339. [Google Scholar] [CrossRef]
- Pan, J.W.; Chen, Y.Y.; Zhang, Y.; Chen, M.; Fennell, S.; Luan, B.; Wang, F.; Meng, D.; Liu, Y.L.; Jiao, L.M.; et al. Spatial-temporal dynamics of grain yield and the potential driving factors at the county level in China. J. Clean. Prod. 2020, 255, 120312. [Google Scholar] [CrossRef]
- Zhang, Y.; Liu, Y.; Zhang, Y.; Liu, Y.; Zhang, G.; Chen, Y. On the spatial relationship between ecosystem services and urbanization: A case study in Wuhan, China. Sci. Total Environ. 2018, 637, 780–790. [Google Scholar] [CrossRef] [PubMed]
- Wang, J.F.; Li, X.H.; Christakos, G.; Liao, Y.L.; Zhang, T.; Gu, X.; Zheng, X.Y. Geographical Detectors-Based Health Risk Assessment and its Application in the Neural Tube Defects Study of the Heshun Region, China. Int. J. Geogr. Inf. Sci. 2010, 24, 107–127. [Google Scholar] [CrossRef]
- Wang, J.-F.; Zhang, T.-L.; Fu, B.-J. A measure of spatial stratified heterogeneity. Ecol. Indic. 2016, 67, 250–256. [Google Scholar] [CrossRef]
- Chen, L.; Song, G.; Meadows, M.E.; Zou, C. Spatio-temporal evolution of the early-warning status of cultivated land and its driving factors: A case study of Heilongjiang Province, China. Land Use Policy 2018, 72, 280–292. [Google Scholar] [CrossRef]
- Liu, X.; Zhao, C.; Song, W. Review of the evolution of cultivated land protection policies in the period following China′s reform and liberalization. Land Use Policy 2017, 67, 660–669. [Google Scholar] [CrossRef]
- Qu, Y.; Jiang, G.-h.; Li, Z.; Tian, Y.; Wei, S. Understanding rural land use transition and regional consolidation implications in China. Land Use Policy 2019, 82, 742–753. [Google Scholar] [CrossRef]
- Bickenbach, F.; Bode, E.; Nunnenkamp, P.; Soder, M. Night lights and regional GDP. Rev. World Econ. 2016, 152, 425–447. [Google Scholar] [CrossRef] [Green Version]
- Levin, N.; Kyba, C.C.M.; Zhang, Q.L.; de Miguel, A.S.; Roman, M.O.; Li, X.; Portnov, B.A.; Molthan, A.L.; Jechow, A.; Miller, S.D.; et al. Remote sensing of night lights: A review and an outlook for the future. Remote Sens. Environ. 2019, 237, 111443. [Google Scholar] [CrossRef]
- Zhou, Y.; Li, X.H.; Liu, Y.S. Rural land system reforms in China: History, issues, measures and prospects. Land Use Policy 2019, 91, 104330. [Google Scholar] [CrossRef]
- Barrera, E.L.; Hertel, T. Global food waste across the income spectrum: Implications for food prices, production and resource use. Food Policy 2020, 98, 101874. [Google Scholar] [CrossRef]
- Deng, X.; Xu, D.D.; Zeng, M.; Qi, Y.B. Does Internet use help reduce rural cropland abandonment? Evidence from China. Land Use Policy 2019, 89, 104243. [Google Scholar] [CrossRef]
- Deng, X.Z.; Gibson, J. Improving eco-efficiency for the sustainable agricultural production: A case study in Shandong, China. Technol. Forecast. Soc. Chang. 2019, 144, 394–400. [Google Scholar] [CrossRef]
- Fitton, N.; Alexander, P.; Arnell, N.; Bajzelj, B.; Calvin, K.; Doelman, J.; Gerber, J.S.; Havlik, P.; Hasegawa, T.; Herrero, M.; et al. The vulnerabilities of agricultural land and food production to future water scarcity. Glob. Environ. Chang.-Hum. Policy Dimens. 2019, 58, 101944. [Google Scholar] [CrossRef]
- Ge, D.Z.; Long, H.L.; Zhang, Y.G.; Ma, L.; Li, T.T. Farmland transition and its influences on grain production in China. Land Use Policy 2018, 70, 94–105. [Google Scholar] [CrossRef]
- Ma, L.; Long, H.L.; Tu, S.S.; Zhang, Y.N.; Zheng, Y.H. Farmland transition in China and its policy implications. Land Use Policy 2020, 92, 104470. [Google Scholar] [CrossRef]
- Kang, L.; Zhao, R.; Wu, K.N.; Huang, Q.; Zhang, S.C. Impacts of Farming Layer Constructions on Cultivated Land Quality under the Cultivated Land Balance Policy. Agronomy 2021, 11, 2403. [Google Scholar] [CrossRef]
- Li, L.Y.; Li, T.S. Improvement Measurement to Guarantee the Quantity and Quality of Ecological Cultivated Land. Ekoloji 2019, 28, 1835–1845. [Google Scholar]
- Liu, L.M.; Zhou, D.; Chang, X.; Lin, Z.L. A new grading system for evaluating China′s cultivated land quality. Land Degrad. Dev. 2020, 31, 1482–1501. [Google Scholar] [CrossRef]
- Sheng, Y.; Liu, W.Z.; Xu, H.L.; Gao, X.C. The Spatial Distribution Characteristics of the Cultivated Land Quality in the Diluvial Fan Terrain of the Arid Region: A Case Study of Jimsar County, Xinjiang, China. Land 2021, 10, 896. [Google Scholar] [CrossRef]
- Song, W.; Zhang, H.Z.; Zhao, R.; Wu, K.N.; Li, X.J.; Niu, B.B.; Li, J.Y. Study on cultivated land quality evaluation from the perspective of farmland ecosystems. Ecol. Indic. 2022, 139, 108959. [Google Scholar] [CrossRef]
- Tan, Y.Z.; Chen, H.; Lian, K.; Yu, Z.N. Comprehensive Evaluation of Cultivated Land Quality at County Scale: A Case Study of Shengzhou, Zhejiang Province, China. Int. J. Environ. Res. Public Health 2020, 17, 1169. [Google Scholar] [CrossRef] [PubMed] [Green Version]
- Chen, C.; Pang, Y.M. Response of maize yield to climate change in Sichuan province, China. Glob. Ecol. Conserv. 2019, 22, e00893. [Google Scholar] [CrossRef]
- Chu, Z.D.; Ming, B.; Li, L.L.; Xue, J.; Zhang, W.X.; Hou, L.Y.; Xie, R.Z.; Hou, P.; Wang, K.R.; Li, S.K. Dynamics of maize grain drying in the high latitude region of Northeast China. J. Integr. Agric. 2022, 21, 365–374. [Google Scholar] [CrossRef]
- Duan, B.; Fang, S.H.; Gong, Y.; Peng, Y.; Wu, X.T.; Zhu, R.S. Remote estimation of grain yield based on UAV data in different rice cultivars under contrasting climatic zone. Field Crops Res. 2021, 267, 108148. [Google Scholar] [CrossRef]
- Hou, P.; Liu, Y.E.; Liu, W.M.; Yang, H.S.; Xie, R.Z.; Wang, K.R.; Ming, B.; Liu, G.Z.; Xue, J.; Wang, Y.H.; et al. Quantifying maize grain yield losses caused by climate change based on extensive field data across China. Resour. Conserv. Recycl. 2021, 174, 105811. [Google Scholar] [CrossRef]
- Liu, M.; Guo, Y.; Wang, Y.F.; Hao, J. Changes of Extreme Agro-Climatic Droughts and Their Impacts on Grain Yields in Rain-Fed Agricultural Regions in China over the Past 50 Years. Atmosphere 2021, 13, 4. [Google Scholar] [CrossRef]
- Niu, Y.N.; Xie, G.D.; Xiao, Y.; Liu, J.Y.; Wang, Y.Y.; Luo, Q.; Zou, H.X.; Gan, S.; Qin, K.Y.; Huang, M.D. Spatiotemporal Patterns and Determinants of Grain Self-Sufficiency in China. Foods 2021, 10, 747. [Google Scholar] [CrossRef] [PubMed]
- Sun, M.Y.; Chou, J.M.; Xu, Y.; Yang, F.; Li, J.N. Study on the thresholds of grain production risk from climate change in China′s main grain-producing areas. Phys. Chem. Earth 2020, 116, 102837. [Google Scholar] [CrossRef]
- Sun, Z.Q.; Hu, R.F.; Hong, Y. Does yield gap still matter? Evidence from rice production in China. Food Secur. 2022, 14, 829–840. [Google Scholar] [CrossRef]
- Wang, D.Y.; Li, X.Y.; Ye, C.; Xu, C.M.; Chen, S.; Chu, G.; Zhang, Y.B.; Zhang, X.F. Geographic variation in the yield formation of single-season high-yielding hybrid rice in southern China. J. Integr. Agric. 2021, 20, 438–449. [Google Scholar] [CrossRef]
- Xue, L.Z.; Khan, S.B.; Sun, M.; Anwar, S.; Ren, A.X.; Gao, Z.A.; Lin, W.; Xue, J.F.; Yang, Z.P.; Deng, Y. Effects of tillage practices on water consumption and grain yield of dryland winter wheat under different precipitation distribution in the loess plateau of China. Soil Tillage Res. 2019, 191, 66–74. [Google Scholar] [CrossRef]
- Yan, Y.Y.; Hou, P.; Duan, F.Y.; Niu, L.; Dai, T.B.; Wang, K.R.; Zhao, M.; Li, S.K.; Zhou, W.B. Improving photosynthesis to increase grain yield potential: An analysis of maize hybrids released in different years in China. Photosynth. Res. 2021, 150, 295–311. [Google Scholar] [CrossRef] [PubMed]
- Zhang, H.; Tao, F.L.; Zhou, G.S. Potential yields, yield gaps, and optimal agronomic management practices for rice production systems in different regions of China. Agric. Syst. 2019, 171, 100–112. [Google Scholar] [CrossRef]
- Tan, S.K.; Liu, Q.; Han, S.Y. Spatial-temporal evolution of coupling relationship between land development intensity and resources environment carrying capacity in China. J. Environ. Manag. 2021, 301, 113778. [Google Scholar] [CrossRef]
- Zhang, M.Y.; Chen, Q.X.; Zhang, K.W. Influence of the variation in rural population on farmland preservation in the rapid urbanization area of China. J. Geogr. Sci. 2021, 31, 1365–1380. [Google Scholar] [CrossRef]
- Zhang, R.T.; Lu, J.F. Simulation of Land Use Pattern Evolution from a Multi-Scenario Perspective: A Case Study of Suzhou City in Anhui Province, China. Int. J. Environ. Res. Public Health 2021, 18, 921. [Google Scholar] [CrossRef]
- Zhou, Y.; Li, X.H.; Liu, Y.S. Cultivated land protection and rational use in China. Land Use Policy 2021, 106, 105454. [Google Scholar] [CrossRef]
- Zhuang, Q.W.; Shao, Z.F.; Huang, X.; Zhang, Y.; Wu, W.F.; Feng, X.X.; Lv, X.W.; Ding, Q.; Cai, B.W.; Altan, O. Evolution of soil salinization under the background of landscape patterns in the irrigated northern slopes of Tianshan Mountains, Xinjiang, China. Catena 2021, 206, 105561. [Google Scholar] [CrossRef]
- Gong, Y.L.; Li, J.T.; Li, Y.X. Spatiotemporal characteristics and driving mechanisms of arable land in the Beijing-Tianjin-Hebei region during 1990-2015. Socio-Economic Plan. Sci. 2019, 70, 100720. [Google Scholar] [CrossRef]
- Liu, Y.X.; Liu, S.L.; Sun, Y.X.; Wang, F.F.; Li, M.Q. Driving forces of cultivated land evolution in agro-pastoral areas on the Qinghai-Tibet Plateau based on ecological niche theory. J. Clean. Prod. 2021, 313, 127899. [Google Scholar] [CrossRef]
- Lu, X.H.; Zhang, Y.W.; Zou, Y.C. Evaluation the effect of cultivated land protection policies based on the cloud model: A case study of Xingning, China. Ecol. Indic. 2021, 131, 108247. [Google Scholar] [CrossRef]
- Qian, F.K.; Chi, Y.R.; Lal, R. Spatiotemporal characteristics analysis of multifunctional cultivated land: A case-study in Shenyang, Northeast China. Land Degrad. Dev. 2020, 31, 1812–1822. [Google Scholar] [CrossRef]
- Wang, Q.; Li, Y.B.; Luo, G.J. Spatiotemporal change characteristics and driving mechanism of slope cultivated land transition in karst trough valley area of Guizhou Province, China. Environ. Earth Sci. 2020, 79, 1–18. [Google Scholar] [CrossRef]
- Zhou, L.; Dang, X.W.; Sun, Q.K.; Wang, S.H. Multi-scenario simulation of urban land change in Shanghai by random forest and CA-Markov model. Sustain. Cities Soc. 2020, 55, 102045. [Google Scholar] [CrossRef]
- Caldwell, W.; Epp, S.; Wan, X.Y.; Singer, R.; Drake, E.; Sousa, E.C. Farmland Preservation and Urban Expansion: Case Study of Southern Ontario, Canada. Front. Sustain. Food Syst. 2022, 6, 777816. [Google Scholar] [CrossRef]
- Chen, H.; Meng, F.; Yu, Z.N.; Tan, Y.Z. Spatial-temporal characteristics and influencing factors of farmland expansion in different agricultural regions of Heilongjiang Province, China. Land Use Policy 2022, 115, 106007. [Google Scholar] [CrossRef]
- Han, A.T.; Daniels, T.L.; Kim, C. Managing urban growth in the wake of climate change: Revisiting greenbelt policy in the US. Land Use Policy 2021, 112, 105867. [Google Scholar] [CrossRef]
- Liang, X.Y.; Jin, X.B.; Han, B.; Sun, R.; Xu, W.Y.; Li, H.B.; He, J.; Li, J. China′s food security situation and key questions in the new era: A perspective of farmland protection. J. Geogr. Sci. 2022, 32, 1001–1019. [Google Scholar] [CrossRef]
- Liu, J.; Jin, X.B.; Xu, W.Y.; Zhou, Y.K. Evolution of cultivated land fragmentation and its driving mechanism in rural development: A case study of Jiangsu Province. J. Rural Stud. 2022, 91, 58–72. [Google Scholar] [CrossRef]
- Liu, Z. Rural Population Decline, Cultivated Land Expansion, and the Role of Land Transfers in the Farming-Pastoral Ecotone: A Case Study of Taibus, China. Land 2022, 11, 256. [Google Scholar] [CrossRef]
- Lu, S.H.; Wang, H. Limited Decentralization: Understand China′s Land System from the Perspective of Central-Local Relation. Land 2022, 11, 517. [Google Scholar] [CrossRef]
- Yang, X.; Sang, Y.M.; Zhang, A.L. How livelihood capital affects farmers′ willingness to pay for farmland non-market value? Evidence from Jianghan Plain, China. Environ. Sci. Pollut. Res. 2022, 1–13. [Google Scholar] [CrossRef]
- Zhang, L.; Lin, X.H.; Qiu, B.K.; Ou, G.L.; Zhang, Z.; Han, S.Y. Impact of Value Perception on Farmers′ Willingness to Participate in Farmland Fallow: A Case-Study in Major Grain-Producing Areas of Hubei and Hunan, China. Sustainability 2022, 14, 724. [Google Scholar] [CrossRef]
- Zhang, R.Q.; Li, P.H.; Xu, L.P.; Zhong, S.; Wei, H. An integrated accounting system of quantity, quality and value for assessing cultivated land resource assets: A case study in Xinjiang, China. Glob. Ecol. Conserv. 2022, 36, e02115. [Google Scholar] [CrossRef]
- Zhou, T.X.; Tan, R.; Shu, X.F. Rigidity with partial elasticity: Local government adaptation under the centralized land quota system in China. Land Use Policy 2022, 118, 106138. [Google Scholar] [CrossRef]

Publisher’s Note: MDPI stays neutral with regard to jurisdictional claims in published maps and institutional affiliations. |
© 2022 by the authors. Licensee MDPI, Basel, Switzerland. This article is an open access article distributed under the terms and conditions of the Creative Commons Attribution (CC BY) license (https://creativecommons.org/licenses/by/4.0/).