
Air Quality, Pollution and Sustainability Trends in South Asia: A Population-Based Study


 , and
, and 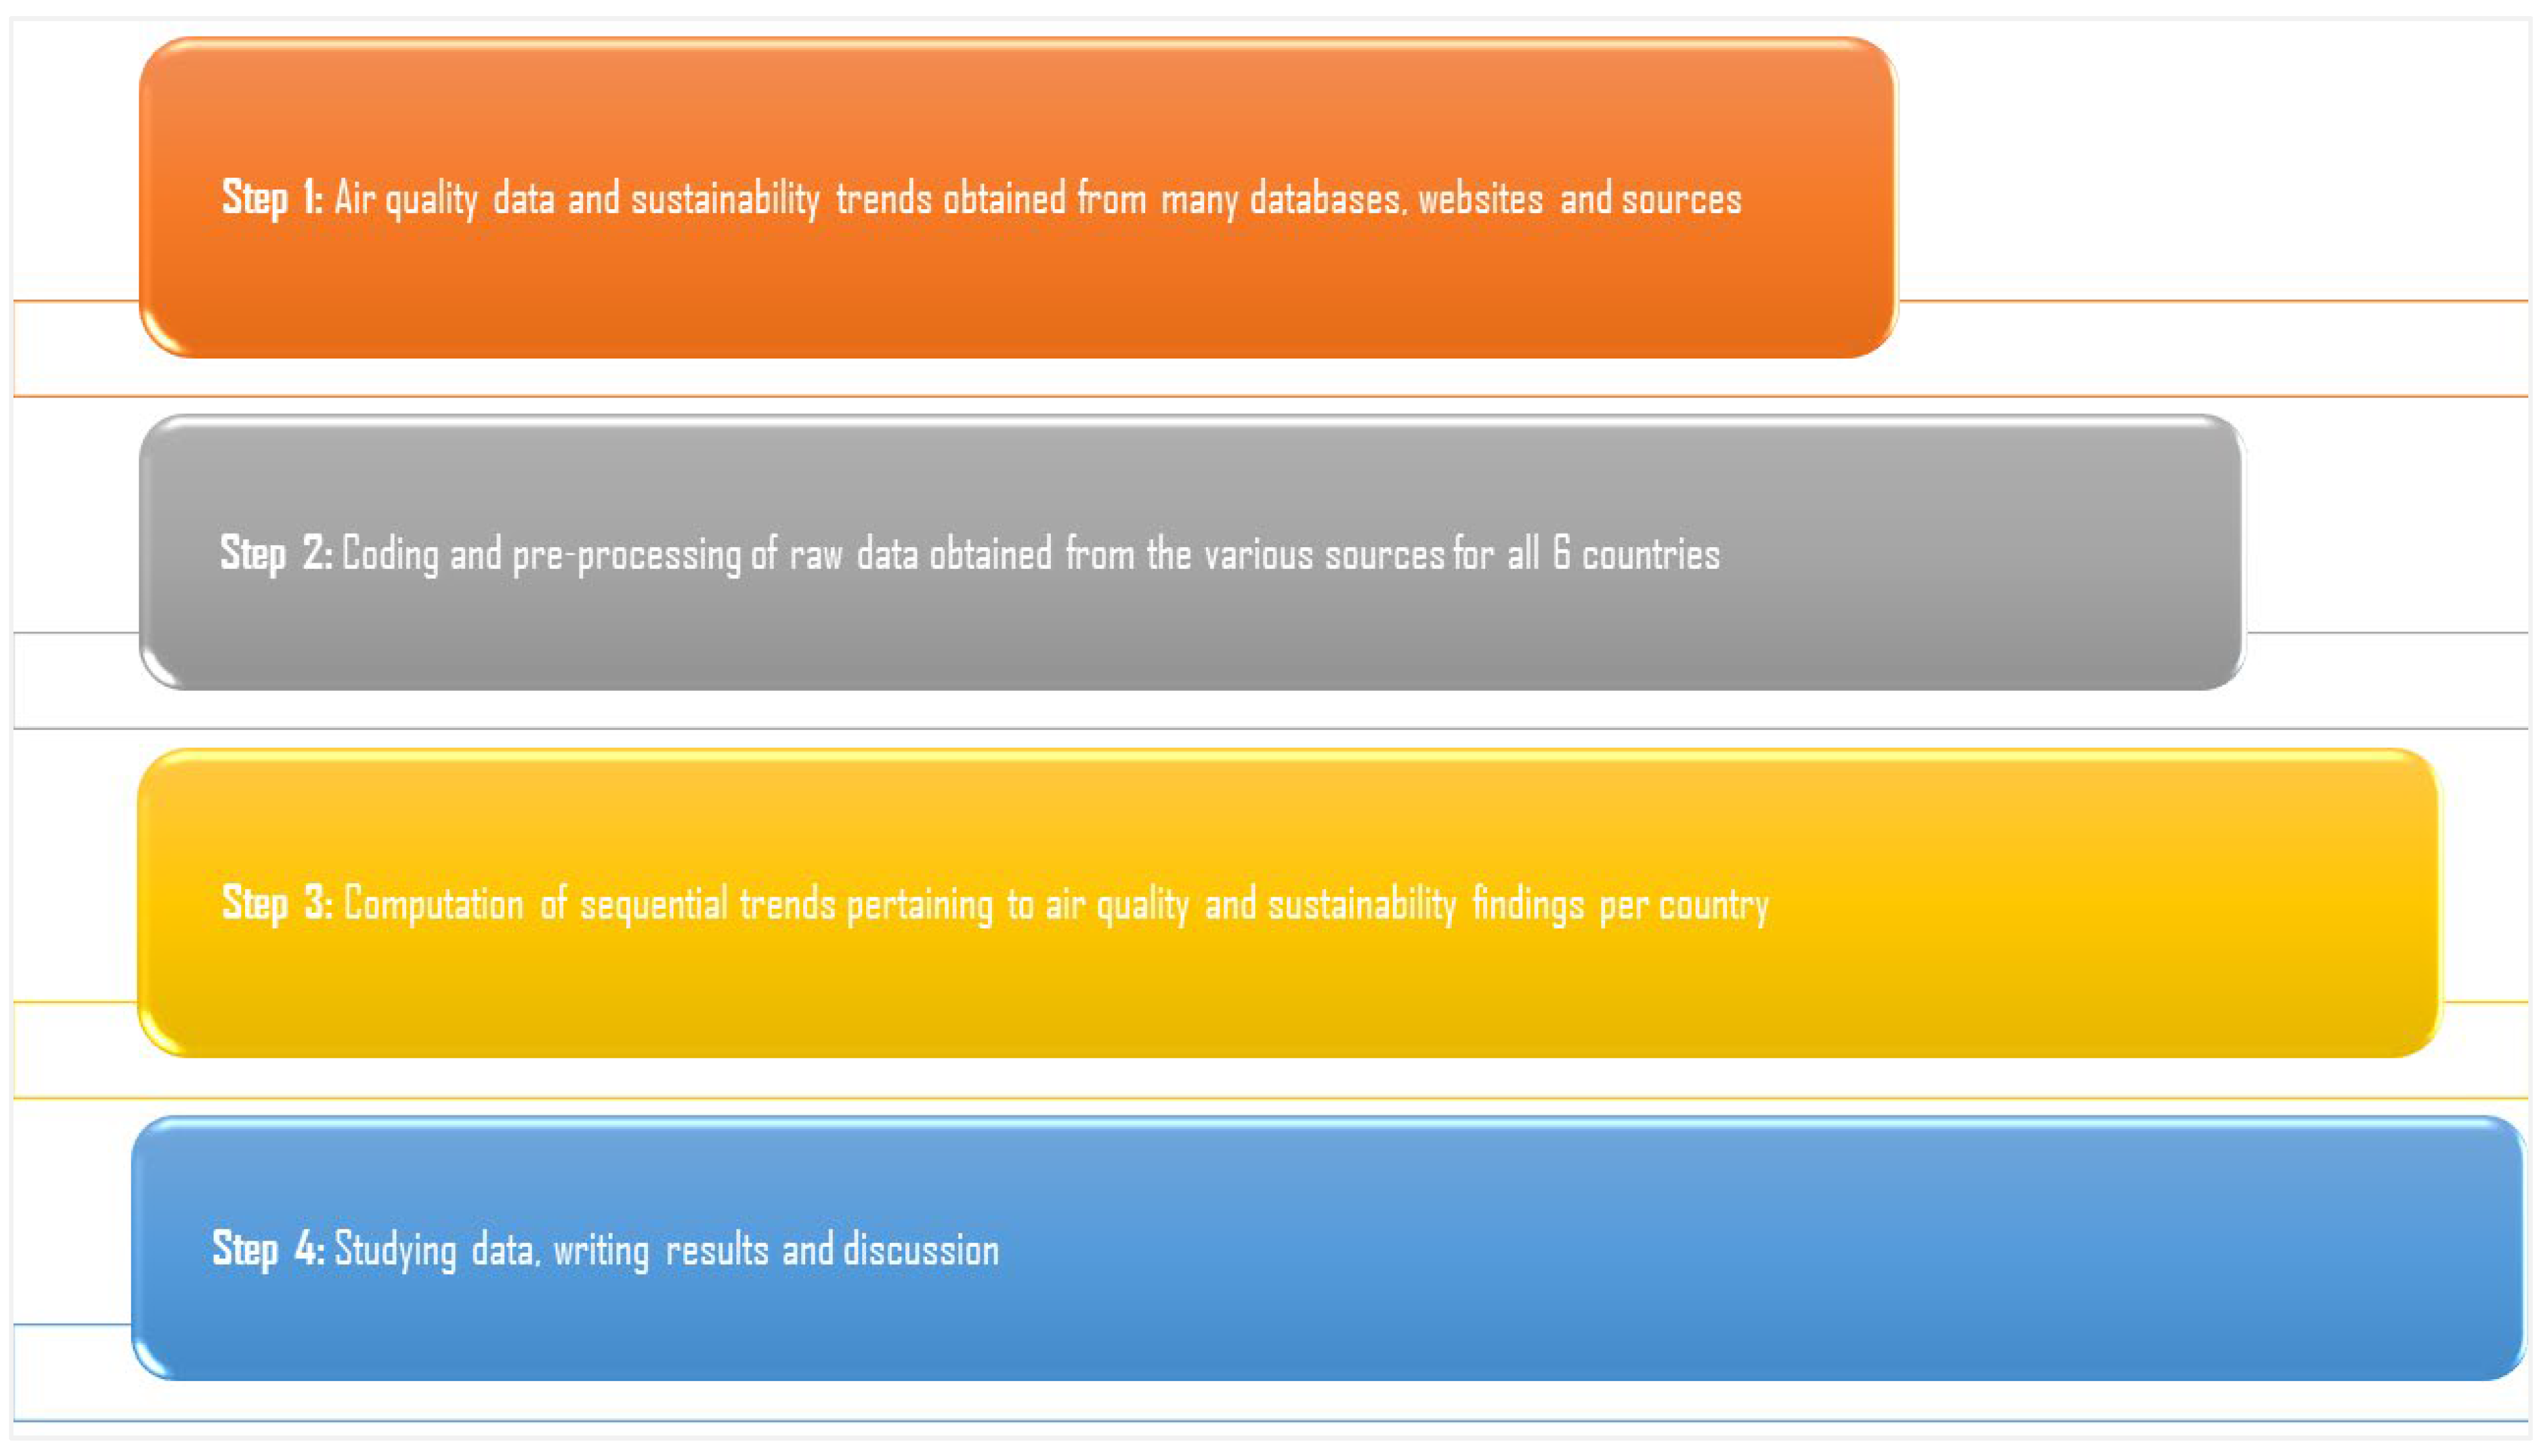
Abstract
:1. Introduction
2. Methods
- (1)
- Carbon dioxide (CO2): Annual production-based emissions of carbon dioxide (CO2), measured in million tons.
- (2)
- Total greenhouse gasses: Total greenhouse gas emissions, including land-use change and forestry, measured in million tons of carbon dioxide-equivalents.
- (3)
- Methane: Total methane emissions including land-use change and forestry, measured in million tons of carbon dioxide-equivalents.
- (4)
- Nitrous oxide (NO2): Total nitrous oxide emissions, including land-use change and forestry, measured in million tons of carbon dioxide-equivalents.
- (5)
- Population-weighted exposure to ambient PM2.5: The average level of exposure the country’s residents have to concentrations of suspended particles measured less than 2.5 µg in the aerodynamic diameter; these particles are capable of penetrating the respiratory tract and lead to severe health damage. The exposure is calculated by weighting the mean annual concentration in populations spanning rural and urban areas.
- (6)
- Nationally protected terrestrial and marine areas: These are terrestrial protected areas that are partially or totally protected, at least 1000 hectares as designated by the national authorities. Marine protected areas include intertidal or subtidal terrain that overlies water and has historical and cultural features.
- (7)
- Renewable energy consumption: The share of renewable energy in total final energy consumption, reported as the percentage of total final energy consumption.
- (8)
- Access to electricity: Percentage of population with access to electricity.
- (9)
- People using safely managed sanitation services: Percentage of the population using improved sanitation facilities not shared with other households where excreta are safely disposed.
- (10)
- People using safely managed drinking water services: Percentage of the population utilizing drinking water from a source that is accessible, available as required, and free from fecal and priority chemical contamination.
3. Results
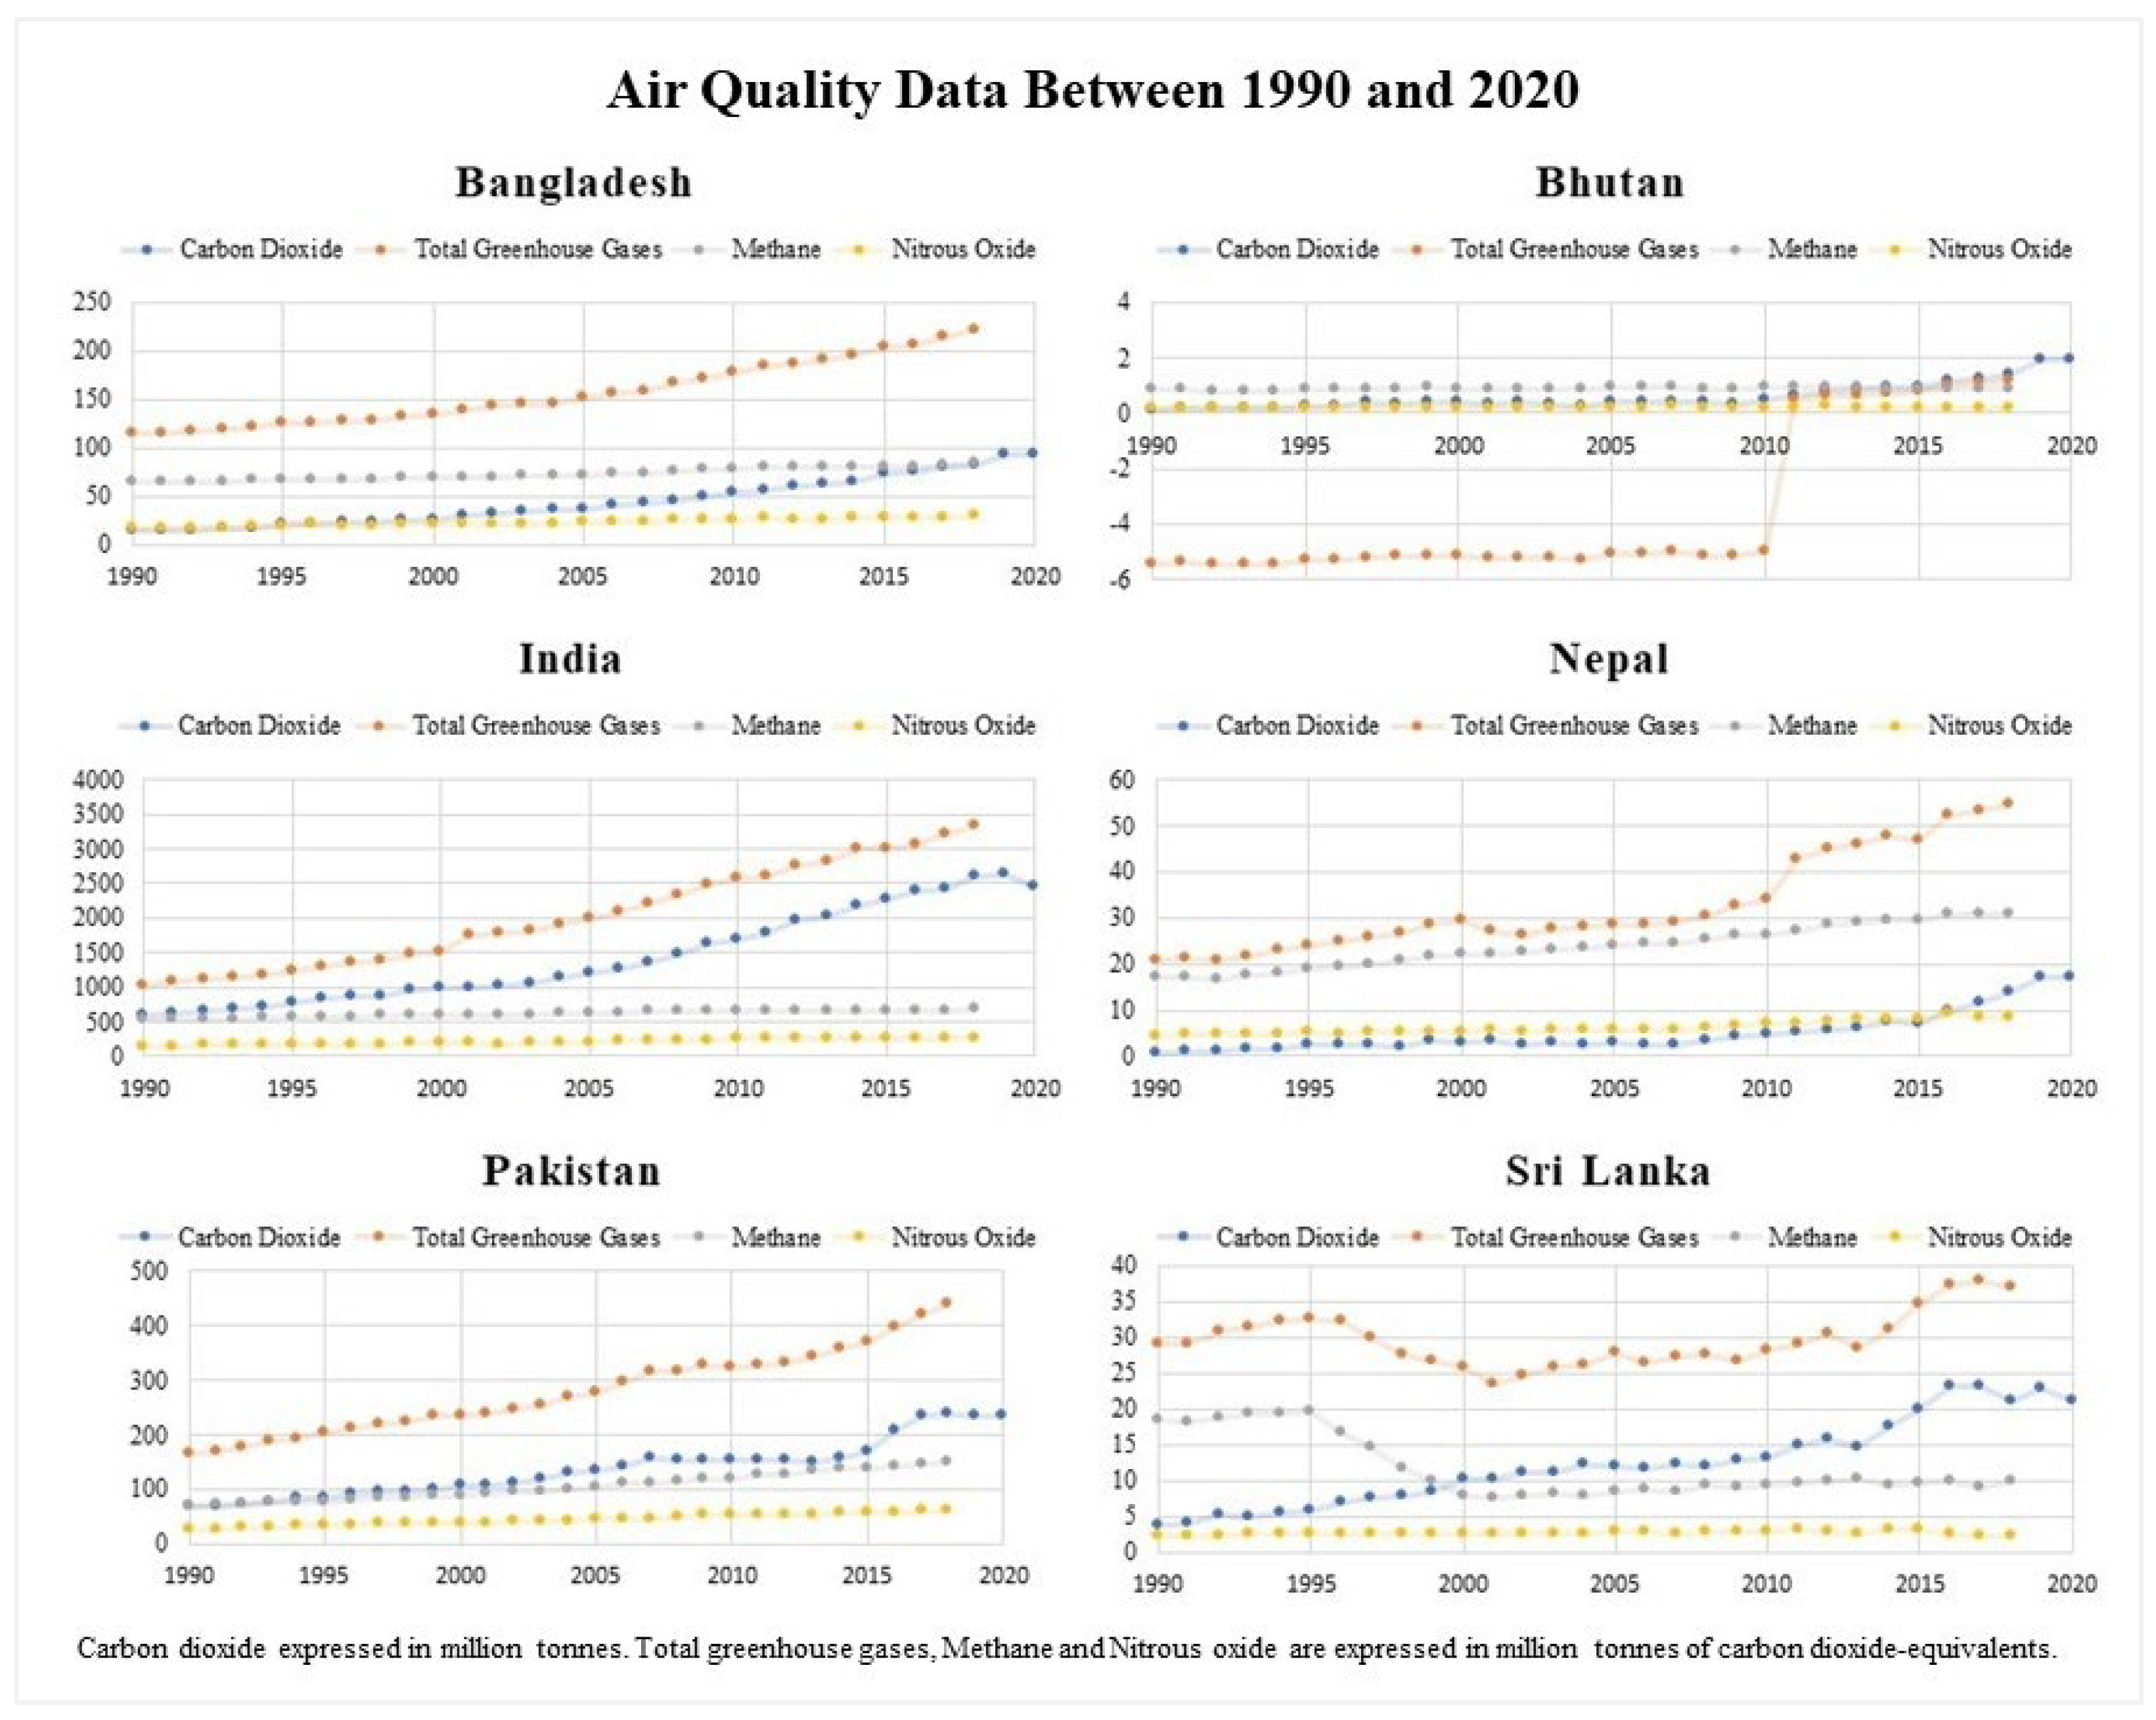
3.1. Air Quality Data
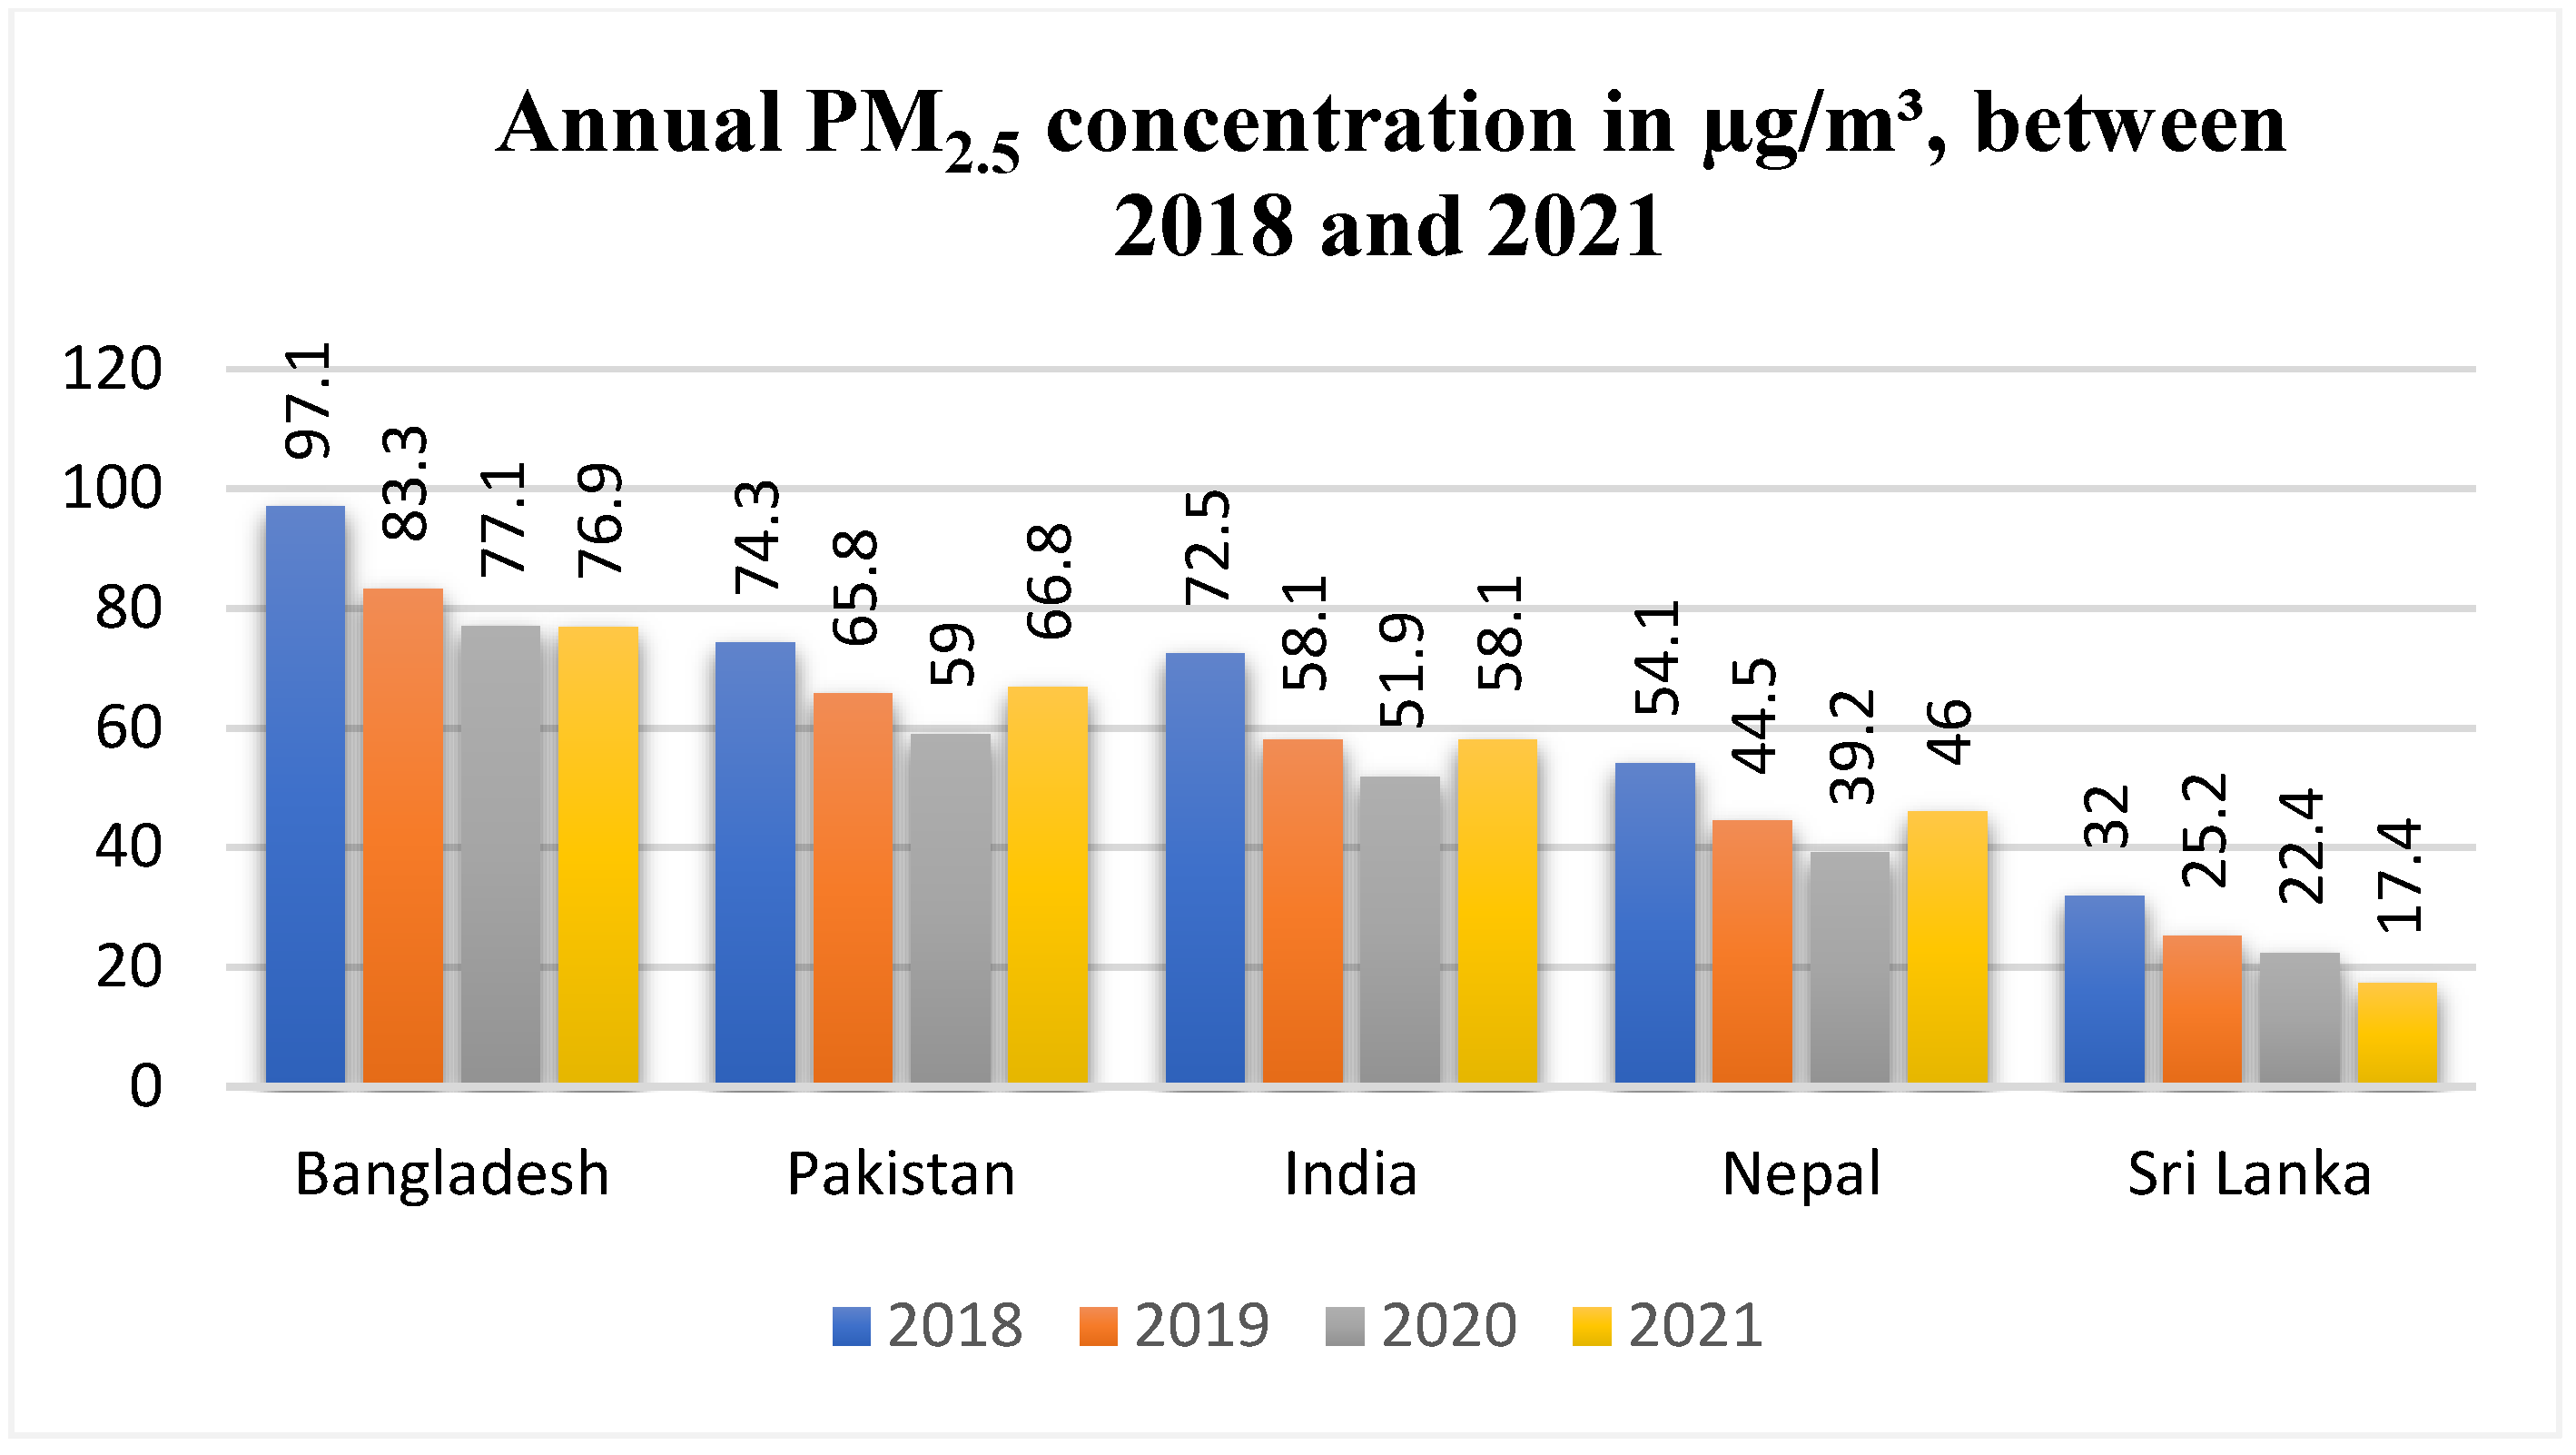
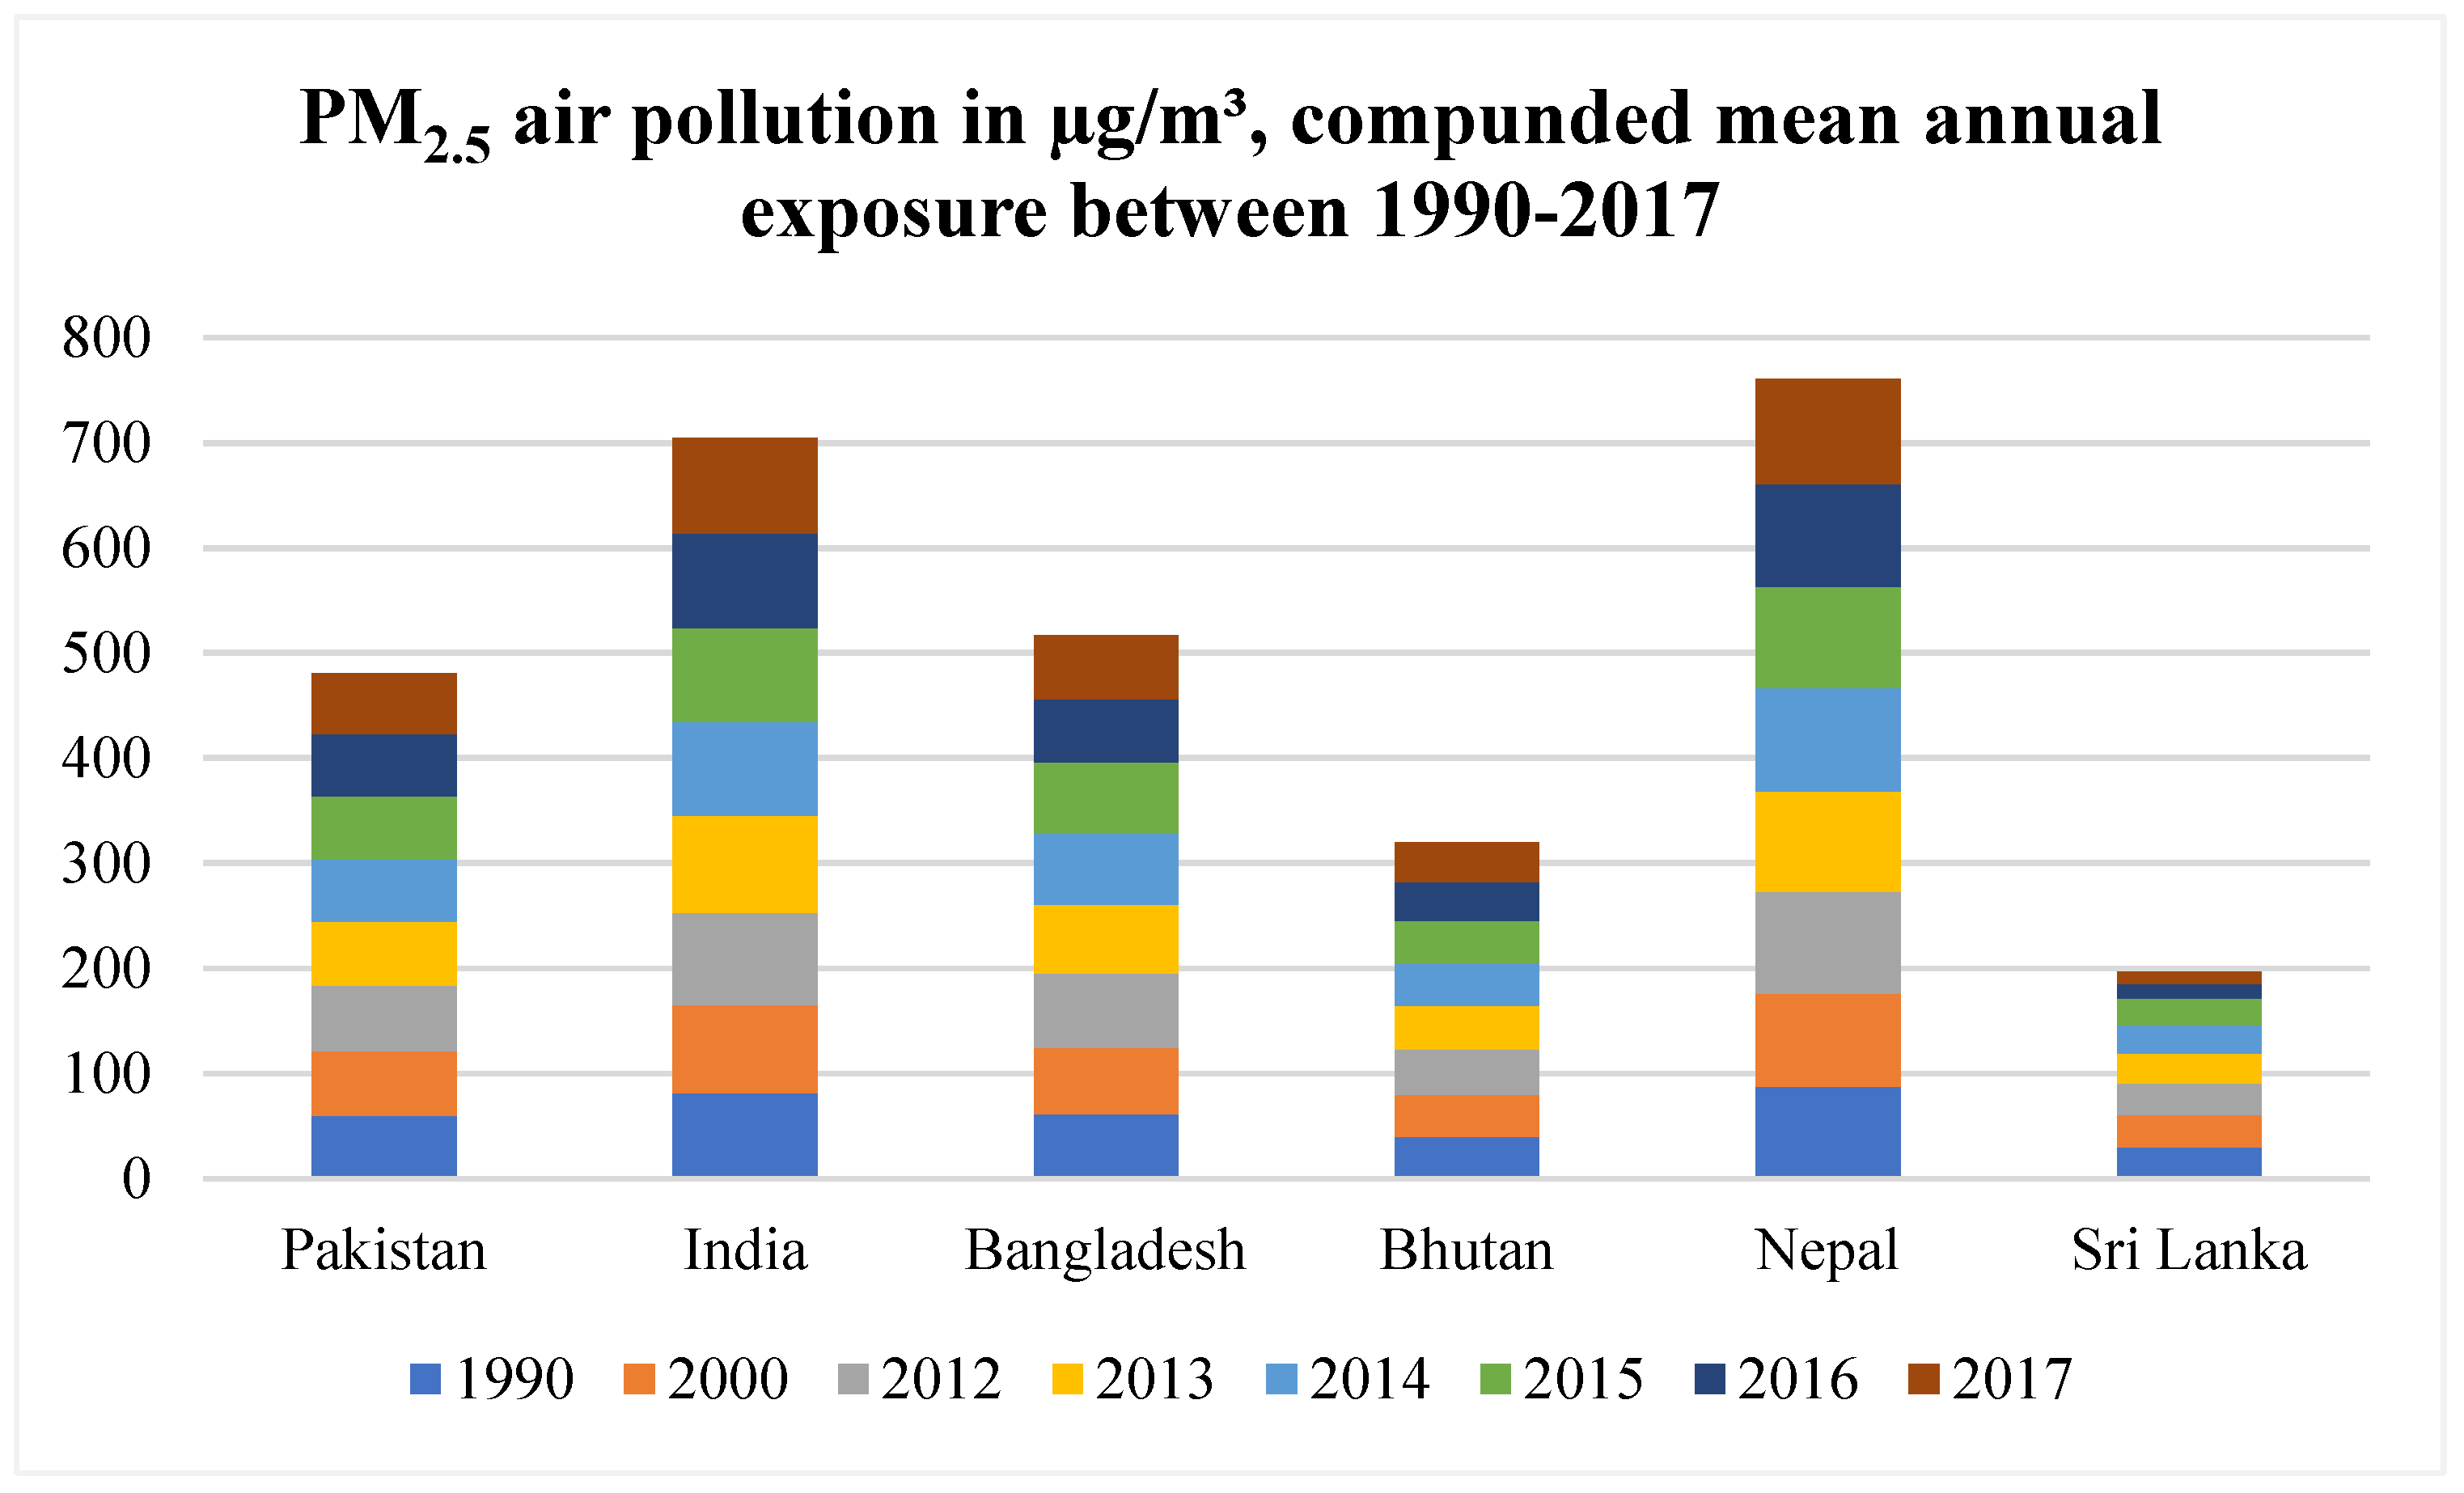
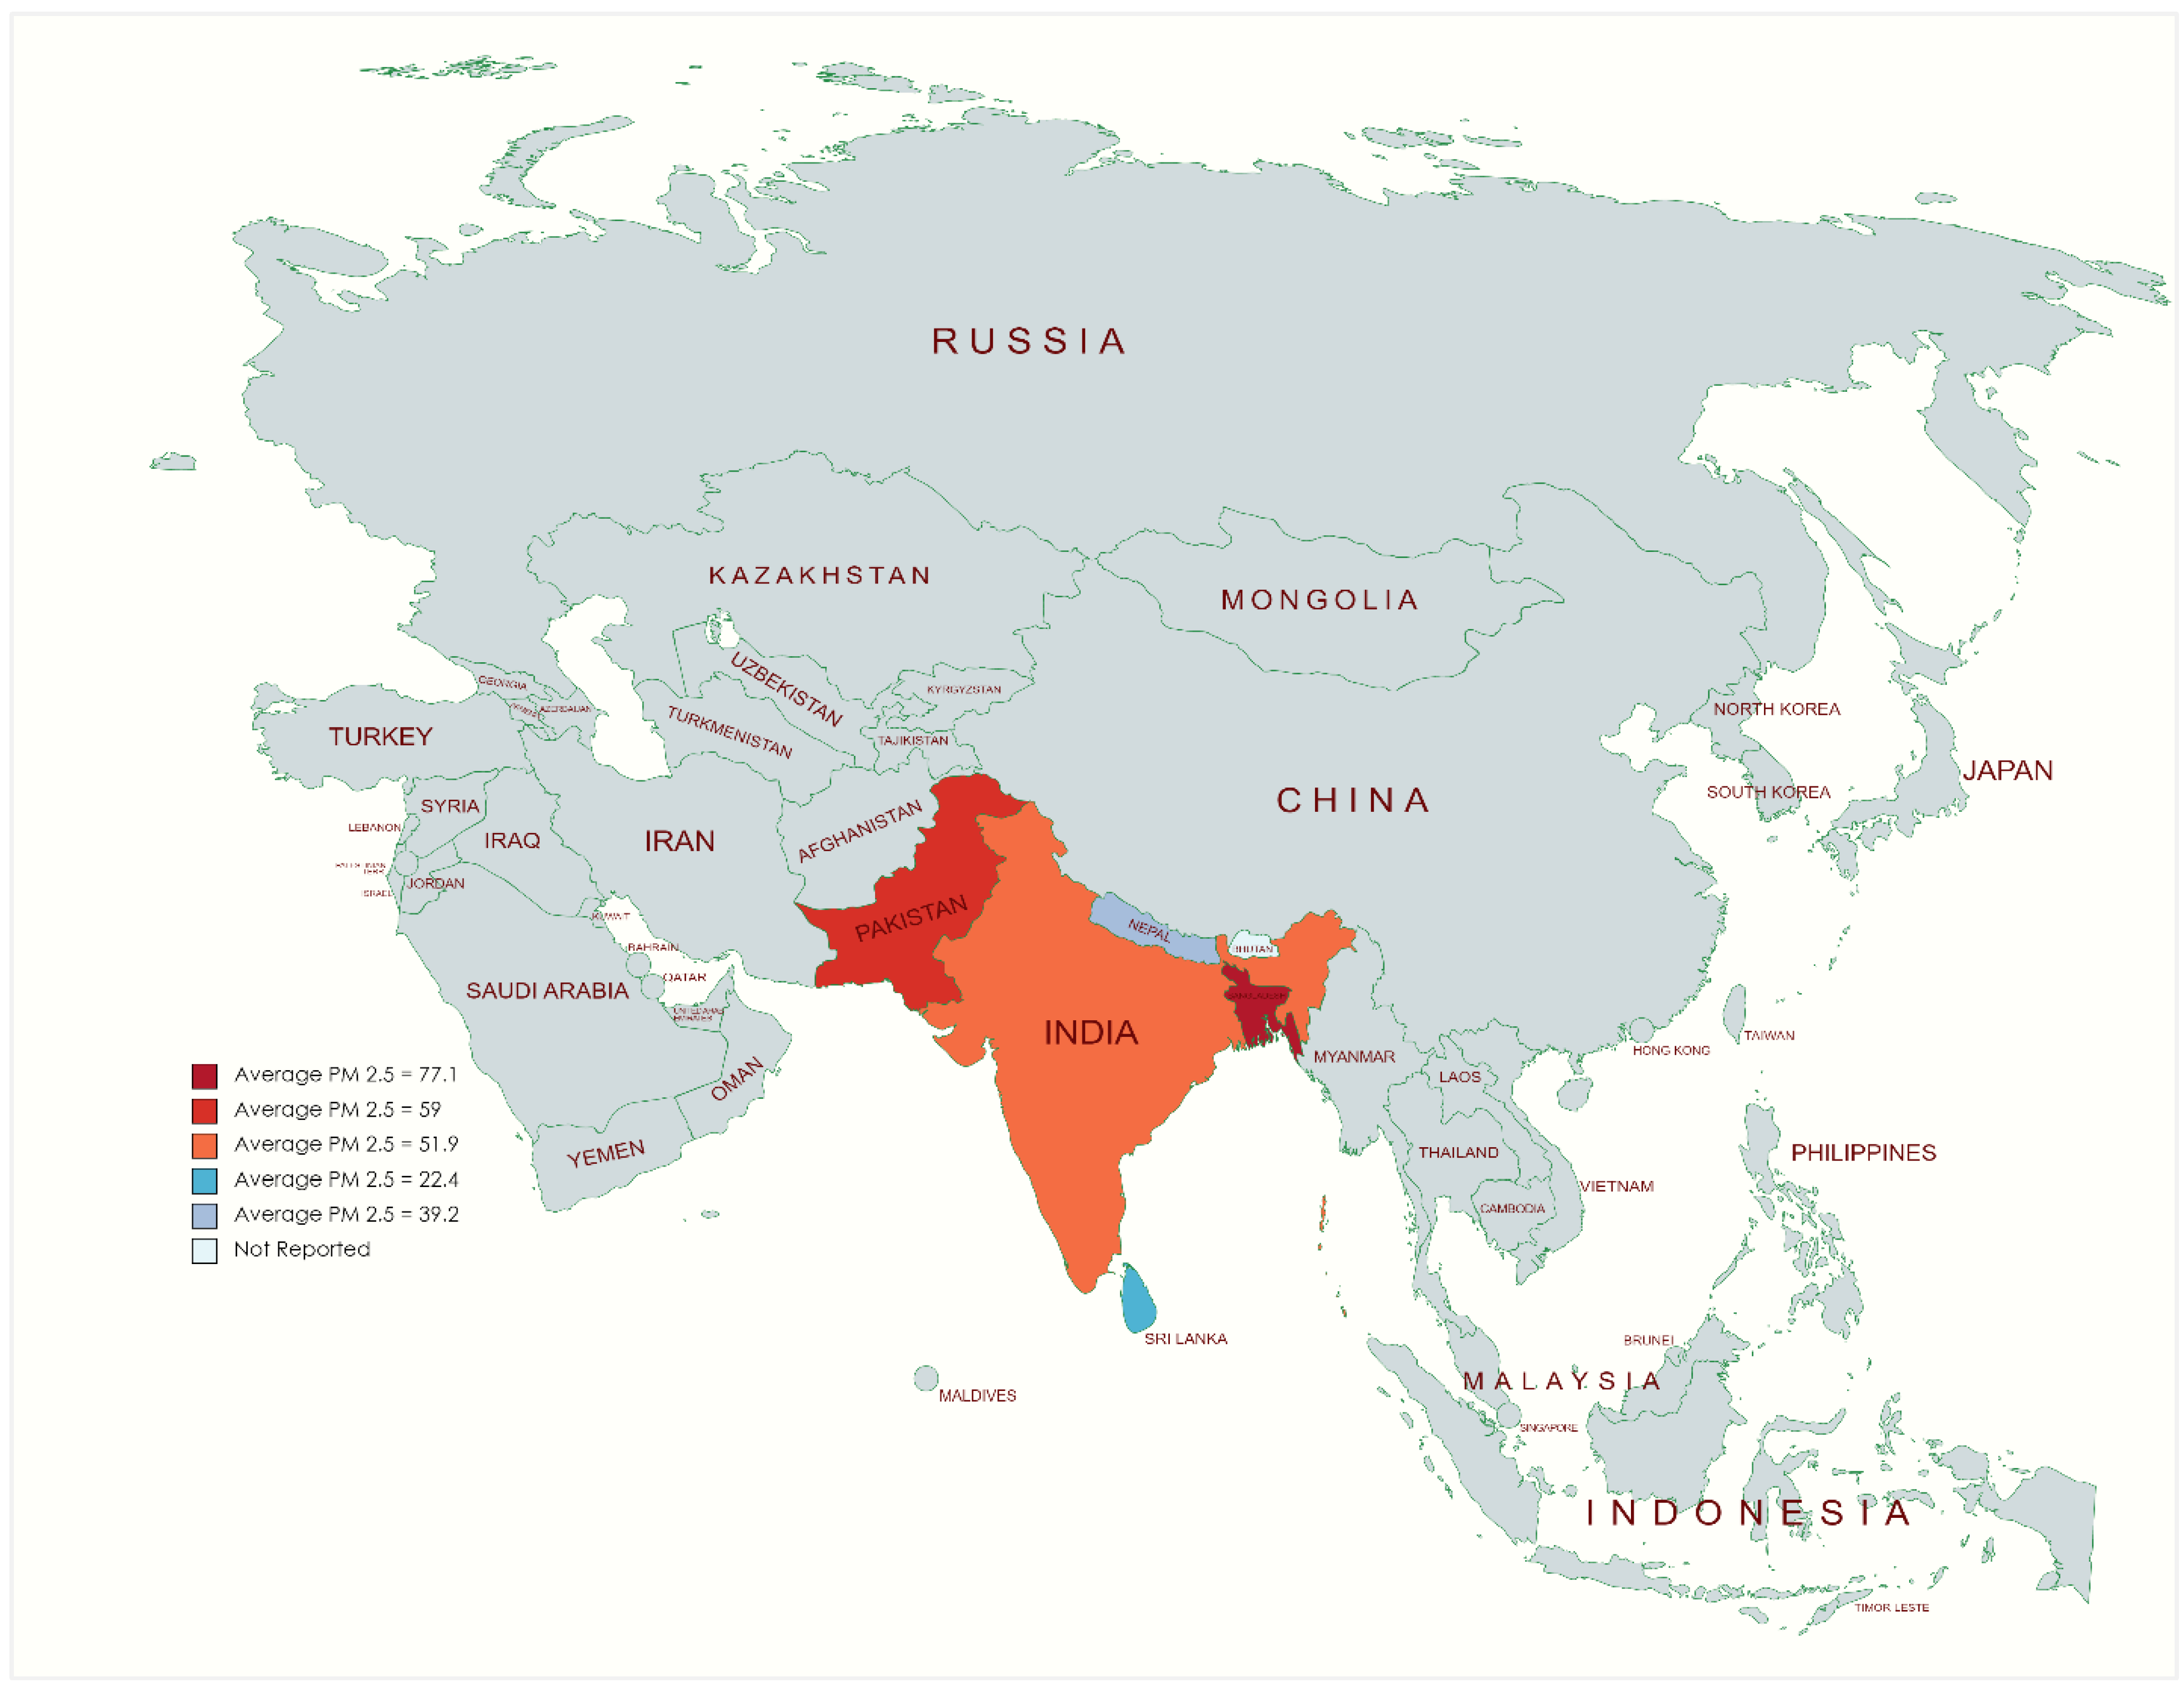
3.2. PM2.5 Air Pollution
3.3. Annual Change in PM 2.5 Concentrations Pre- and Post-COVID-19
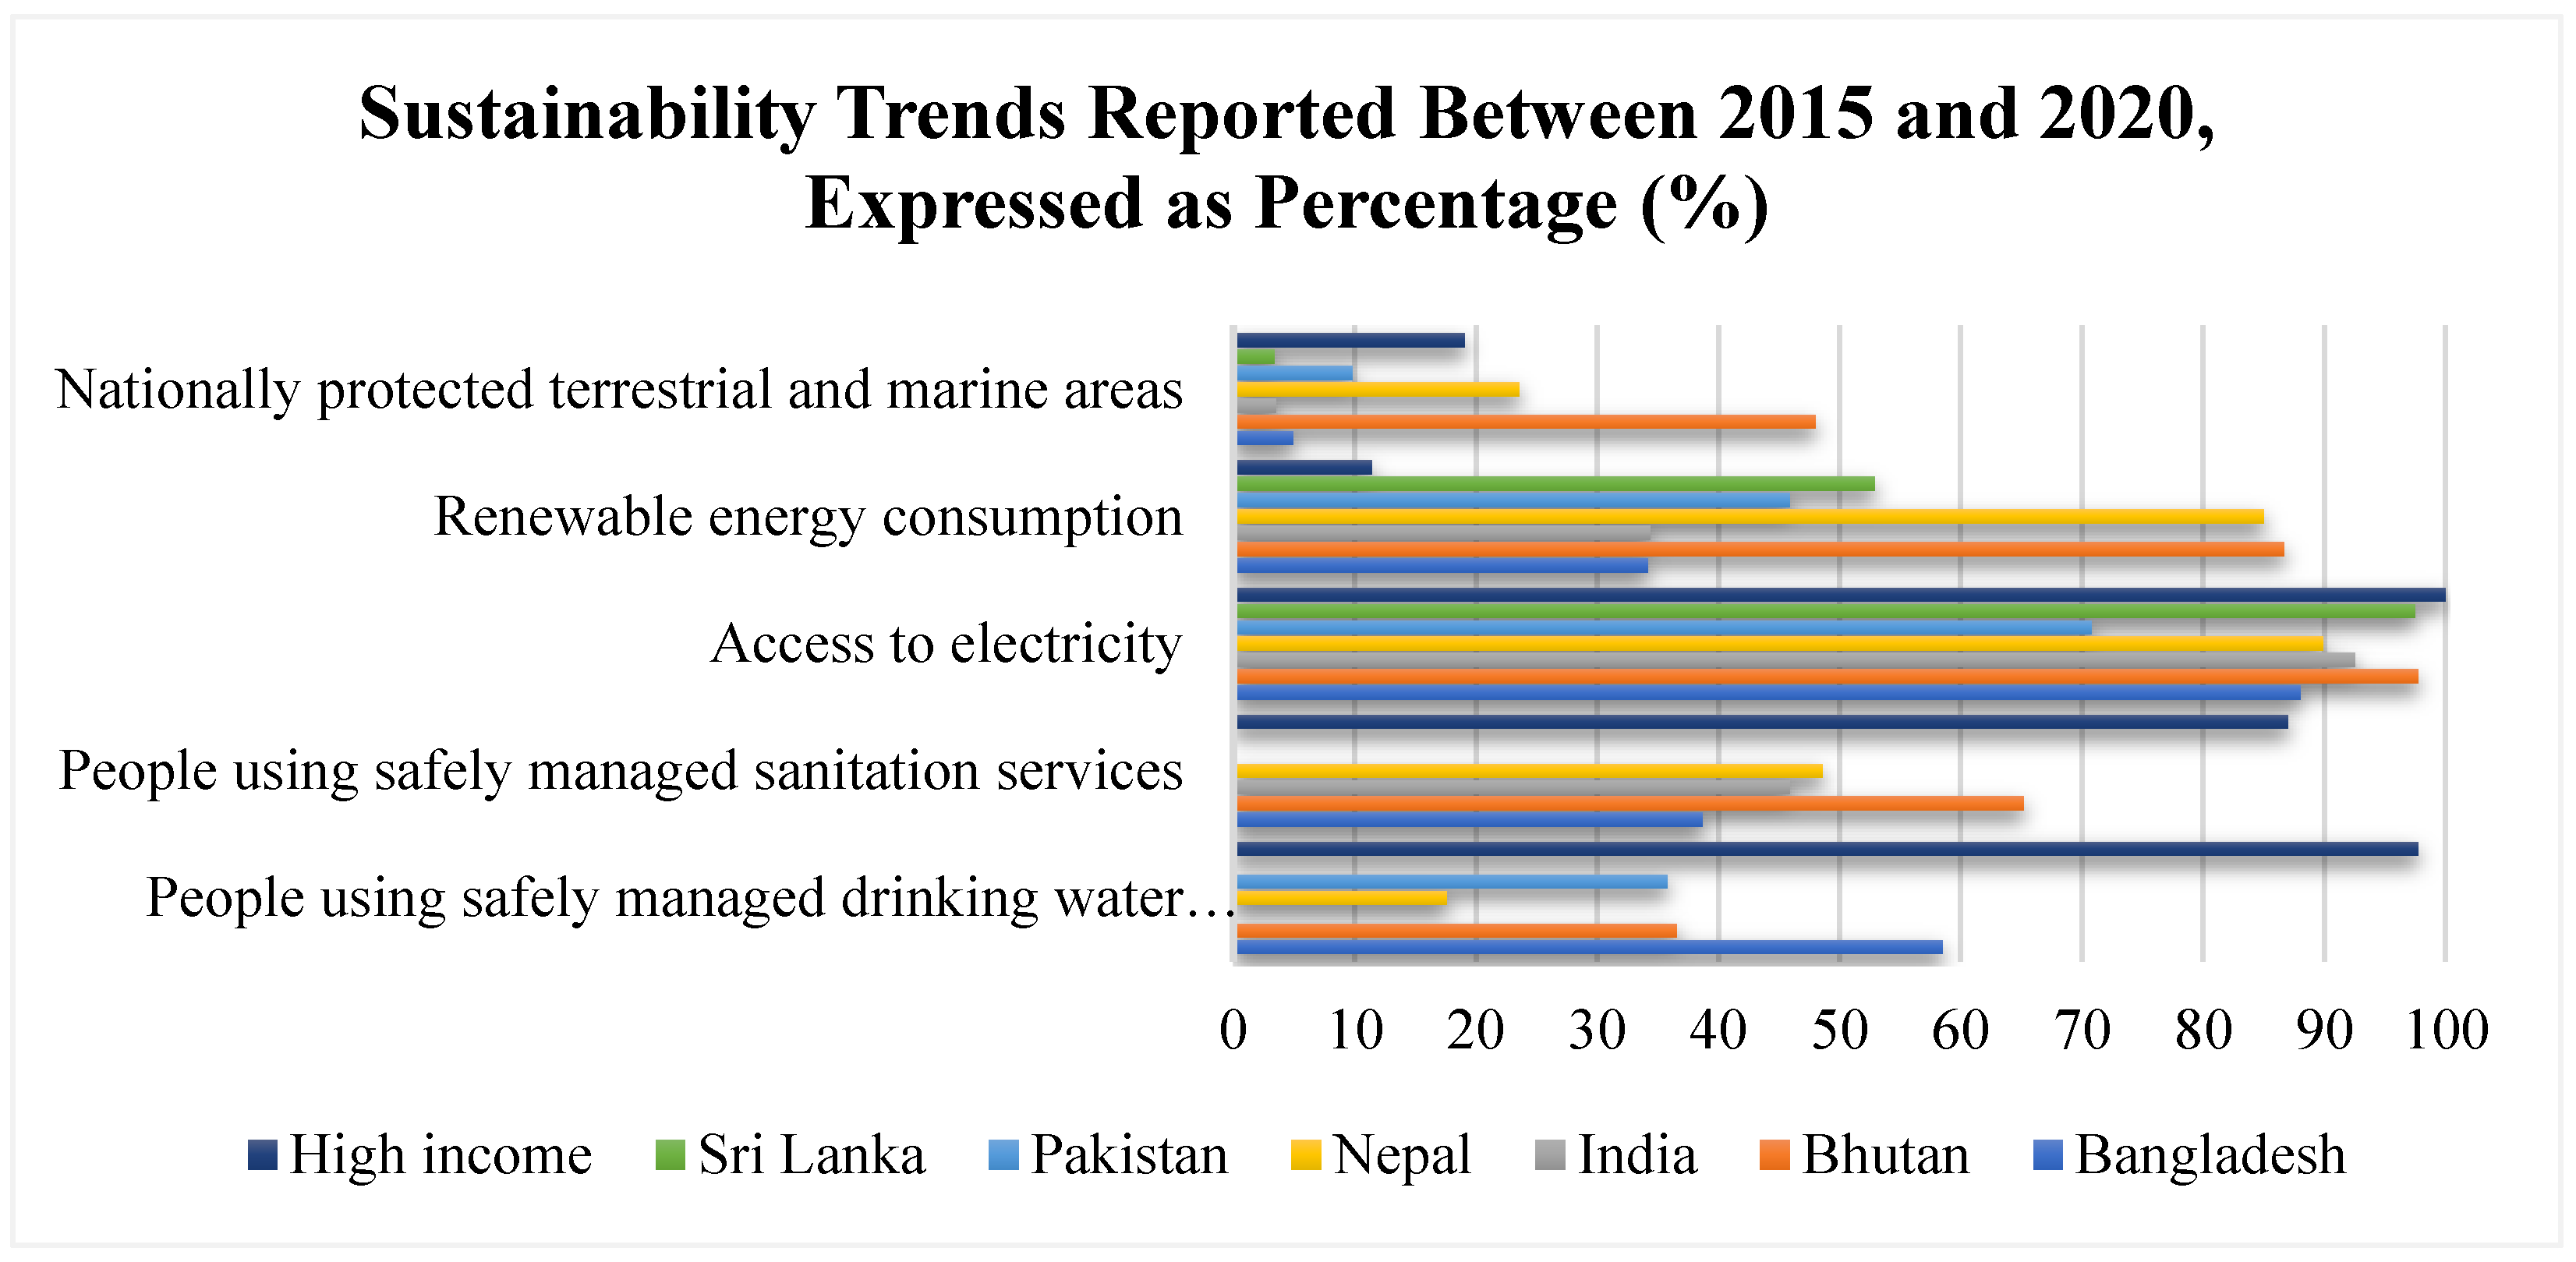
3.4. Sustainability Trends
4. Discussion
5. Health Impact of Air Pollution
6. Ongoing Initiatives
7. Recommendations
8. Conclusions
Supplementary Materials
Author Contributions
Funding
Institutional Review Board Statement
Informed Consent Statement
Data Availability Statement
Conflicts of Interest
References
- Regional Collaboration of Health Professionals for Resolving South Asia’s Air Pollution & Climate Crisis. Climate Action Network South Asia; Doctors for Clean Air & Climate Action; Health Care Without Harm; Lung Care Foundation. Air Quality Life Index; Fossil Fuel Treaty. Available online: https://cansouthasia.net/wp-content/uploads/2021/09/RCoHP-South-Asia-Report_06-09-2021.pdf (accessed on 5 June 2022).
- Krishna, B.; Balakrishnan, K.; Siddiqui, A.R.; Begum, B.A.; Bachani, D.; Brauer, M. Tackling the Health Burden of Air Pollution in South Asia. BMJ 2017, 359, j5209. [Google Scholar] [CrossRef] [PubMed] [Green Version]
- Rajper, S.A.; Nazir, A.; Ullah, S.; Li, Z. Perceived Health Risks of Exposure to Indoor Air Pollution from Cooking Fuels in Sindh, Pakistan. Pol. J. Environ. Stud. 2020, 29, 2833–2844. [Google Scholar] [CrossRef]
- Manisalidis, I.; Stavropoulou, E.; Stavropoulos, A.; Bezirtzoglou, E. Environmental and Health Impacts of Air Pollution: A Review. Front. Public Health 2020, 14. [Google Scholar] [CrossRef] [Green Version]
- World Bank Breathing Uneasy: Regional Response to Air Pollution in South Asia|World Bank Live. Available online: https://live.worldbank.org/breathing-uneasy-regional-response-air-pollution-south-asia (accessed on 9 May 2022).
- Khwaja, M.A.; Umer, F.; Shaheen, N.; Sherazi, A.; Shaheen, F.H. Air Pollution Reduction and Control in South Asia. Sci. Technol. Dev. 2012, 31, 51–68. [Google Scholar]
- Xue, T.; Guan, T.; Geng, G.; Zhang, Q.; Zhao, Y.; Zhu, T. Estimation of Pregnancy Losses Attributable to Exposure to Ambient Fine Particles in South Asia: An Epidemiological Case-Control Study. Lancet Planet. Health 2021, 5, e15–e24. [Google Scholar] [CrossRef]
- Grippo, A.; Zhang, J.; Chu, L.; Guo, Y.; Qiao, L.; Myneni, A.A.; Mu, L. Air Pollution Exposure during Pregnancy and Spontaneous Abortion and Stillbirth. Rev. Environ. Health 2018, 33, 247–264. [Google Scholar] [CrossRef]
- Ragusa, A.; Svelato, A.; Santacroce, C.; Catalano, P.; Notarstefano, V.; Carnevali, O.; Papa, F.; Rongioletti, M.C.A.; Baiocco, F.; Draghi, S. Plasticenta: First Evidence of Microplastics in Human Placenta. Environ. Int. 2021, 146, 106274. [Google Scholar] [CrossRef]
- World Health Organization Ambient (Outdoor) Air Pollution. Available online: https://www.who.int/news-room/fact-sheets/detail/ambient-(outdoor)-air-quality-and-health (accessed on 5 June 2022).
- Loomis, D.; Huang, W.; Chen, G. The International Agency for Research on Cancer (IARC) Evaluation of the Carcinogenicity of Outdoor Air Pollution: Focus on China. Chin. J. Cancer 2014, 33, 189. [Google Scholar] [CrossRef]
- Kumar, R.; Barth, M.C.; Pfister, G.G.; Delle Monache, L.; Lamarque, J.F.; Archer-Nicholls, S.; Tilmes, S.; Ghude, S.D.; Wiedinmyer, C.; Naja, M. How Will Air Quality Change in South Asia by 2050? J. Geophys. Res. Atmos. 2018, 123, 1840–1864. [Google Scholar] [CrossRef]
- Salman, H.M.; Syed, J.; Riaz, A.; Sarfraz, Z.; Sarfraz, A.; Bokhari, S.H.A.A.; Ojeda, I.C. An Epidemiological, Strategic and Response Analysis of the COVID-19 Pandemic in South Asia: A Population-Based Observational Study. BMC Public Health 2022, 22, 457. [Google Scholar] [CrossRef]
- Machluf, Y.; Tal, O.; Navon, A.; Chaiter, Y. From Population Databases to Research and Informed Health Decisions and Policy. Front. Public Health 2017, 5, 230. [Google Scholar] [CrossRef] [PubMed]
- Ritchie, H.; Roser, M.; Rosado, P. CO₂ and Greenhouse Gas Emissions—Our World in Data. Available online: https://ourworldindata.org/co2-and-other-greenhouse-gas-emissions (accessed on 5 June 2022).
- The World Bank World Development Indicators|DataBank. Available online: https://databank.worldbank.org/source/world-development-indicators (accessed on 5 June 2022).
- Upadhyay, A.; Mahapatra, P.S.; Singh, P.K.; Dahal, S.; Pokhrel, S.; Bhujel, A.; Joshi, I.B.; Paudel, S.P.; Puppal, S.P.; Adhikary, B. Learnings from COVID-19 Forced Lockdown on Regional Air Quality and Mitigation Potential for South Asia. Aerosol Air Qual. Res. 2022, 22, 210376. [Google Scholar] [CrossRef]
- World Database on Protected Areas World Database on Protected Areas|IUCN. Available online: https://www.iucn.org/theme/protected-areas/our-work/world-database-protected-areas (accessed on 5 June 2022).
- United Nations Environment World Conservation Monitoring Centre (UNEP-WCMC). Available online: https://www.unep-wcmc.org/en (accessed on 5 June 2022).
- Explore the World’s Protected Areas. Available online: https://www.protectedplanet.net/en (accessed on 5 June 2022).
- The Energy and Resources Institute (TERI). Scoping Study for South Asia Air Pollution; The Energy and Resources Institute: New Delhi, India, 2019. [Google Scholar]
- Abbas, S.Z.; Kousar, A.; Razzaq, S.; Saeed, A.; Alam, M.; Mahmood, A. Energy Management in South Asia. Energy Strateg. Rev. 2018, 21, 25–34. [Google Scholar] [CrossRef]
- Mishra, M.; Kulshrestha, U.C. A Brief Review on Changes in Air Pollution Scenario over South Asia during COVID-19 Lockdown. Aerosol Air Qual. Res. 2021, 21, 200541. [Google Scholar] [CrossRef]
- Kandari, R.; Kumar, A. COVID-19 Pandemic Lockdown: Effects on the Air Quality of South Asia. Environ. Sustain. 2021, 4, 543–549. [Google Scholar] [CrossRef]
- Hasnat, G.N.T.; Kabir, M.A.; Hossain, M.A. Major Environmental Issues and Problems of South Asia, Particularly Bangladesh. Handb. Environ. Mater. Manag. 2018, 1–40. [Google Scholar] [CrossRef]
- South Asia Is Smothered in Toxic Air, Report Finds. Available online: https://www.nytimes.com/2019/03/05/world/asia/india-air-pollution.html (accessed on 9 May 2022).
- New Report Outlines Air Pollution Measures That Can Save Millions of Lives. Available online: https://www.unep.org/news-and-stories/press-release/new-report-outlines-air-pollution-measures-can-save-millions-lives (accessed on 9 May 2022).
- Reuters India’s Polluted Air Claimed 1.24 Million Lives in 2017: Study. Available online: https://www.reuters.com/article/us-india-pollution-lancet/indias-polluted-air-claimed-1-24-million-lives-in-2017-study-idUSKBN1O51T8 (accessed on 9 May 2022).
- Balakrishnan, K.; Dey, S.; Gupta, T.; Dhaliwal, R.S.; Brauer, M.; Cohen, A.J.; Stanaway, J.D.; Beig, G.; Joshi, T.K.; Aggarwal, A.N. The Impact of Air Pollution on Deaths, Disease Burden, and Life Expectancy across the States of India: The Global Burden of Disease Study 2017. Lancet Planet. Health 2019, 3, e26–e39. [Google Scholar] [CrossRef] [Green Version]
- Air Pollution Measures for Asia and the Pacific|Climate & Clean Air Coalition. Available online: https://www.ccacoalition.org/en/content/air-pollution-measures-asia-and-pacific (accessed on 9 May 2022).
- Harrison, R.M.; Yin, J. Particulate Matter in the Atmosphere: Which Particle Properties Are Important for Its Effects on Health? Sci. Total Environ. 2000, 249, 85–101. [Google Scholar] [CrossRef]
- Coccia, M. How (Un) Sustainable Environments Are Related to the Diffusion of COVID-19: The Relation between Coronavirus Disease 2019, Air Pollution, Wind Resource and Energy. Sustainability 2020, 12, 9709. [Google Scholar] [CrossRef]
- Metya, A.; Dagupta, P.; Halder, S.; Chakraborty, S.; Tiwari, Y.K. COVID-19 Lockdowns Improve Air Quality in the South-East Asian Regions, as Seen by the Remote Sensing Satellites. Aerosol Air Qual. Res. 2020, 20, 1772–1782. [Google Scholar] [CrossRef]
- Prüss-Ustün, A.; van Deventer, E.; Mudu, P.; Campbell-Lendrum, D.; Vickers, C.; Ivanov, I.; Forastiere, F.; Gumy, S.; Dora, C.; Adair-Rohani, H. Environmental Risks and Non-Communicable Diseases. BMJ 2019, 364, l265. [Google Scholar] [CrossRef] [PubMed] [Green Version]
- Pandey, A.; Brauer, M.; Cropper, M.L.; Balakrishnan, K.; Mathur, P.; Dey, S.; Turkgulu, B.; Kumar, G.A.; Khare, M.; Beig, G. Health and Economic Impact of Air Pollution in the States of India: The Global Burden of Disease Study 2019. Lancet Planet. Health 2021, 5, e25–e38. [Google Scholar] [CrossRef]
- Turner, M.C.; Andersen, Z.J.; Baccarelli, A.; Diver, W.R.; Gapstur, S.M.; Pope III, C.A.; Prada, D.; Samet, J.; Thurston, G.; Cohen, A. Outdoor Air Pollution and Cancer: An Overview of the Current Evidence and Public Health Recommendations. CA Cancer J. Clin. 2020, 70, 460–479. [Google Scholar] [CrossRef] [PubMed]
- Zoran, M.A.; Savastru, R.S.; Savastru, D.M.; Tautan, M.N. Assessing the Relationship between Surface Levels of PM2.5 and PM10 Particulate Matter Impact on COVID-19 in Milan, Italy. Sci. Total Environ. 2020, 738, 139825. [Google Scholar] [CrossRef]
- Kelishadi, R.; Poursafa, P. Air Pollution and Non-Respiratory Health Hazards for Children. Arch. Med. Sci. AMS 2010, 6, 483. [Google Scholar] [CrossRef]
- Kelly, F.J.; Fussell, J.C. Air Pollution and Airway Disease. Clin. Exp. Allergy 2011, 41, 1059–1071. [Google Scholar] [CrossRef]
- Bălă, G.-P.; Râjnoveanu, R.-M.; Tudorache, E.; Motișan, R.; Oancea, C. Air Pollution Exposure—the (in) Visible Risk Factor for Respiratory Diseases. Environ. Sci. Pollut. Res. 2021, 28, 19615–19628. [Google Scholar] [CrossRef]
- Ghorani-Azam, A.; Riahi-Zanjani, B.; Balali-Mood, M. Effects of Air Pollution on Human Health and Practical Measures for Prevention in Iran. J. Res. Med. Sci. Off. J. Isfahan Univ. Med. Sci. 2016, 21, 65. [Google Scholar] [CrossRef]
- Jiang, X.-Q.; Mei, X.-D.; Feng, D. Air Pollution and Chronic Airway Diseases: What Should People Know and Do? J. Thorac. Dis. 2016, 8, E31. [Google Scholar]
- Troeger, C.; Blacker, B.; Khalil, I.A.; Rao, P.C.; Cao, J.; Zimsen, S.R.M.; Albertson, S.B.; Deshpande, A.; Farag, T.; Abebe, Z. Estimates of the Global, Regional, and National Morbidity, Mortality, and Aetiologies of Lower Respiratory Infections in 195 Countries, 1990–2016: A Systematic Analysis for the Global Burden of Disease Study 2016. Lancet Infect. Dis. 2018, 18, 1191–1210. [Google Scholar] [CrossRef] [Green Version]
- Rajagopalan, S.; Al-Kindi, S.G.; Brook, R.D. Air Pollution and Cardiovascular Disease: JACC State-of-the-Art Review. J. Am. Coll. Cardiol. 2018, 72, 2054–2070. [Google Scholar] [CrossRef]
- Balbus, J.M.; Malina, C. Identifying Vulnerable Subpopulations for Climate Change Health Effects in the United States. J. Occup. Environ. Med. 2009, 51, 33–37. [Google Scholar] [CrossRef]
- Katholi, R.E.; Couri, D.M. Left Ventricular Hypertrophy: Major Risk Factor in Patients with Hypertension: Update and Practical Clinical Applications. Int. J. Hypertens. 2011, 2011, 495349. [Google Scholar] [CrossRef] [PubMed] [Green Version]
- Leary, P.J.; Kaufman, J.D.; Barr, R.G.; Bluemke, D.A.; Curl, C.L.; Hough, C.L.; Lima, J.A.; Szpiro, A.A.; Van Hee, V.C.; Kawut, S.M. Traffic-Related Air Pollution and the Right Ventricle. The Multi-Ethnic Study of Atherosclerosis. Am. J. Respir. Crit. Care Med. 2014, 189, 1093–1100. [Google Scholar] [CrossRef] [PubMed] [Green Version]
- Chin-Chan, M.; Navarro-Yepes, J.; Quintanilla-Vega, B. Environmental Pollutants as Risk Factors for Neurodegenerative Disorders: Alzheimer and Parkinson Diseases. Front. Cell. Neurosci. 2015, 9, 124. [Google Scholar] [CrossRef] [Green Version]
- Genc, S.; Zadeoglulari, Z.; Fuss, S.H.; Genc, K. Review Article: The Adverse Effects of Air Pollution on the Nervous System. J. Toxicol. 2012, 2012, 782462. [Google Scholar] [CrossRef] [PubMed] [Green Version]
- Eze, I.C.; Schaffner, E.; Fischer, E.; Schikowski, T.; Adam, M.; Imboden, M.; Tsai, M.; Carballo, D.; von Eckardstein, A.; Künzli, N. Long-Term Air Pollution Exposure and Diabetes in a Population-Based Swiss Cohort. Environ. Int. 2014, 70, 95–105. [Google Scholar] [CrossRef] [Green Version]
- Johnson, N.M.; Hoffmann, A.R.; Behlen, J.C.; Lau, C.; Pendleton, D.; Harvey, N.; Shore, R.; Li, Y.; Chen, J.; Tian, Y. Air Pollution and Children’s Health—A Review of Adverse Effects Associated with Prenatal Exposure from Fine to Ultrafine Particulate Matter. Environ. Health Prev. Med. 2021, 26, 72. [Google Scholar] [CrossRef]
- Ye, B.S.; Leung, A.O.W.; Wong, M.H. The Association of Environmental Toxicants and Autism Spectrum Disorders in Children. Environ. Pollut. 2017, 227, 234–242. [Google Scholar] [CrossRef]
- Anderko, L.; Chalupka, S.; Du, M.; Hauptman, M. Climate Changes Reproductive and Children’s Health: A Review of Risks, Exposures, and Impacts. Pediatr. Res. 2020, 87, 414–419. [Google Scholar] [CrossRef]
- Brumberg, H.L.; Karr, C.J.; Bole, A.; Ahdoot, S.; Balk, S.J.; Bernstein, A.S.; Byron, L.G.; Landrigan, P.J.; Marcus, S.M.; Nerlinger, A.L. Ambient Air Pollution: Health Hazards to Children. Pediatrics 2021, 147, e2021051484. [Google Scholar] [CrossRef] [PubMed]
- Martins, M.C.H.; Fatigati, F.L.; Vespoli, T.C.; Martins, L.C.; Pereira, L.A.A.; Martins, M.A.; Saldiva, P.H.N.; Braga, A.L.F. Influence of Socioeconomic Conditions on Air Pollution Adverse Health Effects in Elderly People: An Analysis of Six Regions in Sao Paulo, Brazil. J. Epidemiol. Community Health 2004, 58, 41–46. [Google Scholar] [CrossRef]
- Jin, Y.; Wu, S.; Zeng, Z.; Fu, Z. Effects of Environmental Pollutants on Gut Microbiota. Environ. Pollut. 2017, 222, 1–9. [Google Scholar] [CrossRef]
- Wilson, A.G. Epigenetic Regulation of Gene Expression in the Inflammatory Response and Relevance to Common Diseases. J. Periodontol. 2008, 79, 1514–1519. [Google Scholar] [CrossRef] [PubMed] [Green Version]
- Reddington, C.L.; Conibear, L.; Robinson, S.; Knote, C.; Arnold, S.R.; Spracklen, D.V. Air Pollution from Forest and Vegetation Fires in Southeast Asia Disproportionately Impacts the Poor. GeoHealth 2021, 5, e2021GH000418. [Google Scholar] [CrossRef] [PubMed]
- Balbo, P.; Silvestri, M.; Rossi, G.A.; Crimi, E.; Burastero, S.E. Differential Role of CD80 and CD86 on Alveolar Macrophages in the Presentation of Allergen to T Lymphocytes in Asthma. Clin. Exp. Allergy 2001, 31, 625–636. [Google Scholar] [CrossRef] [PubMed]
- Drakaki, E.; Dessinioti, C.; Antoniou, C. V Air Pollution and the Skin. Front. Environ. Sci. 2014, 2, 11. [Google Scholar] [CrossRef] [Green Version]
- Mancebo, S.E.; Wang, S.Q. Recognizing the Impact of Ambient Air Pollution on Skin Health. J. Eur. Acad. Dermatol. Venereol. 2015, 29, 2326–2332. [Google Scholar] [CrossRef] [Green Version]
- Chua, S.Y.L.; Warwick, A.; Peto, T.; Balaskas, K.; Moore, A.T.; Reisman, C.; Desai, P.; Lotery, A.J.; Dhillon, B.; Khaw, P.T. Association of Ambient Air Pollution with Age-Related Macular Degeneration and Retinal Thickness in UK Biobank. Br. J. Ophthalmol. 2022, 106, 705–711. [Google Scholar] [CrossRef]
- El Hamichi, S.; Gold, A.; Murray, T.G.; Graversen, V.K. Pandemics, Climate Change, and the Eye. Graefe’s Arch. Clin. Exp. Ophthalmol. 2020, 258, 2597–2601. [Google Scholar] [CrossRef]
- World Bank Unleaded Gasoline in Bangladesh: An Overnight Success. Available online: http://web.worldbank.org/archive/website00811/WEB/OTHER/E8864F3B.HTM?OpenDocument (accessed on 9 May 2022).
- World Bank Tackling Air Pollution in South Asia. Available online: http://web.worldbank.org/archive/website00811/WEB/PDF/CHAPTER_.PDF (accessed on 9 May 2022).
- Begum, B.A.; Biswas, S.K.; Hopke, P.K. Impact of Banning of Two-Stroke Engines on Airborne Particulate Matter Concentrations in Dhaka, Bangladesh. J. Air Waste Manag. Assoc. 2006, 56, 85–89. [Google Scholar] [CrossRef] [PubMed] [Green Version]
- Samrina, N. Energy Security for Bangladesh: Prospects and Strategic Implications of Natural Gas. Available online: https://www.semanticscholar.org/paper/Energy-security-for-Bangladesh-%3A-prospects-and-of-Samrina/a6df5c1a59845b91f62d703fbc0d2c958044e3de (accessed on 9 May 2022).
- Haque, H.A.; Huda, N.; Tanu, F.Z.; Sultana, N.; Hossain, M.S.A.; Rahman, M.H. Ambient Air Quality Scenario in and around Dhaka City of Bangladesh. Barishal Univ. J. Part 1 2017, 4, 203–218. [Google Scholar]
- Centre for Environmental Education. Clearing the Air: Highlights of City Actions in 2020 to Reduce Air Pollution. 2021. Available online: https://www.nrdc.org/sites/default/files/city-actions-highlights-reduce-air-pollution-202102.pdf (accessed on 9 May 2022).
- Rizwan, S.A.; Nongkynrih, B.; Gupta, S.K. Air Pollution in Delhi: Its Magnitude and Effects on Health. Indian J. Community Med. Off. Publ. Indian Assoc. Prev. Soc. Med. 2013, 38, 4. [Google Scholar]
- Guttikunda, S.K.; Goel, R. Health Impacts of Particulate Pollution in a Megacity—Delhi, India. Environ. Dev. 2013, 6, 8–20. [Google Scholar] [CrossRef]
- Kathuria, V. Impact of CNG on Vehicular Pollution in Delhi: A Note. Transp. Res. Part D Transp. Environ. 2004, 9, 409–417. [Google Scholar] [CrossRef]
- Dulal, H.B.; Dulal, R.; Yadav, P.K. Delivering Green Economy in Asia: The Role of Fiscal Instruments. Futures 2015, 73, 61–77. [Google Scholar] [CrossRef] [Green Version]
- Thapa, R.B.; Murayama, Y.; Ale, S. Kathmandu. Cities 2008, 25, 45–57. [Google Scholar] [CrossRef] [Green Version]
- Romshoo, S.A.; Bhat, M.A.; Beig, G. Particulate Pollution over an Urban Himalayan Site: Temporal Variability, Impact of Meteorology and Potential Source Regions. Sci. Total Environ. 2021, 799, 149364. [Google Scholar] [CrossRef]
- Sanjel, S.; Khanal, S.N.; Thygerson, S.M.; Carter, W.S.; Johnston, J.D.; Joshi, S.K. Respiratory Symptoms and Illnesses Related to the Concentration of Airborne Particulate Matter among Brick Kiln Workers in Kathmandu Valley, Nepal. Ann. Occup. Environ. Med. 2017, 29, 9. [Google Scholar] [CrossRef] [Green Version]
- Shrestha, R.M.; Malla, S. Air Pollution from Energy Use in a Developing Country City: The Case of Kathmandu Valley, Nepal. Energy 1996, 21, 785–794. [Google Scholar] [CrossRef]
- Dhakal, S. Implications of Transportation Policies on Energy and Environment in Kathmandu Valley, Nepal. Energy Policy 2003, 31, 1493–1507. [Google Scholar] [CrossRef]
- Mahmood, A.; Javaid, N.; Zafar, A.; Riaz, R.A.; Ahmed, S.; Razzaq, S. Pakistan’s Overall Energy Potential Assessment, Comparison of LNG, TAPI and IPI Gas Projects. Renew. Sustain. Energy Rev. 2014, 31, 182–193. [Google Scholar] [CrossRef]
- Yeh, S. An Empirical Analysis on the Adoption of Alternative Fuel Vehicles: The Case of Natural Gas Vehicles. Energy Policy 2007, 35, 5865–5875. [Google Scholar] [CrossRef] [Green Version]
- Timilsina, G.R.; Shrestha, A. Transport Sector CO2 Emissions Growth in Asia: Underlying Factors and Policy Options. Energy Policy 2009, 37, 4523–4539. [Google Scholar] [CrossRef]
- United Nations Development Programme. Evaluation of UNDP/GEF Project: Fuel Efficiency in the Road Transport Sector. Available online: https://erc.undp.org/evaluation/documents/download/411 (accessed on 9 May 2022).
- Anjum, M.S.; Ali, S.M.; Subhani, M.A.; Anwar, M.N.; Nizami, A.-S.; Ashraf, U.; Khokhar, M.F. An Emerged Challenge of Air Pollution and Ever-Increasing Particulate Matter in Pakistan: A Critical Review. J. Hazard. Mater. 2021, 402, 123943. [Google Scholar] [CrossRef]
- Ileperuma, O.A. Review of Air Pollution Studies in Sri Lanka. Ceylon J. Sci. 2020, 49, 225–238. [Google Scholar] [CrossRef]
- Rani, R.; Arokiasamy, P.; Sikarwar, A. Household Air Pollution during COVID-19 Pandemic: A Concern in India. J. Public Aff. 2021, 21, e2729. [Google Scholar] [CrossRef]
- Pinder, R.W.; Klopp, J.M.; Kleiman, G.; Hagler, G.S.W.; Awe, Y.; Terry, S. Opportunities and Challenges for Filling the Air Quality Data Gap in Low-and Middle-Income Countries. Atmos. Environ. 2019, 215, 116794. [Google Scholar] [CrossRef]
- Gulia, S.; Shukla, N.; Padhi, L.; Bosu, P.; Goyal, S.K.; Kumar, R. Evolution of Air Pollution Management Policies and Research Gap Assessment in India. Environ. Chall. 2021, 100431. [Google Scholar] [CrossRef]
- Concas, F.; Mineraud, J.; Lagerspetz, E.; Varjonen, S.; Liu, X.; Puolamäki, K.; Nurmi, P.; Tarkoma, S. Low-Cost Outdoor Air Quality Monitoring and Sensor Calibration: A Survey and Critical Analysis. ACM Trans. Sens. Netw. 2021, 17, 1–44. [Google Scholar] [CrossRef]
- Gupta, A.; Bherwani, H.; Gautam, S.; Anjum, S.; Musugu, K.; Kumar, N.; Anshul, A.; Kumar, R. Air Pollution Aggravating COVID-19 Lethality? Exploration in Asian Cities Using Statistical Models. Environ. Dev. Sustain. 2021, 23, 6408–6417. [Google Scholar] [CrossRef] [PubMed]
- Singh, N.; Murari, V.; Kumar, M.; Barman, S.C.; Banerjee, T. Fine Particulates over South Asia: Review and Meta-Analysis of PM2. 5 Source Apportionment through Receptor Model. Environ. Pollut. 2017, 223, 121–136. [Google Scholar] [CrossRef] [PubMed]
- Shrivastava, R.K.; Neeta, S.; Geeta, G. Air Pollution Due to Road Transportation in India: A Review on Assessment and Reduction Strategies. J. Environ. Res. Dev. 2013, 8, 69. [Google Scholar]
- Hou, Y.; Iqbal, W.; Muhammad Shaikh, G.; Iqbal, N.; Ahmad Solangi, Y.; Fatima, A. Measuring Energy Efficiency and Environmental Performance: A Case of South Asia. Processes 2019, 7, 325. [Google Scholar] [CrossRef] [Green Version]
- Lee, Z.H.; Sethupathi, S.; Lee, K.T.; Bhatia, S.; Mohamed, A.R. An Overview on Global Warming in Southeast Asia: CO2 Emission Status, Efforts Done, and Barriers. Renew. Sustain. Energy Rev. 2013, 28, 71–81. [Google Scholar] [CrossRef]
- Gordon, S.B.; Bruce, N.G.; Grigg, J.; Hibberd, P.L.; Kurmi, O.P.; Lam, K.H.; Mortimer, K.; Asante, K.P.; Balakrishnan, K.; Balmes, J. Respiratory Risks from Household Air Pollution in Low and Middle Income Countries. Lancet Respir. Med. 2014, 2, 823–860. [Google Scholar] [CrossRef] [Green Version]
- Anwar, M.N.; Shabbir, M.; Tahir, E.; Iftikhar, M.; Saif, H.; Tahir, A.; Murtaza, M.A.; Khokhar, M.F.; Rehan, M.; Aghbashlo, M. Emerging Challenges of Air Pollution and Particulate Matter in China, India, and Pakistan and Mitigating Solutions. J. Hazard. Mater. 2021, 416, 125851. [Google Scholar] [CrossRef]
- Angelidou, M.; Psaltoglou, A.; Komninos, N.; Kakderi, C.; Tsarchopoulos, P.; Panori, A. Enhancing Sustainable Urban Development through Smart City Applications. J. Sci. Technol. Policy Manag. 2018, 9, 146–169. [Google Scholar] [CrossRef]
- Das, J.K. Responding to Green Concerns: The Roles for Government and Business. Vikalpa 2002, 27, 3–12. [Google Scholar] [CrossRef] [Green Version]
- Opoku, L.; Gyimah, A.G.; Addai, B. Harnessing Waste-to-Energy Potential in Developing Countries: A Case Study of Rural Ghana. Environ. Sci. Pollut. Res. 2022, 1–11. [Google Scholar] [CrossRef]
- Wang, J.; Wu, Q.; Liu, J.; Yang, H.; Yin, M.; Chen, S.; Guo, P.; Ren, J.; Luo, X.; Linghu, W. Vehicle Emission and Atmospheric Pollution in China: Problems, Progress, and Prospects. PeerJ 2019, 7, e6932. [Google Scholar] [CrossRef] [PubMed]
- Khwaja, M.A. Environmental Challenges and Constraints to Policy Issues for Sustainable Industrial Development in Pakistan. 2012. Available online: http://www.eldis.org/document/A70198 (accessed on 9 May 2022).


Publisher’s Note: MDPI stays neutral with regard to jurisdictional claims in published maps and institutional affiliations. |
© 2022 by the authors. Licensee MDPI, Basel, Switzerland. This article is an open access article distributed under the terms and conditions of the Creative Commons Attribution (CC BY) license (https://creativecommons.org/licenses/by/4.0/).
Share and Cite
Abdul Jabbar, S.; Tul Qadar, L.; Ghafoor, S.; Rasheed, L.; Sarfraz, Z.; Sarfraz, A.; Sarfraz, M.; Felix, M.; Cherrez-Ojeda, I. Air Quality, Pollution and Sustainability Trends in South Asia: A Population-Based Study. Int. J. Environ. Res. Public Health 2022, 19, 7534. https://doi.org/10.3390/ijerph19127534
Abdul Jabbar S, Tul Qadar L, Ghafoor S, Rasheed L, Sarfraz Z, Sarfraz A, Sarfraz M, Felix M, Cherrez-Ojeda I. Air Quality, Pollution and Sustainability Trends in South Asia: A Population-Based Study. International Journal of Environmental Research and Public Health. 2022; 19(12):7534. https://doi.org/10.3390/ijerph19127534
Chicago/Turabian StyleAbdul Jabbar, Saima, Laila Tul Qadar, Sulaman Ghafoor, Lubna Rasheed, Zouina Sarfraz, Azza Sarfraz, Muzna Sarfraz, Miguel Felix, and Ivan Cherrez-Ojeda. 2022. "Air Quality, Pollution and Sustainability Trends in South Asia: A Population-Based Study" International Journal of Environmental Research and Public Health 19, no. 12: 7534. https://doi.org/10.3390/ijerph19127534
APA StyleAbdul Jabbar, S., Tul Qadar, L., Ghafoor, S., Rasheed, L., Sarfraz, Z., Sarfraz, A., Sarfraz, M., Felix, M., & Cherrez-Ojeda, I. (2022). Air Quality, Pollution and Sustainability Trends in South Asia: A Population-Based Study. International Journal of Environmental Research and Public Health, 19(12), 7534. https://doi.org/10.3390/ijerph19127534