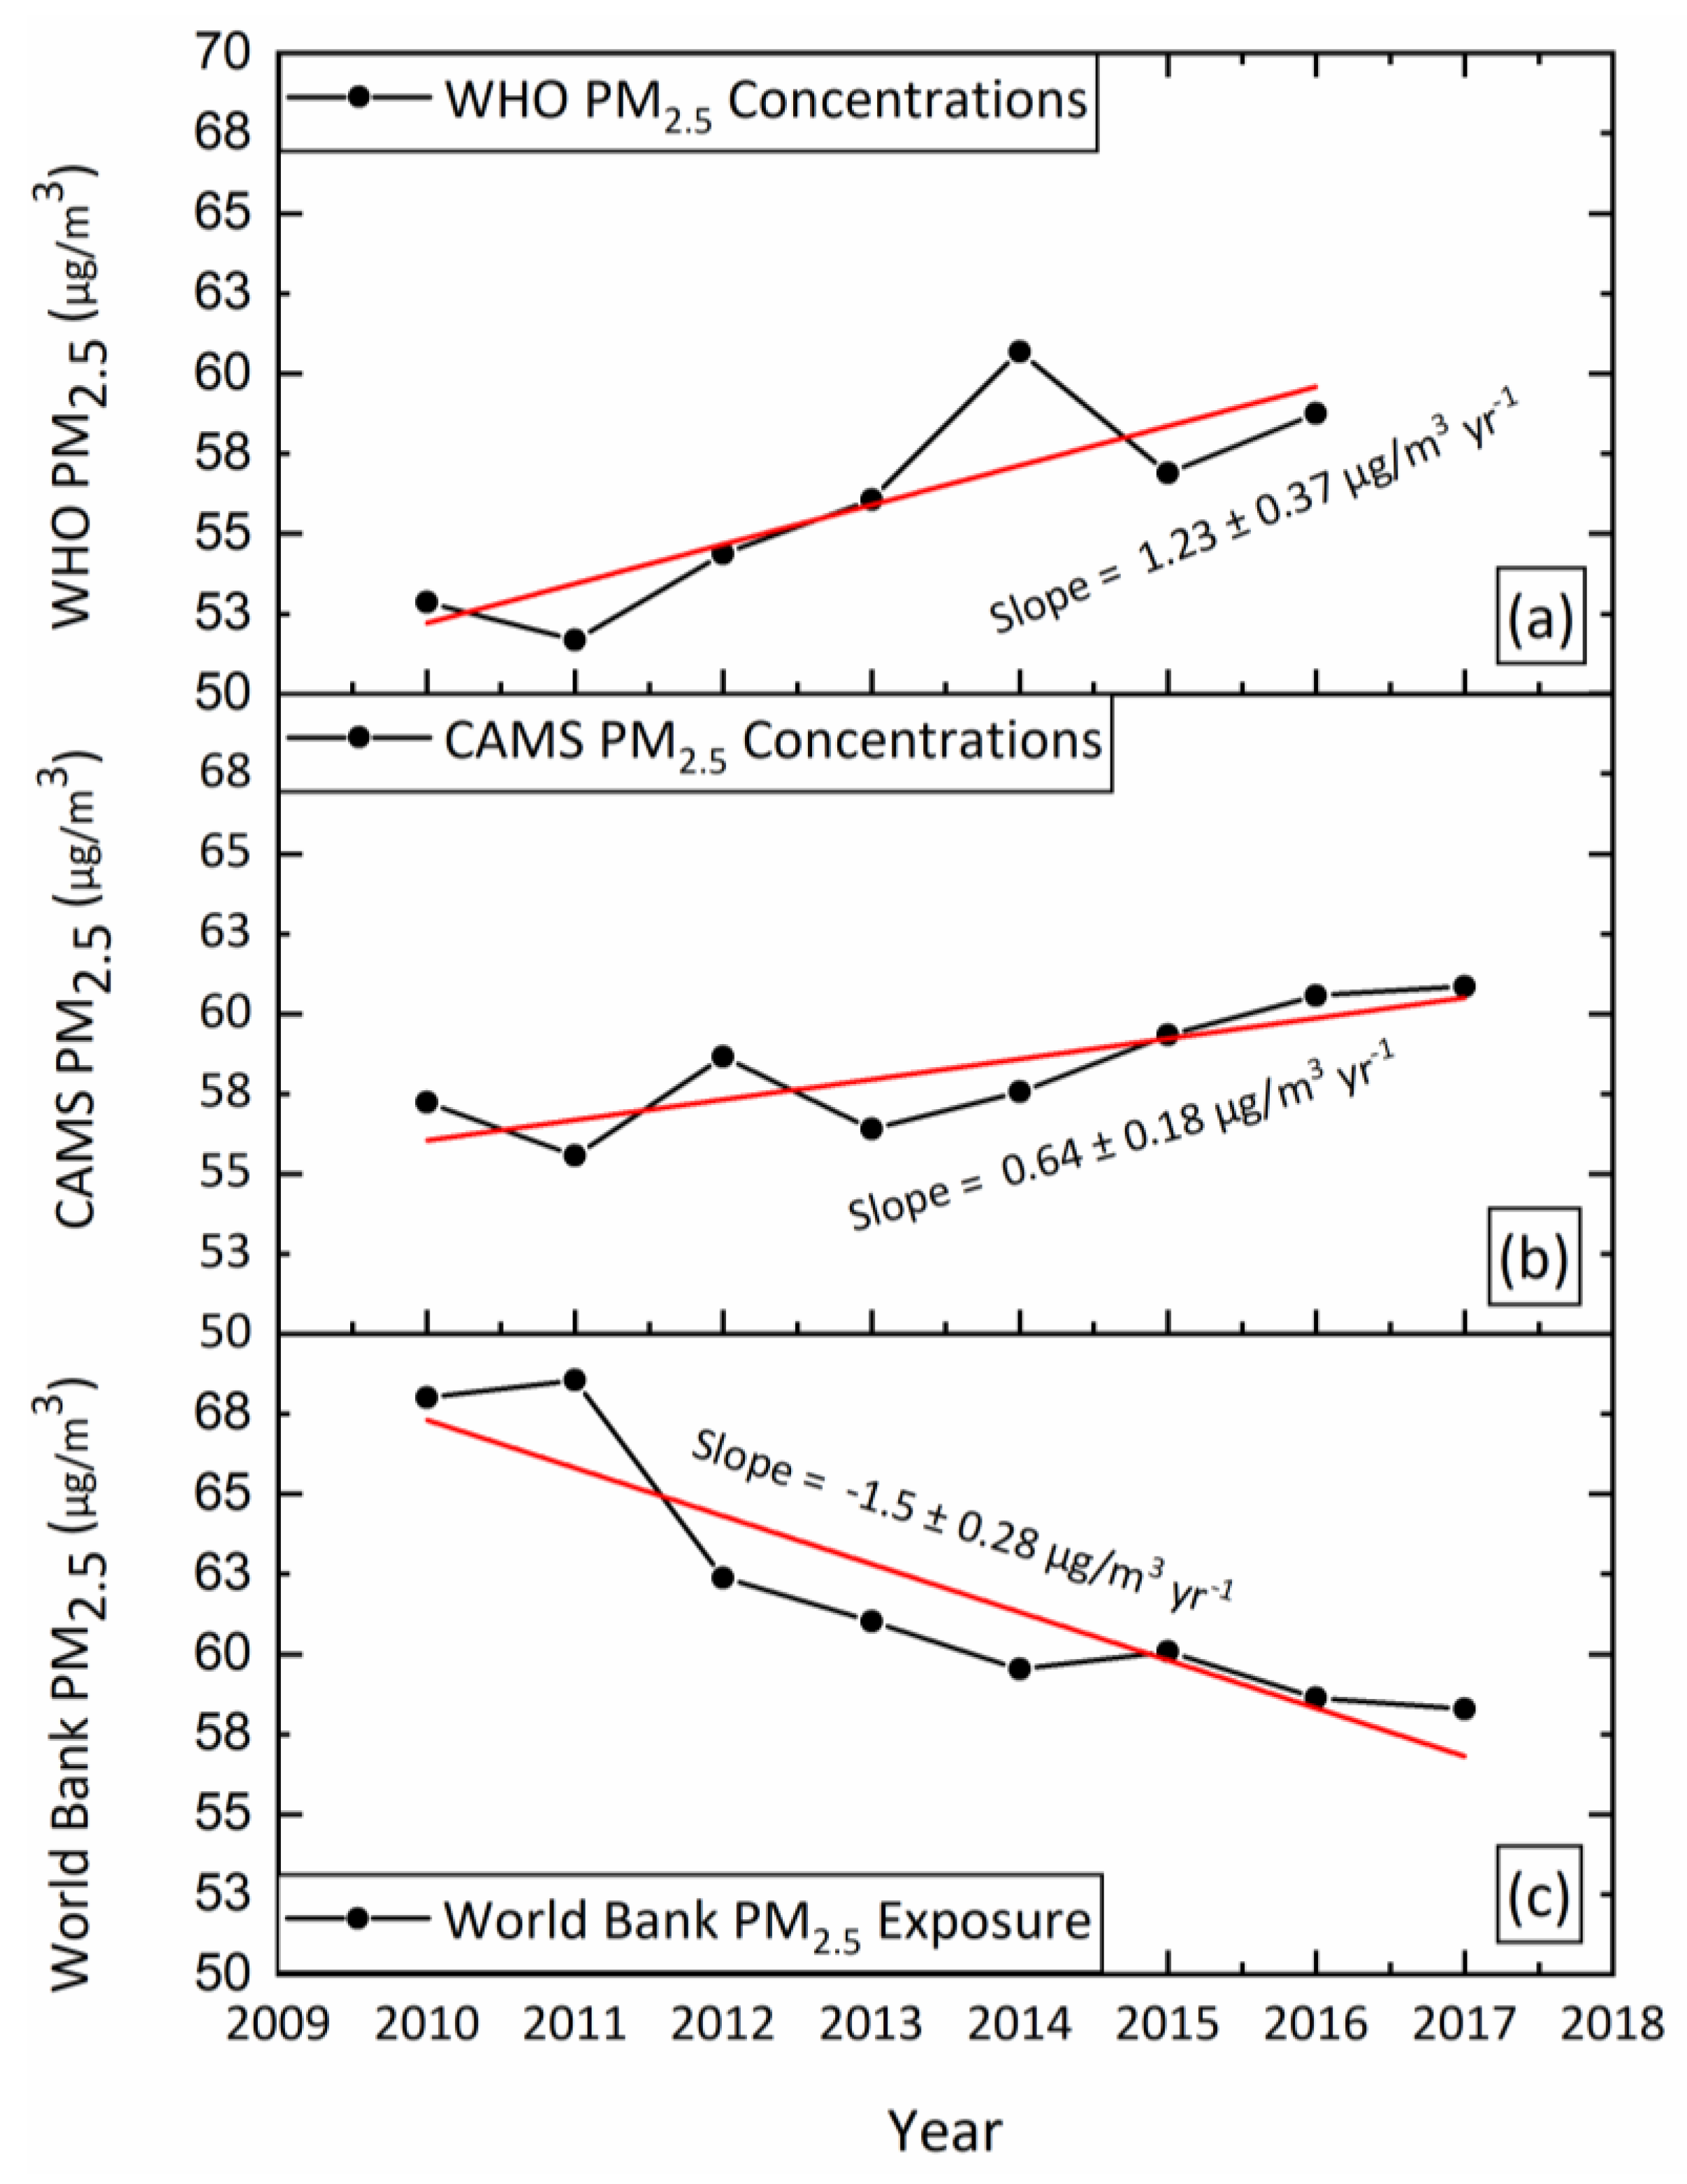
Comment on Abdul Jabbar et al. Air Quality, Pollution and Sustainability Trends in South Asia: A Population-Based Study. Int. J. Environ. Res. Public Health 2022, 19, 7534
Author Contributions
Funding
Data Availability Statement
Acknowledgments
Conflicts of Interest
References
- Abdul Jabbar, S.; Tul Qadar, L.; Ghafoor, S.; Rasheed, L.; Sarfraz, Z.; Sarfraz, A.; Sarfraz, M.; Felix, M.; Cherrez-Ojeda, I. Air Quality, Pollution and Sustainability Trends in South Asia: A Population-Based Study. Int. J. Environ. Res. Public Health 2022, 19, 7534. [Google Scholar] [CrossRef] [PubMed]
- Upadhyay, A.; Mahapatra, P.S.; Singh, P.K.; Dahal, S.; Pokhrel, S.; Bhujel, A.; Joshi, I.B.; Paudel, S.P.; Puppal, S.P.; Adhikary, B. Learnings from COVID-19 Forced Lockdown on Regional Air Quality and Mitigation Potential for South Asia. Aerosol Air Qual. Res. 2022, 22, 210376. [Google Scholar] [CrossRef]
- Environment and Health Information System (ENHIS): Population Weighted Annual Mean PM2.5 in Cities. Available online: https://gateway.euro.who.int/en/indicators/enhis_26-population-weighted-annual-mean-pm25-in-cities/ (accessed on 5 November 2022).
- Bilal, M.; Mhawish, A.; Nichol, J.E.; Qiu, Z.; Nazeer, M.; Ali, M.A.; de Leeuw, G.; Levy, R.C.; Wang, Y.; Chen, Y.; et al. Air pollution scenario over Pakistan: Characterization and ranking of extremely polluted cities using long-term concentrations of aerosols and trace gases. Remote Sens. Environ. 2021, 264, 112617. [Google Scholar] [CrossRef]
- Brauer, M.; Freedman, G.; Frostad, J.; van Donkelaar, A.; Martin, R.V.; Dentener, F.; van Dingenen, R.; Estep, K.; Amini, H.; Apte, J.S.; et al. Ambient Air Pollution Exposure Estimation for the Global Burden of Disease 2013. Environ. Sci. Technol. 2016, 50, 79–88. [Google Scholar] [CrossRef] [PubMed]

Disclaimer/Publisher’s Note: The statements, opinions and data contained in all publications are solely those of the individual author(s) and contributor(s) and not of MDPI and/or the editor(s). MDPI and/or the editor(s) disclaim responsibility for any injury to people or property resulting from any ideas, methods, instructions or products referred to in the content. |
© 2023 by the authors. Licensee MDPI, Basel, Switzerland. This article is an open access article distributed under the terms and conditions of the Creative Commons Attribution (CC BY) license (https://creativecommons.org/licenses/by/4.0/).
Share and Cite
Bilal, M.; de Leeuw, G.; Nichol, J.E.; Bleiweiss, M.P.; Yang, L.; Chai, H.; Mhawish, A.; Ali, M.A. Comment on Abdul Jabbar et al. Air Quality, Pollution and Sustainability Trends in South Asia: A Population-Based Study. Int. J. Environ. Res. Public Health 2022, 19, 7534. Int. J. Environ. Res. Public Health 2023, 20, 5075. https://doi.org/10.3390/ijerph20065075
Bilal M, de Leeuw G, Nichol JE, Bleiweiss MP, Yang L, Chai H, Mhawish A, Ali MA. Comment on Abdul Jabbar et al. Air Quality, Pollution and Sustainability Trends in South Asia: A Population-Based Study. Int. J. Environ. Res. Public Health 2022, 19, 7534. International Journal of Environmental Research and Public Health. 2023; 20(6):5075. https://doi.org/10.3390/ijerph20065075
Chicago/Turabian StyleBilal, Muhammad, Gerrit de Leeuw, Janet E. Nichol, Max P. Bleiweiss, Leiku Yang, Huabin Chai, Alaa Mhawish, and Md. Arfan Ali. 2023. "Comment on Abdul Jabbar et al. Air Quality, Pollution and Sustainability Trends in South Asia: A Population-Based Study. Int. J. Environ. Res. Public Health 2022, 19, 7534" International Journal of Environmental Research and Public Health 20, no. 6: 5075. https://doi.org/10.3390/ijerph20065075
APA StyleBilal, M., de Leeuw, G., Nichol, J. E., Bleiweiss, M. P., Yang, L., Chai, H., Mhawish, A., & Ali, M. A. (2023). Comment on Abdul Jabbar et al. Air Quality, Pollution and Sustainability Trends in South Asia: A Population-Based Study. Int. J. Environ. Res. Public Health 2022, 19, 7534. International Journal of Environmental Research and Public Health, 20(6), 5075. https://doi.org/10.3390/ijerph20065075


