
Food Consumption and Metabolic Risks in Young University Students

 , ,
, ,  , ,
, ,  and
and
Abstract
:
1. Introduction
2. Materials and Methods
2.1. Study Design and Participants
2.2. Anthropometric and Dietary Measurement
2.3. Biochemical Assessment and Inflammation Markers
2.4. Clinical Evaluations and Metabolic Risk
2.5. Statistical Analysis
3. Results
3.1. Description of the Population and Diet Characterization
3.2. Food Consumption Associated with the Presence of Metabolic Risks
3.3. Dietary Consumption and Obesity in Relation to Adiponectin and IL-6 Concentrations
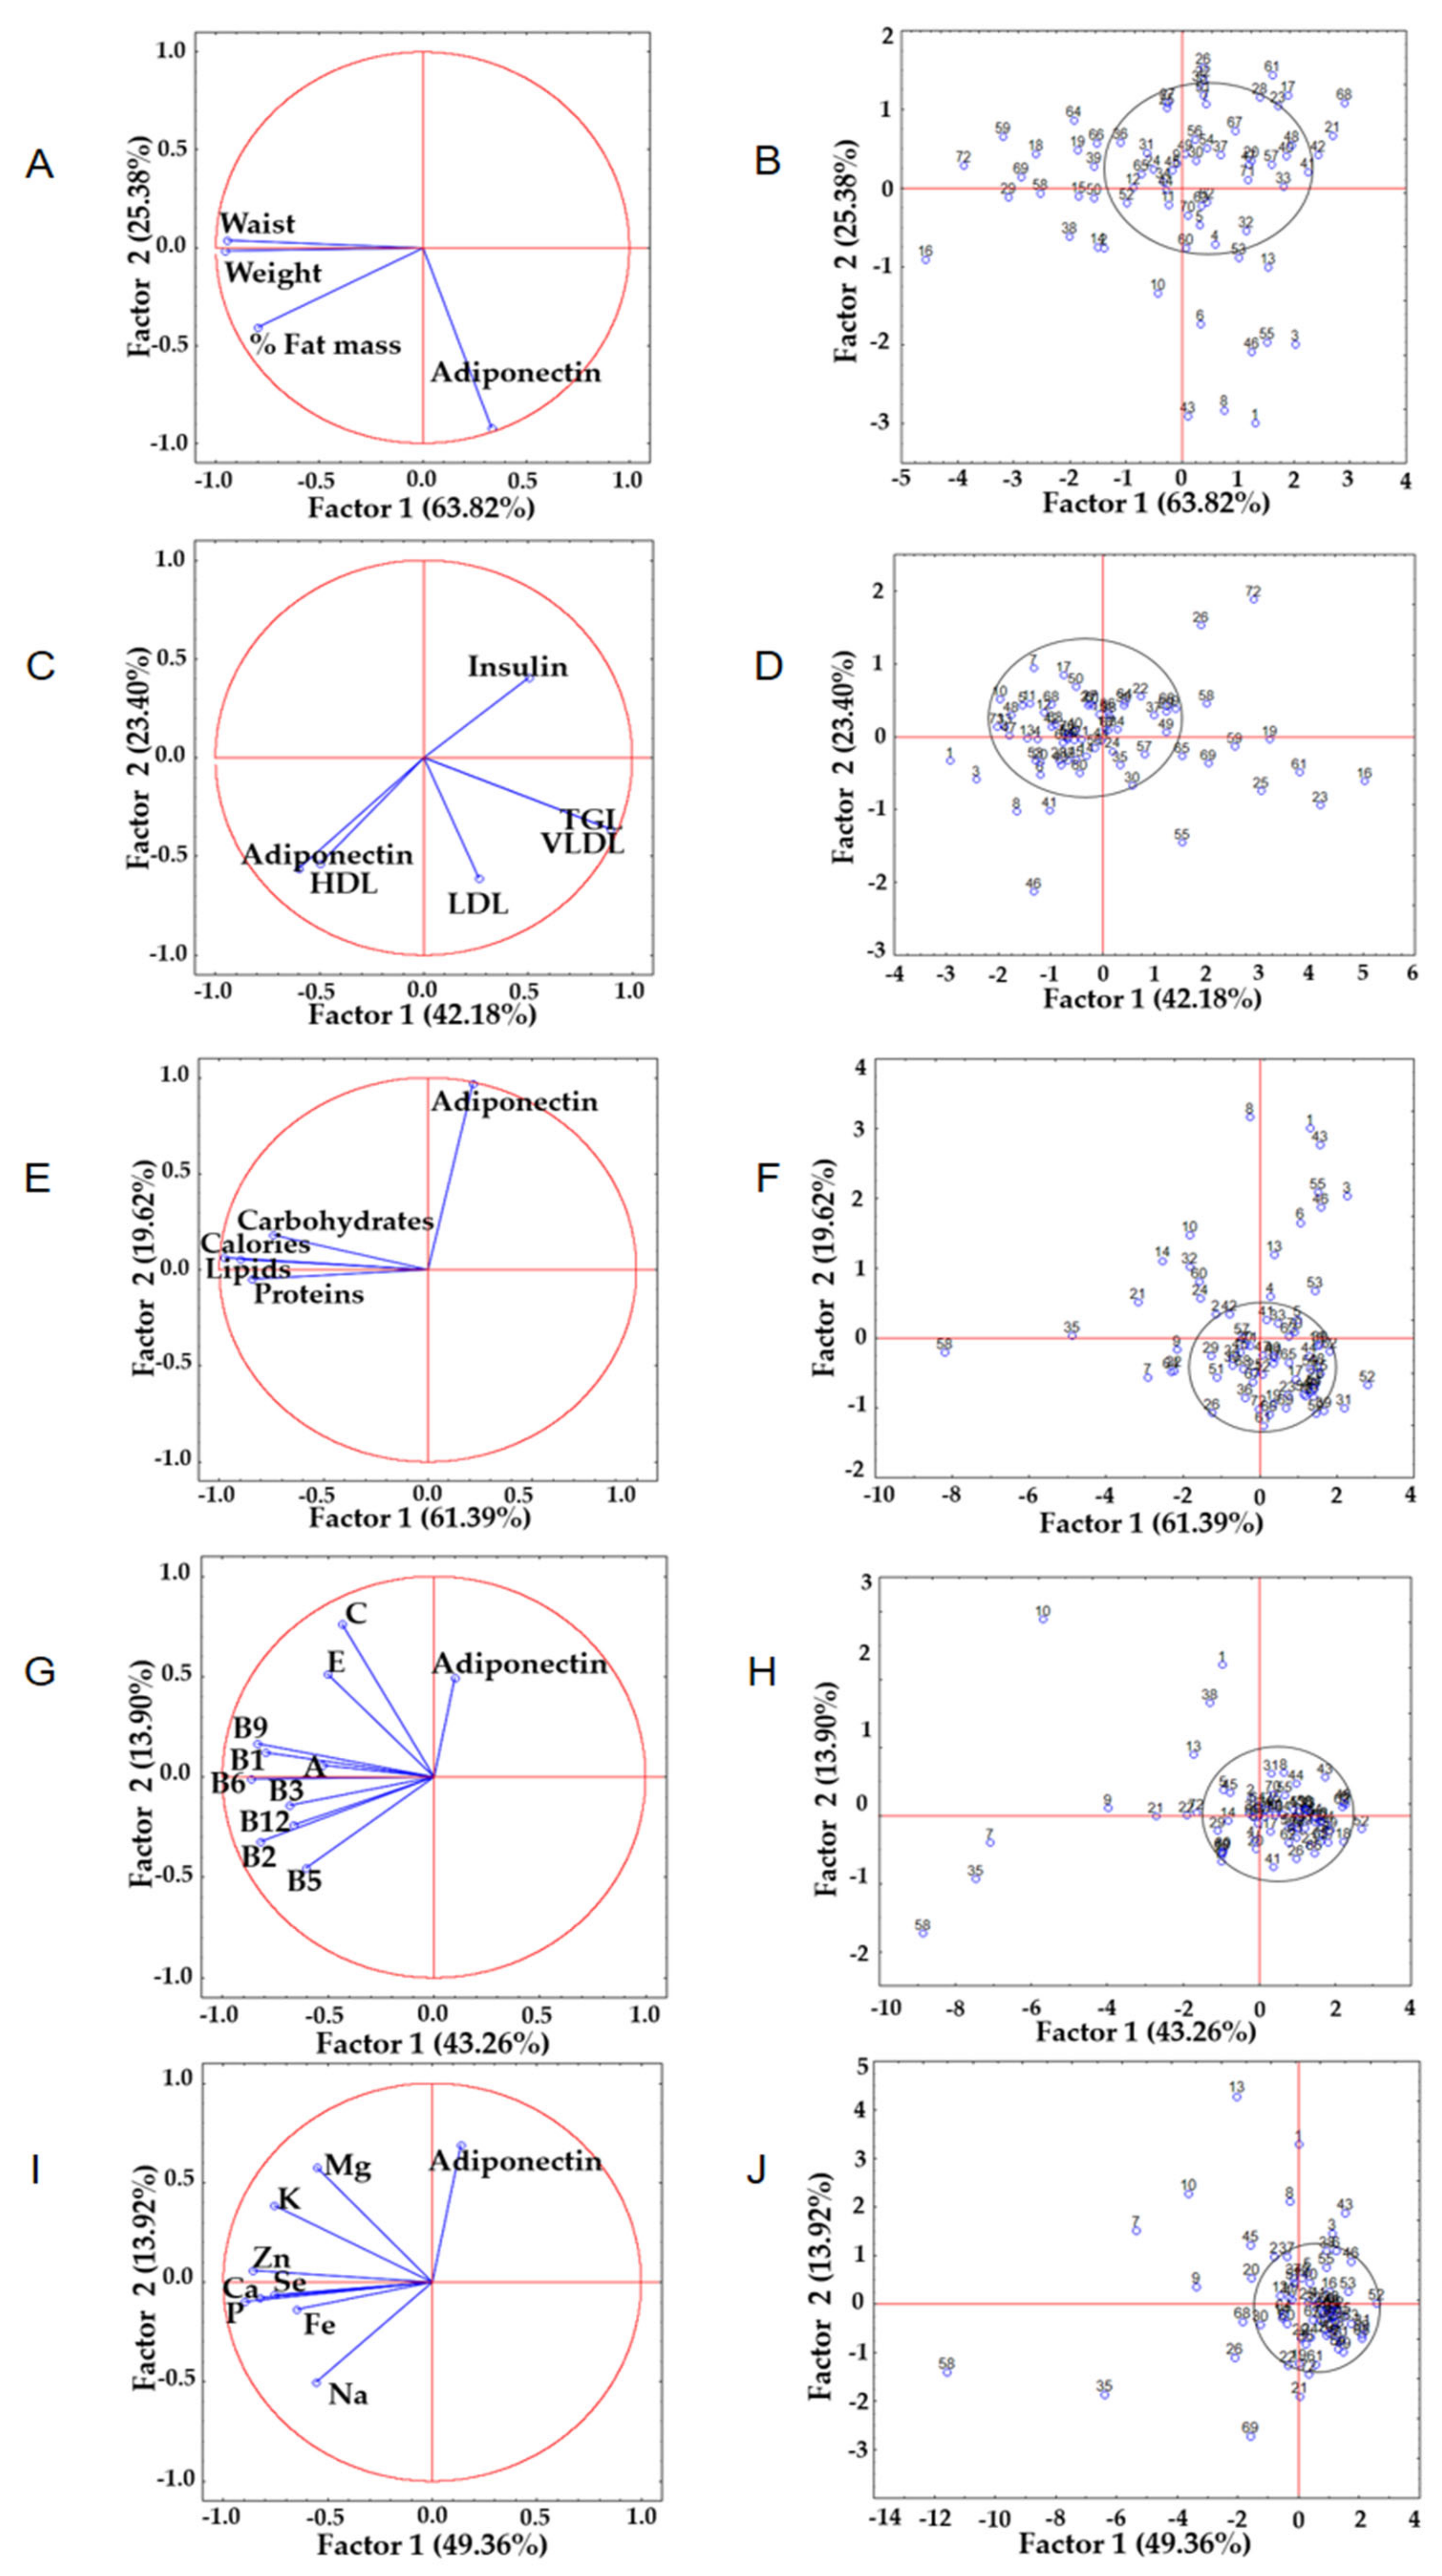
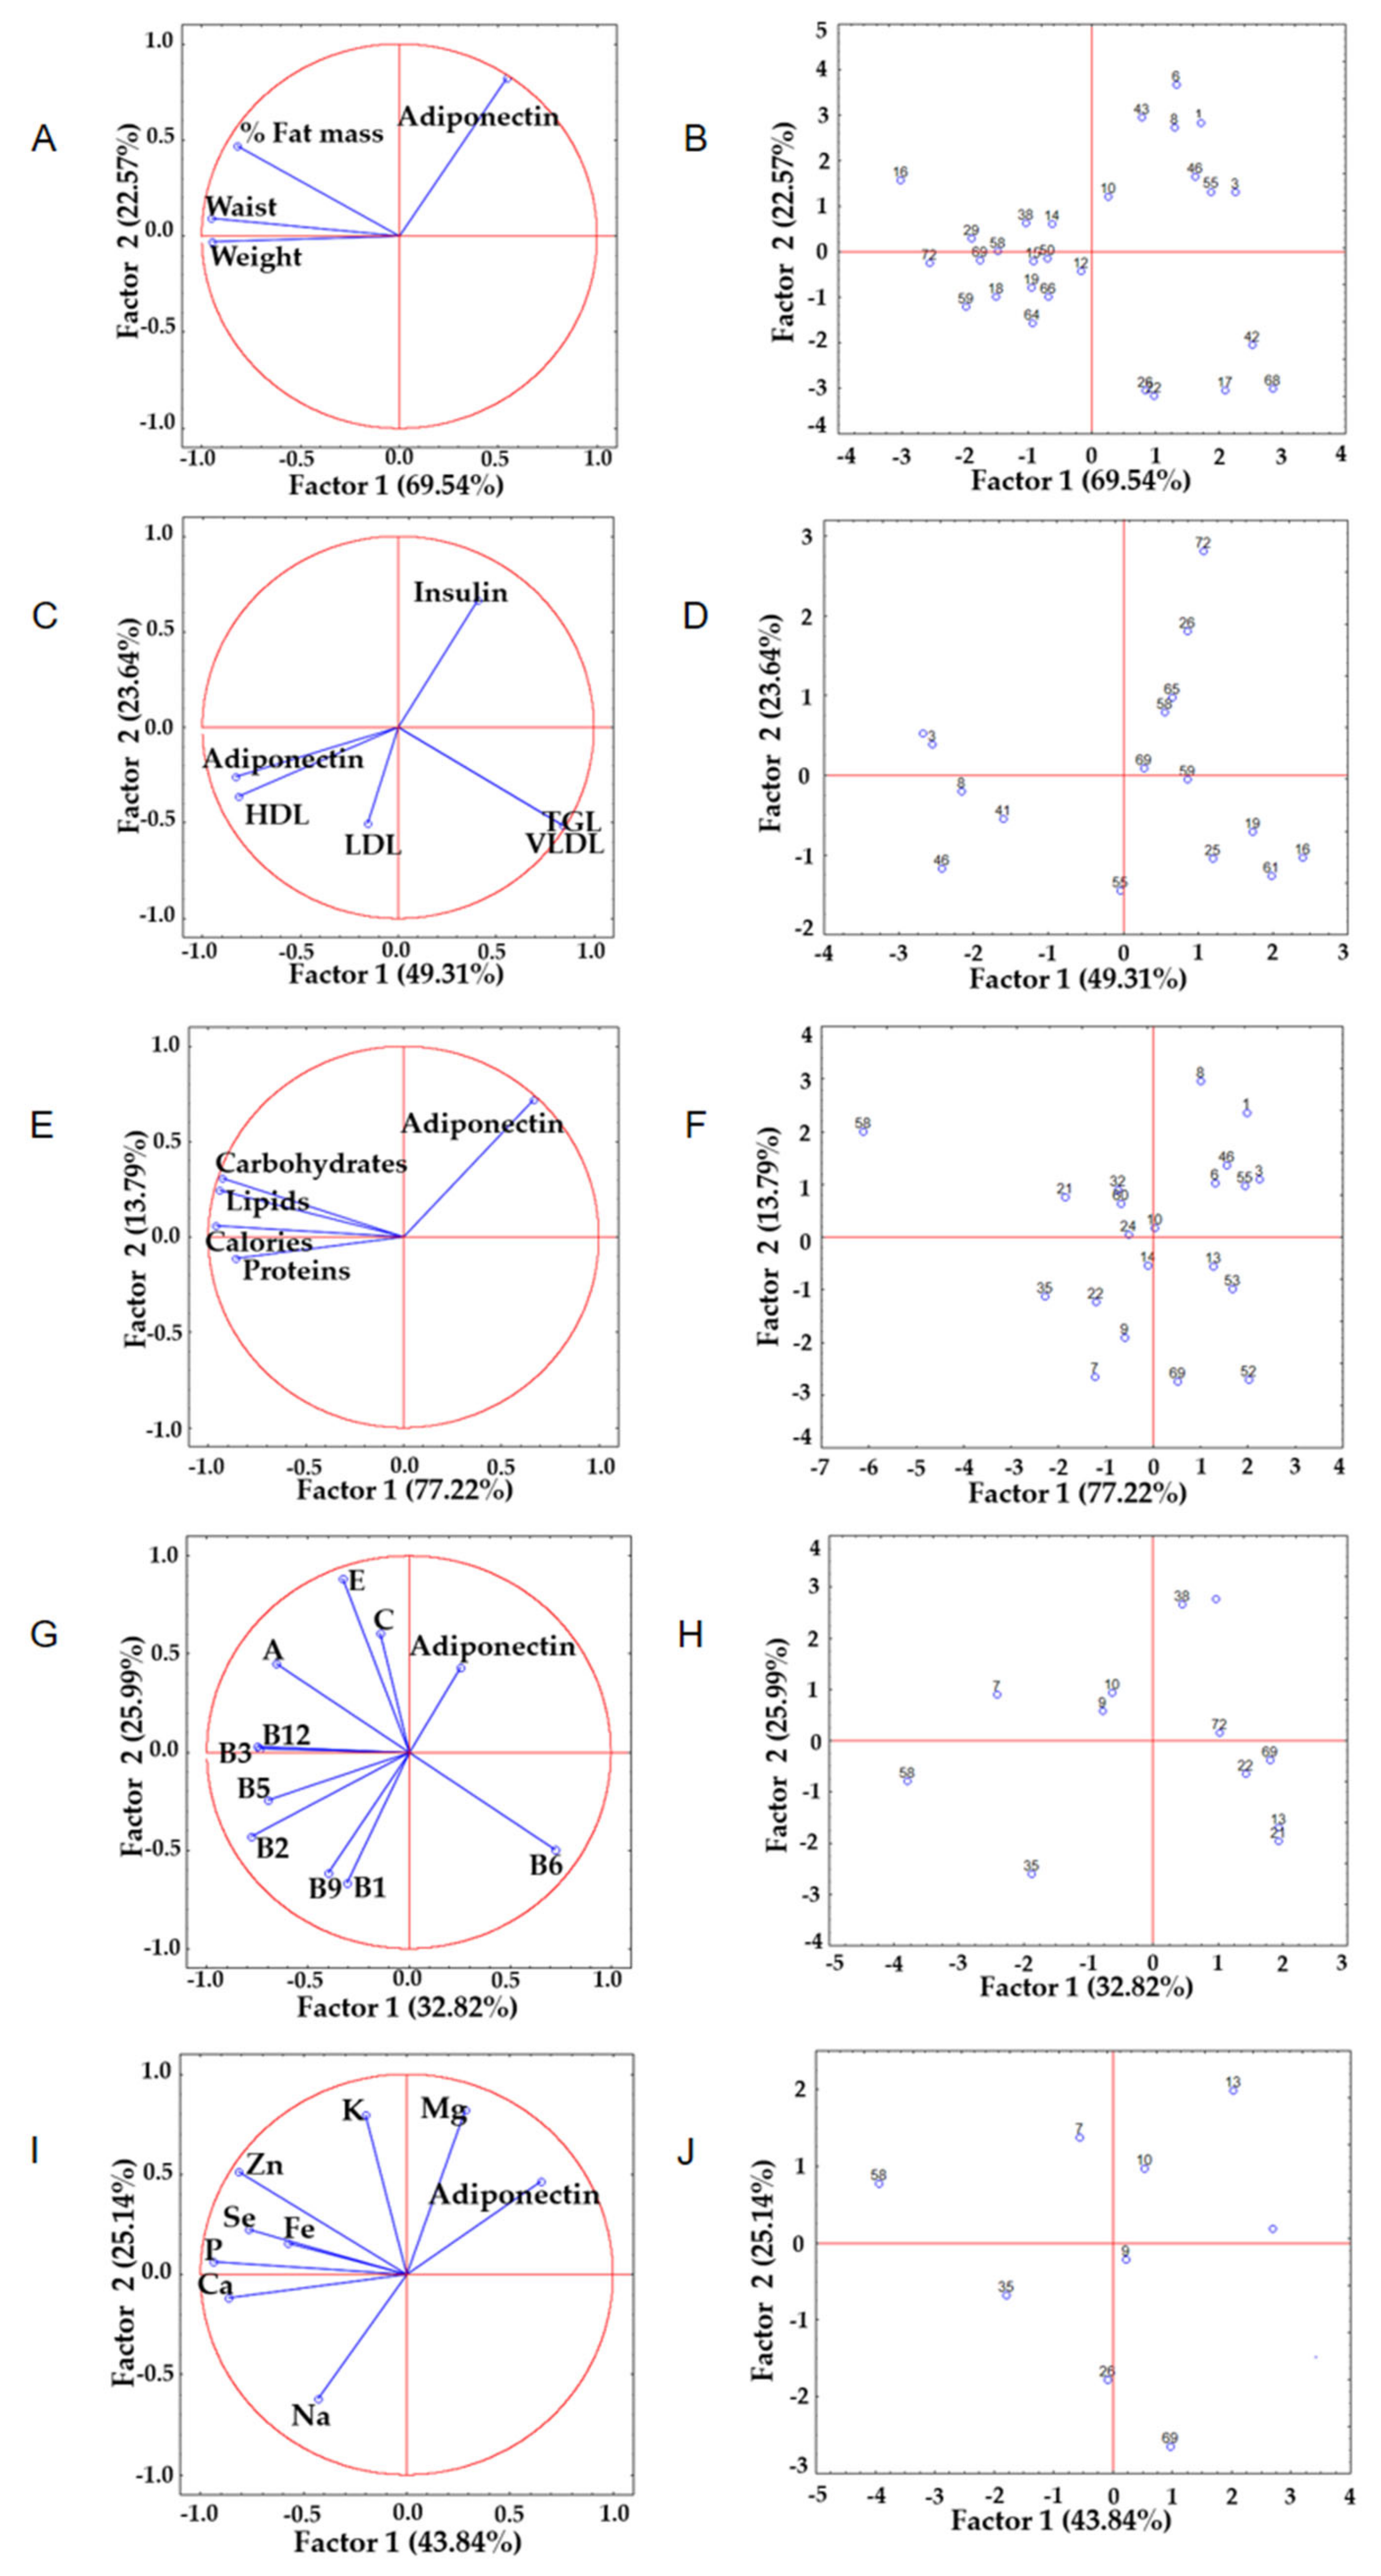
3.4. Principal Component Analysis among the Variables Analyzed
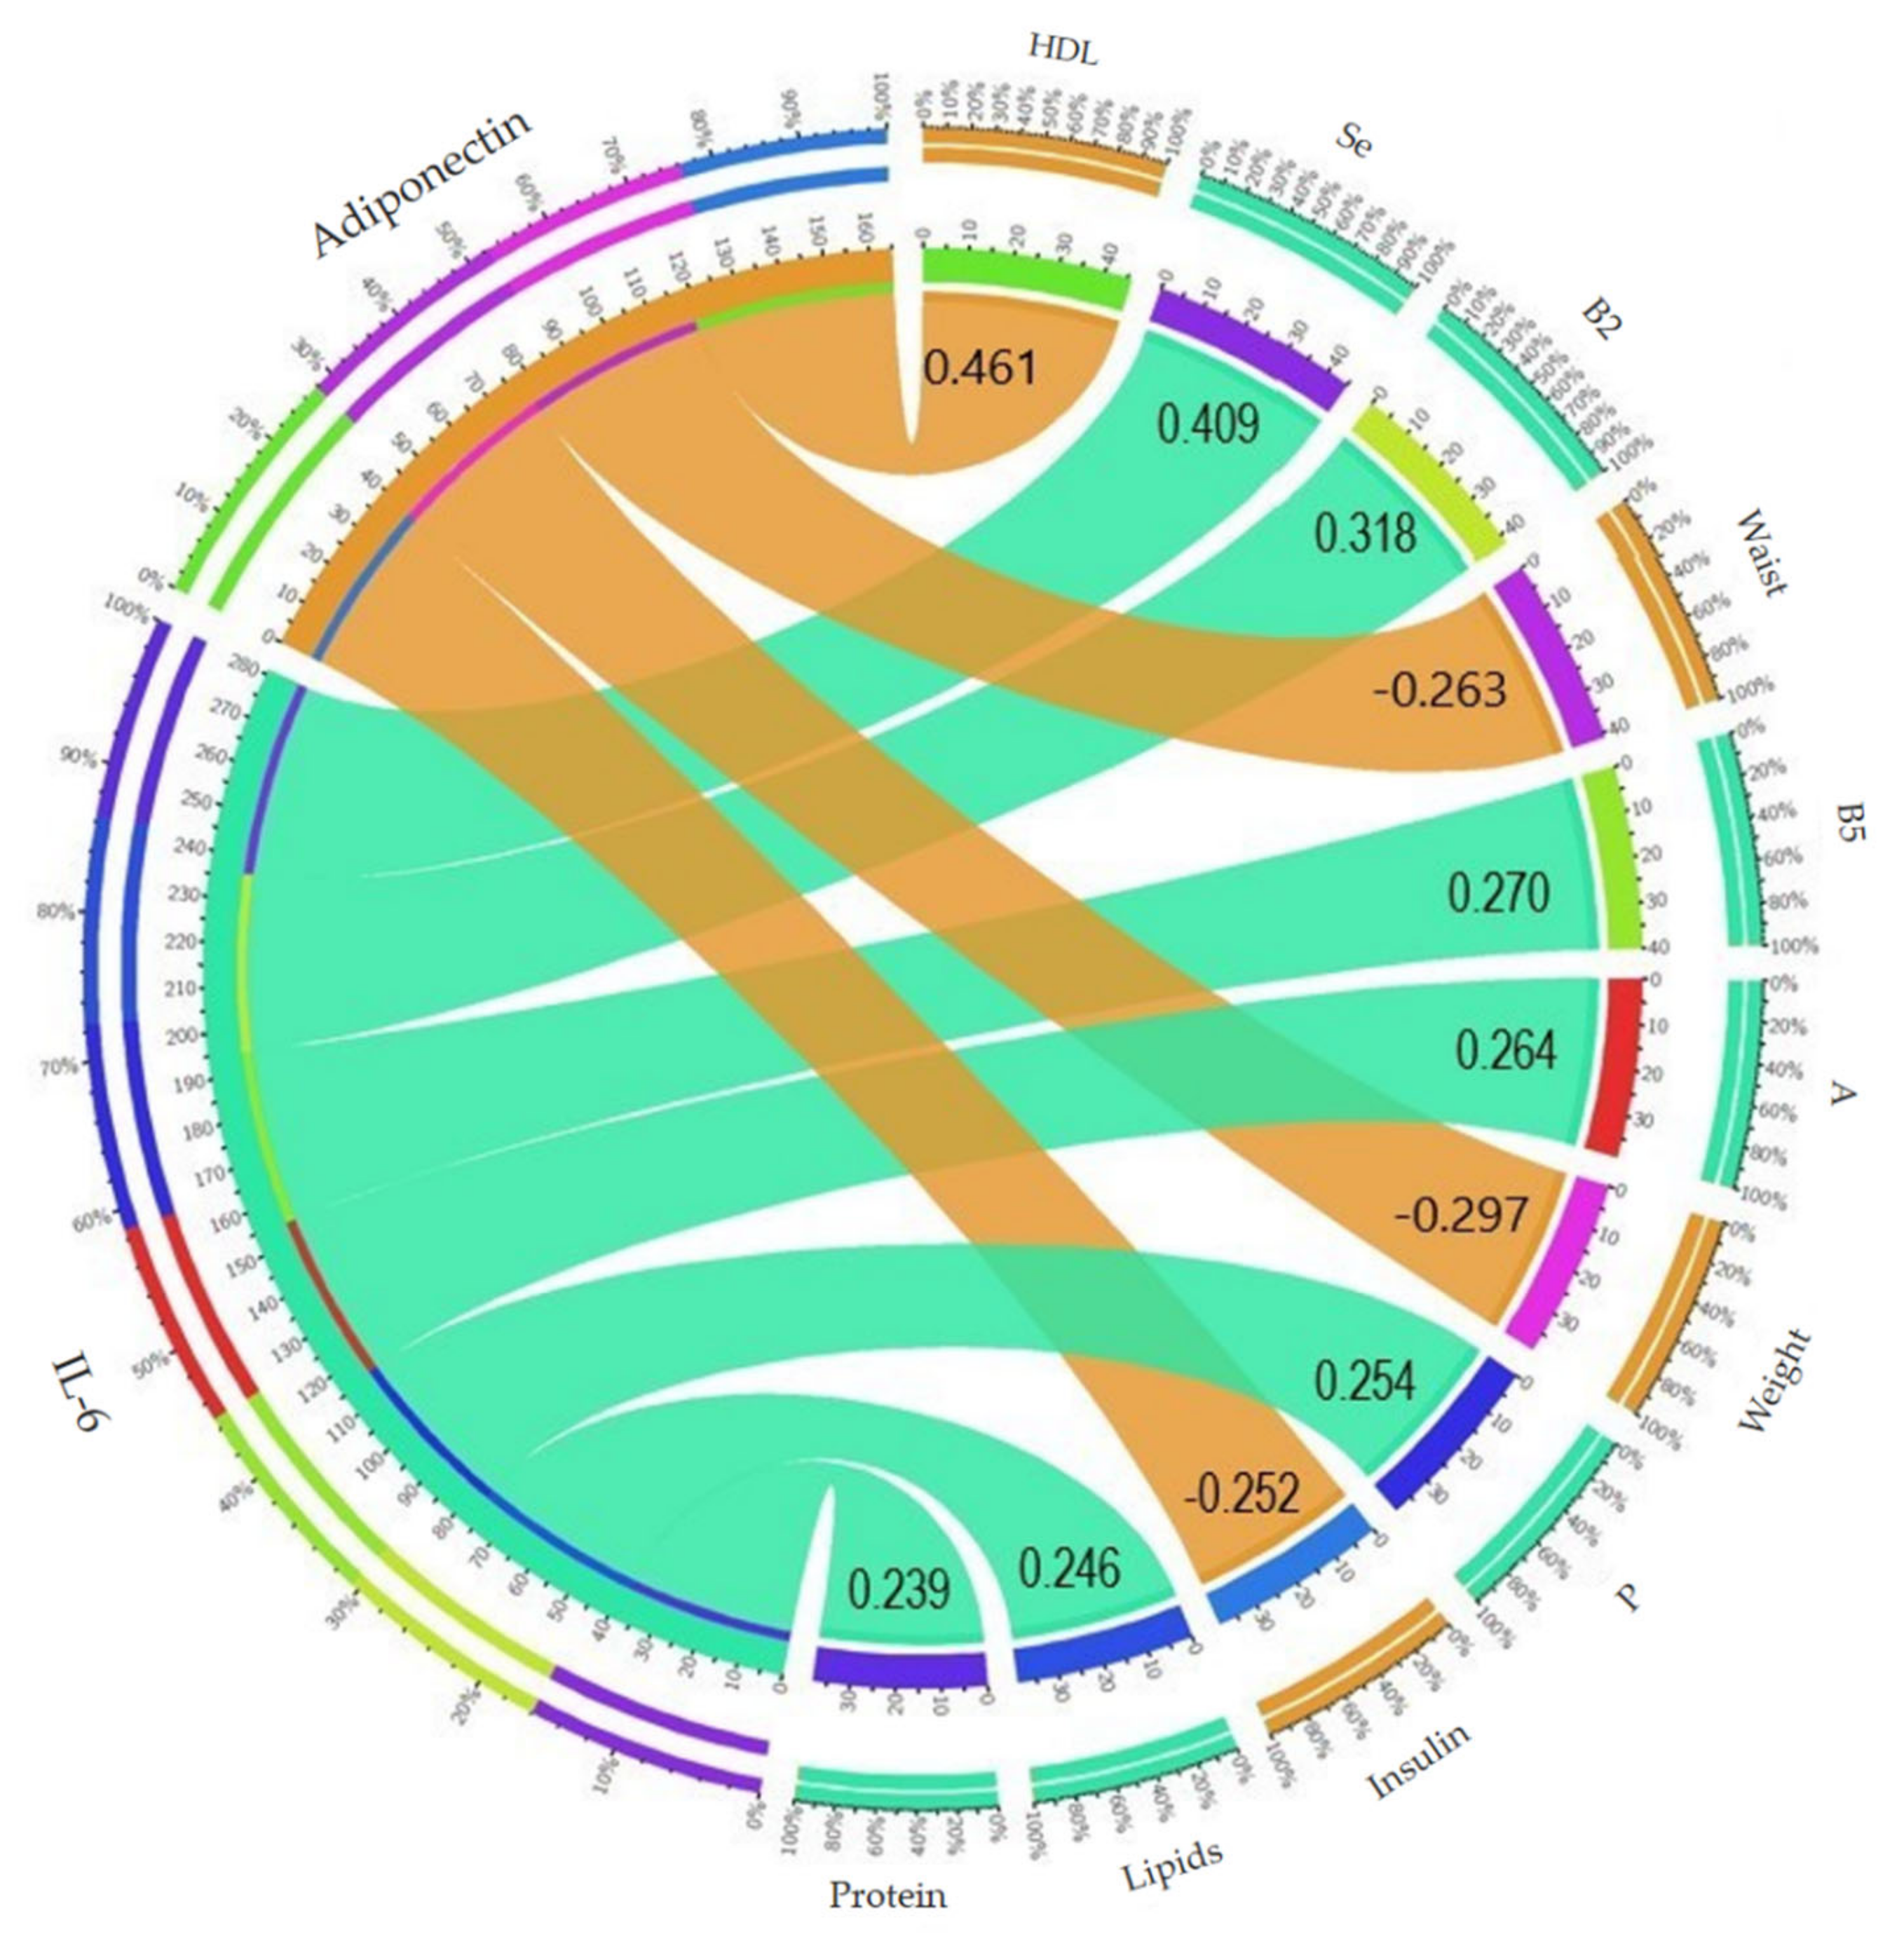
3.5. Relationship of the Anti-Inflammatory Cytokine Adiponectin and Inflammatory IL-6 with the Parameters Evaluated
4. Discussion
Limitations
5. Conclusions and Perspectives
Supplementary Materials
Author Contributions
Funding
Institutional Review Board Statement
Informed Consent Statement
Data Availability Statement
Acknowledgments
Conflicts of Interest
Appendix A

| Indicators | Total (n = 72) | Men (n = 14) | Women (n = 58) | p-Value |
|---|---|---|---|---|
| Sociodemographic | ||||
| a Age (years) | 19.2 ± 1.0 | 19.4 ± 1.3 | 19.1 ± 0.9 | 0.541 |
| b Tobacco (n) | 19 | 4 | 15 | 0.539 |
| b Sedentary lifestyle (n) | 37 | 6 | 31 | 0.340 |
| Anthropometrics | ||||
| c Weight (kg) | 63.3 ± 13.8 | 70.8 ± 13.5 | 61.5 ± 13.4 | 0.032 * |
| c Height (m) | 1.64 ± 0.1 | 1.73 ± 0.1 | 1.62 ± 0.1 | <0.001 ** |
| a Waist (cm) | 75.0 ± 10.3 | 80.3 ± 8.5 | 73.7 ± 10.3 | 0.011 * |
| c Fat mass (%) | 26.1 ± 9.8 | 17.3 ± 8.3 | 28.2 ± 8.9 | <0.001 ** |
| b Underweight (n) | 6 | 1 | 5 | 0.670 |
| b Normal weight (n) | 47 | 9 | 38 | 0.581 |
| b Overweight (n) | 12 | 2 | 10 | 0.575 |
| b Obesity (n) | 7 | 2 | 5 | 0.411 |
| Dietetics | ||||
| a Energy (kcal/day) | 1939.4 ± 705.7 | 2199.1 ± 823.7 | 1876.8 ± 667.1 | 0.238 |
| a Carbohydrates (g/day) | 243.3 ± 97.4 | 282.9 ± 112.4 | 233.8 ± 91.9 | 0.102 |
| a Protein (g/day) | 81.1 ± 35.7 | 89.2 ± 46.2 | 79.1 ± 32.8 | 0.765 |
| a Lipids (g/day) | 76.8 ± 37.8 | 84.8 ± 33.8 | 74.9 ± 38.7 | 0.238 |
| Food Group | Total (n = 72) | Presence (n = 15) | Absence (n = 57) | p-Value |
|---|---|---|---|---|
| Fruit | 1.59 | 1.79 | 1.54 | 0.514 |
| Vegetables | 2.79 | 2.68 | 2.81 | 0.492 |
| Legumes | 0.68 | 0.77 | 0.66 | 0.141 |
| Cereals | 8.71 | 8.74 | 8.71 | 0.623 |
| Meats | 6.09 | 6.79 | 5.90 | 0.623 |
| Dairy | 0.97 | 1.01 | 0.96 | 0.505 |
| Fats | 3.43 | 2.4 | 3.40 | 0.657 |
| Sugars | 3.20 | 2.41 | 3.40 | 0.471 |
| Indicators | Total (n = 72) | Presence (n = 27) | Absence (n = 45) | p-Value |
|---|---|---|---|---|
| Energy (kcal/day) | 1939.4 ± 705.7 | 2029.3 ± 825.0 | 1881.5 ± 633.9 | 0.636 |
| Carbohydrates (g) | 243.3 ± 97.4 | 246.9 ± 75.1 | 240.7 ± 110.5 | 0.303 |
| Protein (g) | 81.1 ± 35.7 | 82.2 ± 42.5 | 79.8 ± 31.6 | 0.981 |
| Lipids (g) | 76.8 ± 37.8 | 81.0 ± 50.0 | 74.4 ± 28.8 | 0.953 |
| Vitamin A (mcg) | 984.1 ± 925.9 | 1136.8 ± 1010.6 | 884.5 ± 878.5 | 0.207 |
| Vitamin B1 (mg) | 1.4 ± 0.7 | 1.5 ± 0.6 | 1.3 ± 0.8 | 0.140 |
| Vitamin B2 (mg) | 1.6 ± 1.3 | 1.8 ± 1.7 | 1.6 ± 1.0 | 0.957 |
| Vitamin B3 (mg) | 17.8 ± 10.1 | 16.2 ± 5.8 | 18.4 ± 11.9 | 0.850 |
| Vitamin B5 (mg) | 3.0 ± 3.0 | 2.9 ± 3.8 | 3.1 ± 2.6 | 0.390 |
| Vitamin B6 (mg) | 1.5 ± 0.9 | 1.5 ± 0.6 | 1.6 ± 1.0 | 0.976 |
| Vitamin B9 (mcg) | 265.2 ± 195.7 | 296.8 ± 207.6 | 246.2 ± 190.2 | 0.155 |
| Vitamin B12 (mcg) | 4.0 ± 4.6 | 4.4 ± 5.8 | 3.8 ± 3.8 | 0.308 |
| Vitamin C (mg) | 110.5 ± 154.1 | 108.7 ± 94.6 | 111.8 ± 183.9 | 0.164 |
| Vitamin E (mg) | 2.1 ± 1.6 | 2.4 ± 1.8 | 2.0 ± 1.5 | 0.328 |
| Sodium (g) | 2.5 ± 1.8 | 2.7 ± 2.4 | 2.3 ± 1.3 | 0.670 |
| Calcium (mg) | 906.5 ± 486.9 | 963.7 ± 535.4 | 864.3 ± 460.4 | 0.281 |
| Potassium (mg) | 2204.3 ± 1098.0 | 2303.4 ± 1084.7 | 2130.4 ± 1122.4 | 0.368 |
| Magnesium (mg) | 253.9 ± 134.2 | 281.2 ± 172.4 | 234.6 ± 103.0 | 0.488 |
| Phosphorus (mg) | 769.0 ± 521.8 | 834.7 ± 736.3 | 714.5 ± 327.2 | 0.749 |
| Selenium (mcg) | 37.6 ± 51.8 | 48.0 ± 81.7 | 31.1 ± 16.7 | 0.696 |
| Zinc (mg) | 7.4 ± 4.1 | 7.4 ± 4.7 | 7.4 ± 3.8 | 0.772 |
| Indicators | Total (n = 72) | Presence (n = 23) | Absence (n = 49) | p-Value |
|---|---|---|---|---|
| Energy (kcal/day) | 1939.4 ± 705.7 | 1963.7 ± 863.2 | 1928.1 ± 628.2 | 0.677 |
| Carbohydrates (g) | 243.3 ± 97.4 | 240.8 ± 78.2 | 244.5 ± 105.9 | 0.823 |
| Protein (g) | 81.1 ± 35.7 | 82.6 ± 47.3 | 80.4 ± 29.2 | 0.731 |
| Lipids (g) | 76.8 ± 37.8 | 75.1 ± 50.5 | 77.59 ± 29.2 | 0.319 |
| Vitamin A (mcg) | 984.1 ± 925.9 | 1181.2 ± 1142.7 | 891.5 ± 801.4 | 0.305 |
| Vitamin B1 (mg) | 1.4 ± 0.7 | 1.4 ± 0.7 | 1.4 ± 0.7 | 0.633 |
| Vitamin B2 (mg) | 1.6 ± 1.3 | 1.9 ± 1.9 | 1.5 ± 0.9 | 0.562 |
| Vitamin B3 (mg) | 17.8 ± 10.1 | 16.1 ± 7.1 | 18.6 ± 11.3 | 0.608 |
| Vitamin B5 (mg) | 3.0 ± 3.0 | 3.4 ± 3.9 | 2.9 ± 2.6 | 0.133 |
| Vitamin B6 (mg) | 1.5 ± 0.9 | 1.6 ± 0.7 | 1.5 ± 0.9 | 0.196 |
| Vitamin B9 (mcg) | 265.2 ± 195.7 | 299.6 ± 218.9 | 249.0 ± 184.1 | 0.401 |
| Vitamin B12 (mcg) | 4.0 ± 4.6 | 4.7 ± 6.0 | 3.8 ± 3.8 | 0.909 |
| Vitamin C (mg) | 110.5 ± 154.1 | 157.0 ± 236.1 | 88.6 ± 89.9 | 0.169 |
| Vitamin E (mg) | 2.1 ± 1.6 | 2.8 ± 1.9 | 1.8 ± 1.4 | 0.013 |
| Sodium (g) | 2.5 ± 1.8 | 2.6 ± 2.6 | 2.4 ± 1.3 | 0.254 |
| Calcium (mg) | 906.5 ± 486.9 | 1005.1 ± 633.1 | 860.2 ± 400.2 | 0.616 |
| Potassium (mg) | 2204.3 ± 1098.0 | 2423.6 ± 1194.5 | 2101.4 ± 1046.7 | 0.274 |
| Magnesium (mg) | 253.9 ± 134.2 | 243.6 ± 124.7 | 258.7 ± 139.3 | 0.566 |
| Phosphorus (mg) | 769.0 ± 521.8 | 904.8 ± 771.2 | 705.2 ± 342.2 | 0.401 |
| Selenium (mcg) | 37.6 ± 51.8 | 50.6 ± 88.6 | 31.4 ± 15.7 | 0.904 |
| Zinc (mg) | 7.4 ± 4.1 | 7.5 ± 5.0 | 7.4 ± 3.6 | 0.510 |
| Indicators | Total (n = 72) | Presence (n = 18) | Absence (n = 54) | p-Value |
|---|---|---|---|---|
| Energy (kcal/day) | 1939.4 ± 705.7 | 2018.9 ± 917.8 | 1913.0 ± 627.7 | 0.927 |
| Carbohydrates (g) | 243.3 ± 97.4 | 259.0 ± 114.7 | 238.1 ± 917.8 | 0.398 |
| Protein (g) | 81.1 ± 35.7 | 86.5 ± 51.7 | 79.3 ± 28.9 | 0.927 |
| Lipids (g) | 76.8 ± 37.8 | 79.6 ± 57.4 | 75.9 ± 29.2 | 0.558 |
| Vitamin A (mcg) | 984.1 ± 925.9 | 1435.8 ± 1240.4 | 833.5 ± 750.0 | 0.022 |
| Vitamin B1 (mg) | 1.4 ± 0.7 | 1.5 ± 0.6 | 1.3 ± 0.7 | 0.258 |
| Vitamin B2 (mg) | 1.6 ± 1.3 | 1.9 ± 2.1 | 1.6 ± 0.9 | 0.668 |
| Vitamin B3 (mg) | 17.8 ± 10.1 | 15.6 ± 6.1 | 18.5 ± 11.1 | 0.785 |
| Vitamin B5 (mg) | 3.0 ± 3.0 | 3.6 ± 4.5 | 2.8 ± 2.5 | 0.110 |
| Vitamin B6 (mg) | 1.5 ± 0.9 | 1.6 ± 0.6 | 1.5 ± 0.9 | 0.151 |
| Vitamin B9 (mcg) | 265.2 ± 195.7 | 288.2 ± 173.2 | 257.5 ± 203.6 | 0.180 |
| Vitamin B12 (mcg) | 4.0 ± 4.6 | 3.8 ± 3.8 | 4.1 ± 4.8 | 0.933 |
| Vitamin C (mg) | 110.5 ± 154.1 | 107.7 ± 103.9 | 111.4 ± 168.5 | 0.589 |
| Vitamin E (mg) | 2.1 ± 1.6 | 2.9 ± 1.8 | 1.9 ± 1.5 | 0.015 |
| Sodium (g) | 2.5 ± 1.8 | 2.8 ± 2.9 | 2.4 ± 1.3 | 0.668 |
| Calcium (mg) | 906.5 ± 486.9 | 951.5 ± 503.9 | 891.5 ± 485.1 | 0.413 |
| Potassium (mg) | 2204.3 ± 1098.0 | 2288.8 ± 900.8 | 2176.1 ± 1162.6 | 0.286 |
| Magnesium (mg) | 253.9 ± 134.2 | 257.8 ± 125.0 | 252.6 ± 138.2 | 0.682 |
| Phosphorus (mg) | 769.0 ± 521.8 | 862.8 ± 828.8 | 737.7 ± 374.6 | 0.917 |
| Selenium (mcg) | 37.6 ± 51.8 | 54.7 ± 98.5 | 31.9 ± 18.6 | 0.644 |
| Zinc (mg) | 7.4 ± 4.1 | 7.7 ± 5.5 | 7.4 ± 3.6 | 0.635 |
| Indicators | Total (n = 72) | Presence (n = 15) | Absence (n = 57) | p-Value |
|---|---|---|---|---|
| Energy (kcal/day) | 1939.4 ± 705.7 | 2037.3 ± 984.8 | 1913.7 ± 621.0 | 0.884 |
| Carbohydrates (g) | 243.3 ± 97.4 | 234.9 ± 58.3 | 245.5 ± 105.6 | 0.745 |
| Protein (g) | 81.1 ± 35.7 | 85.6 ± 55.7 | 79.9 ± 28.8 | 0.718 |
| Lipids (g) | 76.8 ± 37.8 | 80.9 ± 61.1 | 75.7 ± 29.5 | 0.519 |
| Vitamin A (mcg) | 984.1 ± 925.9 | 1348.7 ± 1188.6 | 888.1 ± 829.9 | 0.095 |
| Vitamin B1 (mg) | 1.4 ± 0.7 | 1.4 ± 0.7 | 1.4 ± 0.7 | 0.862 |
| Vitamin B2 (mg) | 1.6 ± 1.3 | 1.9 ± 12.3 | 1.6 ± 0.9 | 0.693 |
| Vitamin B3 (mg) | 17.8 ± 10.1 | 15.9 ± 6.3 | 18.3 ± 10.9 | 0.683 |
| Vitamin B5 (mg) | 3.0 ± 3.0 | 3.6 ± 5.0 | 2.9 ± 2.4 | 0.983 |
| Vitamin B6 (mg) | 1.5 ± 0.9 | 1.5 ± 0.7 | 1.5 ± 0.9 | 0.698 |
| Vitamin B9 (mcg) | 265.2 ± 195.7 | 263.1 ± 199.7 | 265.7 ± 196.5 | 0.983 |
| Vitamin B12 (mcg) | 4.0 ± 4.6 | 4.0 ± 4.1 | 4.0 ± 4.8 | 0.906 |
| Vitamin C (mg) | 110.5 ± 154.1 | 106.0 ± 108.7 | 111.6 ± 164.8 | 0.835 |
| Vitamin E (mg) | 2.1 ± 1.6 | 2.6 ± 2.1 | 2.0 ± 1.4 | 0.454 |
| Sodium (g) | 2.5 ± 1.8 | 3.1 ± 3.1 | 2.3 ± 1.3 | 0.755 |
| Calcium (mg) | 906.5 ± 486.9 | 929.4 ± 562.5 | 900.5 ± 470.5 | 0.906 |
| Potassium (mg) | 2204.3 ± 1098.0 | 2216.5 ± 1005.5 | 2101.1 ± 1129.5 | 0.766 |
| Magnesium (mg) | 253.9 ± 134.2 | 249.5 ± 135.0 | 255.0 ± 135.1 | 0.890 |
| Phosphorus (mg) | 769.0 ± 521.8 | 878.8 ± 919.4 | 740.1 ± 360.2 | 0.808 |
| Selenium (mcg) | 37.6 ± 51.8 | 54.4 ± 108.6 | 33.2 ± 18.8 | 0.401 |
| Zinc (mg) | 7.4 ± 4.1 | 7.3 ± 5.7 | 7.5 ± 3.6 | 0.270 |
| Indicators | Total (100%, n = 72) | Tertile 1 <2.62 ng/dL (n = 24) | Tertile 2 >2.62–<4.08 ng/dL (n = 24) | Tertile 3 >4.08 ng/dL (n = 24) | p-Value |
|---|---|---|---|---|---|
| Energy (kcal/day) | 1939.4 ± 705.7 | 2107.6 ± 938.0 | 1841.6 ± 566.4 | 1869.1 ± 540.2 | 0.806 |
| Carbohydrates (g) | 243.3 ± 97.4 | 258.2 ± 99.9 | 221.4 ± 61.8 | 250.4 ± 121.1 | 0.624 |
| Protein (g) | 81.1 ± 35.7 | 89.8 ± 55.3 | 078.7 ± 20.6 | 74.7 ± 18.0 | 0.683 |
| Lipids (g) | 76.8 ± 37.8 | 83.6 ± 51.6 | 71.2 ± 30.7 | 75.6 ± 26.8 | 0.690 |
| Vitamin A (mcg) | 984.1 ± 925.9 | 1110.9 ± 1138.4 | 904.7 ± 813.9 | 936.5 ± 813.8 | 0.912 |
| Vitamin B1 (mg) | 1.4 ± 0.7 | 1.5 ± 0.9 | 1.3 ± 0.5 | 1.2 ± 0.7 | 0.623 |
| Vitamin B2 (mg) | 1.6 ± 1.3 | 2.1 ± 2.1 | 1.4 ± 0.7 | 1.4 ± 0.5 | 0.544 |
| Vitamin B3 (mg) | 17.8 ± 10.1 | 20.1 ± 13.8 | 17.8 ± 7.5 | 15.5 ± 7.6 | 0.257 |
| Vitamin B5 (mg) | 3.0 ± 3.1 | 3.5 ± 4.2 | 2.8 ± 2.3 | 2.8 ± 2.5 | 0.879 |
| Vitamin B6 (mg) | 1.5 ± 0.9 | 1.7 ± 1.1 | 1.5 ± 0.7 | 1.4 ± 0.8 | 0.457 |
| Vitamin B9 (mcg) | 265.2 ± 195.7 | 285.6 ± 220.2 | 247.8 ± 139.7 | 262.3 ± 222.5 | 0.870 |
| Vitamin B12 (mcg) | 4.0 ± 4.6 | 5.9 ± 7.3 | 3.0 ± 1.7 | 3.2 ± 2.0 | 0.486 |
| Vitamin C (mg) | 110.5 ± 154.2 | 109.2 ± 79.3 | 85.5 ± 85.4 | 136.7 ± 241.7 | 0.451 |
| Vitamin E (mg) | 2.1 ± 1.6 | 2.3 ± 1.7 | 2.0 ± 1.7 | 201 ± 1.5 | 0.775 |
| Sodium (g) | 2.5 ± 1.8 | 3.1 ± 2.6 | 2.3 ± 1.3 | 2.1 ± 1.8 | 0.446 |
| Calcium (mg) | 906.5 ± 486.9 | 1063.2 ± 676.3 | 779.8 ± 364.8 | 876.5 ± 313.2 | 0.237 |
| Potassium (mg) | 2204.3 ± 1098.0 | 2403.7 ± 1384.7 | 2030.4 ± 559.5 | 2178.8 ± 1190.6 | 0.863 |
| Magnesium (mg) | 253.8 ± 134.2 | 236.3 ± 112.5 | 283.5 ± 131.6 | 241.8 ± 155.6 | 0.248 |
| Phosphorus (mg) | 769.0 ± 521.8 | 931.6 ± 804.5 | 740.5 ± 342.7 | 634.8 ± 168.4 | 0.763 |
| Selenium (mcg) | 37.6 ± 51.8 | 47.5 ± 87.5 | 31.6 ± 14.6 | 33.7 ± 15.8 | 0.632 |
| Zinc (mg) | 7.4 ± 4.1 | 8.1 ± 6.0 | 7.0 ± 2.6 | 7.2 ± 2.8 | 0.637 |
| Indicators | Presence | Absence | p-Value |
|---|---|---|---|
| Insulin resistance | 2.83 ± 3.1 (n = 27) | 2.34 ± 3.3 (n = 45) | 0.403 |
| hypoalphalipoproteinemia | 2.21 ± 3.2 (n = 23) | 2.67 ± 3.2 (n = 49) | 0.208 |
| Overweight and obesity | 3.14 ± 3.6 (n = 19) | 2.38 ± 3.1 (n = 47) | 0.575 |
| Abdominal obesity | 3.10 ± 3.7 (n = 18) | 2.30 ± 3.0 (n = 54) | 0.527 |
| Risk (waist–height) | 3.58 ± 3.9 (n = 15) | 2.24 ± 2.9 (n = 57) | 0.291 |
| Risk (waist–hip) | 1.0 ± 1.3 (n = 2) | 2.57 ± 3.2 (n = 70) | 0.230 |
References
- Sarma, S.; Sanjeev, S.; Satya, D. Obesity as a multisystem disease: Trends in obesity rates and obesity-related complications. Diabetes Obes. Metab. 2019, 23, 3–16. [Google Scholar] [CrossRef] [PubMed]
- Kern, L.; Mittenbühler, M.J.; Vesting, A.J.; Ostermann, A.L.; Wunderlich, C.M.; Wunderlich, F.T. Obesity-induced TNFα and IL-6 signaling: The missing link between obesity and inflammation—driven liver and colorectal cancers. Cancers 2019, 11, 24. [Google Scholar] [CrossRef] [Green Version]
- Febriza, A.; Ridwan, R.; As’ad, S.; Kasim, V.N.; Idrus, H.H. Adiponectin and Its Role in Inflammatory Process of Obesity. Mol. Cell. Biomed. Sci. 2019, 3, 60. [Google Scholar] [CrossRef]
- Werida, R.H.; El-Gharbawy, N.M.; Mostafa, T.M. Circulating il-6, clusterin and irisin in obese subjects with different grades of obesity: Association with insulin resistance and sexual dimorphism. Arch. Endocrinol. Metab. 2021, 65, 126–136. [Google Scholar] [CrossRef] [PubMed]
- Grant, R.W.; Dixit, V.D. Adipose tissue as an immunological organ. Obesity 2015, 23, 512–518. [Google Scholar] [CrossRef] [Green Version]
- Ouchi, N.; Parker, J.L.; Lugus, J.J.; Walsh, K. Adipokines in inflammation and metabolic disease. Nat. Rev. Immunol. 2011, 11, 85–97. [Google Scholar] [CrossRef] [PubMed]
- Battineni, G.; Sagaro, G.G.; Chintalapudi, N.; Amenta, F.; Tomassoni, D.; Tayebati, S.K. Impact of Obesity-Induced Inflammation on Cardiovascular Diseases (CVD). Int. J. Mol. Sci. 2021, 22, 4798. [Google Scholar] [CrossRef]
- Ayelign, B.; Negash, M.; Andualem, H.; Wondemagegn, T.; Kassa, E.; Shibabaw, T.; Akalu, Y.; Molla, M.D. Association of IL-10 (−1082 A/G) and IL-6 (−174 G/C) gene polymorphism with type 2 diabetes mellitus in Ethiopia population. BMC Endocr. Disord. 2021, 21, 4–11. [Google Scholar] [CrossRef]
- Al-Shukaili, A.; Al-Ghafri, S.; Al-Marhoobi, S.; Al-Abri, S.; Al-Lawati, J.; Al-Maskari, M. Analysis of inflammatory mediators in type 2 diabetes patients. Int. J. Endocrinol. 2013, 2013, 8–10. [Google Scholar] [CrossRef] [Green Version]
- Wueest, S.; Seelig, E.; Timper, K.; Lyngbaek, M.P.; Karstoft, K.; Donath, M.Y.; Ellingsgaard, H.; Konrad, D. Il-6 receptor blockade increases circulating adiponectin levels in people with obesity: An explanatory analysis. Metabolites 2021, 11, 79. [Google Scholar] [CrossRef]
- Yang, W.; Yuan, W.; Peng, X.; Wang, M.; Xiao, J.; Wu, C.; Luo, L. PPAR γ/Nnat/NF-κ B Axis Involved in Promoting Effects of Adiponectin on Preadipocyte Differentiation. Mediat. Inflamm. 2019, 2019, 5618023. [Google Scholar] [CrossRef] [Green Version]
- Christen, T.; de Mutsert, R.; Lamb, H.J.; van Dijk, K.W.; le Cessie, S.; Rosendaal, F.R.; Jukema, J.W.; Trompet, S. Mendelian randomization study of the relation between adiponectin and heart function, unravelling the paradox. Peptides 2021, 146, 170664. [Google Scholar] [CrossRef] [PubMed]
- Gariballa, S.; Alkaabi, J.; Yasin, J.; Al Essa, A. Total adiponectin in overweight and obese subjects and its response to visceral fat loss. BMC Endocr. Disord. 2019, 19, 55. [Google Scholar] [CrossRef] [PubMed]
- Attar, M.J.H.; Mohammadi, S.; Karimi, M.; Hosseinnezhad, A.; Hosseini, S.H.; Eshraghian, M.R.; Jafari, N.; Rahmani, M.; Karimi, F.; Nezhad, M.K. Association of adiponectin with dietary factors and cardiovascular risk factors in type 2 diabetes mellitus patients. Diabetes Metab. Syndr. Clin. Res. Rev. 2013, 7, 3–7. [Google Scholar] [CrossRef]
- Khoramipour, K.; Chamari, K.; Hekmatikar, A.A.; Ziyaiyan, A.; Taherkhani, S.; Elguindy, N.M.; Bragazzi, N.L. Adipoectin: Structure, physiological funtions, role in diseases, and effects of nutrition. Nutrients 2021, 13, 180. [Google Scholar] [CrossRef]
- Ruan, H.; Dong, L.Q. Adiponectin signaling and function in insulin target tissues. J. Mol. Cell Biol. 2016, 8, 101–109. [Google Scholar] [CrossRef] [Green Version]
- Monda, V.; Polito, R.; Lovino, A.; Finaldi, A.; Valenzano, A.; Nigro, E.; Corso, G.; Sessa, F.; Asmundo, A.; Di Nunno, N.; et al. Short-Term Physiological Effects of a Very Low-Calorie Ketogenic Diet: Effects on Adiponectin Levels and Inflammatory States. Int. J. Mol. Sci. 2020, 21, 3228. [Google Scholar] [CrossRef]
- Yamauchi, T.; Iwabu, M.; Okada-Iwabu, M.; Kadowaki, T. Adiponectin receptors: A review of their structure, function and how they work. Best Pract. Res. Clin. Endocrinol. Metab. 2014, 28, 15–23. [Google Scholar] [CrossRef] [PubMed]
- Sureda, A.; del Mar Bibiloni, M.; Julibert, A.; Bouzas, C.; Argelich, E.; Llompart, I.; Pons, A.; Tur, J.A. Adherence to the mediterranean diet and inflammatory markers. Nutrients 2018, 10, 62. [Google Scholar] [CrossRef] [Green Version]
- Janiszewska, J.; Ostrowska, J.; Szostak-Węgierek, D. The influence of nutrition on adiponectin—A narrative review. Nutrients 2021, 13, 1394. [Google Scholar] [CrossRef]
- Wang, Y.; Wang, X.; Guo, Y.; Bian, Y.; Bai, R.; Liang, B.; Xiao, C. Effect of adiponectin on macrophage reverse cholesterol transport in adiponectin-/-mice and its mechanism. Exp. Ther. Med. 2017, 13, 2757–2762. [Google Scholar] [CrossRef] [PubMed] [Green Version]
- De Piero, A.; Bassett, N.; Rossi, A.; Sammán, N. Tendencia en el consumo de alimentos de estudiantes universitarios. Nutr. Hosp. 2015, 31, 1824–1831. [Google Scholar] [CrossRef] [PubMed]
- Nieto, C.I.R.; Pérez, J.D.M.; Freire, L.M.; de Paula Morales, K.R.; Romero, C.V.E. Prevalencia de síndrome metabólico y factores de riesgo asociados en jóvenes universitarios ecuatorianos. Nutr. Hosp. 2015, 31, 1574–1581. [Google Scholar] [CrossRef]
- Wright, C.S.; Zhou, J.; Sayer, R.D.; Kim, J.E.; Campbell, W.W. Effects of a high-protein diet including whole eggs on muscle composition and indices of cardiometabolic health and systemic inflammation in older adults with overweight or obesity: A randomized controlled trial. Nutrients 2018, 10, 946. [Google Scholar] [CrossRef] [PubMed] [Green Version]
- Doyle, T.A.; de Groot, M.; Harris, T.; Schwartz, F.; Strotmeyer, E.S.; Johnson, K.C.; Kanaya, A. Diabetes, depressive symptoms, and inflammation in older adults: Results from the Health, Aging, and Body Composition Study. J. Psychosom. Res. 2013, 75, 419–424. [Google Scholar] [CrossRef] [Green Version]
- Anderson, A.L.; Harris, T.B.; Tylavsky, F.A.; Perry, S.E.; Houston, D.K.; Lee, J.S.; Kanaya, A.M.; Sahyoun, N.R. Dietary patterns, insulin sensitivity and inflammation in older adults. Eur. J. Clin. Nutr. 2012, 66, 18–24. [Google Scholar] [CrossRef] [Green Version]
- Furman, D.; Campisi, J.; Verdin, E.; Carrera-Bastos, P.; Targ, S.; Franceschi, C.; Ferrucci, L.; Gilroy, D.W.; Fasano, A.; Miller, G.W.; et al. Chronic inflammation in the etiology of disease across the life span. Nat. Med. 2019, 25, 1822–1832. [Google Scholar] [CrossRef]
- Comité Consultivo Nacional de Normalización de Innovación, Desarrollo, Tecnologías e Información en Salud. DOF-Diario Oficial de La Federación. Available online: http://dof.gob.mx/nota_detalle_popup.php?codigo=5272787 (accessed on 1 November 2021).
- World Medical Association. World Medical Association Declaration of Helsinki: Ethical principles for medical research involving human subjects. JAMA 2013, 310, 2119–2194. [Google Scholar] [CrossRef] [Green Version]
- Stewart, A.; Marfell-Jones, M.; Olds, T.; Ridder, D.H. ISAK: International Standards for Anthropometric Assessment; Lower Hutt, N., Ed.; International Society for Advancement of Kinanthropometry: Brasilia, Brazil, 2011. [Google Scholar]
- Salvador Castell, G.; Serra Majem, L.; Ribas-Barba, L. ¿Qué y cuánto comemos? El método Recuerdo de 24 horas. Rev. Esp. Nutr. Comunitaria. 2015, 21, 42–44. [Google Scholar] [CrossRef]
- Matthews, D.R.; Hosker, J.P.; Rudenski, A.S.; Naylor, B.A.; Treacher, D.F.; Turner, R.C. Homeostasis model assessment: Insulin resistance and β-cell function from fasting plasma glucose and insulin concentrations in man. Diabetologia 1985, 28, 412–419. [Google Scholar] [CrossRef] [Green Version]
- Cleeman, J.I.; Grundy, S.M.; Becker, D.; Clark, L. Expert panel on detection evaluation and treatment of high blood cholesterol in adults Executive summary of the third report (NCEP)-adult treatment panel III. J. Am. Med. Assoc. 2001, 285, 2486–2497. [Google Scholar]
- Centers for Disease Control and Prevention Acerca del Índice de Masa Corporal Para Adultos. Available online: https://www.cdc.gov/healthyweight/spanish/assessing/bmi/adult_bmi/index.html (accessed on 1 November 2021).
- Gallagher, D.; Heymsfield, S.B.; Heo, M.; Jebb, S.A.; Murgatroyd, P.R.; Sakamoto, Y. Healthy percentage body fat ranges: An approach for developing guidelines based on body mass index. Am. J. Clin. Nutr. 2000, 72, 694–701. [Google Scholar] [CrossRef]
- World Health Organization. Waist Circumference and Waist–Hip Ratio. Report of a WHO Expert Consultation; World Health Organization: Geneva, Switzerland, 2008; Available online: https://apps.who.int/iris/bitstream/handle/10665/44583/?sequence=1 (accessed on 1 November 2021).
- Rangel-Baltazar, E.; Rodríguez-Ramírez, S.; Cuevas-Nasu, L.; Shamah-Levy, T.; Méndez-Gómez-Humarán, I.; Rivera, J.A. Association between high waist-to-height ratio and cardiovascular risk among adults sampled by the 2016 Half-Way National Health and Nutrition Survey in Mexico (ENSANUT MC 2016). Nutrients 2019, 11, 1402. [Google Scholar] [CrossRef] [Green Version]
- Rodriguez, H.B.; Casanueva, E.; Rosado, J. Recomendaciones de Ingestión de Nutrimentos Para la Población Mexicana; Editorial Medica panamericana: México City, México, 2005; Volume 1, ISBN 968-7988-58-4. [Google Scholar]
- Zamora-Gasga, V.M.; Montalvo-González, E.; Loarca-Piña, G.; Vázquez-Landaverde, P.A.; Tovar, J.; Sáyago-Ayerdi, S.G. Microbial metabolites profile during in vitro human colonic fermentation of breakfast menus consumed by Mexican school children. Food Res. Int. 2017, 97, 7–14. [Google Scholar] [CrossRef]
- Secretaría de Salud; Instituto Nacional de Salud Pública; Instituto Nacional de Estadística y Geografía. Encuesta Nacional de Salud y Nutrición 2018. Available online: http://ensanut.insp.mx/encuestas/ensanut2018/informes.php (accessed on 1 November 2021).
- Barbosa, J.B.; dos Santos, A.M.; Barbosa, M.M.; Barbosa, M.M.; de Carvalho, C.A.; Fonseca, P.C.D.A.; Fonseca, J.M.; Barbosa, M.D.C.L.; Bogea, E.G.; da Silva, A.A.M. Síndrome metabólica, resistência insulínica e outros fatores de risco cardiovascular em universitários. Cienc. e Saude Coletiva 2016, 21, 1123–1136. [Google Scholar] [CrossRef] [Green Version]
- Morales, G.; Guillen-Grima, F.; Muñoz, S.; Belmar, C.; Schifferli, I.; Muñoz, A.; Soto, A. Cardiovascular risk factors among first and third year university students. Rev. Med. Chil. 2017, 145, 299–308. [Google Scholar] [CrossRef] [Green Version]
- Caldera-Montes, J.F.; Reynoso-González, O.U.; Nuño-Camarena, D.; Caldera-Zamora, I.A.; Pérez-Púlido, I.; Gómez-Álvarez, C.A. Insatisfacción con la imagen corporal y personalidad en estudiantes de bachillerato de la región Altos Sur de Jalisco, México. Duazary 2019, 16, 93. [Google Scholar] [CrossRef]
- Koekkoek, W.A.C.; Van Zanten, A.R.H. Antioxidant Vitamins and Trace Elements in Critical Illness. Nutr. Clin. Pract. 2016, 31, 457–474. [Google Scholar] [CrossRef] [PubMed]
- Dubey, P.; Thakur, V.; Chattopadhyay, M. Role of minerals and trace elements in diabetes and insulin resistance. Nutrients 2020, 12, 1864. [Google Scholar] [CrossRef] [PubMed]
- Tilg, H.; Moschen, A.R. Adipocytokines: Mediators linking adipose tissue, inflammation and immunity. Nat. Rev. Immunol. 2006, 6, 772–783. [Google Scholar] [CrossRef] [PubMed]
- Achari, A.E.; Jain, S.K. Adiponectin, a therapeutic target for obesity, diabetes, and endothelial dysfunction. Int. J. Mol. Sci. 2017, 18, 1321. [Google Scholar] [CrossRef] [Green Version]
- Jung, U.J.; Choi, M.S. Obesity and its metabolic complications: The role of adipokines and the relationship between obesity, inflammation, insulin resistance, dyslipidemia and nonalcoholic fatty liver disease. Int. J. Mol. Sci. 2014, 15, 6184–6223. [Google Scholar] [CrossRef] [Green Version]
- World Health Organization. Alimentación Sana; World Health Organization: Geneva, Switzerland; Available online: https://www.who.int/es/news-room/fact-sheets/detail/healthy-diet (accessed on 1 November 2021).
- Thorpe, M.G.; Milte, C.M.; Crawford, D.; McNaughton, S.A. A comparision of the dietary patterns derived by principal component analysis and cluster analysis in older Australians. Int. J. Behav. Nutr. Phys. Act. 2016, 13, 30. [Google Scholar] [CrossRef] [Green Version]
- Newbern, D.; Gumus, P.B.; Balikcioglu, M.; Bain, J.; Muehlbauer, M.; Stevens, R.; Ilkayeva, O.; Dolinsky, D.; Armstrong, S.; Irizarry, K.; et al. Sex differences in biomarkers associated with insulin resistance in obese adolescents: Metabolomic profiling and principal components analysis. J. Clin. Endocrinol. Metab. 2014, 99, 4730–4739. [Google Scholar] [CrossRef]
- González Sandoval, C.E.; Díaz Burke, Y.; Mendizabal-Ruiz, A.P.; Medina Díaz, E.; Alejandro Morales, J. Prevalencia de obesidad y perfil lipídico alterado en jóvenes universitarios. Nutr. Hosp. 2014, 29, 315–321. [Google Scholar] [CrossRef]
- Beaudry, K.M.; Ludwa, I.A.; Thomas, A.M.; Ward, W.E.; Falk, B.; Josse, A.R. First-year university is associated with greater body weight, body composition and adverse dietary changes in males than females. PLoS ONE 2019, 14, e0218554. [Google Scholar] [CrossRef] [Green Version]
- Sparrenberger, K.; Sbaraini, M.; Cureau, F.V.; Teló, G.H.; Bahia, L.; Schaan, B.D. Higher adiponectin concentrations are associated with reduced metabolic syndrome risk independently of weight status in Brazilian adolescents. Diabetol. Metab. Syndr. 2019, 11, 1–9. [Google Scholar] [CrossRef] [PubMed]
- Hafiane, A.; Gasbarrino, K.; Daskalopoulou, S.S. The role of adiponectin in cholesterol efflux and HDL biogenesis and metabolism. Metabolism. 2019, 100, 1–11. [Google Scholar] [CrossRef]
- Rye, K.A.; Barter, P.J. Regulation of high-density lipoprotein metabolism. Circ. Res. 2014, 114, 143–156. [Google Scholar] [CrossRef] [PubMed] [Green Version]
- Maranhão, R.C.; Casela Filho, A.; Sigal, G.A.; Chagas, A.C.P.; da Luz, P.L. HDL and Endothelium. Endothel. Cardiovasc. Dis. Vasc. Biol. Clin. Syndr. 2018, 297–317. [Google Scholar] [CrossRef]
- Carvalho-Rassbach, M.; Alvarez-Leite, J.I.; de Fátima Haueisen Sander Diniz, M. Is the association between vitamin D, adiponectin, and insulin resistance present in normal weight or obese? A pilot study. Clin. Nutr. Exp. 2019, 23, 80–88. [Google Scholar] [CrossRef] [Green Version]
- Fernández Soto, G.; Romero-Adrian, T.; Troya Ortiz, E.; Arráiz de Fernandez, C. La Adiponectina, una adipocina del tejido adiposo clave en la obesidad durante la adolescencia. Enfermería Investig. Investig. Vinculación, Docencia y Gestión 2016, 1, 169–175. [Google Scholar]
- Guyenet, S.J. Impact of whole, fresh fruit consumption on energy intake and adiposity: A systematic review. Front. Nutr. 2019, 6, 66. [Google Scholar] [CrossRef] [Green Version]
- Yu, Z.M.; DeClercq, V.; Cui, Y.; Forbes, C.; Grandy, S.; Keats, M.; Parker, L.; Sweeney, E.; Dummer, T.J.B. Fruit and vegetable intake and body adiposity among populations in Eastern Canada: The Atlantic Partnership for Tomorrow’s Health Study. BMJ Open 2018, 8, 1–10. [Google Scholar] [CrossRef] [Green Version]
- Sharma, S.P.; Chung, H.J.; Kim, H.J.; Hong, S.T. Paradoxical effects of fruit on obesity. Nutrients 2016, 8, 633. [Google Scholar] [CrossRef] [PubMed]
- Paes-Silva, R.P.; Gadelha, P.C.F.P.; Lemos, M.D.C.C.D.; De Castro, C.M.M.B.; De Arruda, I.K.G.; Diniz, A.D.S. Adiposity, inflammation and fat-soluble vitamins in adolescents. J. Pediatr. 2019, 95, 575–583. [Google Scholar] [CrossRef] [PubMed]
- Rebello, C.J.; Greenway, F.L.; Finley, J.W. A review of the nutritional value of legumes and their effects on obesity and its related co-morbidities. Obes. Rev. 2014, 15, 392–407. [Google Scholar] [CrossRef]
- Alizadeh, M.; Gharaaghaji, R.; Gargari, B.P. The effects of legumes on metabolic features, insulin resistance and hepatic function tests in women with central obesity: A randomized controlled trial. Int. J. Prev. Med. 2014, 5, 710–720. [Google Scholar]
- Dhillon, P.K.; Bowen, L.; Kinra, S.; Bharathi, A.V.; Agrawal, S.; Prabhakaran, D.; Reddy, K.S.; Ebrahim, S.; Patel, T.; Ramakrishnan, L.; et al. Legume consumption and its association with fasting glucose, insulin resistance and type 2 diabetes in the Indian Migration Study. Public Health Nutr. 2016, 19, 3017–3026. [Google Scholar] [CrossRef] [PubMed] [Green Version]
- Han, M.S.; White, A.; Perry, R.J.; Camporez, J.P.; Hidalgo, J.; Shulman, G.I.; Davis, R.J. Regulation of adipose tissue inflammation by interleukin 6. Proc. Natl. Acad. Sci. USA 2020, 117, 2751–2760. [Google Scholar] [CrossRef] [Green Version]
- Shivappa, N. Diet and chronic diseases: Is there a mediating effect of inflammation? Nutrients 2019, 11, 1639. [Google Scholar] [CrossRef] [PubMed] [Green Version]


| Indicators | Total Intake (n = 72) | Men (n = 14) | Women (n = 58) | RDI |
|---|---|---|---|---|
| Vitamin A (mcg) | 984.1 ± 925.9 | 820.3 ± 811.2 a | 1023.6 ± 953.7 | >900 |
| Vitamin B1 (mg) | 1.4 ± 0.7 | 1.5 ± 1.0 | 1.3 ± 0.6 | >1 M y >0.9 W |
| Vitamin B2 (mg) | 1.6 ± 1.3 | 1.8 ± 1.5 | 1.6 ± 1.3 | >1 M y >0.9 W |
| Vitamin B3 (mg) | 17.8 ± 10.1 | 22.0 ± 16.9 | 16.8 ± 7.5 | >13 M y >12 W |
| Vitamin B5 (mg) | 3.0 ± 3.0 | 2.7 ± 2.4 a | 3.1 ± 3.2 a | >5.5 |
| Vitamin B6 (mg) | 1.5 ± 0.9 | 1.7 ± 1.3 | 1.5 ± 0.8 | >1.1 |
| Vitamin B9 (mcg) | 265.2 ± 195.7 | 254.2 ± 226.3 | 267.8 ± 189.8 | >190 |
| Vitamin B12 (mcg) | 4.0 ± 4.6 | 5.1 ± 6.3 | 3.8 ± 4.1 | >2.5 |
| Vitamin C (mg) | 110.5 ± 154.1 | 99.8 ± 68.0 | 113.0 ± 168.9 | >84 M y >70 W |
| Vitamin E (mg) | 2.1 ± 1.6 | 1.7 ± 1.6 a | 2.2 ± 1.6 a | >15 |
| Sodium (g) | 2.5 ± 1.8 | 2.7 ± 1.6 b | 2.4 ± 1.9 b | <1.6 |
| Calcium (mg) | 906.5 ± 486.9 | 1055.5 ± 696.9 | 870.5 ± 421.7 a | >1000 |
| Potassium (mg) | 2204.3 ± 1098.0 | 2563.9 ± 1505.1 a | 2117.5 ± 927.4 a | >3500 |
| Magnesium (mg) | 253.9 ± 134.2 | 238.1 ± 103.9 a | 257.7 ± 141.0 | >320 M and >250 W |
| Phosphorus (mg) | 769.0 ± 521.8 | 810.6 ± 556.0 a | 759.0 ± 517.7 a | >1000 |
| Selenium (mcg) | 37.6 ± 51.8 | 31.6 ± 19.1 a | 39.0 ± 57.0 a | >48 |
| Zinc (mg) | 7.4 ± 4.1 | 8.0 ± 5.4 a | 7.3 ± 3.8 a | >12 |
| Food Group | Total (n = 72) | Presence (n = 27) | Absence (n = 45) | p-Value |
|---|---|---|---|---|
| Fruit | 1.59 | 1.70 | 1.54 | 0.253 |
| Vegetables | 2.79 | 2.12 | 3.18 | 0.722 |
| Legumes | 0.68 | 1.11 | 0.43 | 0.031 |
| Cereals | 8.71 | 9.19 | 8.45 | 0.193 |
| Meats | 6.09 | 5.76 | 6.23 | 0.142 |
| Dairy | 0.97 | 0.80 | 1.06 | 0.400 |
| Fats | 3.43 | 3.72 | 3.27 | 0.368 |
| Sugars | 3.20 | 2.58 | 3.42 | 0.674 |
| Food Group | Total (n = 72) | Presence (n = 23) | Absence (n = 49) | p-Value |
|---|---|---|---|---|
| Fruit | 1.59 | 2.54 | 1.15 | 0.006 |
| Vegetables | 2.79 | 3.95 | 2.24 | 0.866 |
| Legumes | 0.68 | 0.67 | 0.68 | 0.229 |
| Cereals | 8.71 | 8.29 | 8.92 | 0.837 |
| Meats | 6.09 | 6.28 | 5.99 | 0.740 |
| Dairy | 0.97 | 0.93 | 0.99 | 0.758 |
| Fats | 3.43 | 3.30 | 3.50 | 0.933 |
| Sugars | 3.20 | 3.00 | 3.29 | 0.616 |
| Food Group | Total (n = 72) | Presence (n = 18) | Absence (n = 54) | p-Value |
|---|---|---|---|---|
| Fruit | 1.59 | 1.84 | 1.51 | 0.128 |
| Vegetables | 2.79 | 4.73 | 2.13 | 0.198 |
| Legumes | 0.68 | 0.90 | 0.61 | 0.072 |
| Cereals | 8.71 | 8.40 | 8.82 | 0.998 |
| Meats | 6.09 | 6.79 | 5.85 | 0.979 |
| Dairy | 0.97 | 0.99 | 0.97 | 0.486 |
| Fats | 3.43 | 3.26 | 3.49 | 0.580 |
| Sugars | 3.20 | 2.70 | 3.36 | 0.820 |
| Indicators | Total Sample (100%, n = 72) | Tertile 1 <2.62 ng/dL (n = 24) | Tertile 2 >2.62–< 4.08 ng/dL (n = 24) | Tertile 3 >4.08 ng/dL (n = 24) | p-Value |
|---|---|---|---|---|---|
| Weight (kg) 1 | 63.3 ± 13.8 | 69.2 ± 15.5 | 60.4 ± 14.4 | 60.3 ± 11.8 | 0.037 a,b |
| BMI (kg/m2) 2 | 23.4 ± 4.2 | 24.9 ± 4.8 | 22.4 ± 4.1 | 22.9 ± 3.4 | 0.206 |
| Waist perimeter (cm) 2 | 75.0 ± 10.3 | 79.5 ± 9.3 | 73.1 ± 9.8 | 72.5 ± 10.6 | 0.009 a,c |
| Body fat mass (%) 1 | 26.1 ± 9.8 | 26.8 ± 10.3 | 24.5 ± 11.0 | 26.9 ± 8.0 | 0.633 |
| Glucose (mg/dL) 1 | 90.1 ± 5.9 | 90.8 ± 6.3 | 90.5 ± 6.5 | 89.0 ± 4.9 | 0.556 |
| Cholesterol (mg/dL) 1 | 156.2 ± 27.2 | 151.6 ± 26.0 | 154.8 ± 22.2 | 162.2 ± 32.5 | 0.556 |
| HDL-c (mg/dL) 1 | 55.7 ± 13.4 | 48.5 ± 10.3 | 56.1 ± 12.4 | 62.7 ± 13.8 | 0.001 a |
| LDL-c (mg/dL) 2 | 85.5 ± 21.2 | 85.5 ± 23.3 | 85.2 ± 17.6 | 85.8 ± 23.2 | 0.956 |
| VLDL-c (mg/dL) 2 | 14.9 ± 6.6 | 17.6 ± 7.2 | 13.5 ± 5.3 | 13.7 ± 6.6 | 0.026 a,c |
| Triglycerides (mg/dL) 2 | 74.7 ± 33.1 | 88.0 ± 36.2 | 67.7 ± 26.6 | 68.4 ± 33.0 | 0.026 a,c |
| Insulin (µUI/mL) 2 | 13.2 ± 8.9 | 17.6 ± 13.4 | 10.8 ± 3.2 | 11.3 ± 5.1 | 0.038 a,c |
| Indicators | Total Sample (n = 72) | Tertile 1 <1.53 pg/mL (n = 24) | Tertile 2 >1.53–<2.50 pg/mL (n = 24) | Tertile 3 >2.50 pg/mL (n = 24) | p-Value |
|---|---|---|---|---|---|
| Energy (kcal/day) | 1939.4 ± 705.7 | 2068.1 ± 614.6 | 1933.4 ± 687.6 | 1816.8 ± 808.5 | 0.179 |
| Carbohydrates (g) | 243.3 ± 97.4 | 255.2 ± 82.9 | 266.3 ± 126.6 | 208.4 ± 66.2 | 0.131 |
| Protein (g) | 81.1 ± 35.7 | 86.1 ± 34.6 | 76.1 ± 23.8 | 81.1 ± 46.0 | 0.405 |
| Lipids (g) | 76.8 ± 37.8 | 80.0 ± 27.3 | 74.7 ± 32.0 | 75.7 ± 51.2 | 0.345 |
| Vitamin A (mcg) | 984.1 ± 925.9 | 975.9 ± 817.5 | 1109.1 ± 1057.3 | 885.2 ± 912.7 | 0.839 |
| Vitamin B1 (mg) | 1.4 ± 0.7 | 154 ± 0.8 | 1.4 ± 0.8 | 1.2 ± 0.5 | 0.406 |
| Vitamin B2 (mg) | 1.6 ± 1.3 | 1.8 ± 0.7 | 1.6 ± 1.1 | 1.6 ± 1.9 | 0.029 a,b |
| Vitamin B3 (mg) | 17.8 ± 10.1 | 19.2 ± 13.9 | 18.0 ± 9.5 | 16.2 ± 5.2 | 0.951 |
| Vitamin B5 (mg) | 3.0 ± 3.0 | 3.2 ± 2.3 | 2.6 ± 2.0 | 3.3 ± 4.4 | 0.123 |
| Vitamin B6 (mg) | 1.5 ± 0.9 | 1.8 ± 1.1 | 1.5 ± 0.9 | 1.3 ± 0.6 | 0.152 |
| Vitamin B9 (mcg) | 265.2 ± 195.7 | 321.3 ± 245.6 | 261.6 ± 165.6 | 212.7 ± 155.9 | 0.162 |
| Vitamin B12 (mcg) | 4.0 ± 4.6 | 5.1 ± 6.7 | 3.0 ± 2.2 | 4.0 ± 3.6 | 0.334 |
| Vitamin C (mg) | 110.5 ± 154.1 | 129.5 ± 226.1 | 100.7 ± 91.8 | 101.1 ± 115.1 | 0.830 |
| Vitamin E (mg) | 2.1 ± 1.6 | 2.2 ± 1.6 | 2.4 ± 1.7 | 1.8 ± 1.5 | 0.495 |
| Sodium (g) | 2.5 ± 1.8 | 2.3 ± 1.2 | 2.4 ± 1.4 | 2.7 ± 2.5 | 0.971 |
| Calcium (mg) | 906.5 ± 486.9 | 1014.2 ± 523.9 | 857.2 ± 386.1 | 848.1 ± 538.6 | 0.383 |
| Potassium (mg) | 2204.3 ± 1098.0 | 2558.0 ± 1494.4 | 1992.7 ± 644.2 | 2062.2 ± 935.4 | 0.420 |
| Magnesium (mg) | 253.9 ± 134.2 | 286.4 ± 162.4 | 235.6 ± 134.3 | 239.6 ± 97.6 | 0.413 |
| Phosphorus (mg) | 769.0 ± 521.8 | 853.4 ± 371.9 | 699.0 ± 374.0 | 754.6 ± 741.2 | 0.064 |
| Selenium (mcg) | 37.6 ± 51.8 | 41.8 ± 21.3 | 28.4 ± 14.3 | 42.5 ± 86.5 | 0.009 a,b |
| Zinc (mg) | 7.4 ± 4.1 | 8.3 ± 3.7 | 7.3 ± 3.9 | 6.7 ± 4.6 | 0.094 |
| Indicators | Total Sample (n = 72) | Tertile 1 <1.53 pg/mL (n = 24) | Tertile 2 >1.53–<2.50 pg/mL (n = 24) | Tertile 3 >2.50 pg/mL (n = 24) | p-Value |
|---|---|---|---|---|---|
| Weight (kg) 1 | 63.3 ± 13.8 | 62.3 ± 10.2 | 65.4 ± 16.2 | 62.2 ± 14.7 | 0.655 |
| BMI (kg/m2) 2 | 23.4 ± 4.2 | 23.1 ± 3.2 | 23.6 ± 5.1 | 23.4 ± 4.3 | 0.957 |
| Waist perimeter (cm) 2 | 75.0 ± 10.3 | 74.6 ± 8.8 | 76.8 ± 11.9 | 73.6 ± 10.0 | 0.468 |
| Body fat mass (%) 1 | 26.1 ± 9.8 | 26.4 ± 10.0 | 25.9 ± 11.3 | 26.0 ± 8.1 | 0.983 |
| Glucose (mg/dL) 1 | 90.1 ± 5.9 | 87.7 ± 4.7 | 90.1 ± 6.4 | 92.5 ± 5.8 | 0.017 a |
| Cholesterol (mg/dL) 1 | 156.2 ± 27.2 | 150.3 ± 26.8 | 150.2 ± 22.4 | 168.0 ± 29.1 | 0.030 a,b |
| HDL-c (mg/dL) 1 | 55.7 ± 13.4 | 54.9 ± 11.7 | 52.0 ± 11.3 | 60.3 ± 16.0 | 0.091 |
| LDL-c (mg/dL) 2 | 85.5 ± 21.2 | 80.7 ± 22.5 | 82.7 ± 16.7 | 93.0 ± 22.6 | 0.173 |
| VLDL-c (mg/dL) 2 | 14.9 ± 6.6 | 14.6 ± 7.8 | 15.5 ± 6.1 | 14.7 ± 6.1 | 0.499 |
| Triglycerides (mg/dL) 2 | 74.7 ± 33.1 | 73.0 ± 38.8 | 77.6 ± 30.7 | 73.4 ± 30.4 | 0.499 |
| Insulin (µUI/mL) 2 | 13.2 ± 8.9 | 12.3 ± 7.2 | 14.3 ± 12.3 | 13.1 ± 6.3 | 0.567 |
Publisher’s Note: MDPI stays neutral with regard to jurisdictional claims in published maps and institutional affiliations. |
© 2021 by the authors. Licensee MDPI, Basel, Switzerland. This article is an open access article distributed under the terms and conditions of the Creative Commons Attribution (CC BY) license (https://creativecommons.org/licenses/by/4.0/).
Share and Cite
González-Torres, S.; González-Silva, N.; Pérez-Reyes, Á.; Anaya-Esparza, L.M.; Sánchez-Enríquez, S.; Vargas-Becerra, P.N.; Villagrán, Z.; García-García, M.R. Food Consumption and Metabolic Risks in Young University Students. Int. J. Environ. Res. Public Health 2022, 19, 449. https://doi.org/10.3390/ijerph19010449
González-Torres S, González-Silva N, Pérez-Reyes Á, Anaya-Esparza LM, Sánchez-Enríquez S, Vargas-Becerra PN, Villagrán Z, García-García MR. Food Consumption and Metabolic Risks in Young University Students. International Journal of Environmental Research and Public Health. 2022; 19(1):449. https://doi.org/10.3390/ijerph19010449
Chicago/Turabian StyleGonzález-Torres, Sughey, Napoleón González-Silva, Ángel Pérez-Reyes, Luis Miguel Anaya-Esparza, Sergio Sánchez-Enríquez, Patricia N. Vargas-Becerra, Zuamí Villagrán, and Maritza R. García-García. 2022. "Food Consumption and Metabolic Risks in Young University Students" International Journal of Environmental Research and Public Health 19, no. 1: 449. https://doi.org/10.3390/ijerph19010449
APA StyleGonzález-Torres, S., González-Silva, N., Pérez-Reyes, Á., Anaya-Esparza, L. M., Sánchez-Enríquez, S., Vargas-Becerra, P. N., Villagrán, Z., & García-García, M. R. (2022). Food Consumption and Metabolic Risks in Young University Students. International Journal of Environmental Research and Public Health, 19(1), 449. https://doi.org/10.3390/ijerph19010449