
Comparison of the Morphological Characteristics of South African Sub-Elite Female Football Players According to Playing Position


Abstract
1. Introduction
2. Materials and Methods
2.1. Participants
2.2. Anthropometric Measurements
2.3. Statistical Analyses
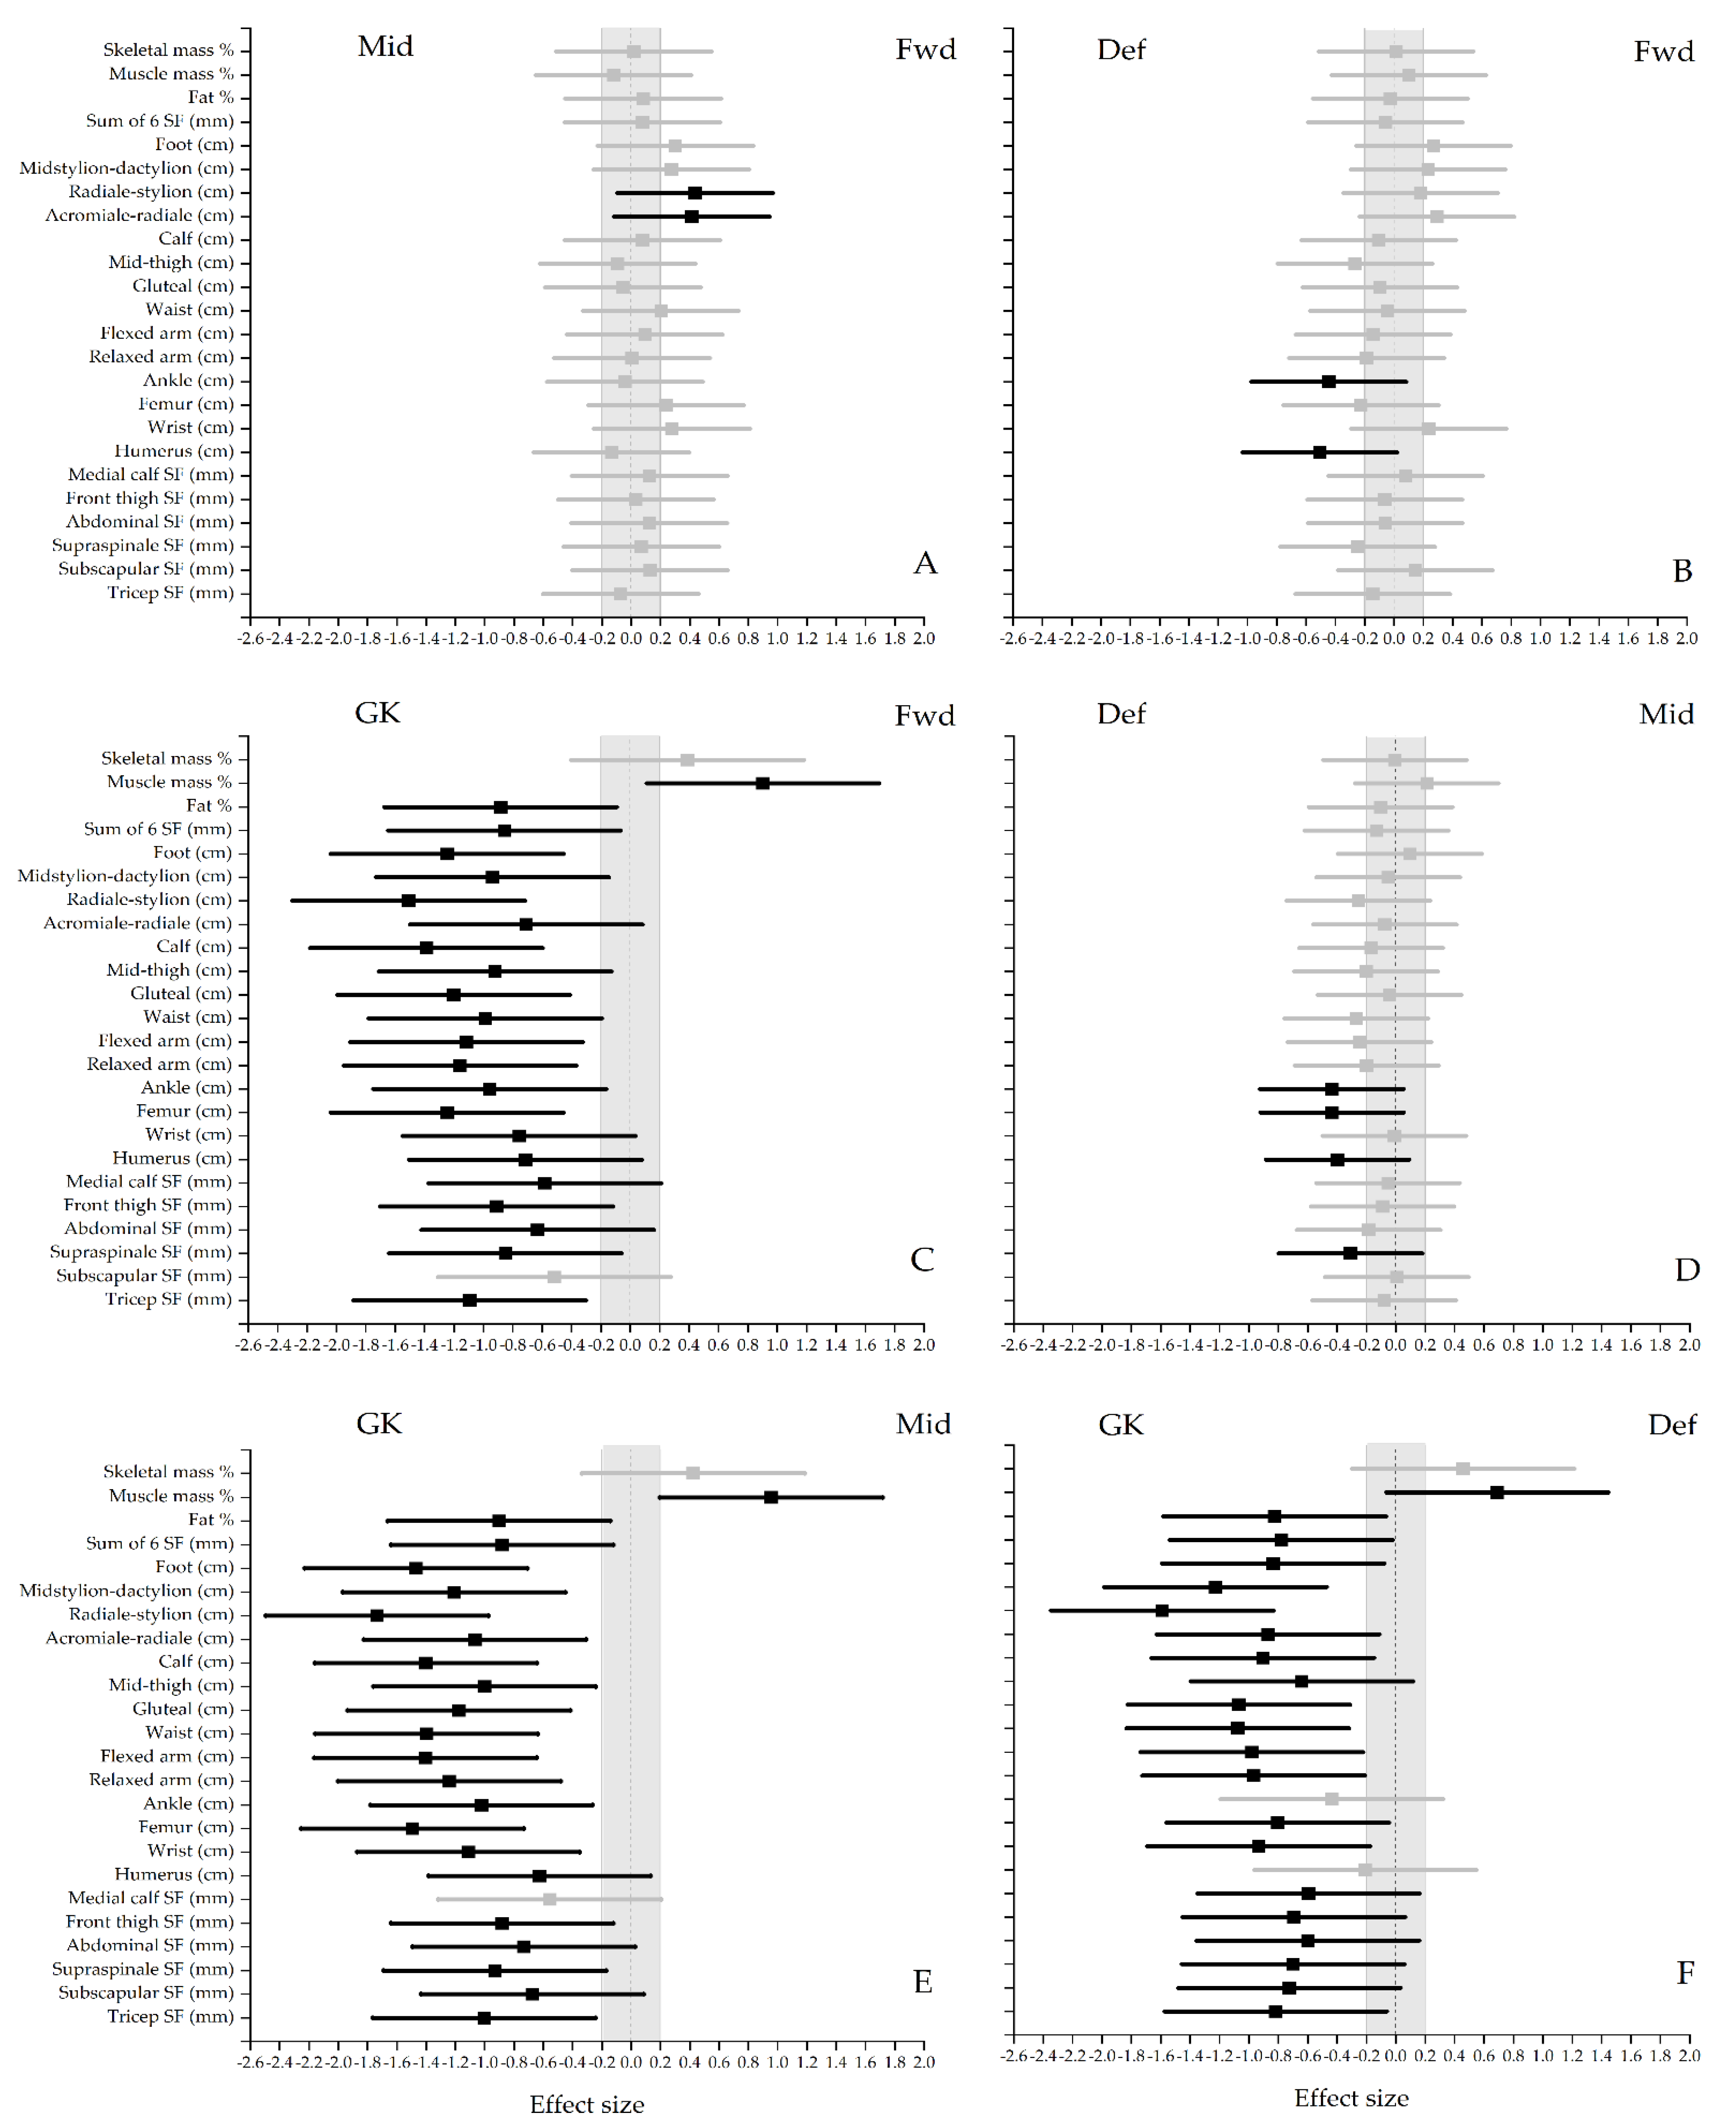
2.4. Positional Differences
2.5. Normative Classification
3. Results
4. Discussion
4.1. Limitations
4.2. Strengths
4.3. Practical Implications
5. Conclusions
Supplementary Materials
Author Contributions
Funding
Institutional Review Board Statement
Informed Consent Statement
Data Availability Statement
Acknowledgments
Conflicts of Interest
References
- Jelaska, P.M.; Erceg, M.; Jelaska, I. Canonical relations between sport-specific and morphological status among first league female soccer players. Facta Univ. Ser. Physic. Edu. Sport 2015, 13, 67–74. [Google Scholar]
- Erceg, M.; Milić, M.; Sivrić, H.; Košta, A.A. Correlation between morphological characteristics and motor abilities in young Croatian soccer players. Res. Physic. Edu. Sport Health 2014, 3, 51–56. [Google Scholar]
- Dillern, T.; Ingebrigtsen, J.; Shalfawi, S.A. Aerobic capacity and anthropometric characteristics of elite-recruit female soccer players. Serb. J. Sports Sci. 2012, 6, 43–49. [Google Scholar]
- Sedano, S.; Vaeyens, R.; Philippaerts, R.M.; Redondo, J.C.; Cuadrado, G. Anthropometric and anaerobic fitness profile of elite and non-elite female soccer players. J. Sports Med. Phys. Fit. 2009, 49, 387–394. [Google Scholar]
- Hazir, T. Physical Characteristics and Somatotype of Soccer Players according to Playing Level and Position. J. Hum. Kinet. 2010, 26, 83–95. [Google Scholar] [CrossRef]
- Gardasevic, J.; Bjelica, D. Body Composition Differences between Football Players of the Three Top Football Clubs. Int. J. Morphol. 2020, 38, 153–158. [Google Scholar] [CrossRef]
- Hasegawa, N.; Kuzuhara, K. Physical Characteristics of Collegiate Women’s Football Players. Footb. Sci. 2015, 12, 51–57. [Google Scholar]
- Mala, L.; Malý, T.; Zahálka, F.; Bunc, V.; Kaplan, A.; Jebavy, R.; Tůma, M. Body Composition of Elite Female Players in Five Different Sports Games. J. Hum. Kinet. 2015, 45, 207–215. [Google Scholar] [CrossRef] [PubMed]
- Nikolaïdis, P.T. Weight status and physical fitness in female soccer players: Is there an optimal BMI? Sport Sci. Health 2014, 10, 41–48. [Google Scholar] [CrossRef]
- Milanovic, Z.; Sporis, G.; Trajkovic, N. Differences in Body Composite and Physical Match Performance in Female Soccer Players According to Team Position. J. Hum. Sport Exerc. 2012, 7, S67–S72. [Google Scholar] [CrossRef]
- Sporis, G.; Jovanovic, M.; Krakan, I.; Fiorentini, F. Effects of strength training on aerobic and anaerobic power in female soccer players. Sport Sci. 2011, 4, 32–37. [Google Scholar]
- Haugen, T.A.; Tønnessen, E.; Seiler, S. Speed and Countermovement-Jump Characteristics of Elite Female Soccer Players, 1995–2010. Int. J. Sports Physiol. Perform. 2012, 7, 340–349. [Google Scholar] [CrossRef]
- Sporis, G.; Canaki, M.; Barisic, V. Morphological differences of elite Croatian female soccer players according to team position. Croat. Sports Med. J. 2007, 22, 91–96. [Google Scholar]
- Vescovi, J.D.; Brown, T.D.; Murray, T.M. Positional characteristics of physical performance in Division I college female soccer players. J. Sports Med. Phys. Fit. 2006, 46, 221–226. [Google Scholar]
- Rogan, S.; Hilfiker, R.; Clarys, P.; Clijsen, R.; Taeymansa, J. Position-specific and team-ranking-related morphological char-acteristics in German amateur soccer players-a descriptive study. Int. J. Appl. Sports Sci. 2011, 23, 168–182. [Google Scholar]
- Dey, S.; Kar, N.; Debray, P. Anthropometric, motor ability and physiological profiles of Indian national club footballers: A comparative study. S. Afr. J. Res. Sportphys. Educ. Recreat. 2010, 32, 43–56. [Google Scholar] [CrossRef][Green Version]
- Noh, J.-W.; Kim, M.-Y.; Lee, L.-K.; Park, B.-S.; Yang, S.-M.; Jeon, H.-J.; Lee, W.-D.; Kim, J.-Y.; Lee, J.-U.; Kwak, T.-Y.; et al. Somatotype and body composition analysis of Korean youth soccer players according to playing position for sports physiotherapy research. J. Phys. Ther. Sci. 2015, 27, 1013–1017. [Google Scholar] [CrossRef][Green Version]
- Carter, J.L.; Heath, B.H. Somatotyping: Development and Applications; Cambridge University Press: Cambridge, UK, 1990; Volume 5. [Google Scholar]
- Gil, S.M.; Gil, J.; Ruiz, F.; Irazusta, A.; Irazusta, J. Physiological and Anthropometric Characteristics of Young Soccer Players According to Their Playing Position: Relevance for the Selection Process. J. Strength Cond. Res. 2007, 21, 438–445. [Google Scholar] [CrossRef] [PubMed]
- Adhikari, A.; Nugent, J. Anthropometric characteristic, body composition and somatotype of Canadian female soccer players. Am. J. Sports Sci. 2014, 2, 14–18. [Google Scholar] [CrossRef]
- Stewart, A.; Marfell-Jones, M.; Olds, T.; de Ridder, H. International Standards for Anthropometric Assessment (ISAK); Lower Hutt: North Island, New Zealand, 2011. [Google Scholar]
- Withers, R.T.; Whittingham, N.O.; Norton, K.I.; Dutton, M. Somatotypes of South Australian female games players. Hum. Biol. 1987, 59, 575–584. [Google Scholar] [PubMed]
- Lee, R.C.; Wang, Z.; Heo, M.; Ross, R.; Janssen, I.; Heymsfield, S.B. Total-body skeletal muscle mass: Development and cross-validation of anthropometric prediction models. Am. J. Clin. Nutr. 2000, 72, 796–803. [Google Scholar] [CrossRef] [PubMed]
- Martin, A.D.; Spenst, L.F.; Drinkwater, D.T.; Clarys, J.P. Anthropometric estimation of muscle mass in men. Med. Sci. Sports Exerc. 1990, 22, 729–733. [Google Scholar] [CrossRef] [PubMed]
- Pederson, D.; Gore, C. Anthropometry Measurement Error; University of New South Wales Press: Sydney, Australia, 1996. [Google Scholar]
- Batterham, A.M.; Hopkins, W.G. Making Meaningful Inferences About Magnitudes. Int. J. Sports Physiol. Perform. 2006, 1, 50–57. [Google Scholar] [CrossRef] [PubMed]
- Hopkins, K.; Stanley, J. Educational and Psychological Measurement and Evaluation, 6th ed.; Prentice Hall: Engelwoord, NJ, USA, 1981. [Google Scholar]
- Haugen, T.A.; Tønnessen, E.; Hem, E.; Leirstein, S.; Seiler, S. VO2max Characteristics of Elite Female Soccer Players, 1989–2007. Int. J. Sports Physiol. Perform. 2014, 9, 515–521. [Google Scholar] [CrossRef]
- Matković, R.B.; Mišigoj-Duraković, M.; Matković, B.; Janković, S.; Ružić, L.; Leko, G.; Kondrič, M. Morphological differences of elite Croatian soccer players according to the team position. Coll. Antropol. 2003, 27, 167–174. [Google Scholar]
- Mujika, I.; Santisteban, J.; Impellizzeri, F.M.; Castagna, C. Fitness determinants of success in men’s and women’s football. J. Sports Sci. 2009, 27, 107–114. [Google Scholar] [CrossRef]
- Can, F.; Yilmaz, I.; Erden, Z. Morphological Characteristics and Performance Variables of Women Soccer Players. J. Strength Cond. Res. 2004, 18, 480–485. [Google Scholar] [CrossRef]
- Anwar, S.; Noohu, M.M. Correlation of Percentage Body Fat and Muscle Mass with Anaerobic an Aerobic Performance in Collegiate Soccer Players. Indian J. Physiol. Pharmacol. 2016, 60, 137–144. [Google Scholar]
- Slimani, M.; Znazen, H.; Hammami, A.; Bragazzi, N.L. Comparison of body fat percentage of male soccer players of different competitive levels, playing positions and age groups: A meta-analysis. J. Sports Med. Phys. Fit. 2017, 58, 857–866. [Google Scholar]
- Garrido-Chamorro, R.; Sirvent-Belando, J.E.; González-Lorenzo, M.; Blasco-Lafarga, C.; Roche, E. Skinfold Sum: Reference Values for Top Athletes. Int. J. Morphol. 2012, 30, 803–809. [Google Scholar] [CrossRef]
- Martínez, P.Y.O.; López, J.A.H.; Meza, E.I.A.; Millán, E.M.A.; León, R.S. Somatotype Profile and Body Composition of Players from the Mexican Professional Basketball League. Int. J. Morphol. 2014, 32, 1032–1035. [Google Scholar] [CrossRef]
- Goranovic, K.; Ana, L.; Siniša, K.; Nebahat, E.; Milan, A.; Joksimović, M. Morphological characteristics, body composition and explosive power in female football professional players. J. Physic. Edu. Sport 2021, 21, 81–87. [Google Scholar]
- Krustrup, P.; Mohr, M.; Ellingsgaard, H.; Bangsbo, J. Physical Demands during an Elite Female Soccer Game: Importance of Training Status. Med. Sci. Sports Exerc. 2005, 37, 1242–1248. [Google Scholar] [CrossRef] [PubMed]
- Todd, M.K.; Scott, D.; Chisnall, P. 62 fitness characteristics of English female soccer players: An analysis by position and playing standard. Sci. Footb. IV 2002, 2013, 374–381. [Google Scholar]


| Variables | Total (n = 101) | FW (n = 25) | MF (n = 33) | DF (n = 34) | GK (n = 9) | F-Value | p-Value |
|---|---|---|---|---|---|---|---|
| Body stature (cm) | 160.0 ± 6.8 | 160.9 ± 5.7 | 158.7 ± 6.1 * | 159.1 ± 6.9 * | 166.2 ± 8.4 | 3.5 | 0.018 |
| Body mass (kg) | 57.1 ± 9.1 | 56.3 ± 8.4 * | 55.0 ± 8.4 * | 57.4 ± 9.9 * | 66.5 ± 5.1 | 4.2 | 0.008 |
| Skinfolds (mm) | |||||||
| Tricep | 16.0 ± 5.3 | 15.1 ± 4.7 * | 15.5 ± 4.9 * | 15.9 ± 5.7 | 20.5 ± 5.8 | 2.7 | 0.052 |
| Subscapular | 11.4 ± 4.7 | 11.4 ± 4.5 | 10.9 ± 3.9 | 10.9 ± 3.4 | 14.6 ± 9.4 | 1.7 | 0.169 |
| Supraspinale | 10.3 ± 5.3 | 9.6 ± 4.1 * | 9.3 ± 4.4 * | 10.7 ± 4.5 | 15.0 ± 10.4 | 3.1 | 0.030 |
| Abdominal | 19.2 ± 8.3 | 18.8 ± 8.0 | 17.8 ± 8.4 | 19.3 ± 7.7 | 24.2 ± 9.9 | 1.4 | 0.233 |
| Front thigh | 24.9 ± 10.2 | 24.1 ± 8.9 | 23.8 ± 9.7 | 24.7 ± 11.3 | 32.4 ± 9.9 | 1.8 | 0.145 |
| Medial calf | 15.7 ± 6.1 | 15.9 ± 5.1 | 15.1 ± 7.2 | 15.4 ± 5.9 | 18.9 ±5.3 | 0.9 | 0.421 |
| Breadths (cm) | |||||||
| Humerus | 6.1 ± 0.3 | 6.0 ± 0.3 | 6.1 ± 0.3 | 6.2 ± 0.4 | 6.3 ± 0.5 | 2.2 | 0.097 |
| Wrist | 5.1 ± 0.3 | 5.1 ± 0.3 | 5.1 ± 0.2 * | 5.1 ± 0.3 * | 5.3 ± 0.3 | 2.8 | 0.044 |
| Femur | 8.9 ± 0.5 | 8.9 ± 0.4 * | 8.7 ± 0.4 * | 9.0 ± 0.6 | 9.4 ± 0.5 | 4.7 | 0.004 |
| Ankle | 6.5 ± 0.4 | 6.4 ± 0.4 | 6.4 ± 0.3 | 6.6 ± 0.4 | 6.7 ± 0.3 | 3.0 | 0.034 |
| Girths (cm) | |||||||
| Relaxed arm | 24.9 ± 2.6 | 24.5 ± 2.6 * | 24.5 ± 2.4 * | 25.0 ± 2.5 | 27.4 ± 2.1 | 3.6 | 0.017 |
| Flexed arm | 26.4 ± 2.4 | 26.1 ± 2.5 * | 25.9 ± 2.1 * | 26.4 ± 2.4 * | 28.7 ± 1.9 | 3.8 | 0.012 |
| Waist | 68.0 ± 5.9 | 67.7 ± 6.5 * | 66.5 ± 5.3 * | 68.0 ± 5.5 * | 73.9 ± 5.4 | 4.0 | 0.010 |
| Gluteal | 93.4 ± 6.7 | 92.4 ± 6.7 * | 92.8 ± 6.4 * | 93.1 ± 6.7 * | 99.9 ± 4.4 | 3.3 | 0.022 |
| Mid-thigh | 51.2 ± 4.6 | 50.3 ± 4.9 | 50.7 ± 3.9 | 51.6 ± 4.9 | 54.6 ± 4.0 | 2.3 | 0.085 |
| Calf | 32.9 ± 2.6 | 32.6 ± 2.1 * | 32.4 ± 2.2 * | 32.9 ± 3.0 * | 35.5 ± 2.0 | 3.7 | 0.014 |
| Lengths (cm) | |||||||
| Acromiale-radiale | 30.7 ± 1.6 | 31.0 ± 1.3 | 30.4 ± 1.4 * | 30.5 ± 1.7 | 32.0 ± 1.9 | 3.0 | 0.032 |
| Radiale-stylion | 24.2 ± 1.5 | 24.3 ± 1.2 * | 23.8 ± 1.4 * | 24.1 ± 1.3 * | 26.3 ± 1.6 | 8.6 | 0.000 |
| Midstylion-dactylion | 18.5 ± 1.0 | 18.5 ± 1.0 | 18.3 ± 1.0 * | 18.3 ± 0.9 * | 19.5 ± 1.2 | 4.2 | 0.008 |
| Foot | 24.4 ± 1.6 | 24.6 ± 1.0 | 24.3 ± 1.1 | 24.1 ± 2.2 * | 25.8 ± 0.7 | 3.0 | 0.033 |
| Variables | Total (n = 101) | FW (n = 25) | MF (n = 33) | DF (n = 34) | GK (n = 9) | F-Value | p-Value |
|---|---|---|---|---|---|---|---|
| Sum of 6 skinfolds (mm) | 97.5 ± 35.8 | 94.9 ± 31.7 | 92.3 ± 35.4 | 96.9 ± 34.2 | 125.6 ± 45.9 | 2.2 | 0.092 |
| Fat (kg) | 20.8 ± 5.7 | 20.4 ± 5.1 * | 20.0 ± 5.7 * | 20.6 ± 5.5 * | 25.4 ± 7.2 | 2.3 | 0.081 |
| Fat % | 12.2 ± 5.2 | 11.8 ± 4.6 | 11.3 ± 4.8 | 12.2 ±5.1 | 17.2 ± 6.2 | 2.4 | 0.022 |
| Muscle mass (kg) | 21.3 ± 2.1 | 21.1 ± 1.9 * | 20.8 ± 1.9 * | 21.3 ± 2.2 * | 23.7 ± 1.0 | 5.2 | 0.002 |
| Muscle mass % | 37.7 ± 2.7 | 37.9 ± 2.4 | 38.2 ± 2.6 | 37.6 ± 2.8 | 35.7 ± 2.0 | 2.1 | 0.107 |
| Skeletal mass (kg) | 6.8 ± 0.9 | 6.8 ± 0.7 * | 6.6 ± 0.7 * | 6.9 ± 1.0 * | 7.7 ± 1.0 | 4.3 | 0.007 |
| Skeletal mass % | 12.1 ± 1.2 | 12.1 ± 1.4 | 12.1 ± 1.2 | 12.1 ± 1.1 | 11.6 ± 1.2 | 0.5 | 0.693 |
| Endomorphy | 4.0 ± 1.3 | 3.8 ± 1.2 | 3.8 ± 1.2 | 4.0 ±1.3 | 4.9 ± 1.8 | 1.8 | 0.147 |
| Mesomorphy | 2.4 ± 0.9 | 2.0 ± 0.9 | 2.3 ± 0.7 | 2.7 ± 1.0 | 2.5 ±1.2 | 1.8 | 0.145 |
| Ectomorphy | 2.1 ± 1.2 | 2.4 ± 1.4 | 2.1 ± 1.0 | 1.9 ± 1.3 | 1.7 ±1.3 | 1.2 | 0.374 |
| Low | Average | High | ||||||||||||||
|---|---|---|---|---|---|---|---|---|---|---|---|---|---|---|---|---|
| Extremely low | Very Low | Low | Below average | Average | Above average | High | Very high | Extremely high | ||||||||
| Sum of 6 skinfolds (mm) | 46.5 | 58.9 | 67.2 | 77.4 | 98.1 | 121.2 | 145.8 | 163.2 | ||||||||
| Fat (%) | 12.9 | 14.5 | 16.1 | 17.6 | 20.8 | 24.4 | 28.7 | 31.6 | ||||||||
| Fat (kg) | 6.2 | 7.1 | 8.1 | 9.2 | 11.5 | 15.1 | 18.4 | 23.6 | ||||||||
| Muscle mass (kg) | 18.2 | 18.9 | 19.4 | 20.6 | 21.3 | 22.1 | 23.7 | 26.1 | ||||||||
| Muscle mass% | 32.8 | 34.4 | 36.1 | 37.7 | 38.6 | 39.9 | 41.3 | 42.5 | ||||||||
| Skeletal mass (kg) | 5.5 | 5.8 | 6.2 | 6.4 | 6.8 | 7.4 | 7.7 | 8.4 | ||||||||
| Skeletal mass (%) | 9.8 | 10.7 | 11.0 | 11.9 | 12.5 | 13.1 | 13.8 | 14.3 | ||||||||
| Author | Country & Competition Level | n | Age (Years) | Height (cm) | Weight (kg) | Body Fat (%) | Endomorphy | Mesomorphy | Ectomorphy |
|---|---|---|---|---|---|---|---|---|---|
| Nikolaidis [9] | Greek Amateur club level | 54 | 5.2 ± 1.5 | 4.6 ± 1.3 | 2.0 ± 1.2 | ||||
| Milanovic et al. [10] | Serbian A-National Team | 22 | 23.9 ± 4.5 | 168.8 ± 7.2 164.7 ± 5 (FW) 168.7 ± 8.7 (MF) 170.0 ± 7.2 (DF) 172.5 ± 3.5 (GK) | 61.4 ± 6 | 25.9 | |||
| 62.7 ± 7.7 (MF) | |||||||||
| 59.5 ± 10.6 (GK) | |||||||||
| Sporis et al. [11] | Croatian elite level total group | 24 | 18.3 ± 0.6 | 165.6 ± 4.2 | 58.3 ± 4.6 | 21.3 ± 1.5 | |||
| 4 | 17.4 ± 0.4 (FW) | 165.0 ± 4.2 (FW) | 63.6 ± 4.1 (FW) | 20.3 ± 1.7 (FW) | |||||
| 12 | 18.3 ± 0.7 (MF) | 164.0 ± 4.3(MF) | 56.0 ± 4.8 (MF) | 21.6 ± 1.8 (MF) | |||||
| 5 | 18.5 ± 0.6 (DF) | 165.8 ± 3.9 (DF) | 56.3 ± 4.9 (DF) | 21.8 ± 0.9 (DF) | |||||
| 3 | 19.1 ± 0.5 (GK) | 172.5 ± 4.6 (GK) | 64.4 ± 4.2 (GK) | 20.7 ± 1.2 (GK) | |||||
| Haugen et al. [12] | Norwegian National Team | 85 | 23.5 ± 3.6 | 63.7 ± 5.2 | |||||
| Norwegian 1st Division | 46 | 21.2 ± 3.6 | 62.4 ± 6.6 | ||||||
| Total group | 44 | 21.9 ± 3.8 (FW) | 64.1 ± 6.7 (FW) | ||||||
| 55 | 21.6 ± 4.3 (MF) | 61.5 ± 4.6 (MF) | |||||||
| 50 | 21.6 ± 4.1 (DF) | 61.9 ± 5.7 (DF) | |||||||
| 16 | 21.4 ± 4.7 (GK) | 67.3 ± 4.6 (GK) | |||||||
| Sporis et al. [13] | Croatian First League club players | 24 | 165.6 ± 5.8 | 58.6 ± 9 | 13.6 ± 4.2 | ||||
| 165.0 (FW) | 63.6 (FW) | 14.3 (FW) | |||||||
| 164.0 (MF) | 56.0 (MF) | 12.6 (MF) | |||||||
| 165.8 (DF) | 56.3 (DF) | 16.8 (DF) | |||||||
| 172.5 (GK) | 64.4 (GK) | 13.7 (GK) | |||||||
| Vescovi et al. [14] | USA Sub-elite 1st Division | 64 | 19.8 ± 1.2 | 168.4 ± 5.9 | 64.8 ± 5.9 | ||||
| 168.3 ± 6.6 (FW) | 64.5 ± 5.8 (FW) | ||||||||
| 165.9 ± 6.3 (MF) | 61.3 ± 4.7 (MF) | ||||||||
| 169.9 ± 4.3 (DF) | 67 ± 6.7 (DF) | ||||||||
| 170.3 ± 5.7 (GK) | 66.4 ± 1.9 (GK) | ||||||||
| Adhikari and Nugent [20] | Canadian club level | 18 | 3.0 ± 0.8 | 3.9 ± 0.8 | 2.6 ± 1.0 | ||||
| Can et al. [31] | Turkish highest division | 17 | 3.0 ± 0.8 | 3.5 ± 0.9 | 2.4 ± 0.9 | ||||
| Withers et al. [22] | South Australian team | 11 | 4.2 ± 1.3 | 4.6 ± 1.0 | 2.2 ± 1.2 | ||||
| Goranovic et al. [36] | Serbian super league | 20 | 19.7 ± 4.8 | 163.8 ± 3.7 (FW) | 56.3 ± 5.8 (FW) | 20.9 ± 4.2 (FW) | 2.71 (FW) | 3.46 (FW) | 2.74 (FW) |
| 167.1 ± 7.5 (MF) | 61.3 ± 7.4 (MF) | 22.8 ± 4.6 (MF) | 3.32 (MF) | 3.43 (MF) | 2.53 (MF) | ||||
| 171.2 ± 6.1 (DF) | 61.7 ± 6.8 (DF) | 20.8 ± 5.0 (DF) | 2.89 (DF) | 2.87 (DF) | 3.19 (DF) | ||||
| Krustrup et al. [37] | Danish highest division | 14 | 24 | 167.0 | 58.5 | 14.6 | |||
| 166.0 ± 4 (FW) | 58.7 ± 3.8 (FW) | 16.1 ± 2.4 (FW) | |||||||
| 165.0 ± 4 (MF) | 56.0 ± 5.9 (MF) | 12.5 ± 2.2 (MF) | |||||||
| 168.0 ± 7 (DF) | 60.7 ± 6.3 (DF) | 15.4 ± 3.7 (DF) | |||||||
| Todd et al. [38] | English international | 25 | 22.3 ± 4.3 23.4 ± 5.9 21.3 ± 6.6 | 162.8 ± 5.9 | 61.2 ± 5.2 | 22.9 ± 3.4 | |||
| English Premier League | 44 | 163.3 ± 5.5 | 62.1 ± 6.4 | 23.9 ± 4.2 | |||||
| English Regional League | 51 | 163.9 ± 6.3 | 61.6 ± 7.1 | 25.5 ± 3.5 | |||||
| Total group | 120 | 162.5 ± 6.8 (FW) | 60.9 ± 7.3 (FW) | 24.3 ± 4.1 (FW) | |||||
| 161.6 ± 5 (MF) | 59.5 ± 5 (MF) | 24.0 ± 3.5 (MF) | |||||||
| 165.2 ± 5.6 (DF) | 62.7 ± 6.6 (DF) | 24.2 ± 3.9 (DF) | |||||||
| 168.5 ± 4.3 (GK) | 68.9 ± 5.5 (GK) | 26.3 ± 4.3 (GK) | |||||||
| This study | South African semi-elite | 101 | 21.8 ± 2.7 | 160.9 ± 5.7 (FW) | 56.3 ± 8.4 (FW) | 11.8 ± 4.6 (FW) | 3.8 ± 1.2 (FW) | 2.0 ± 0.9 (FW) | 2.1 ± 1.2 (FW) |
| 158.7 ± 6.1 (MF) | 55.0 ± 8.4 (MF) | 11.3 ± 4.8 (MF) | 3.8 ± 1.2 (MF) | 2.3 ± 0.7 (MF) | 2.1 ± 1.0 (MF) | ||||
| 159.1 ± 6.9 (DF) | 57.4 ± 9.9 (DF) | 12.2 ± 5.1 (DF) | 4.0 ± 1.3 (DF) | 2.7 ± 1.0 (DF) | 1.9 ± 1.3 (DF) | ||||
| 166.2 ± 8.4 (GK) | 66.5 ± 5.1 (GK) | 17.2 ± 6.2 (GK) | 4.9 ± 1.8 (GK) | 2.5 ± 1.2 (GK) | 1.7 ± 1.3 (GK) |
Publisher’s Note: MDPI stays neutral with regard to jurisdictional claims in published maps and institutional affiliations. |
© 2021 by the authors. Licensee MDPI, Basel, Switzerland. This article is an open access article distributed under the terms and conditions of the Creative Commons Attribution (CC BY) license (http://creativecommons.org/licenses/by/4.0/).
Share and Cite
Strauss, A.; Sparks, M.; Pienaar, C. Comparison of the Morphological Characteristics of South African Sub-Elite Female Football Players According to Playing Position. Int. J. Environ. Res. Public Health 2021, 18, 3603. https://doi.org/10.3390/ijerph18073603
Strauss A, Sparks M, Pienaar C. Comparison of the Morphological Characteristics of South African Sub-Elite Female Football Players According to Playing Position. International Journal of Environmental Research and Public Health. 2021; 18(7):3603. https://doi.org/10.3390/ijerph18073603
Chicago/Turabian StyleStrauss, Anita, Martinique Sparks, and Cindy Pienaar. 2021. "Comparison of the Morphological Characteristics of South African Sub-Elite Female Football Players According to Playing Position" International Journal of Environmental Research and Public Health 18, no. 7: 3603. https://doi.org/10.3390/ijerph18073603
APA StyleStrauss, A., Sparks, M., & Pienaar, C. (2021). Comparison of the Morphological Characteristics of South African Sub-Elite Female Football Players According to Playing Position. International Journal of Environmental Research and Public Health, 18(7), 3603. https://doi.org/10.3390/ijerph18073603