
Iodine Excretion and Intake in Women of Reproductive Age in South Australia Eating Plant-Based and Omnivore Diets: A Pilot Study


Abstract
1. Introduction
2. Materials and Methods
2.1. Power
2.2. Statistics
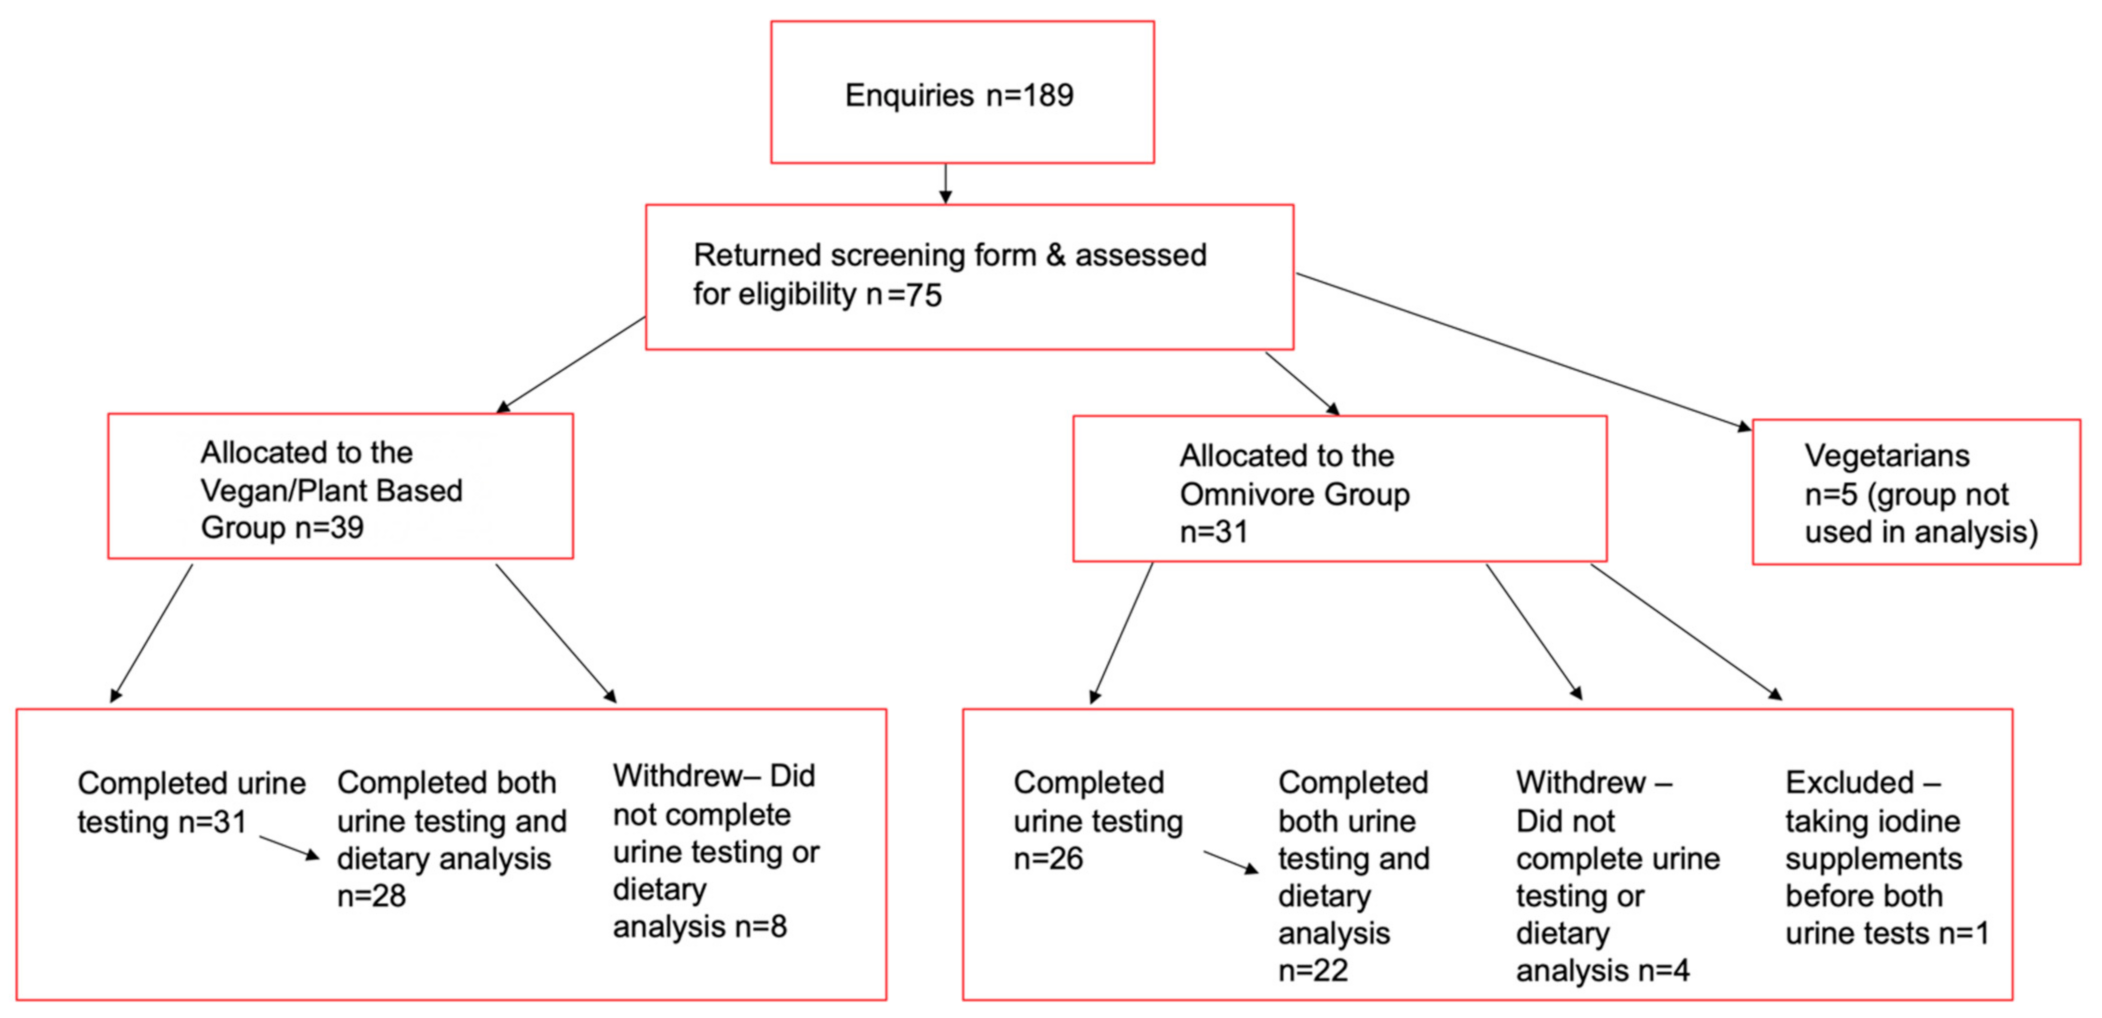
3. Results
3.1. Urinary Iodine Concentration
3.2. Food Sources of Iodine
3.3. Micronutrient Intake
3.4. Iodised & Non Iodised Salt Use
4. Discussion
4.1. Urinary Iodine Concentration
4.2. Dietary Iodine Intake
4.3. Dietary Habits
4.4. Macronutrients
4.5. Other Micronutrient Intakes
4.6. Limitations
5. Conclusions
Author Contributions
Funding
Institutional Review Board Statement
Informed Consent Statement
Acknowledgments
Conflicts of Interest
References
- Hynes, K.L.; Seal, J.A.; Otahal, P.; Oddy, W.H.; Burgess, J.R. Women remain at risk of iodine deficiency during pregnancy: The importance of iodine supplementation before conception and throughout gestation. Nutrients 2019, 11, 172. [Google Scholar] [CrossRef]
- Moleti, M.; Di Bella, B.; Giorgianni, G.; Mancuso, A.; De Vivo, A.; Alibrandi, A.; Trimarchi, F.; Vermiglio, F. Maternal thyroid function in different conditions of iodine nutrition in pregnant women exposed to mild-moderate iodine deficiency: An observational study. Clin. Endocrinol. 2011, 74, 762–768. [Google Scholar] [CrossRef]
- Moleti, M.; Lo Presti, V.P.; Campolo, M.C.; Mattina, F.; Galletti, M.; Mandolfino, M.; Violi, M.A.; Giorgianni, G.; De Domenico, D.; Trimarchi, F.; et al. Iodine prophylaxis using iodized salt and risk of maternal thyroid failure in conditions of mild iodine deficiency. J. Clin. Endocrinol. Metab. 2008, 93, 2616–2621. [Google Scholar] [CrossRef] [PubMed]
- Roy Morgan Research. Rise in Vegetarianism not Halting the March of Obesity. 2019. Available online: http://www.roymorgan.com/findings/7944-vegetarianism-in-2018-april-2018-201904120608 (accessed on 10 October 2020).
- Rinaldi, S.; Campbell, E.E.; Fournier, J.; O’Connor, C.; Madill, J. A Comprehensive Review of the Literature Supporting Recommendations from the Canadian Diabetes Association for the Use of a Plant-Based Diet for Management of Type 2 Diabetes. Can. J. Diabetes 2016, 40, 471–477. [Google Scholar] [CrossRef]
- Satija, A.; Bhupathiraju, S.N.; Spiegelman, D.; Chiuve, S.E.; Manson, J.E.; Willett, W.; Rexrode, K.M.; Rimm, E.B.; Hu, F.B. Healthful and Unhealthful Plant-Based Diets and the Risk of Coronary Heart Disease in U.S. Adults. J. Am. Coll. Cardiol. 2017, 70, 411–422. [Google Scholar] [CrossRef]
- Jihad, A.; Hana, K.; Emilie, R.; Willy, Y.; Sara, D.; Manuel, C.; Nora, B.; Lee, C.; Neal, D.B. Nutrition Interventions in Rheumatoid Arthritis: The Potential Use of Plant-Based Diets. A Review. Front. Nutr. 2019, 6. [Google Scholar] [CrossRef]
- Pistollato, F.; Battino, M. Role of plant-based diets in the prevention and regression of metabolic syndrome and neurodegenerative diseases. Trends Food Sci. Technol. 2014, 40, 62–81. [Google Scholar] [CrossRef]
- Newby, P.K.; Tucker, K.L.; Wolk, A. Risk of overweight and obesity among semivegetarian, lactovegetarian, and vegan women. Am. J. Clin. Nutr. 2005, 81, 1267–1274. [Google Scholar] [CrossRef] [PubMed]
- Qian, F.; Liu, G.; Hu, F.B. Association between Plant-Based Dietary Patterns and Risk of Type 2 Diabetes. A Systematic Review and Meta-analysis. JAMA Intern. Med. 2019, 179, 1335–1344. [Google Scholar] [CrossRef] [PubMed]
- Leung, A.M.; Lamar, A.; He, X.; Braverman, L.E.; Pearce, E.N. Iodine status and thyroid function of Boston-area vegetarians and vegans. J. Clin. Endocrinol. Metab. 2011, 96, E1303–E1307. [Google Scholar] [CrossRef] [PubMed]
- Food Standards Australia New Zealand. Monitoring the Australian Population’s Intake of Dietary Iodine Before and after Mandatory Fortification; Food Standards Australia New Zealand: Kingston, Australia, 2016.
- Charlton, K.E.; Yeatman, H.; Brock, E.; Lucas, C.; Gemming, L.; Goodfellow, A.; Ma, G. Improvement in iodine status of pregnant Australian women 3 years after introduction of a mandatory iodine fortification programme. Prev. Med. 2013, 57, 26–30. [Google Scholar] [CrossRef] [PubMed]
- Food Standards Australia New Zealand. Maximum Iodine Limit in Formulated Supplementary Foods for Young Children–Explanatory Statement. Application A528; Food Standards Australia and New Zealand: Kingston, Australia, 2018.
- Charlton, K.; Probst, Y.; Kiene, G. Dietary Iodine Intake of the Australian Population after Introduction of a Mandatory Iodine Fortification Programme. Nutrients 2016, 8, 701. [Google Scholar] [CrossRef]
- NHMRC National Health and Medical Research Council, Ministry of Health, Department of Health and Ageing. Nutrient Reference Values for Australia and New Zealand: Including Recommended Dietary Intakes; NHMRC National Health and Medical Research Council, Ministry of Health, Department of Health and Ageing: Canberra, Australia, 2006.
- Huynh, D.; Condo, D.; Gibson, R.; Muhlhausler, B.; Ryan, P.; Skeaff, S.; Makrides, M.; Zhou, S.J. Iodine status of postpartum women and their infants in Australia after the introduction of mandatory iodine fortification. Br. J. Nutr. 2017, 117, 1656–1662. [Google Scholar] [CrossRef] [PubMed]
- Condo, D.; Huyhn, D.; Anderson, A.J.; Skeaff, S.; Ryan, P.; Makrides, M.; Muhlhausler, B.S.; Zhou, S.J. Iodine status of pregnant women in South Australia after mandatory iodine fortification of bread and the recommendation for iodine supplementation. Matern Child. Nutr. 2017, 13. [Google Scholar] [CrossRef]
- May, S.L.; May, W.A.; Bourdoux, P.P.; Pino, S.; Sullivan, K.M.; Maberly, G.F. Validation of a simple, manual urinary iodine method for estimating the prevalence of iodine-deficiency disorders, and interlaboratory comparison with other methods. Am. J. Clin. Nutr. 1997, 65, 1441–1445. [Google Scholar] [CrossRef] [PubMed]
- Ambrosini, G.L.; Hurworth, M.; Giglia, R.; Trapp, G.; Strauss, P. Feasibility of a commercial smartphone application for dietary assessment in epidemiological research and comparison with 24-h dietary recalls. Nutr. J. 2018, 17, 5. [Google Scholar] [CrossRef] [PubMed]
- Rhee, J.J.; Sampson, L.; Cho, E.; Hughes, M.D.; Hu, F.B.; Willett, W.C. Comparison of methods to account for implausible reporting of energy intake in epidemiologic studies. Am. J. Epidemiol. 2015, 181, 225–233. [Google Scholar] [CrossRef] [PubMed]
- Rasmussen, L.B.; Jørgensen, T.; Perrild, H.; Knudsen, N.; Krejbjerg, A.; Laurberg, P.; Pedersen, I.B.; Bjergved, L.; Ovesen, L. Mandatory iodine fortification of bread and salt increases iodine excretion in adults in Denmark—A 11-year follow-up study. Clin. Nutr. 2013, 33, 1033–1040. [Google Scholar] [CrossRef]
- Als, C. Urinary Iodine Concentration follows a Circadian Rhythm: A Study with 3023 Spot Urine Samples in Adults and Children. J. Clin. Endocrinol. Metab. 2000, 85, 1367–1369. [Google Scholar] [CrossRef] [PubMed]
- Rasmussen, L.B.; Ovesen, L.; Christiansen, E. Day-to-day and within-day variation in urinary iodine excretion. Eur. J. Clin. Nutr. 1999, 53, 401–407. [Google Scholar] [CrossRef]
- Andersen, S.; Karmisholt, J.; Pedersen, K.M.; Laurberg, P. Reliability of studies of iodine intake and recommendations for number of samples in groups and in individuals. Br. J. Nutr. 2007, 99, 813–818. [Google Scholar] [CrossRef]
- WHO. Urinary Iodine Concentrations for Determining Iodine Status in Populations; Department of Nutrition for Health and Development (NHD) World Health Organization: Geneva, Switzerland, 2013. [Google Scholar]
- Perrine, C.G.; Cogswell, M.E.; Swanson, C.A.; Sullivan, K.M.; Chen, T.C.; Carriquiry, A.L.; Dodd, K.W.; Caldwell, K.L.; Wang, C.Y. Comparison of population iodine estimates from 24-hour urine and timed-spot urine samples. Thyroid 2014, 24, 748–757. [Google Scholar] [CrossRef] [PubMed]
- Charlton, K.E.; Batterham, M.J.; Buchanan, L.M.; Mackerras, D. Intraindividual variation in urinary iodine concentrations: Effect of adjustment on population distribution using two and three repeated spot urine collections. BMJ Open 2014, 4, e003799. [Google Scholar] [CrossRef] [PubMed]
- Brantsæter, A.; Knutsen, H.; Johansen, N.; Nyheim, K.; Erlund, I.; Meltzer, H.; Henjum, S. Inadequate Iodine Intake in Population Groups Defined by Age, Life Stage and Vegetarian Dietary Practice in a Norwegian Convenience Sample. Nutrients 2018, 10, 230. [Google Scholar] [CrossRef]
- Krajčovičová-Kudláčková, M.; Bučková, K.; Klimeš, I.; Šeboková, E. Iodine Deficiency in Vegetarians and Vegans. Ann. Nutr. Metab. 2003, 47, 183–185. [Google Scholar] [CrossRef]
- Gerasimov, G. Progress of IDD Elimination through Universal Salt Iodization in the Czech. Republic, Slovakia, Hungary and Poland; UNICEF: New York, NY, USA, 2002. [Google Scholar]
- Edmonds, J.C.; McLean, R.M.; Williams, S.M.; Skeaff, S.A. Urinary iodine concentration of New Zealand adults improves with mandatory fortification of bread with iodised salt but not to predicted levels. Eur. J. Nutr. 2015, 55, 1201–1212. [Google Scholar] [CrossRef]
- Fallon, N.; Dillon, S.A. Low Intakes of Iodine and Selenium Amongst Vegan and Vegetarian Women Highlight a Potential Nutritional Vulnerability. Front. Nutr. (Lausanne) 2020, 7, 72. [Google Scholar] [CrossRef]
- Kristensen, N.B.; Madsen, M.L.; Hansen, T.H.; Allin, K.H.; Hoppe, C.; Fagt, S.; Lausten, M.S.; Gøbel, R.J.; Vestergaard, H.; Hansen, T.; et al. Intake of macro- and micronutrients in Danish vegans. Nutr. J. 2015, 14, 115. [Google Scholar] [CrossRef] [PubMed]
- Food Standards Australia New Zealand. Australian Food Composition Database. Release 1.0; Food Standards Australia New Zealand: Kingston, Australia, 2019.
- Fuge, R. Iodine Deficiency: An Ancient Problem in a Modern World. Ambio 2007, 36, 70–72. [Google Scholar] [CrossRef][Green Version]
- Fuge, R. Essentials of Medical Geology. In Soils and Iodine Deficiency; Selinus, O., Ed.; Springer: Berlin/Heidelberg, Germany, 2013; pp. 417–432. [Google Scholar]
- Schöne, F.; Spörl, K.; Leiterer, M. Iodine in the feed of cows and in the milk with a view to the consumer’s iodine supply. J. Trace Elem. Med. Biol. 2017, 39, 202–209. [Google Scholar] [CrossRef]
- IBISWorld. Soy and Almond Milk Production in Australia—Market; Research Report; IBISWorld Pty Ltd.: Canberra, Australia, 2020. [Google Scholar]
- Elorinne, A.-L.; Alfthan, G.; Erlund, I.; Kivimäki, H.; Paju, A.; Salminen, I.; Turpeinen, U.; Voutilainen, S.; Laakso, J. Food and Nutrient Intake and Nutritional Status of Finnish Vegans and Non-Vegetarians. PLoS ONE 2016, 11, e0148235. [Google Scholar] [CrossRef] [PubMed]
- Cook, J.D.; Dassenko, S.A.; Lynch, S.R. Assessment of the role of nonheme-iron availability in iron balance. Am. J. Clin. Nutr. 1991, 54, 717–722. [Google Scholar] [CrossRef]
- Saunders, A.V.; Craig, W.J.; Baines, S.K.; Posen, J.S. Iron and vegetarian diets. Med. J. Aust. 2013, 199, S11–S16. [Google Scholar] [CrossRef]
- Pasco, J.A.; Sanders, K.M.; Henry, M.J.; Nicholson, G.C.; Seeman, E.; Kotowicz, M.A. Calcium intakes among Australian women: Geelong Osteoporosis Study. Aust. N. Z. J. Med. 2000, 30, 21–27. [Google Scholar] [CrossRef]
- Australian Institute of Health and Welfare. The Health of Australias Females; Australian Government: Canberra, Australia, 2018.
- Guan, J.; Loo, B.; Trines, S. Education in Australia; World Education News & Reviews: New York, NY, USA, 2017. [Google Scholar]


| Variable | Vegan/Plant Based Median and IQR n = 31 | Omnivore Median and IQR n = 26 | p |
|---|---|---|---|
| Age (years) | 32 (23–41) | 29 (21–35) | NS |
| Weight (Kg) | 62 (57–67) | 64 (58–79) | NS |
| BMI (kg/m2) | 21 (20–24) | 22 (21–27) | NS |
| Iodine | Vegan/Plant Based n = 31 | Omnivore n = 26 | p |
|---|---|---|---|
| UIC (µg/L) | 44 (26–66) | 64 (40–88) | p = 0.044 |
| Food | Vegan/Plant Based (n = 28) | Omnivore (n = 22) | p | No of Vegan/ Plant-Based Consumers | No of Omnivore Consumers |
|---|---|---|---|---|---|
| Iodised Salt | 4 | 4 | |||
| Iodised Bread Intake (g/day) | 28 (0–55) | 36 (10–75) | NS | 17 | 17 |
| Plant Milk (mL/day) | 170 (5–291) | 0 (0–0) | - | 22 | 3 |
| Dairy Milk servings/day ^ | 0 (0–0) | 0.5 (0.3–1.2) | - | 0 * | 19 |
| Total Dairy servings/day ** | 0 (0–0) | 1.3 (0.7–1.8) | - | 0 * | 21 |
| Egg (g/day) | 0 (0–1) | 5 (0–38) | p = 0.001 | 0 * | 13 |
| Fish servings/day (100 g raw fish = 1 serve) | 0 (0–0) | 0.00 (0.00–0.24) | - | 1 | 8 |
| Seaweed (g/day) | 0 (0–0) | 0 (0–0) | - | 6 | 0 |
| Macronutrient | Vegan/Plant Based n = 28 | Omnivore n = 22 | p |
|---|---|---|---|
| Energy (kJ/day) | 7146 (6095–8370) | 7162 (6257–9136) | NS |
| Protein (g/day) | 59 (51–69) | 82 (67–95) | p = 0.001 |
| Total Fat (g/day) | 64 (53–81) | 77 (68–91) | NS |
| Saturated fat (g/day) | 16 (9–26) | 28 (23–35) | p = 0.001 |
| % kJ from sat fat | 9.2 (±4.5) * | 13.8 (±4.0) * | p = 0.000 |
| Trans fat (g/day) | 0.3 (0.2–0.5) | 1.1 (0.8–1.4) | p = 0.000 |
| VLC N3 PUFA (mg) | 0 (0–110) | 120 (6–400) | p = 0.000 |
| ALA (g) | 2.13 (1.44–2.99) | 1.51 (0.97–2.36) | p = 0.048 |
| Cholesterol ^^ (mg/day) | 5.2 (1.1–15.7) | 249 (161–365) | p = 0.000 |
| Carbohydrate (g/day) | 205 ± 75 * | 181 ± 55 * | NS |
| Sugar (g/day) | 75 (±31) * | 72 (±40) * | NS |
| Alcohol (g/day) | 0 (0–0.3) | 0 (0–7) | NS |
| Fibre (g/day) | 37 (29–56) | 23 (20–28) | p = 0.000 |
| Nutrients | Vegan/Plant Based n = 28 | Omnivore n = 22 | p | EAR ^ | Intake RDI ^ |
|---|---|---|---|---|---|
| Iodine (µg/day) | 78 (62–91) | 125 (86–175) | p = 0.000 | 100 | 150 |
| Selenium (µg/day) | 38 (32–64) | 63 (51–83) | p = 0.005 | 50 | 60 |
| Iron (mg/day) | 14.2 (10.8–19.8) | 9.8 (7.8–13.1) | p = 0.001 | 8 | 18 |
| Zinc (mg/day) | 8.2 (5.6–9.6) | 9.8 (7.5–12.4) | p = 0.053 | 6.5 | 8 |
| Calcium (mg/day) | 658 (±258) * | 772 (±331) * | NS | 840 | 1000 |
| Magnesium (mg/day) | 483 (297–543) | 315 (211–455) | p = 0.007 | 255–265 | 310–320 |
| Sodium (mg/day) | 1692 (±823) * | 2439 (±932) * | p = 0.005 | - | - |
| Potassium (mg/day) | 3464 (2745–3966) | 3296 (2256–4085) | NS | 2800 AI ^ | - |
| Thiamin (mg/day) | 1.41 (1.01–1.72) | 1.04 (0.87–1.39) | NS | 0.9 | 1.1 |
| Niacin (mg/day) | 14.5 (12.2–22.2) | 19.4 (13.6–24.9) | NS | 11 | 14 |
| B6 (mg/day) | 1.52 (1.12–2.54) | 1.48 (1.08–1.93) | NS | 1.1 | 1.3 |
| B12 (µg/day) | 0.86 (0.15–1.83) | 4.00 (2.41–5.35) | p = 0.000 | 2.0 | 2.4 |
| Total Vit A equivalents (µg/day) | 1497 (825–1907) | 944 (642–1676) | NS | 500 | 700 |
| Riboflavin (mg/day) | 1.02 (0.68–1.42) | 1.15 (0.82–1.78) | NS | 0.9 | 1.3 |
| Vit C (mg/day) | 146 (89–250) | 88 (50–132) | p = 0.006 | 30 | 45 |
| Vit E (mg/day) | 18 (13.2–29.5) | 11.5 (7–15) | p < 0.0001 | 7 | - |
| Total Folate + Folic acid ^^ (µg/day) | 508 (406–681) | 423 (260–538) | p = 0.039 | 320 | 400 |
| Food folate (µg/day) | 411 (330–533) | 258 (167–376) | p = 0.002 | - |
Publisher’s Note: MDPI stays neutral with regard to jurisdictional claims in published maps and institutional affiliations. |
© 2021 by the authors. Licensee MDPI, Basel, Switzerland. This article is an open access article distributed under the terms and conditions of the Creative Commons Attribution (CC BY) license (http://creativecommons.org/licenses/by/4.0/).
Share and Cite
Whitbread, J.S.; Murphy, K.J.; Clifton, P.M.; Keogh, J.B. Iodine Excretion and Intake in Women of Reproductive Age in South Australia Eating Plant-Based and Omnivore Diets: A Pilot Study. Int. J. Environ. Res. Public Health 2021, 18, 3547. https://doi.org/10.3390/ijerph18073547
Whitbread JS, Murphy KJ, Clifton PM, Keogh JB. Iodine Excretion and Intake in Women of Reproductive Age in South Australia Eating Plant-Based and Omnivore Diets: A Pilot Study. International Journal of Environmental Research and Public Health. 2021; 18(7):3547. https://doi.org/10.3390/ijerph18073547
Chicago/Turabian StyleWhitbread, Jane S., Karen J. Murphy, Peter M. Clifton, and Jennifer B. Keogh. 2021. "Iodine Excretion and Intake in Women of Reproductive Age in South Australia Eating Plant-Based and Omnivore Diets: A Pilot Study" International Journal of Environmental Research and Public Health 18, no. 7: 3547. https://doi.org/10.3390/ijerph18073547
APA StyleWhitbread, J. S., Murphy, K. J., Clifton, P. M., & Keogh, J. B. (2021). Iodine Excretion and Intake in Women of Reproductive Age in South Australia Eating Plant-Based and Omnivore Diets: A Pilot Study. International Journal of Environmental Research and Public Health, 18(7), 3547. https://doi.org/10.3390/ijerph18073547