
Psychosocial and Social Environmental Factors as Moderators in the Relation between the Objective Environment and Older Adults’ Active Transport


Abstract
1. Introduction
2. Materials and Methods
2.1. Study Design
2.2. Sampling
2.3. Measures
2.3.1. Socio-Demographic Factors and Residential Self-Selection
2.3.2. Self-Reported Active Transport Behavior
2.3.3. Psychosocial Factors towards PA
2.3.4. The Perceived Social Neighborhood Environment
2.3.5. The Objective Physical Neighborhood Environment
2.4. Data Analyses
3. Results
3.1. Descriptive Statistics
3.2. Final Model
3.3. Interactions with Psychosocial, and Social Environmental Factors
4. Discussion
5. Conclusions
Author Contributions
Funding
Institutional Review Board Statement
Informed Consent Statement
Data Availability Statement
Acknowledgments
Conflicts of Interest
Appendix A

| Demographics | ExpB (95% CI) |
|---|---|
| Age | 1.00 (0.83–1.21) |
| Gender (ref: women) | 1.00 (0.97–1.01) |
| Living status (ref: living with a partner) | 0.74 (0.62–0.89) ** |
| Education (ref: tertiary) | 0.82 (0.64–1.05) |
| Vehicles (ref: motorized vehicle) | 1.04 (0.82–1.33) |
| Physical functioning | 1.20 (1.14–1.26) *** |
| Residential self-selection | 1.12 (0.91–1.39) |
| Objective environmental factors, buffer 500 m a | |
| Residential density 500 m | 1.56 (1.39–1.74) *** |
| Park density 500 m | 1.09 (0.97–1.24) |
| Public transport density 500 m | 1.16 (1.04–1.30) |
| Intersection density 500 m | 1.29 (1.13–1.47) *** |
| Entropy 500 m | 1.31 (1.12–1.55) ** |
| Psychosocial factors towards physical activity a | |
| Self-efficacy | 1.28 (0.93–1.77) |
| Perceived benefits | 1.12 (0.99–1.27) ^ |
| Perceived barriers | 0.88 (0.74–1.04) |
| Social support | 1.04 (0.96–1.12) |
| Social norm | 0.96 (0.89–1.04) |
| Modelling | 0.96 (0.89–1.04) |
| Social environmental factors a | |
| Talking to neighbors | 1.19 (1.08–1.32) ** |
| Social interaction to neighbors | 0.97 (0.90–1.05) |
| Social trust and cohesion | 1.05 (0.88–1.26) |
| Social diversity | 1.00 (0.77–1.31) |
| Residential Density | ExpB (95% CI) |
|---|---|
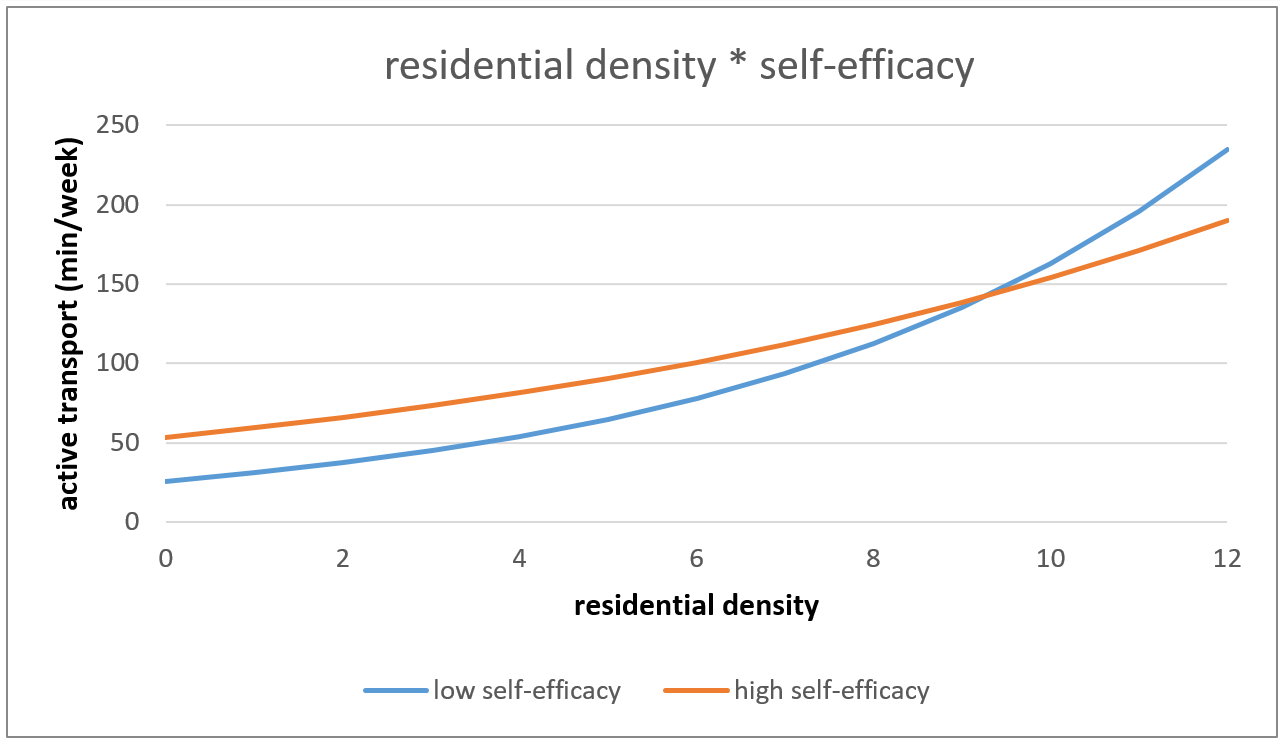
| Residential density * self-efficacy | 0.68 (0.52–0.87) ** |
| Residential density * perceived benefits | 0.98 (0.88–1.08) |
| Residential density * perceived barriers | 1.12 (0.92–1.37) |
| Residential density * social support | 0.92 (0.88–0.97) ** |
| Residential density * social norm | 1.04 (0.96–1.14) |
| Residential density * modeling | 0.93 (0.89–0.97) * |
| Residential density * social diversity | 0.89 (0.63–1.24) |
| Residential density * social trust and cohesion | 0.87 (0.77–0.99) * |
| Residential density * talking to neighbors | 1.04 (0.97–1.11) |
| Residential density * social interaction to neighbors | 0.97 (0.90–1.05) |
| Park Density | |
| Park density * self-efficacy | 1.09 (0.84–1.41) |
| Park density * perceived benefits | 1.05 (0.96–1.15) |
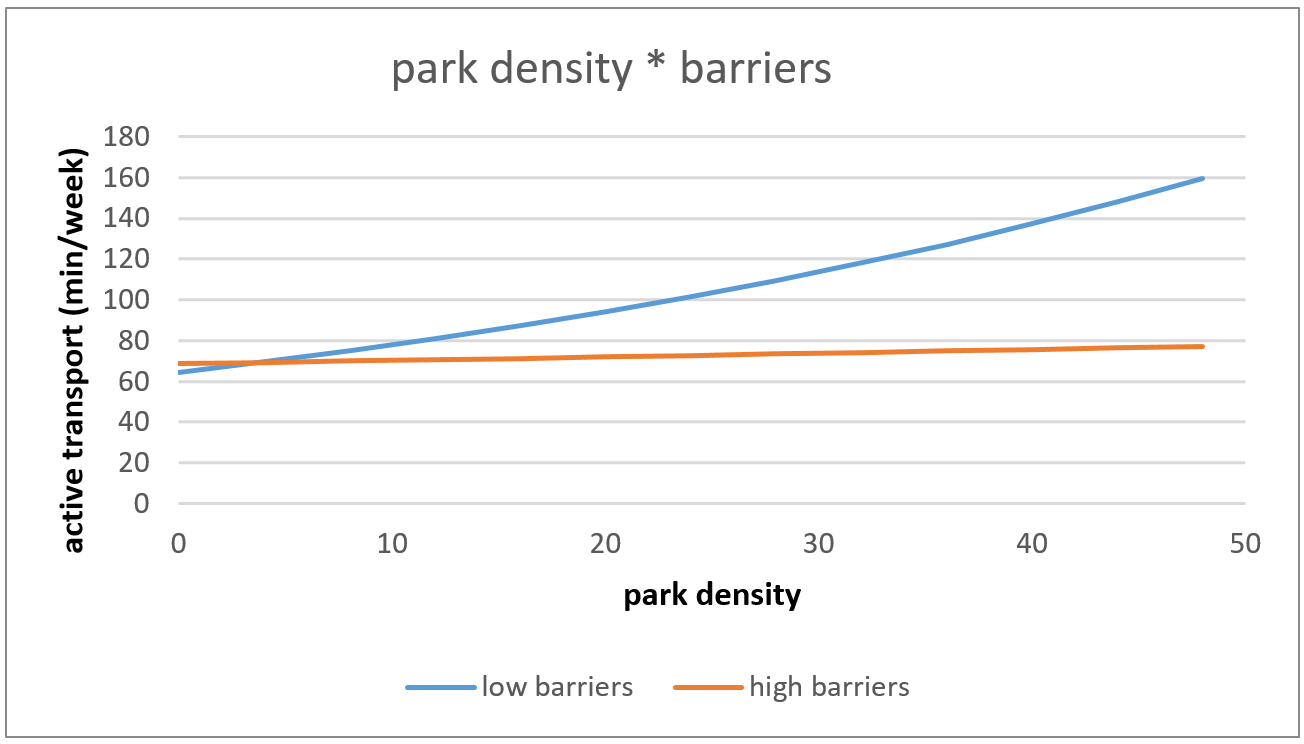
| Park density * perceived barriers | 0.83 (0.73–0.94) ** |
| Park density * social support | 0.97 (0.89–1.07) |
| Park density * social norm | 0.99 (0.94–1.04) |
| Park density * modeling | 0.97 (0.92–1.02) |
| Park density * social diversity | 0.97 (0.75–1.26) |
| Park density * social trust and cohesion | 1.05 (0.91–1.22) |
| Park density * talking to neighbors | 0.94 (0.85–1.04) |
| Park density * social interaction to neighbors | 1.04 (0.94–1.15) |
| Public Transport Density | |
| Public transport density * self-efficacy | 1.03 (0.80–1.31) |
| Public transport density * perceived benefits | 1.13 (1.02–1.24) * |
| Public transport density * perceived barriers | 0.98 (0.82–1.16) |
| Public transport density * social support | 1.03 (0.99–1.08) |
| Public transport density * social norm | 1.04 (0.98–1.10) |
| Public transport density * modeling | 1.04 (0.98–1.10) |
| Public transport density * social diversity | 0.94 (0.78–1.12) |
| Public transport density * social trust and cohesion | 1.10 (0.94–1.28) |
| Public transport density * talking to neighbors | 1.07 (0.99–1.16) ^ |
| Public transport density * social interaction to neighbors | 1.02 (0.94–1.11) |
| Intersection Density | |
| Intersection density * self-efficacy | 0.92 (0.69–1.21) |
| Intersection density * perceived benefits | 1.00 (0.91–1.10) |
| Intersection density * perceived barriers | 1.04 (0.87–1.24) |
| Intersection density * social support | 0.94 (0.89–0.99) * |
| Intersection density * social norm | 1.05 (0.96–1.14) |
| Intersection density * modeling | 0.97 (0.93–1.02) |
| Intersection density * social diversity | 0.91 (0.66–1.26) |
| Intersection density * social trust and cohesion | 0.93 (0.78–1.11) |
| Intersection density * talking to neighbors | 1.00 (0.91–1.10) |
| Intersection density * social interaction to neighbors | 0.99 (0.91–1.09) |
| Entropy | |
| Entropy * self-efficacy | 0.86 (0.61–1.22) |
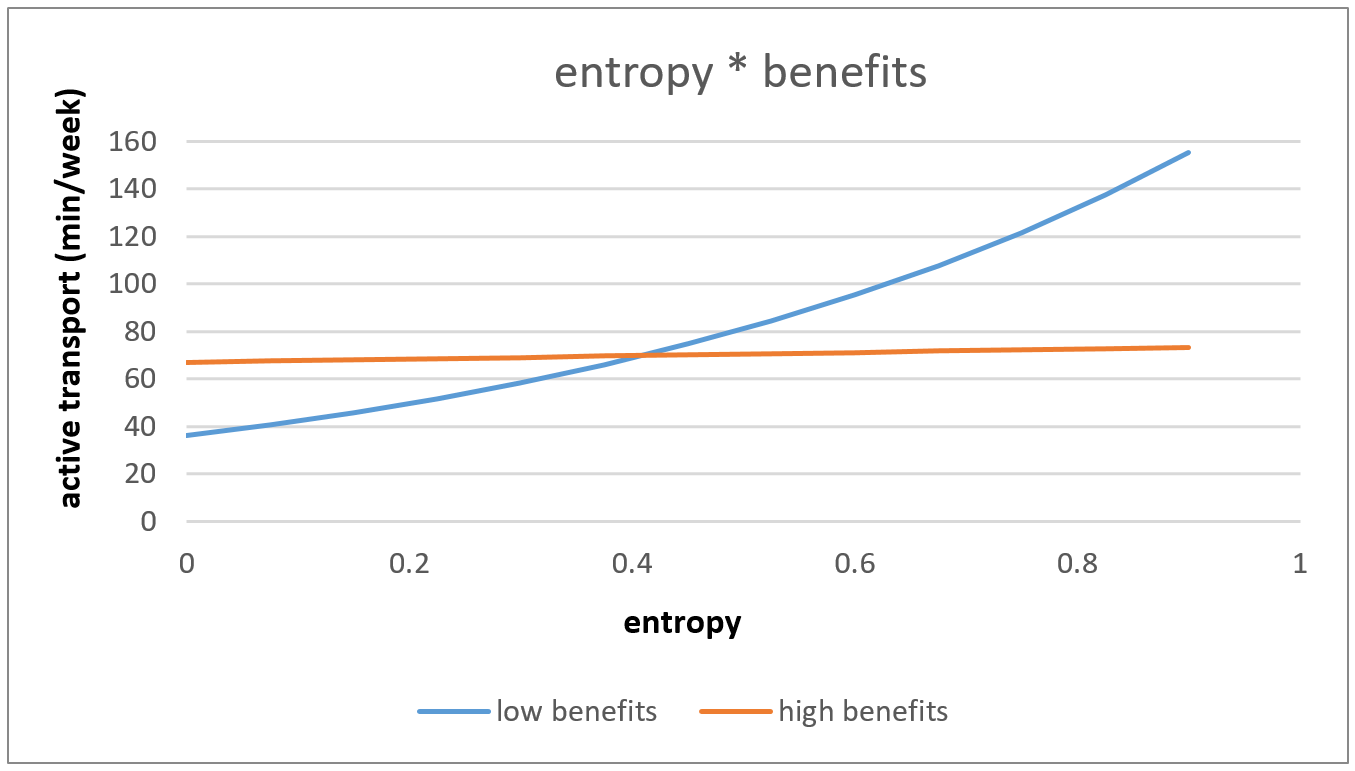
| Entropy * perceived benefits | 0.87 (0.76–1.00) * |
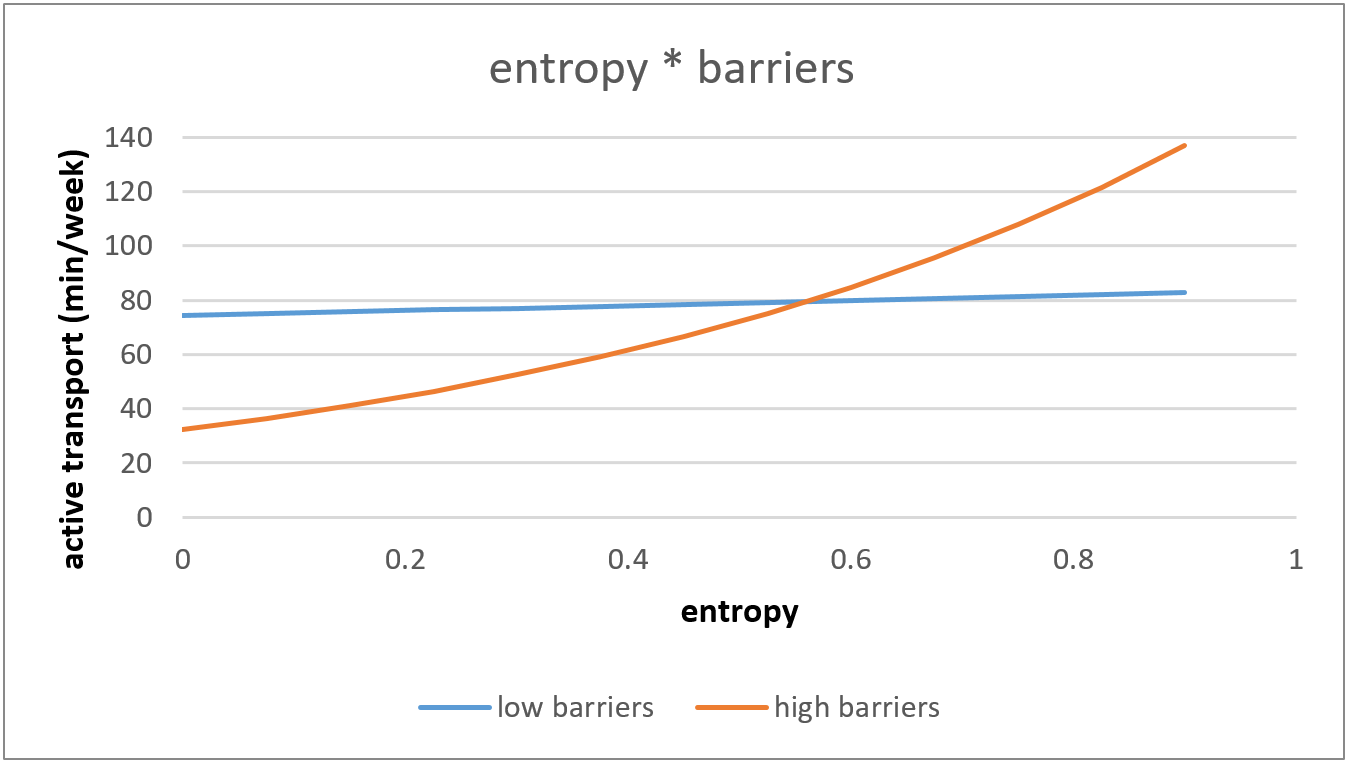
| Entropy * perceived barriers | 1.25 (1.00–1.54) * |
| Entropy * social support | 0.97 (0.87–1.08) |
| Entropy * social norm | 1.05 (0.92–1.19) |
| Entropy * modeling | 1.01 (0.92–1.10) |
| Entropy * social diversity | 1.04 (0.73–1.47) |
| Entropy * social trust and cohesion | 0.81 (0.69–0.95) * |
| Entropy * talking to neighbors | 0.95 (0.74–1.07) |
| Entropy * social interaction to neighbors | 0.93 (0.88–1.00) * |
References
- Van Acker Ragnar, V.O. Samen Sterk Voor Ouderen in Beweging: In de Vrije Tijd Inclusief Sport, Thuis, TIJDENS verplaatsingen en op Het (Vrijwillers) werk. Basisvisie, Werkkader en Inspiratie Voor Vlaamse Middenveldorganisaties Uit Verschillende Sectoren; Vlaams Instituut Gezond Leven en Vlaamse Ouderenraad: Brussel, Belgium, 2018. [Google Scholar]
- World Health Organization. Physical Activity Strategy for the WHO European Region 2016–2025; World Health Organization (WHO) Regional Office for Europe: Copenhagen, Denmark, 2015. [Google Scholar]
- US Department of Health and Human Services. 2008 Physical Activity Guidelines for Americans; US Department of Health and Human Services: Hyattsville, MD, USA, 2008. [Google Scholar]
- Ison, S.; Shaw, J. Cycling and Sustainability; Emerald Group Publishing: Bingley, West Yorkshire, UK, 2012. [Google Scholar]
- Rabl, A.; De Nazelle, A. Benefits of shift from car to active transport. Transp. Policy 2012, 19, 121–131. [Google Scholar] [CrossRef]
- De Fré, B.; De Martelaer, K.; Philippaerts, R.; Scheerder, J.; Lefevre, J. Sportparticipatie en fysieke (in) activiteit van de Vlaamse bevolking: Huidige situatie en seculaire trend (2003–2009). In Participatie in Vlaanderen 2 Eerste Analyse van de Participatiesurvey; Leuven, J.L.W., Ed.; Acco: The Hague, The Netherlands, 2009. [Google Scholar]
- Kelly, P.; Kahlmeier, S.; Götschi, T.; Orsini, N.; Richards, J.; Roberts, N.; Scarborough, P.; Foster, C. Systematic review and meta-analysis of reduction in all-cause mortality from walking and cycling and shape of dose response relationship. Int. J. Behav. Nutr. Phys. Act. 2014, 11, 1–15. [Google Scholar] [CrossRef]
- Coughlin, J.F. Beyond Health and Retirement: Placing Transportation on the Aging Policy Agenda. Public Policy Aging Rep. 2001, 11, 1–23. [Google Scholar] [CrossRef]
- Adler, G.; Rottunda, S. Older adults’ perspectives on driving cessation. J. Aging Stud. 2006, 20, 227–235. [Google Scholar] [CrossRef]
- Heesch, K.C.; Giles-Corti, B.; Turrell, G. Cycling for transport and recreation: Associations with socio-economic position, environmental perceptions, and psychological disposition. Prev. Med. 2014, 63, 29–35. [Google Scholar] [CrossRef]
- Van den Berg, P.; Arentze, T.; Timmermans, H. Estimating social travel demand of senior citizens in the Netherlands. J. Transp. Geogr. 2011, 19, 323–331. [Google Scholar] [CrossRef]
- Vlaamse overheid Departement Mobiliteit en Openbare Werken. Onderzoek Verplaatsingsgedrag Vlaanderen 4; Vlaamse Overheid, Departement Mobilitieit en Openbare Werken: Brussel, Belgium, 2014. [Google Scholar]
- Sallis, J.F.; Cervero, R.B.; Ascher, W.L.; Henderson, K.A.; Kraft, M.K.; Kerr, J. An ecological approach to creating active living communities. Annu. Rev. Public Health 2006, 27, 297–322. [Google Scholar] [CrossRef]
- Spence, J.C.; Lee, R.E. Toward a comprehensive model of physical activity. Psychol. Sport Exerc. 2003, 4, 7–24. [Google Scholar] [CrossRef]
- Cerin, E.; Nathan, A.; Van Cauwenberg, J.; Barnett, D.W.; Barnett, A. The neighbourhood physical environment and active travel in older adults: A systematic review and meta-analysis. Int. J. Behav. Nutr. Phys. Act. 2017, 14, 1–23. [Google Scholar] [CrossRef] [PubMed]
- Hoehner, C.M.; Ramirez, L.K.B.; Elliott, M.B.; Handy, S.L.; Brownson, R.C. Perceived and objective environmental measures and physical activity among urban adults. Am. J. Prev. Med. 2005, 28, 105–116. [Google Scholar] [CrossRef] [PubMed]
- Mertens, L.; Van Dyck, D.; Deforche, B.; De Bourdeaudhuij, I.; Brondeel, R.; Van Cauwenberg, J. Individual, social, and physical environmental factors related to changes in walking and cycling for transport among older adults: A longitudinal study. Health Place 2019, 55, 120–127. [Google Scholar] [CrossRef]
- Kosteli, M.-C.; Williams, S.E.; Cumming, J. Investigating the psychosocial determinants of physical activity in older adults: A qualitative approach. Psychol. Health 2016, 31, 730–749. [Google Scholar] [CrossRef] [PubMed]
- Van Cauwenberg, J.; Cerin, E.; Timperio, A.; Salmon, J.; Deforche, B.; Veitch, J. Park proximity, quality and recreational physical activity among mid-older aged adults: Moderating effects of individual factors and area of residence. Int. J. Behav. Nutr. Phys. Act. 2015, 12, 46. [Google Scholar] [CrossRef]
- Van Cauwenberg, J. Insights into the Complex Interplay between the Environment and Physical Activity Behaviours among Community-Dwelling Older Adults. Ph.D. Thesis, Ghent University, Ghent, Belgium, 2015. [Google Scholar]
- Van Cauwenberg, J.; Van Holle, V.; Simons, D.; DeRidder, R.; Clarys, P.; Goubert, L.; Nasar, J.; Salmon, J.; De Bourdeaudhuij, I.; Deforche, B. Environmental factors influencing older adults’ walking for transportation: A study using walk-along interviews. Int. J. Behav. Nutr. Phys. Act. 2012, 9, 85. [Google Scholar] [CrossRef]
- Van Cauwenberg, J.; Clarys, P.; De Bourdeaudhuij, I.; Ghekiere, A.; De Geus, B.; Owen, N.; Deforche, B. Environmental influences on older adults’ transportation cycling experiences: A study using bike-along interviews. Landsc. Urban Plan. 2018, 169, 37–46. [Google Scholar] [CrossRef]
- Van Holle, V.; Van Cauwenberg, J.; Van Dyck, D.; Deforche, B.; Van De Weghe, N.; De Bourdeaudhuij, I. Relationship between neighborhood walkability and older adults’ physical activity: Results from the Belgian Environmental Physical Activity Study in Seniors (BEPAS Seniors). Int. J. Behav. Nutr. Phys. Act. 2014, 11, 1–9. [Google Scholar] [CrossRef] [PubMed]
- Ware, J.; Sherbourne, C. A 36-item short form health survey (SF-36): Results from the Medical Outcomes Study. Med. Care 1992, 30, 473–483. [Google Scholar] [CrossRef] [PubMed]
- Frank, L.D.; Saelens, B.E.; Powell, K.E.; Chapman, J.E. Stepping towards causation: Do built environments or neighborhood and travel preferences explain physical activity, driving, and obesity? Soc. Sci. Med. 2007, 65, 1898–1914. [Google Scholar] [CrossRef]
- IPAQ. International Physical Activity Questionnaire. Long. last 7 days self-Adm. Format 71. 2002. Available online: www.ipaq.ki.se (accessed on 15 September 2010).
- Rzewnicki, R.; Auweele, Y.V.; De Bourdeaudhuij, I. Addressing overreporting on the International Physical Activity Questionnaire (IPAQ) telephone survey with a population sample. Public Health Nutr. 2003, 6, 299–305. [Google Scholar] [CrossRef]
- Van Holle, V.; De Bourdeaudhuij, I.; Deforche, B.; Van Cauwenberg, J.; Van Dyck, D. Assessment of physical activity in older Belgian adults: Validity and reliability of an adapted interview version of the long International Physical Activity Questionnaire (IPAQ-L). BMC Public Health 2015, 15, 1–14. [Google Scholar] [CrossRef]
- Van Holle, V.; Van Cauwenberg, J.; Deforche, B.; Van De Weghe, N.; De Bourdeaudhuij, I.; Van Dyck, D. Do psychosocial factors moderate the association between objective neighborhood walkability and older adults’ physical activity? Health Place 2015, 34, 118–125. [Google Scholar] [CrossRef]
- Van Dyck, D.; Cardon, G.; Deforche, B.; Giles-Corti, B.; Sallis, J.F.; Owen, N.; De Bourdeaudhuij, I. Environmental and Psychosocial Correlates of Accelerometer-Assessed and Self-Reported Physical Activity in Belgian Adults. Int. J. Behav. Med. 2011, 18, 235–245. [Google Scholar] [CrossRef] [PubMed]
- De Bourdeaudhuij, I.; Sallis, J. Relative Contribution of Psychosocial Variables to the Explanation of Physical Activity in Three Population-Based Adult Samples. Prev. Med. 2002, 34, 279–288. [Google Scholar] [CrossRef]
- Lochner, K.; Kawachi, I.; Kennedy, B.P. Social capital: A guide to its measurement. Health Place 1999, 5, 259–270. [Google Scholar] [CrossRef]
- Unger, D.G.; Wandersman, A. The importance of neighbors: The social, cognitive, and affective components of neighboring. Am. J. Community Psychol. 1985, 13, 139–169. [Google Scholar] [CrossRef]
- Sampson, R.J.; Raudenbush, S.W.; Earls, F. Neighborhoods and Violent Crime: A Multilevel Study of Collective Efficacy. Science 1997, 277, 918–924. [Google Scholar] [CrossRef]
- Van Cauwenberg, J.; De Donder, L.; Clarys, P.; De Bourdeaudhuij, I.; Buffel, T.; De Witte, N.; Dury, S.; Verté, D.; Deforche, B. Relationships between the perceived neighborhood social environment and walking for transportation among older adults. Soc. Sci. Med. 2014, 104, 23–30. [Google Scholar] [CrossRef]
- Van Holle, V.; Van Cauwenberg, J.; De Bourdeaudhuij, I.; Deforche, B.; Van De Weghe, N.; Van Dyck, D. Interactions between Neighborhood Social Environment and Walkability to Explain Belgian Older Adults’ Physical Activity and Sedentary Time. Int. J. Environ. Res. Public Health 2016, 13, 569. [Google Scholar] [CrossRef]
- Carlson, J.A.; Sallis, J.F.; Conway, T.L.; Saelens, B.E.; Frank, L.D.; Kerr, J.; Cain, K.L.; King, A.C. Interactions between psychosocial and built environment factors in explaining older adults’ physical activity. Prev. Med. 2012, 54, 68–73. [Google Scholar] [CrossRef]
- Gómez, L.F.; Parra, D.C.; Buchner, D.; Brownson, R.C.; Sarmiento, O.L.; Pinzón, J.D.; Ardila, M.; Moreno, J.; Serrato, M.; Lobelo, F. Built Environment Attributes and Walking Patterns Among the Elderly Population in Bogotá. Am. J. Prev. Med. 2010, 38, 592–599. [Google Scholar] [CrossRef] [PubMed]
- Dobesova, Z.; Krivka, T. Walkability Index in the Urban Planning: A Case Study in Olomouc City. In Advances in Spatial Planning; Burian, J., Ed.; IntechOpen: Rijeka, Croatia, 2012; pp. 179–197. [Google Scholar] [CrossRef]
- Frank, L.D.; Sallis, J.F.; Saelens, B.E.; Leary, L.; Cain, K.; Conway, T.L.; Hess, P.M. The development of a walkability index: Application to the Neighborhood Quality of Life Study. Br. J. Sports Med. 2010, 44, 924–933. [Google Scholar] [CrossRef]
- Rosenstock, I.M. Historical Origins of the Health Belief Model. Health Educ. Monogr. 1974, 2, 328–335. [Google Scholar] [CrossRef]
- Josey, M.J.; Moore, S. The influence of social networks and the built environment on physical inactivity: A longitudinal study of urban-dwelling adults. Health Place 2018, 54, 62–68. [Google Scholar] [CrossRef]
- Alves, S.; Aspinall, P.A.; Thompson, C.W.; Sugiyama, T.; Brice, R.; Vickers, A. Preferences of older people for environmental attributes of local parks. Facilities 2008, 26, 433–453. [Google Scholar] [CrossRef]
- Parra, D.C.; Gomez, L.F.; Fleischer, N.L.; Pinzon, J.D. Built environment characteristics and perceived active park use among older adults: Results from a multilevel study in Bogotá. Health Place 2010, 16, 1174–1181. [Google Scholar] [CrossRef] [PubMed]
- Van Holle, V.; McNaughton, S.A.; Teychenne, M.; Timperio, A.; Van Dyck, D.; De Bourdeaudhuij, I.; Salmon, J. Social and Physical Environmental Correlates of Adults’ Weekend Sitting Time and Moderating Effects of Retirement Status and Physical Health. Int. J. Environ. Res. Public Health 2014, 11, 9790–9810. [Google Scholar] [CrossRef]
- Baert, V.; Gorus, E.; Mets, T.; Geerts, C.; Bautmans, I. Motivators and barriers for physical activity in the oldest old: A systematic review. Ageing Res. Rev. 2011, 10, 464–474. [Google Scholar] [CrossRef]
- Bandura, A. Self-Efficacy: The Exercise of Control; W.H. Freeman: New York, NY, USA, 1997. [Google Scholar] [CrossRef]
- Michael, Y.L.; Green, M.K.; Farquhar, S.A. Neighborhood design and active aging. Health Place 2006, 12, 734–740. [Google Scholar] [CrossRef]
- Van Cauwenberg, J.; Clarys, P.; De Bourdeaudhuij, I.; Van Holle, V.; Verté, D.; De Witte, N.; De Donder, L.; Buffel, T.; Dury, S.; Deforche, B. Physical environmental factors related to walking and cycling in older adults: The Belgian aging studies. BMC Public Health 2012, 12, 142. [Google Scholar] [CrossRef] [PubMed]
- Nathan, A.; Pereira, G.; Foster, S.; Hooper, P.; Saarloos, D.; Giles-Corti, B. Access to commercial destinations within the neighbourhood and walking among Australian older adults. Int. J. Behav. Nutr. Phys. Act. 2012, 9, 133. [Google Scholar] [CrossRef]
- Cerin, E.; Lee, K.-Y.; Barnett, A.; Sit, C.H.P.; Cheung, M.-C.; Chan, W.-M.; Johnston, J.M. Walking for transportation in Hong Kong Chinese urban elders: A cross-sectional study on what destinations matter and when. Int. J. Behav. Nutr. Phys. Act. 2013, 10, 78. [Google Scholar] [CrossRef]
- Matthews, C.; Welk, G. Use of self-report instruments to assess physical activity. Phys. Act. Assess. Health Relat. Res. 2002, 107, 123. [Google Scholar]
- Van Dyck, D.; Cardon, G.; Deforche, B.; De Bourdeaudhuij, I. IPAQ interview version: Convergent validity with accelerome-ters and comparison of physical activity and sedentary time levels with the self-administered version. J. Sports Med. Phys. Fit. 2015, 55, 776–786. [Google Scholar]
- Bouter, L.M.; Zielhuis, G.; Zeegers, M.P. Textbook of Epidemiology, 1st ed.; Bohn Stafleu van Loghum: Houten, The Netherlands, 2018. [Google Scholar]
- Giles-Corti, B.; Timperio, A.; Bull, F.; Pikora, T. Understanding physical activity environmental correlates: Increased specific-ity for ecological models. Exerc. Sport Sci. Rev. 2005, 33, 175–181. [Google Scholar] [CrossRef]
- Dill, J.; Gliebe, J. Understanding and Measuring Bicycling Behavior: A Focus on Travel Time and Route Choice. Oregon Transportation Research and Education Consortium. 2008. Available online: https://pdxscholar.library.pdx.edu/usp_fac/28/ (accessed on 10 January 2021).
- Carlson, J.A.; Jankowska, M.M.; Meseck, K.; Godbole, S.; Natarajan, L.; Raab, F.; Demchak, B.; Patrick, K.; Kerr, J. Validity of PALMS GPS Scoring of Active and Passive Travel Compared with SenseCam. Med. Sci. Sports Exerc. 2015, 47, 662–667. [Google Scholar] [CrossRef]
- Huss, A.; Beekhuizen, J.; Kromhout, H.; Vermeulen, R. Using GPS-derived speed patterns for recognition of transport modes in adults. Int. J. Health Geogr. 2014, 13, 40. [Google Scholar] [CrossRef]
- Eellis, K.; Egodbole, S.; Emarshall, S.; Elanckriet, G.; Estaudenmayer, J.; Ekerr, J. Identifying Active Travel Behaviors in Challenging Environments Using GPS, Accelerometers, and Machine Learning Algorithms. Front. Public Health 2014, 2, 36. [Google Scholar] [CrossRef]


| Characteristics | Values |
|---|---|
| Age in years (M ± SD) | 74.4 ± 6.2 |
| Women (%) | 53.4 |
| Living with a partner (%) | 65.3 |
| Tertiary education (%) | 38.0 |
| Physical functioning (M ± SD) | 7.05 ± 2.37 |
| No motorized vehicles in the household (%) | 20.8 |
| Active transport (min/week) (M ± SD) | 121.8 ± 163.6 |
| No active transport (%) | 31.4 |
| Psychosocial factors towards physical activity (M ± SD) | |
| Self-efficacy a | 2.1 ± 0.5 |
| Perceived benefits b | 3.4 ± 0.8 |
| Perceived barriers b | 1.9 ± 0.7 |
| Social norm b | 2.9 ± 1.4 |
| Social support b | 2.8 ± 1.5 |
| Modeling c | 2.8 ± 1.9 |
| Social neighborhood environmental factors (M ± SD) | |
| Talking to neighbors c | 5.5 ± 1.4 |
| Social interactions with neighbors c | 2.2 ± 1.1 |
| Neighborhood social trust and cohesion d | 3.7 ± 0.8 |
| Neighborhood social diversity b | 4.2 ± 0.7 |
| Objective neighborhood environmental factors, buffer 500 m (M ± SD) | |
| Residential density e | 4871.1 ± 3261.1 |
| Park density f | 10.9 ± 8.6 |
| Public transport density g | 33.3 ± 19.7 |
| Intersection density h | 162.7 ± 70.0 |
| Entropy i | 0.5 ± 0.2 |
| Factors | ExpB (95% CI) |
|---|---|
| Living status (ref: living with a partner) | 0.97 (0.70–1.33) |
| Physical functioning | 1.18 (1.14–1.23) |
| Residential density | 2.63 (1.09–6.35) * |
| Park density | 1.35 (1.02–1.77) * |
| Public transport density | 0.31 (0.15–0.64) ** |
| Intersection density | 0.99 (0.72–1.36) |
| Entropy | 3.89 (0.80–18.86) ^ |
| Self-efficacy | 1.40 (1.06–1.84) * |
| Perceived benefits | 0.93 (0.84–1.04) |
| Perceived barriers | 0.92 (0.76–1.11) |
| Social support | 1.09 (1.00–1.19) * |
| Modeling | 0.96 (0.90–1.03) |
| Neighborhood social trust and cohesion | 1.15 (0.96–1.36) |
| Talking to neighbors | 1.20 (1.04–1.38) * |
| Social interaction to neighbors | 0.90 (0.81–1.00) * |
| Residential density * self-efficacy | 0.78 (0.60–1.02) ^ |
| Residential density * social support | 1.02 (0.90–1.16) |
| Residential density * modeling | 0.97 (0.91–1.03) |
| Residential density * social trust and cohesion | 1.02 (0.81–1.02) |
| Park density * perceived barriers | 0.90 (0.81–1.02) ^ |
| Public transport density * perceived benefits | 1.22 (1.07–1.38) ** |
| Public transport density * talking to neighbors | 1.08 (0.99–1.18) ^ |
| Intersection density * social support | 0.96 (0.87–1.06) |
| Entropy * perceived benefits | 0.83 (0.71–0.96) * |
| Entropy * perceived barriers | 1.25 (1.00–1.56) * |
| Entropy * neighborhood social trust and cohesion | 0.80 (0.56–1.10) |
| Entropy * social interactions to neighbors | 0.95 (0.87–1.03) |
Publisher’s Note: MDPI stays neutral with regard to jurisdictional claims in published maps and institutional affiliations. |
© 2021 by the authors. Licensee MDPI, Basel, Switzerland. This article is an open access article distributed under the terms and conditions of the Creative Commons Attribution (CC BY) license (http://creativecommons.org/licenses/by/4.0/).
Share and Cite
Nguyen, L.M.; Mertens, L. Psychosocial and Social Environmental Factors as Moderators in the Relation between the Objective Environment and Older Adults’ Active Transport. Int. J. Environ. Res. Public Health 2021, 18, 2647. https://doi.org/10.3390/ijerph18052647
Nguyen LM, Mertens L. Psychosocial and Social Environmental Factors as Moderators in the Relation between the Objective Environment and Older Adults’ Active Transport. International Journal of Environmental Research and Public Health. 2021; 18(5):2647. https://doi.org/10.3390/ijerph18052647
Chicago/Turabian StyleNguyen, Linda M., and Lieze Mertens. 2021. "Psychosocial and Social Environmental Factors as Moderators in the Relation between the Objective Environment and Older Adults’ Active Transport" International Journal of Environmental Research and Public Health 18, no. 5: 2647. https://doi.org/10.3390/ijerph18052647
APA StyleNguyen, L. M., & Mertens, L. (2021). Psychosocial and Social Environmental Factors as Moderators in the Relation between the Objective Environment and Older Adults’ Active Transport. International Journal of Environmental Research and Public Health, 18(5), 2647. https://doi.org/10.3390/ijerph18052647