
Measuring Online Teaching Service Quality in Higher Education in the COVID-19 Environment

 ,
,  ,
, 
Abstract
1. Introduction
2. Materials and Methods
2.1. Data
2.2. Instrument and Variables
2.3. Statistical Analysis
3. Results
4. Discussion
5. Conclusions
Author Contributions
Funding
Institutional Review Board Statement
Informed Consent Statement
Data Availability Statement
Acknowledgments
Conflicts of Interest
References
- Rodrigues, H.; Almeida, F.; Figueiredo, V.; Lopes, S.L. Tracking e-learning through published papers: A systematic review. Comput. Educ. 2019, 136, 87–98. [Google Scholar] [CrossRef]
- Arkorful, V.; Abaidoo, N. The Role of e-Learning, the Advantages and Disadvantages of Its Adoption in Higher Education. Int. J. Educ. Res. 2014, 2, 397–410. [Google Scholar]
- Ehlers, U.D.; Hilera, J.R. Special Issue on Quality in E-Learning. J. Comput. Assist. Learn. 2012, 28, 1–3. [Google Scholar] [CrossRef]
- UNESCO. Impacto del Covid-19 en la Educación. 2020. Available online: https://es.unesco.org/covid19/educationresponse (accessed on 12 December 2020).
- Hodges, C.; Moore, S.; Lockee, B.; Trust, T.; Bond, A. The difference between emergency remote teaching and online learning. Educ. Rev. 2020, 27, 12. Available online: https://bit.ly/3b0Nzx7 (accessed on 22 July 2020).
- Fernández, M. Una Pandemia Imprevisible ha Traído la Brecha Previsible. 2020. Available online: https://bit.ly/2VT3kzU (accessed on 7 September 2020).
- Yusuf, B.N. Are we prepared enough? A case study of challenges in online learning in a private higher learning institution during the Covid-19 outbreaks. Adv. Soc. Sci. Res. J. 2020, 7, 205–212. [Google Scholar] [CrossRef]
- Vlachopoulos, D. COVID-19: Threat or opportunity for online education? High. Learn. Res. Commun. 2020, 10, 2. [Google Scholar]
- Cole, M.T.; Shelley, D.J.; Swartz, L.B. Online instruction, e-learning, and student satisfaction: A three years study. Int. Rev. Res. Open Distance Learn. 2014, 15, 111–131. [Google Scholar] [CrossRef]
- Dick, G.P.; Tarí, J.J. A Review of Quality Management Research in Higher Education Institutions; Kent Business School Working Paper Series, No, 274; University of Kent: Kent, UK, 2013. [Google Scholar]
- Noaman, A.Y.; Ragab, A.H.M.; Madbouly, A.I.; Khedra, A.M.; Fayoumi, A.G. Higher education quality assessment model: Towards achieving educational quality standard. Stud. High. Educ. 2017, 42, 23–46. [Google Scholar] [CrossRef]
- Goos, M.; Salomons, A. Measuring teaching quality in higher education: Assessing selection bias in course evaluations. Res. High. Educ. 2017, 58, 341–364. [Google Scholar] [CrossRef]
- Shauchenka, H.V.; Bleimann, U. Methodology and Measurement System for Higher Education Service Quality Estimation. In Proceedings of the Conference on Education Technologies and Education, Interlaken, Switzerland, 7–9 July 2014; pp. 21–28. [Google Scholar]
- Edler, F.H.W. How Accreditation Agencies in Higher Education are Pushing Total Quality Management: A Faculty Review of the Academic Quality Improvement Program (AQIP). Unpublished Paper. Available online: http://commhum.mccneb.edu/PHILOS/AQIP.htm.2003 (accessed on 19 February 2019).
- Sunder, V.M. Constructs of quality in higher education services. Int. J. Product. Perform. Manag. 2016, 65, 1091–1111. [Google Scholar] [CrossRef]
- Sultan, P.; Wong, H.Y. Antecedents and consequences of service quality in a higher education context: A qualitative research approach. Qual. Assur. Educ. 2013, 21, 70–95. [Google Scholar] [CrossRef]
- Kuh, G.D.; Hu, S. The effects of student-faculty interaction in the 1990s. Rev. High. Educ. 2001, 24, 309–321. [Google Scholar] [CrossRef]
- Elliott, K.M.; Healy, M.A. Key factors influencing student satisfaction related to recruitment retention. J. Mark. High. Educ. 2001, 10, 1–11. [Google Scholar] [CrossRef]
- Barnett, R. The marketised university: Defending the indefensible. In the Marketisation of Higher Education and the Student as Consumer; Molesworth, M., Scullion, R., Nixon, E., Eds.; Routledge: London, UK, 2011; pp. 39–52. [Google Scholar]
- Alves, H.; Raposo, M. The influence of university image on students’ behaviour. Int. J. Educ. Manag. 2010, 24, 73–85. [Google Scholar] [CrossRef]
- Yildiz, S.M.; Kara, A. Developing alternative measures for service quality in higher education: Empirical evidence from the school of physical education and sports sciences. In Proceedings of the 2009 Academy of Marketing Science (AMS) annual conference, Baltimore, MD, USA, 20–23 May 2009; Springer International: Baltimore, MD, USA, 2015; p. 185. [Google Scholar]
- Srikanthan, G.; Dalrymple, J.F. A conceptual overview of a holistic model for quality in higher education. Int. J. Educ. Manag. 2007, 21, 173–193. [Google Scholar] [CrossRef]
- Telford, R.; Masson, R. The congruence of quality values in higher education. Qual. Assur. Educ. 2005, 13, 107–119. [Google Scholar] [CrossRef]
- Kwek, L.C.; Lau, T.C.; Tan, H.P. Education quality process model and its influence on students’ perceived service quality. Int. J. Bus. Manag. 2010, 5, 154–165. [Google Scholar]
- Chong, Y.S.; Ahmed, P.K. An empirical investigation of students’ motivational impact upon university service quality perception: A self- determination perspective. Qual. High. Educ. 2012, 18, 37–41. [Google Scholar] [CrossRef]
- Thomas, M.S.; Rogers, C. Education, the science of learning, and the COVID-19 crisis. Prospects 2020, 49, 87–90. [Google Scholar] [CrossRef]
- Martilla, J.; James, J. The need for implementing total quality management in education. Int. J. Educ. Manag. 1977, 11, 131–135. [Google Scholar]
- Picón, E.; Varela, J.; Braña, T. La representación de los datos mediante el Análisis de Importancia-Valoración. Metodol. Encuestas 2011, 13, 121–142. [Google Scholar]
- Allen, J.; Bellizzi, M.G.; Eboli, L.; Forciniti, C.; Mazzulla, G. Latent factor son the assessment of service quality in an Italian peripheral airport. Transp. Res. Procedia 2020, 47, 91–98. [Google Scholar] [CrossRef]
- Marks, R.B.; Sibley, S.D.; Arbaugh, J.B. A structural equation model of predictor for effective online learning. J. Manag. Educ. 2005, 29, 531–563. [Google Scholar] [CrossRef]
- Chiu, C.-M.; Wang, E.T.G. Understanding web-based learning continuance intention: The role of subjective task value. Inf. Manag. 2008, 45, 194–201. [Google Scholar] [CrossRef]
- DeLone, W.H.; McLean, E.R. The DeLone and McLean model of information systems success: A ten years update. J. Manag. Inf. Syst. 2003, 19, 9–30. [Google Scholar] [CrossRef]
- Hassanzadeh, A.; Kanaani, F.; Elahi, S. A model for measuring e-learning systems success in universities. Expert Syst. Appl. 2012, 39, 10959–10966. [Google Scholar] [CrossRef]
- Abdalla, I. Evaluating effectiveness of e-blackboard system using TAM framework: A structural analysis approach. AACE J. 2007, 3, 279–287. [Google Scholar]
- Tarhini, A.; Masa’deh, R.; Al-Busaidi, K.A.; Mohammed, A.B.; Maqableh, M. Factors influencing students’ adoption of e-learning: A structural equation modeling approach. J. Int. Educ. Bus. 2017, 10, 164–182. [Google Scholar] [CrossRef]
- Wang, Y.S.; Liao, Y.W. Assessing e-Government systems success: A validation of the Delone and Mclean model of information systems success. Gov. Inf. Q. 2008, 25, 717–733. [Google Scholar] [CrossRef]
- Mohammadi, H. Investigating users’ perspectives on e-learning: An integration of TAM and IS success model. Comput. Hum. Behav. 2015, 45, 359–374. [Google Scholar] [CrossRef]
- Wang, W.T.; Wang, C.C. An empirical study of instructor adoption of webbased learning systems. Comput. Educ. 2009, 53, 761–774. [Google Scholar] [CrossRef]
- Liaw, S.S. Investigating students’ perceived satisfaction, behavioral intention, and effectiveness of e-learning: A case study of the Blackboard system. Comput. Educ. 2008, 51, 864–873. [Google Scholar] [CrossRef]
- Eom, B.S.; Wen, H.J.; Ashill, N. The Determinants of Students’ Perceived Learning Outcomes and Satisfaction in University Online Education: An Empirical Investigation. Decis. Sci. J. Innov. Educ. 2006, 4, 215–235. [Google Scholar] [CrossRef]
- Lee, M.C. Explaining and predicting users’ continuance intention toward elearning: An extension of the expectation-confirmation model. Comput. Educ. 2010, 54, 506–516. [Google Scholar] [CrossRef]
- Tzeng, H.-M.; Okpalauwaekwe, U.; Li, C.-Y. Older Adults’ Socio-Demographic Determinants of Health Related to Promoting Health and Getting Preventive Health Care in Southern United States: A Secondary Analysis of a Survey Project Dataset. Nurs. Rep. 2021, 11, 120–132. [Google Scholar] [CrossRef]
- Năsui, B.A.; Ungur, R.A.; Talaba, P.; Varlas, V.N.; Ciuciuc, N.; Silaghi, C.A.; Silaghi, H.; Opre, D.; Pop, A.L. Is Alcohol Consumption Related to Lifestyle Factors in Romanian University Students? Int. J. Environ. Res. Public Health 2021, 18, 1835. [Google Scholar] [CrossRef]
- Zhuo, L.; Wu, Q.; Le, H.; Li, H.; Zheng, L.; Ma, G.; Tao, H. COVID-19-Related Intolerance of Uncertainty and Mental Health among Back-To-School Students in Wuhan: The Moderation Effect of Social Support. Int. J. Environ. Res. Public Health 2021, 18, 981. [Google Scholar] [CrossRef]
- Garvey, A.M.; García, I.J.; Otal Franco, S.H.; Fernández, C.M. The Psychological Impact of Strict and Prolonged Confinement on Business Students during the COVID-19 Pandemic at a Spanish University. Int. J. Environ. Res. Public Health 2021, 18, 1710. [Google Scholar] [CrossRef] [PubMed]
- Peterson, R.A.; Merunka, D.R. Convenience samples of college students and research reproducibility. J. Bus. Res. 2014, 67, 1035–1041. [Google Scholar] [CrossRef]
- Ho, C.L.; Dzeng, R.J. Construction safety training via e-learning: Learning effectiveness and user satisfaction. Comput. Educ. 2010, 55, 858–867. [Google Scholar] [CrossRef]
- Thurmond, V.A.; Wambach, K.; Connors, H.R.; Frey, B.B. Evaluation of Student Satisfaction: Determining the Impact of a Web-Based Environment by Controlling for Student Characteristics. Am. J. Distance Educ. 2002, 16, 169–190. [Google Scholar] [CrossRef]
- Lévy, M.J.-P.; Martín, M.T.; Román, G.M.V. Optimización según estructuras de covarianzas. In Modelización Con Estructuras de Covarianzas en Ciencias Sociales; Lévy, J.-P., Varela, M.J., Eds.; Netbiblo: A Coruña, Spain, 2016; pp. 11–30. [Google Scholar]
- Bollen, K.A. Structural Equations with Latent Variables; John Wiley & Son: New York, NY, USA, 1989. [Google Scholar]
- Rindskopf, D.; Rose, T. Some theory and applications of confirmatory second-order factor analysis. Multivar. Behav. Res. 1988, 23, 51–67. [Google Scholar] [CrossRef] [PubMed]
- Fornell, C.; Larcker, D. Evaluating structural equation models with unobservable variables and measurement error. J. Mark. Res. 1981, 18, 30–50. [Google Scholar] [CrossRef]
- Hair, J.; Anderson, R.; Tatham, R.L.; Black, W.C. Multivariate Data Analysis; Prentice-Hall: Upper Saddle River, NJ, USA, 1998. [Google Scholar]
- Chau, P. Reexamining a model of evaluation information center success using a structural equation modeling approach. Decis. Sci. 1997, 28, 309–334. [Google Scholar] [CrossRef]
- Ábalo, J.; Varela, J.; Rial, A. El análisis de Importancia-Valoración aplicado a la gestión de servicios. Psicothema 2006, 18, 730–737. [Google Scholar]
- Nale, R.D.; Rauch, D.A.; Wathen, S.A.; Barr, P.B. An exploratory look at the use of importance-performance analysis as a curricular assessment tool in a school of business. J. Workplace Learn. 2000, 12, 139–145. [Google Scholar] [CrossRef]
- Sampson, S.E.; Showalter, M.J. The performance-importance response function: Observations and implications. Serv. Ind. J. 1999, 19, 1–26. [Google Scholar] [CrossRef]
- Ferri, F.; Grifoni, P.; Guzzo, T. Online learning and emergency remote teaching: Opportunities and challenges in emergency situations. Societies 2020, 10, 86. [Google Scholar] [CrossRef]
- Verawardina, U.; Asnur, L.; Lubis, A.L.; Hendriyani, Y.; Ramadhani, D.; Dewi, I.P.; Sriwahyuni, T. Reviewing online learning facing the Covid-19 outbreak. J. Talent Dev. Excell. 2020, 12, 385–392. [Google Scholar]
- Chiecher, A.C.; Donolo, D.S. Interacciones entre alumnos en aulas virtuales. Incidencia de distintos diseños instructivos. Pixel-Bit. Rev. Medios Educ. 2011, 39, 127–140. [Google Scholar]
- Adkins, J.; Kenkel, C.; Lim, C.L. Deterrents to online academic dishonesty. J. Learn. High. Educ. 2005, 1, 17–22. [Google Scholar]
- García-Peñalvo, F.J.; Corell, A.; Abella-García, V.; Grande, M. Online Assessment in Higher Education in the Time of COVID-19. Educ. Knowl. Soc. 2020, 21, 1–12. [Google Scholar] [CrossRef]
- Vázquez-Cano, E.; Fombona, J.; Fernández, A. Virtual Attendance: Analysis of an Audiovisual over IP System for Distance Learning in the Spanish Open University (UNED). Int. Rev. Res. Open Distance Learn. 2013, 14, 402–426. [Google Scholar] [CrossRef]
- Vázquez-Cano, E.; León Urrutia, M.; Parra-González, M.E.; López Meneses, E. Analysis of Interpersonal Competences in the Use of ICT in the Spanish University Context. Sustainability 2020, 12, 476. [Google Scholar] [CrossRef]
- Vázquez-Cano, E. Mobile Distance learning with Smartphones and Apps in Higher Education. Educ. Sci. Theory Pract. 2014, 14, 1–16. [Google Scholar] [CrossRef][Green Version]
- Sevillano, M.L.; Vázquez-Cano, E. The impact of digital mobile devices in Higher Education. Educ. Technol. Soc. 2015, 18, 106–118. [Google Scholar]


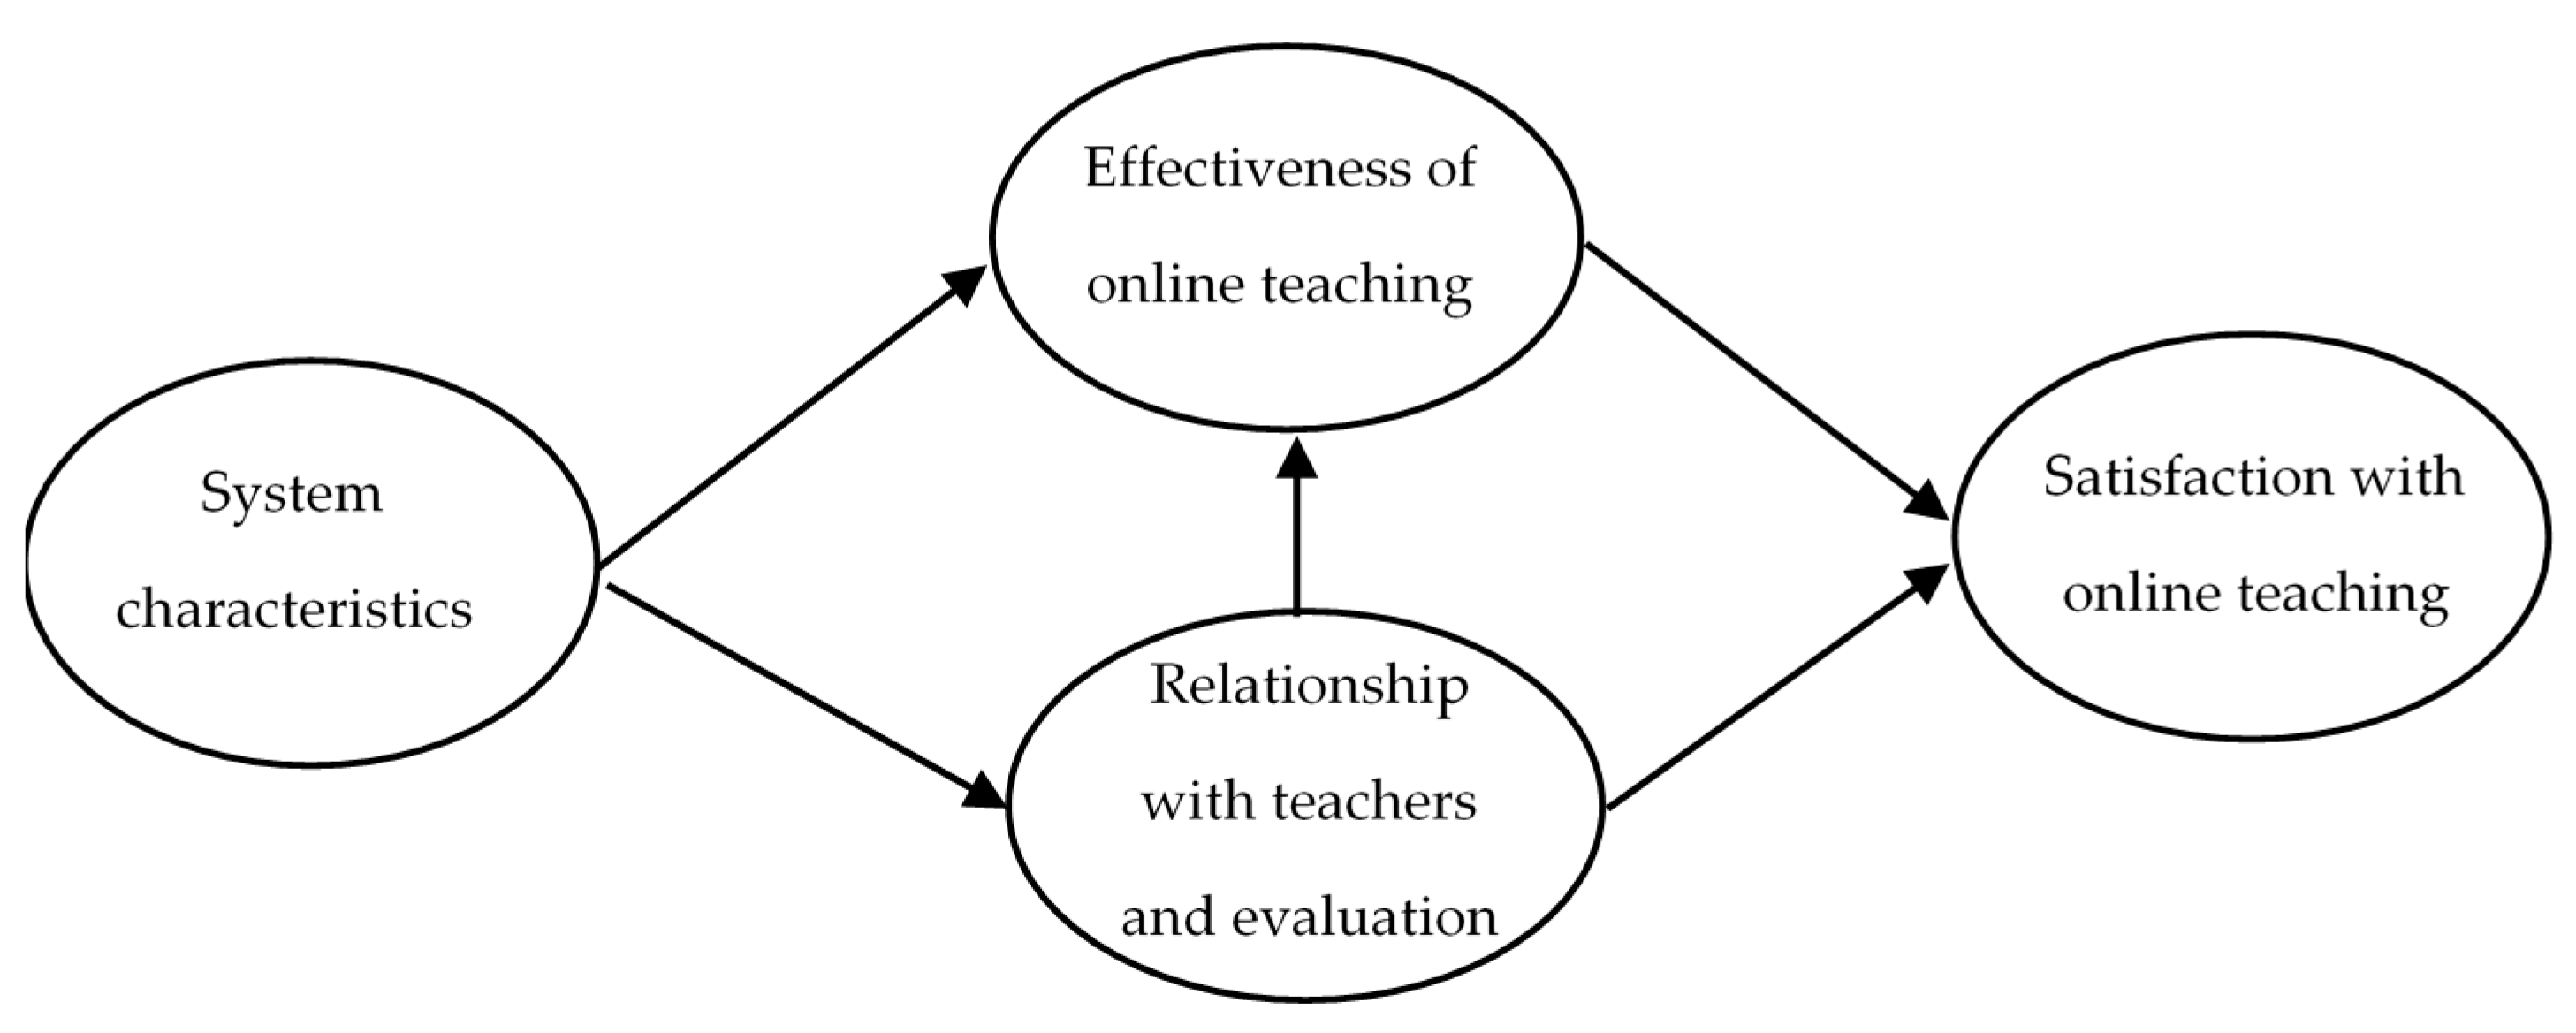
| Dimension | Variable | Attributes | |
|---|---|---|---|
| CAR | System characteristics | CAR1 | Usefulness [31,32,33] |
| CAR2 | Easy to use [32,34,35,36] | ||
| CAR3 | Technical support availability [37,38] | ||
| EFIC | Efficacy of online teaching | EFIC1 | Quick learning versus face-to-face teaching [32] |
| EFIC2 | Autonomy in online learning [31,32] | ||
| EFIC3 | Concentration in online classes [34,39] | ||
| EFIC4 | Interaction with other students [39,40,41] | ||
| PROF | The students’ relationships with their professors and the evaluation of the professors | PROF1 | Interaction with the professors [39,40,41] |
| PROF2 | Professors’ response time [32] | ||
| PROF3 | Diversity of assessment activities [47] | ||
| PROF4 | Online test review system [48] | ||
| SAT | Satisfaction with online teaching | SAT1 | I am satisfied with online teaching as a learning method [32,41] |
| SAT2 | I am satisfied with online teaching [32]. | ||
| SAT3 | Online teaching satisfies my learning needs [41]. |
| Gender | Men | Women | ||
| 37.9% | 62.1% | |||
| Year of undergraduate studies | First | Second | Third | Fourth |
| 34.1% | 26.4% | 20.9% | 18.6% | |
| Statistics | Mean | Standard Deviation | ||
| 21.34 years | 2.45 years | |||
| Factors | λ | Cronbach’s α | Composite Reliability (CR) | AVE | ||
|---|---|---|---|---|---|---|
| System characteristics | 0.896 | 0.897 | 0.744 | |||
| CAR1 | ← | CAR | 0.879 | |||
| CAR2 | ← | CAR | 0.896 | |||
| CAR3 | ← | CAR | 0.812 | |||
| Efficacy of online teaching | 0.851 | 0.853 | 0.596 | |||
| EFIC1 | ← | EFIC | 0.580 | |||
| EFIC2 | ← | EFIC | 0.801 | |||
| EFIC3 | ← | EFIC | 0.785 | |||
| EFIC4 | ← | EFIC | 0.890 | |||
| Teacher performance and assessment characteristics | 0.884 | 0.881 | 0.650 | |||
| PROF1 | ← | PROF | 0.757 | |||
| PROF2 | ← | PROF | 0.859 | |||
| PROF3 | ← | PROF | 0.807 | |||
| PROF4 | ← | PROF | 0.801 | |||
| Student satisfaction with online teaching | 0.952 | 0.952 | 0.868 | |||
| SAT1 | ← | SAT | 0.919 | |||
| SAT2 | ← | SAT | 0.925 | |||
| SAT3 | ← | SAT | 0.951 | |||
| CAR | EFIC | PROF | SAT | |
|---|---|---|---|---|
| CAR | 0.863 | |||
| EFIC | 0.768 | 0.772 | ||
| PROF | 0.793 | 0.808 | 0.807 | |
| SAT | 0.675 | 0.811 | 0.762 | 0.932 |
| Relation | Estimate | S.E. | C.R. | Standardized Estimate | p | ||
|---|---|---|---|---|---|---|---|
| PROF | ← | CAR | 0.617 | 0.040 | 15.465 | 0.793 | *** |
| EFIC | ← | CAR | 0.204 | 0.040 | 5.097 | 0.343 | *** |
| EFIC | ← | PROF | 0.409 | 0.060 | 6.873 | 0.536 | *** |
| SAT | ← | EFIC | 0.859 | 0.115 | 7.495 | 0.563 | *** |
| SAT | ← | PROF | 0.358 | 0.076 | 4.702 | 0.307 | *** |
| CAR1 | ← | CAR | 1.000 | 0.879 | |||
| CAR2 | ← | CAR | 1.024 | 0.039 | 25.985 | 0.896 | *** |
| CAR3 | ← | CAR | 0.886 | 0.040 | 22.139 | 0.812 | *** |
| EFIC1 | ← | EFIC | 1.000 | 0.580 | |||
| EFIC2 | ← | EFIC | 1.338 | 0.103 | 12.966 | 0.801 | *** |
| EFIC3 | ← | EFIC | 1.468 | 0.115 | 12.804 | 0.785 | *** |
| EFIC4 | ← | EFIC | 1.485 | 0.108 | 13.735 | 0.890 | *** |
| PROF1 | ← | PROF | 1.000 | 0.757 | |||
| PROF2 | ← | PROF | 1.135 | 0.059 | 19.192 | 0.859 | *** |
| PROF3 | ← | PROF | 1.135 | 0.063 | 17.925 | 0.807 | *** |
| PROF4 | ← | PROF | 1.074 | 0.060 | 17.840 | 0.801 | *** |
| SAT1 | ← | SAT | 1.000 | 0.919 | |||
| SAT2 | ← | SAT | 1.036 | 0.030 | 34.881 | 0.925 | *** |
| SAT3 | ← | SAT | 1.014 | 0.027 | 37.779 | 0.951 | *** |
| χ2 | df | RMSEA | NFI | NNFI | CFI | GFI | AGFI | PNFI |
|---|---|---|---|---|---|---|---|---|
| 335.886 * | 1.951 | 0.063 | 0.917 | 0.951 | 0.957 | 0.866 | 0.832 | 0.797 |
| Direct Effect | Indirect Effect | Total Effect | |
|---|---|---|---|
| CAR | 0.000 | 0.675 | 0.675 |
| EFIC | 0.563 | 0.000 | 0.563 |
| PROF | 0.307 | 0.302 | 0.609 |
| Attribute | Total Effect | Standarized Coefficients | Importance |
|---|---|---|---|
| Usefulness | 0.675 | 0.879 | 0.59 |
| Ease-of-use | 0.896 | 0.61 | |
| Support availability | 0.812 | 0.55 | |
| Learning speed in online vs. face-to-face teaching Online learning autonomy Levels of concentration in online learning Student interaction | 0.563 | 0.580 | 0.33 |
| 0.801 | 0.45 | ||
| 0.785 | 0.44 | ||
| 0.890 | 0.50 | ||
| Student interaction with teachers Teacher response times Diversity of assessment tests Online tests review system | 0.609 | 0.757 | 0.46 |
| 0.859 | 0.52 | ||
| 0.807 | 0.49 | ||
| 0.801 | 0.49 |
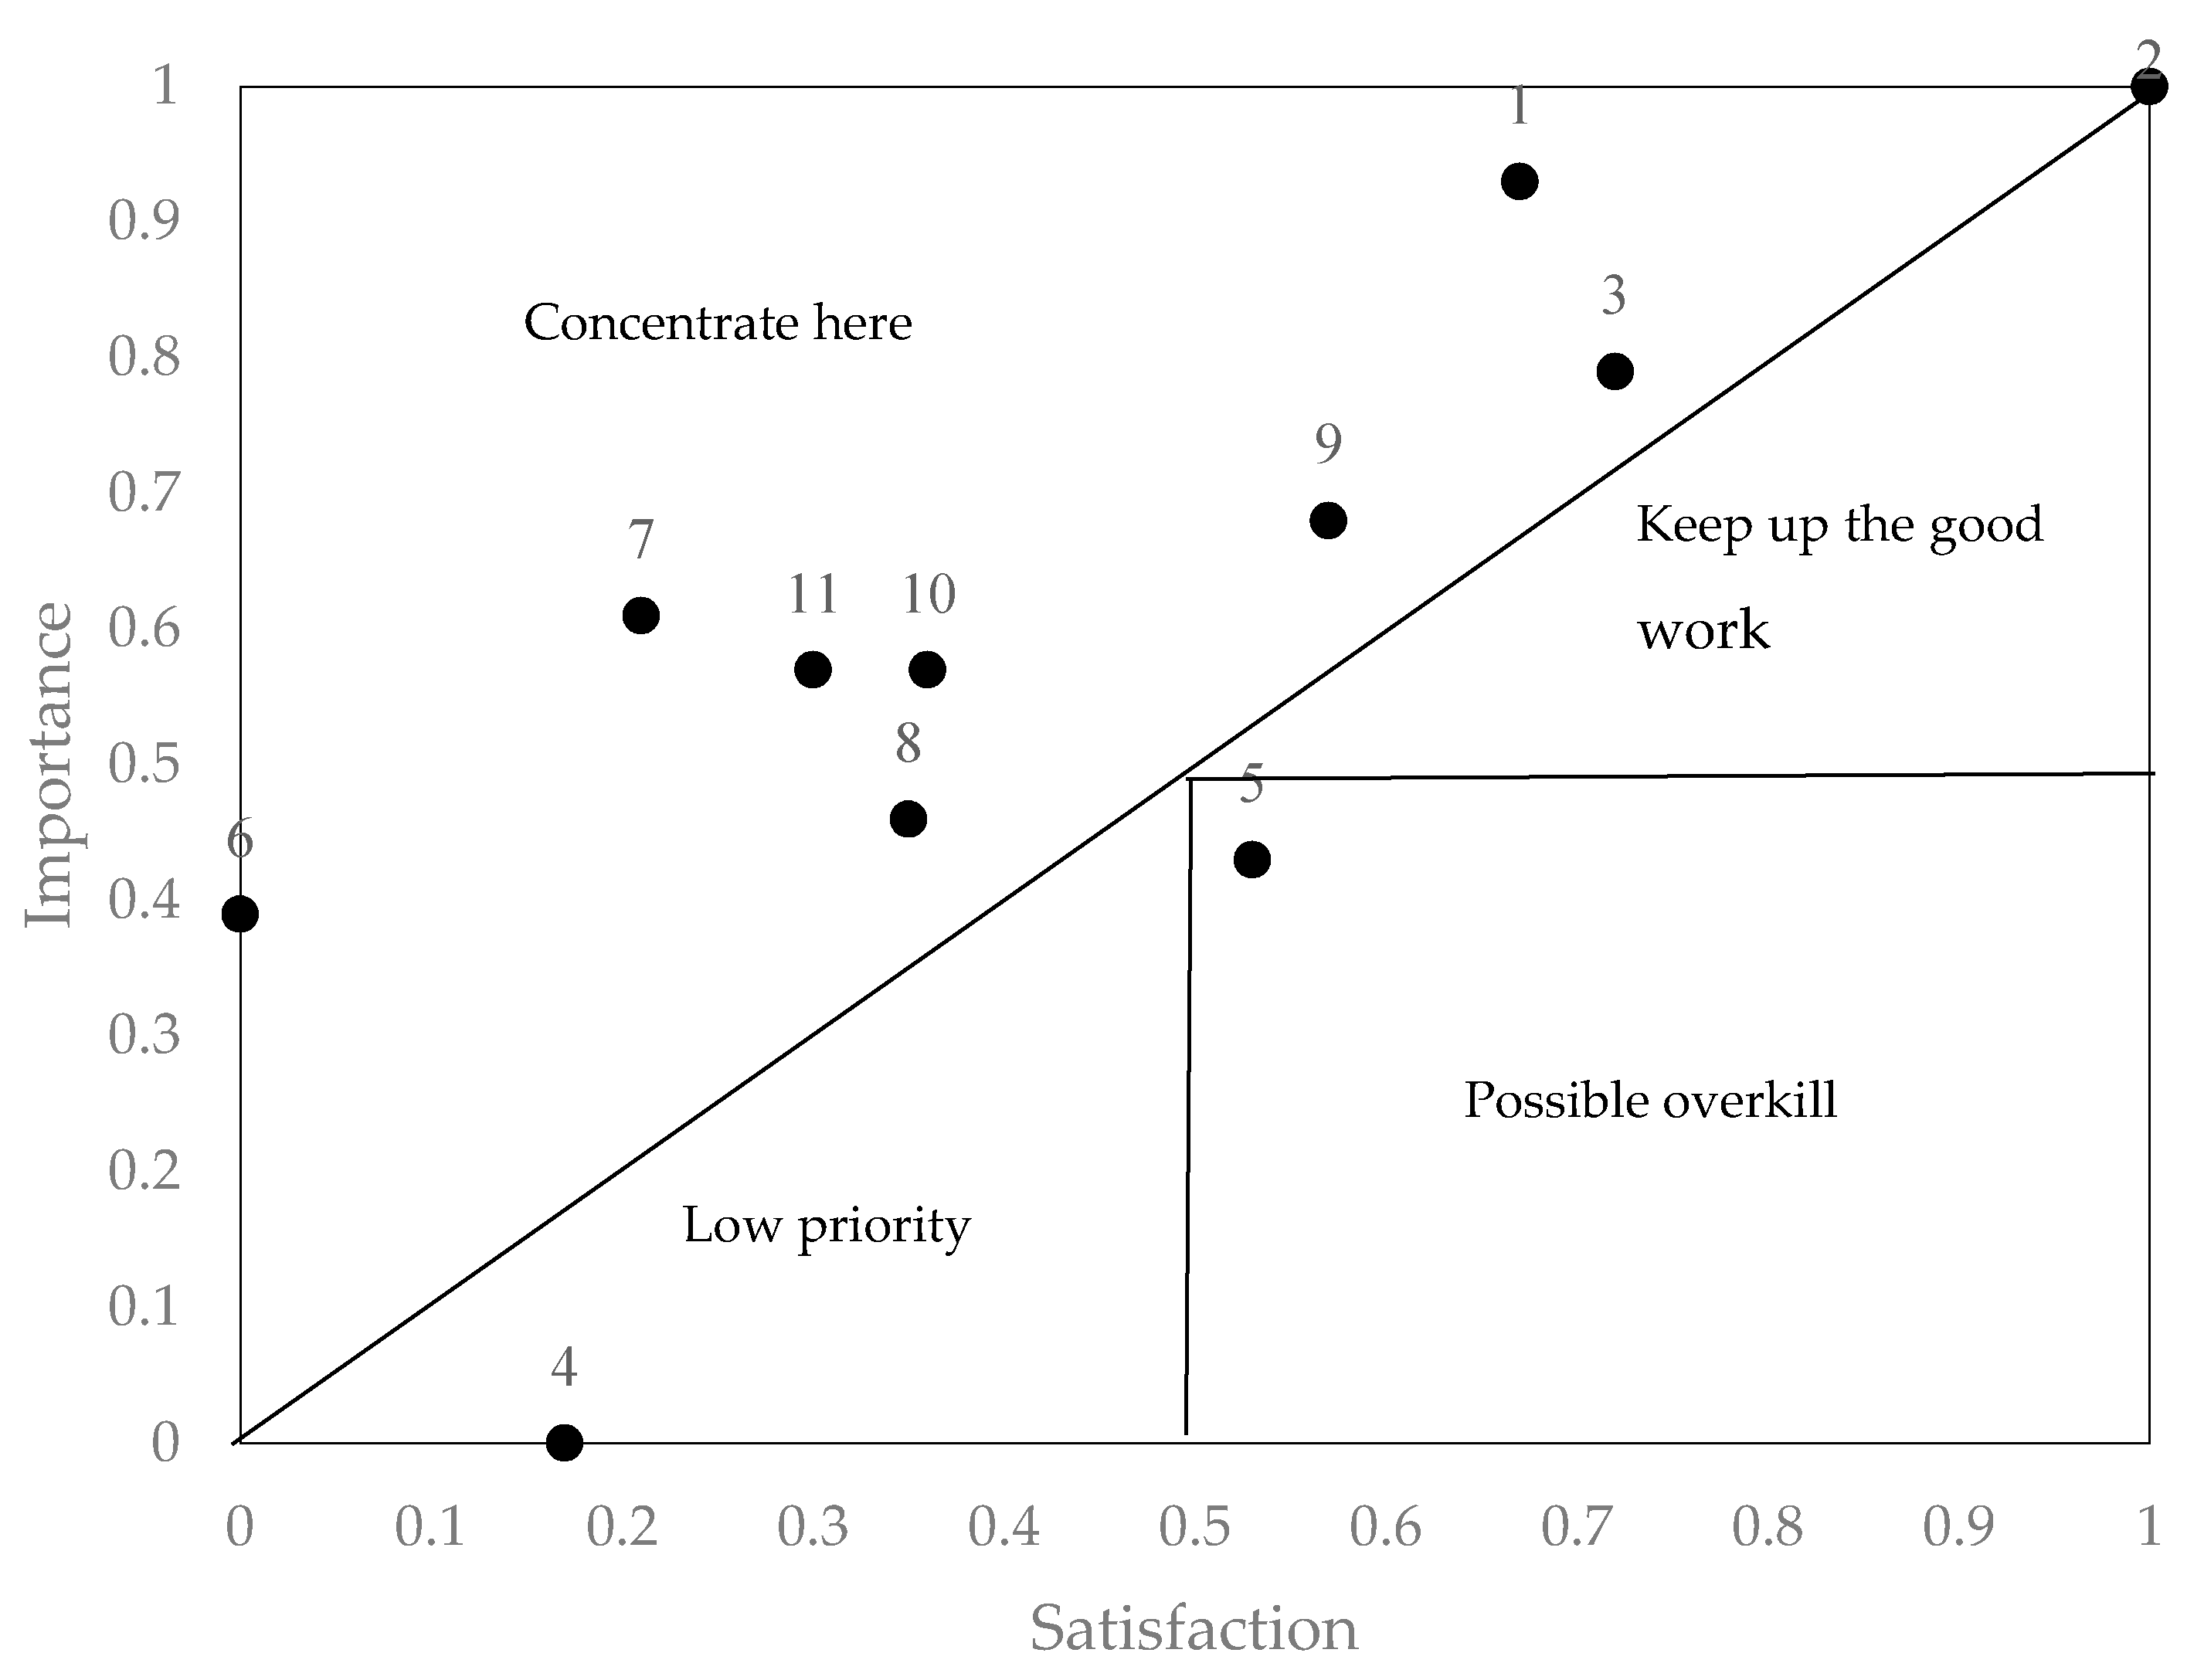
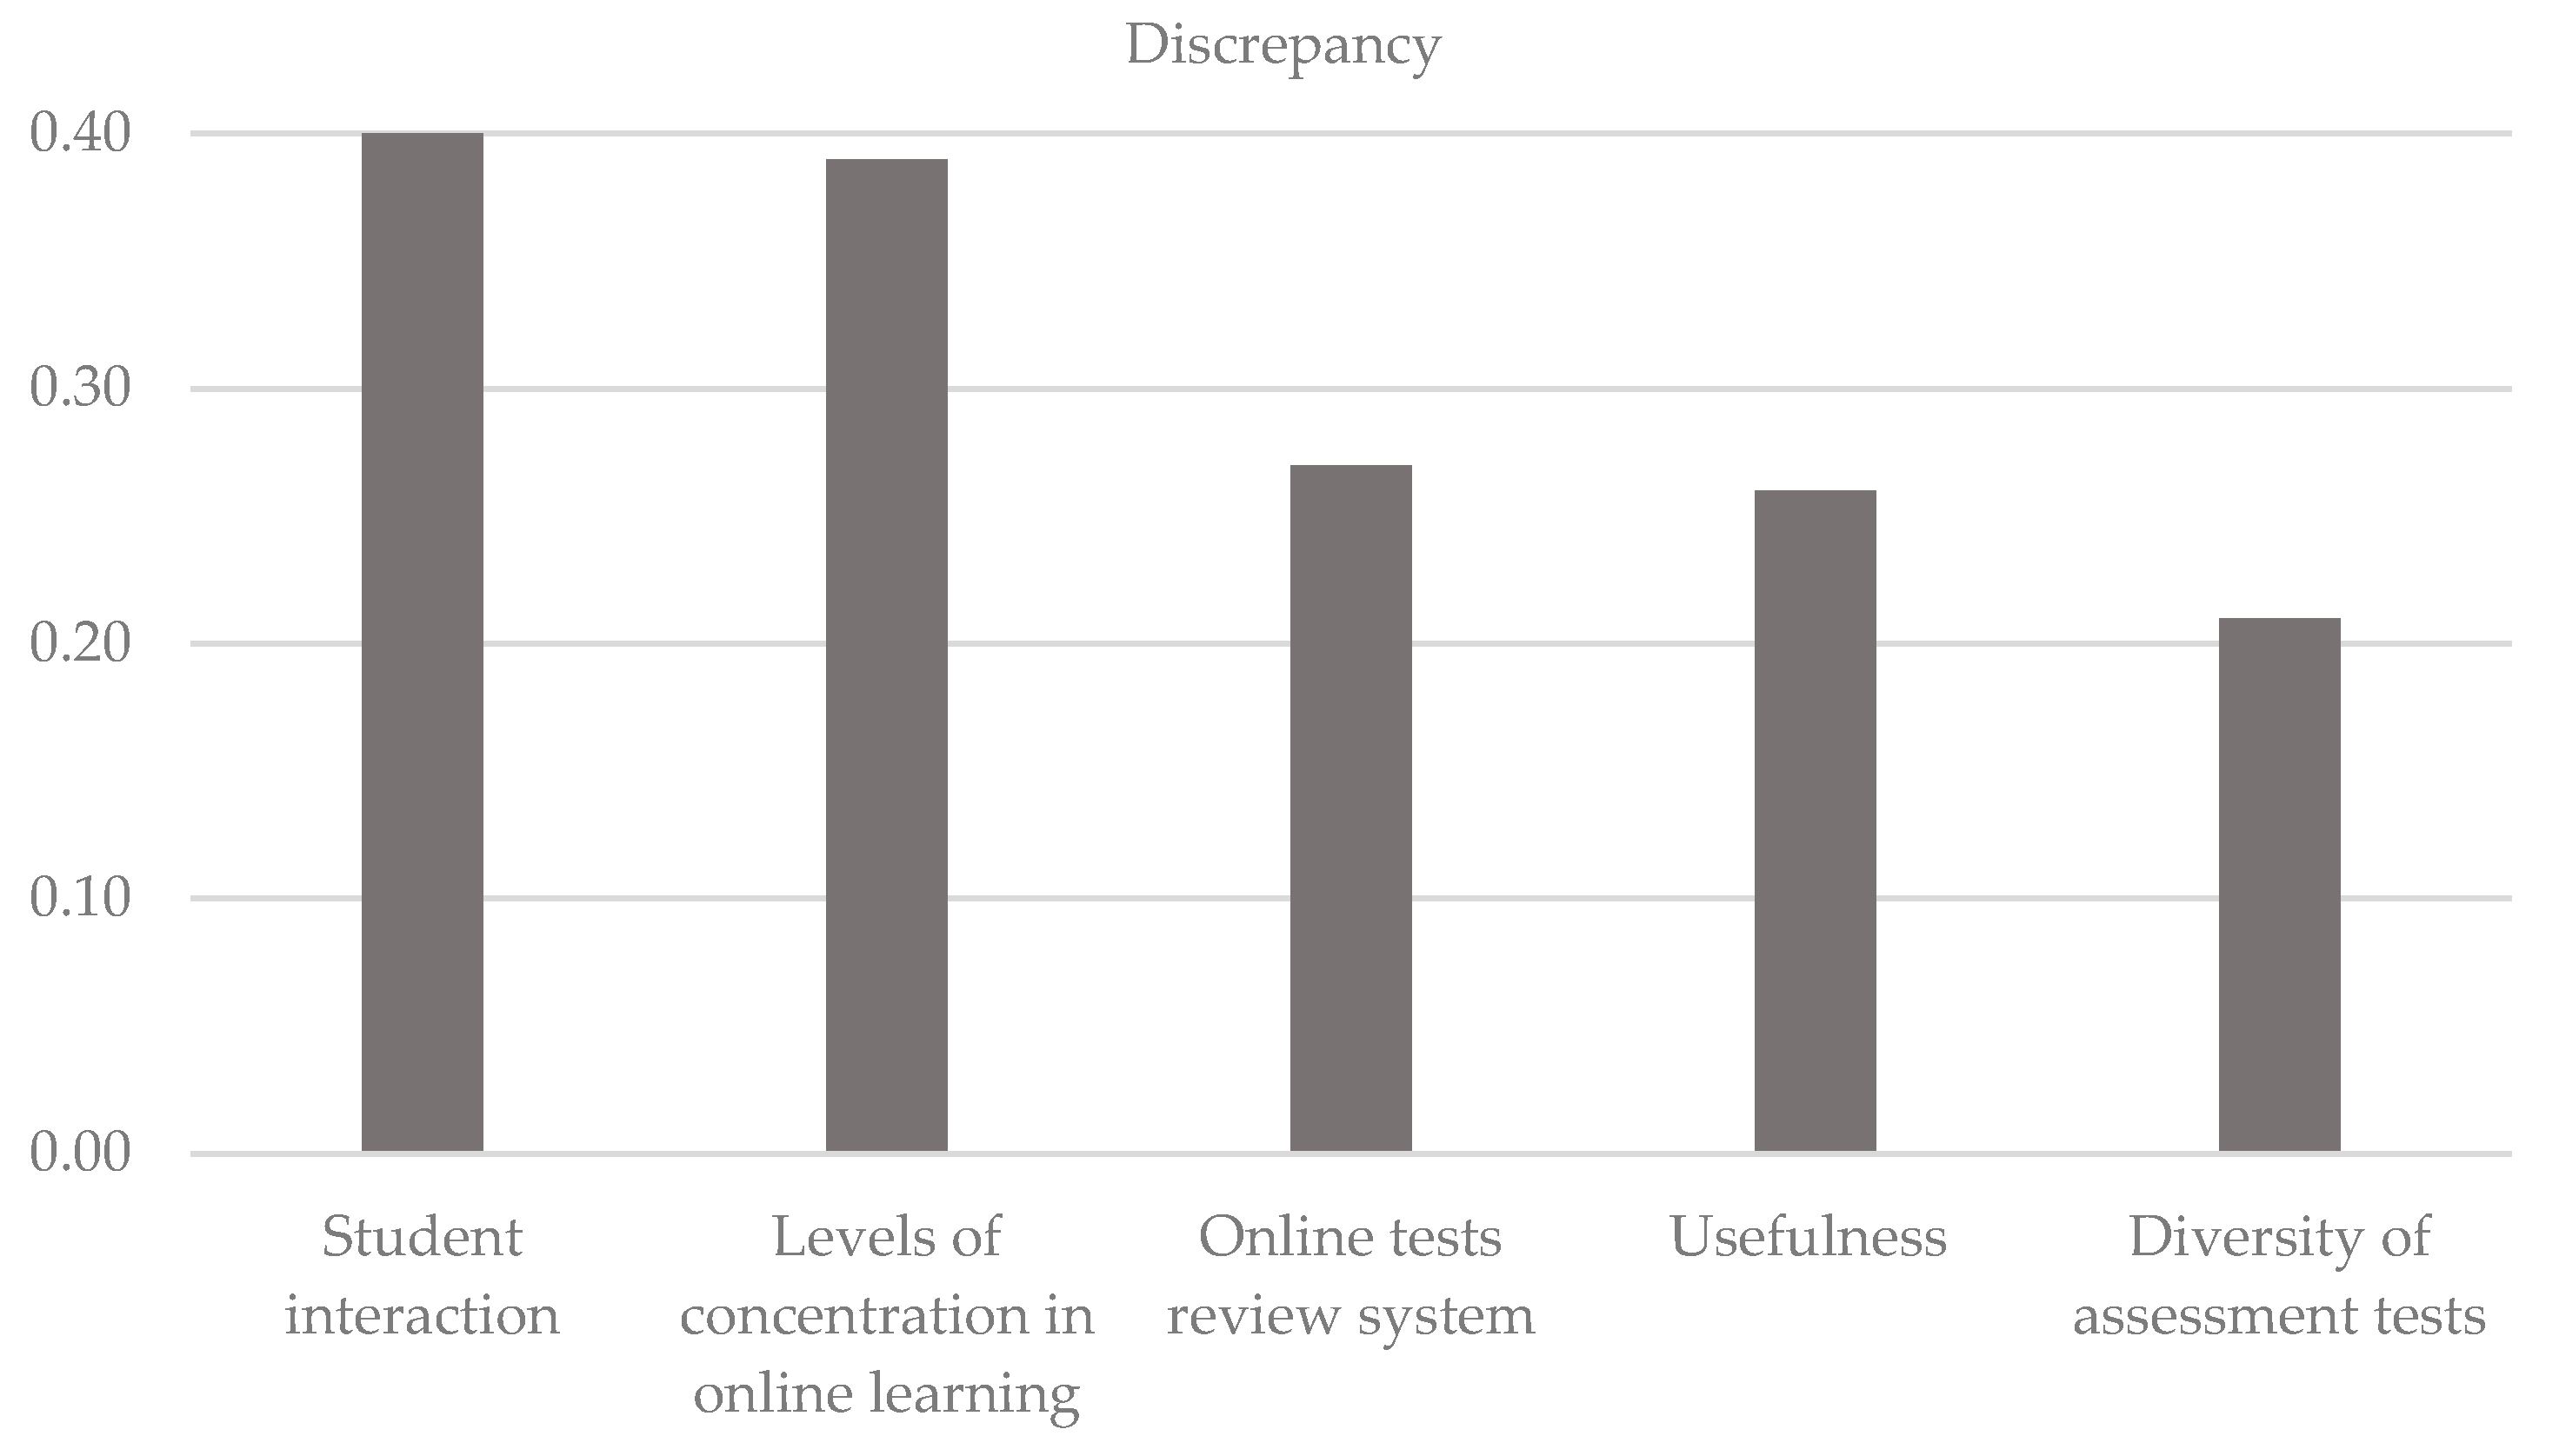
| # | Attribute | Importance | Satisfaction | Normalized Importance | Normalized Satisfaction | Discrepancies |
|---|---|---|---|---|---|---|
| 1 | Usefulness | 0.59 | 3.49 | 0.93 | 0.67 | 0.26 |
| 2 | Ease-of-use | 0.61 | 4.08 | 1.00 | 1.00 | 0.00 |
| 3 | Support availability | 0.55 | 3.59 | 0.79 | 0.72 | 0.07 |
| 4 | Learning speed in online vs. face-to-face teaching | 0.33 | 2.62 | 0.00 | 0.17 | -0.17 |
| 5 | Online learning autonomy | 0.45 | 3.26 | 0.43 | 0.53 | -0.10 |
| 6 | Levels of concentration in online learning | 0.44 | 2.32 | 0.39 | 0.00 | 0.39 |
| 7 | Student interaction | 0.50 | 2.69 | 0.61 | 0.21 | 0.40 |
| 8 | Student interaction with teachers | 0.46 | 2.93 | 0.46 | 0.35 | 0.11 |
| 9 | Teacher response times | 0.52 | 3.33 | 0.68 | 0.57 | 0.11 |
| 10 | Diversity of assessment tests | 0.49 | 2.96 | 0.57 | 0.36 | 0.21 |
| 11 | Online tests review system | 0.49 | 2.85 | 0.57 | 0.30 | 0.27 |
Publisher’s Note: MDPI stays neutral with regard to jurisdictional claims in published maps and institutional affiliations. |
© 2021 by the authors. Licensee MDPI, Basel, Switzerland. This article is an open access article distributed under the terms and conditions of the Creative Commons Attribution (CC BY) license (http://creativecommons.org/licenses/by/4.0/).
Share and Cite
Ramírez-Hurtado, J.M.; Hernández-Díaz, A.G.; López-Sánchez, A.D.; Pérez-León, V.E. Measuring Online Teaching Service Quality in Higher Education in the COVID-19 Environment. Int. J. Environ. Res. Public Health 2021, 18, 2403. https://doi.org/10.3390/ijerph18052403
Ramírez-Hurtado JM, Hernández-Díaz AG, López-Sánchez AD, Pérez-León VE. Measuring Online Teaching Service Quality in Higher Education in the COVID-19 Environment. International Journal of Environmental Research and Public Health. 2021; 18(5):2403. https://doi.org/10.3390/ijerph18052403
Chicago/Turabian StyleRamírez-Hurtado, José M., Alfredo G. Hernández-Díaz, Ana D. López-Sánchez, and Víctor E. Pérez-León. 2021. "Measuring Online Teaching Service Quality in Higher Education in the COVID-19 Environment" International Journal of Environmental Research and Public Health 18, no. 5: 2403. https://doi.org/10.3390/ijerph18052403
APA StyleRamírez-Hurtado, J. M., Hernández-Díaz, A. G., López-Sánchez, A. D., & Pérez-León, V. E. (2021). Measuring Online Teaching Service Quality in Higher Education in the COVID-19 Environment. International Journal of Environmental Research and Public Health, 18(5), 2403. https://doi.org/10.3390/ijerph18052403